this document was prepared in conjunction with work...
TRANSCRIPT


This document was prepared in conjunction with work accomplished under Contract No.DE-AC09-96SR18500 with the U. S. Department of Energy.
DISCLAIMER
This report was prepared as an account of work sponsored by an agency of the United StatesGovernment. Neither the United States Government nor any agency thereof, nor any of theiremployees, makes any warranty, express or implied, or assumes any legal liability or responsibilityfor the accuracy, completeness, or usefulness of any information, apparatus, product or processdisclosed, or represents that its use would not infringe privately owned rights. Reference herein toany specific commercial product, process or service by trade name, trademark, manufacturer, orotherwise does not necessarily constitute or imply its endorsement, recommendation, or favoring bythe United States Government or any agency thereof. The views and opinions of authors expressedherein do not necessarily state or reflect those of the United States Government or any agencythereof.
This report has been reproduced directly from the best available copy.
Available for sale to the public, in paper, from: U.S. Department of Commerce, National TechnicalInformation Service, 5285 Port Royal Road, Springfield, VA 22161,phone: (800) 553-6847,fax: (703) 605-6900email: [email protected] ordering: http://www.ntis.gov/help/index.asp
Available electronically at http://www.osti.gov/bridgeAvailable for a processing fee to U.S. Department of Energy and its contractors, in paper, from: U.S.Department of Energy, Office of Scientific and Technical Information, P.O. Box 62, Oak Ridge, TN37831-0062,phone: (865)576-8401,fax: (865)576-5728email: [email protected]


WSRC-TR-2002-00108, Rev. 0SRT-RPP-2002-00041, Rev. 0
Page ii
KEYWORDS:Hanford River Protection ProjectCrossflow FiltrationTank 241-AZ-101Envelope B, Envelope DSeparable Organics
Evaluating The Effects Of Tri-Butyl Phosphate And NormalParaffin Hydrocarbon In Simulated Low-Activity Waste SolutionOn Ultrafiltration
SAVANNAH RIVER TECHNOLOGY CENTER
J. R. ZamecnikM. A. Baich
April 25, 2002
Westinghouse Savannah River CompanySavannah River SiteAiken, SC 29808
Prepared for the U.S. Department of Energy under Contract No. DE-AC09-96SR18500


WSRC-TR-2002-00108, Rev. 0SRT-RPP-2002-00041, Rev. 0
Page iv
Table of Contents
1.0 Executive Summary................................................................................................................ 1
2.0 Background and Introduction ............................................................................................... 1
2.1 Objectives ....................................................................................................................................... 12.1.1 General Objectives................................................................................................................................ 12.1.2 Specific Objectives ............................................................................................................................... 2
2.2 Experimental System & Operation.............................................................................................. 22.2.1 Cross-flow Filter Conditioning ............................................................................................................. 3
2.3 Experimental Methods & Materials ............................................................................................ 4
2.4 Experimental Runs Matrix........................................................................................................... 7
3.0 Results and Discussion........................................................................................................... 9
3.1 Experimental Data......................................................................................................................... 93.1.1 Clean Water Flux .................................................................................................................................. 93.1.2 Experimental Runs .............................................................................................................................. 10
3.2 Simulant and Permeate Composition Versus Time ................................................................. 12
3.3 Organics in Slurry and Permeate .............................................................................................. 22
3.4 Statistical Analysis of Data ......................................................................................................... 24
3.5 Quality Assurance ....................................................................................................................... 27
4.0 Conclusions .......................................................................................................................... 27
5.0 Appendices ............................................................................................................................ 29
5.1 Appendix – Supernate Recipe .................................................................................................... 29
5.2 Appendix – Simulant Compositions .......................................................................................... 30
5.3 Appendix – Experimental Design............................................................................................... 40
5.4 Appendix – Experimental Results.............................................................................................. 42
5.5 Appendix – Curve Fits from JMP.............................................................................................. 66
6.0 References............................................................................................................................. 82

WSRC-TR-2002-00108, Rev. 0SRT-RPP-2002-00041, Rev. 0
Page v
List of Tables
Table 2.1 Amounts of Simulants and Chemicals Used ........................................................... 5
Table 2.2 Measured Initial Composition of Simulant from Supernate, Solids, &Trim Chemicals ..................................................................................................... 6
Table 3.1 Average Compositions of Slurry, Permeate, and Solids ...................................... 15
Table 3.2 Composition of Permeate........................................................................................ 20
Table 3.3 Dibutylphosphate and 1-Butanol in Samples ....................................................... 24
Table 3.4 Parameter Estimates for Model with Velocity, Adjusted Time, Pressure,and Organics Content ......................................................................................... 25
Table 3.5 Parameter Estimates for Model with Velocity and Adjusted Time.................... 25
Table 5.1 Supernate Simulant Samples.................................................................................. 30
Table 5.2 Sludge Solids Sample #1: Composition of solids filtered from sample. ............. 32
Table 5.3 Sludge Solids Sample #2: Composition of solids filtered from sample. ............. 33
Table 5.4 Sludge Solids Sample #3: Composition of solids filtered from sample. ............. 34
Table 5.5 Sludge Sample #1: Composition of filtrate from sample. .................................... 35
Table 5.6 Sludge Sample #2: Composition of filtrate from sample. .................................... 36
Table 5.7 Sludge Sample #3: Composition of filtrate calculated from compositionof Sample #2 by ratio. ......................................................................................... 37
Table 5.8 Overall Compositions of Samples #1-3 Calculated from Solids andFiltrate Analyses. ................................................................................................. 38
Table 5.9 Trim Chemicals Added........................................................................................... 39
Table 5.10 Experimental Design Table .................................................................................... 40

WSRC-TR-2002-00108, Rev. 0SRT-RPP-2002-00041, Rev. 0
Page vi
List of Figures
Figure 2.1 Crossflow Ultrafilter System.................................................................................... 3
Figure 2.2 Cross-flow Filtration Schematic .............................................................................. 4
Figure 2.3 Level Z (No Organics) Factorial Design.................................................................. 8
Figure 2.4 Level L (25 mg/L Each TBP & NPH) Factorial Design......................................... 8
Figure 2.5 Level H (2500 mg/L Each TBP & NPH) Factorial Design .................................... 9
Figure 3.1 Clean Water Flux Prior to Experimentation ........................................................ 10
Figure 3.2 Factorial Data Points for All Levels ...................................................................... 11
Figure 3.3 All Centroid Flux Data ........................................................................................... 12
Figure 3.4 Total Solids, Suspended Solids, and Specific Gravity versus Run ..................... 13
Figure 3.5 Total Solids, Suspended Solids, and Specific Gravity versus Level ................... 16
Figure 3.6 Ion Chromatography Data for Slurry Samples.................................................... 16
Figure 3.7 Ion Chromatography Data for Permeate .............................................................. 17
Figure 3.8 Slurry Carbon and Free Hydroxide Analyses ...................................................... 17
Figure 3.9 IC, Hydroxide, and TIC/TOC mg/L Data Normalized to ConstantAverage Nitrate.................................................................................................... 18
Figure 3.10 IC, Hydroxide, and TIC/TOC Molar Data Normalized to ConstantAverage Nitrate.................................................................................................... 18
Figure 3.11 Elemental Analyses (by ICPES) for Major Metals .............................................. 19
Figure 3.12 Ratio of Iron and Zirconium to Suspended Solids............................................... 19
Figure 3.13 Photos of Slurry Samples........................................................................................ 22
Figure 3.14 Possible Organic Phase Separation in Piping ....................................................... 22
Figure 3.15 Organics Concentrations in Slurry and Permeate ............................................... 23
Figure 3.16 Fitted Data for Flux versus Velocity and Time .................................................... 26
Figure 3.17 Fitted Data for Flux versus Velocity, Time, and Organics.................................. 27

WSRC-TR-2002-00108, Rev. 0SRT-RPP-2002-00041, Rev. 0
Page vii
List of Acronyms
ADS Analytical Development SectionDI deionizedDBP dibutylphosphatefps feet per secondHLW high level wasteIC ion chromatographyICPES inductively coupled plasma emission spectroscopyITS Immobilization Technology SectionNPH normal paraffin hydrocarbon (dodecane)QA Quality AssuranceQC Quality ControlSpGr specific gravitySRS Savannah River SiteSRTC Savannah River Technology CenterTBP tributyl phosphateTC total carbonTIC total inorganic carbonTOC total organic carbonTS total solidsTSS total suspended solidsWPT Waste Processing Technology (Section)WSRC Westinghouse Savannah River Company

WSRC-TR-2002-00108, Rev. 0SRT-RPP-2002-00041, Rev. 0
Page 1 of 82
1.0 Executive Summary
The effect on the filter flux of tributyl phosphate (TBP) and normal paraffin hydrocarbon(dodecane) in a simulated AZ-101 3.5 wt% insoluble, 28-30 wt% total solids slurry was studied.A 0.1 µm sintered metal Mott filter element was used for this work. The operating parametersused were specified by the customer to be within the range applicable to the full-scale plant.Specifically, transmembrane pressures of 20-60 psi and linear velocities of 7-15 fps were tested.
With TBP and dodecane at up to 2500 mg/L each, no effect on the filter flux was found.Therefore, the de minimis concentration of separable organics, if one exists, must be greater than2500 mg/L.
All measured fluxes exceeded the customer’s minimum of 0.014 gpm/ft2. Simulants with noorganics, 25 mg/L each, and 2500 mg/L each were concentrated by a factor of one to producepermeate for ion exchange tests.
Cleaning of the system after use with the organics proved difficult using only water and nitricacid. It should be noted that the concentrations of separable organics were much higher thanshould actually be seen in the WTP. We recommend that the effect of TBP and NPH be studiedfurther during filter cleaning tests.
2.0 Background and Introduction
Detailed background on the origin of this task is given in the customer’s (RPP-WTP) specifyingdocument: TSP-W375-00-00036, Rev. 1.1 This work is specified in the RPP-WTP R/T Plan(PL-W375-TE00007, Rev. 0).
2.1 Objectives
2.1.1 General Objectives
The effects of trace quantities of separable organics (tri-butyl phosphate {TBP} andnormal paraffin hydrocarbon{NPH}, herein also called “organics”) in the tank wasteliquid feed to the Hanford River Protection Project Waste Treatment Plant (RPP-WTP)and the fate of the separable organics within the system shall be evaluated. Bulkaverage concentrations of ~25 ppm (or mg/L) are expected, but instantaneousconcentrations could be higher. Each potentially affected unit operation, includingultrafiltration, ion exchange, and evaporation shall be examined for process, safety, andpermitting implications. Based upon the results of these tests, the SRTC shall propose ade minimis concentration level for separable organics that could be sent to the WTPwithout adversely affecting the WTP. Specifically, the effects of insoluble TBP andNPH on ultrafiltration filter flux rate with a simulated AZ-10l solution are to beevaluated in this task.

WSRC-TR-2002-00108, Rev. 0SRT-RPP-2002-00041, Rev. 0
Page 2 of 82
The products from these filtration tests will be used as the feed for cesium andtechnetium ion exchange studies, which will be covered by a separate Task Technical &Quality Assurance Plan. Evaporation studies are described in a separate customerrequest.2
2.1.2 Specific Objectives
1. Determine the effect on filter flux rate, for a 0.1 µm sintered metal Mott filterelement, of processing a simulated waste solution containing approximately 25 ppm(mg/L) TBP and 25 ppm NPH each above their solubility limit. The solubility limitfor TBP is approximately 1.1 mg/L. Although the solubility limit for NPH in the saltsolution is not exactly known, it should be much less than that for TBP since NPHis more non-polar.
2. Determine the effect on filter flux rate, for a 0.1 µm sintered metal Mott filterelement, of processing a simulated waste solution containing incrementally higherlevels of TBP and NPH each above their solubility limit. Organic levels up to2500 mg/L each are to be studied.
3. For the simulant without TBP/NPH and simulant with two levels of TBP and NPH,produce at least 2.0-2.5 liters of permeate solution of each for use in ion exchangetests.
2.2 Experimental System & Operation
Figure 2.1 shows a photograph of the system. A schematic of the experimental system isshown in Figure 2.2. The experimental crossflow filter, or Cold Cells Unit Filter (CUF)contains a single crossflow filter tube. A 5-stage centrifugal pump is used to feed the slurryinto the filter. Some liquid permeates through the filter wall (permeate) and the remainderpasses through the filter axially (concentrate). As solids accumulate on the filter wall,backpulsing can be used to remove accumulation. The filter in this work was a 3/8-inchinternal diameter, 2-foot long Mott Metallurgical sintered stainless steel filter. The nominalpore size was 0.1 µm. The single filter tube was mounted horizontally in a stainless steelhousing of welded construction.
Filtrate flowrate was measured with a graduated collection glass and stopwatch. The simplebackpulse system is manually operated. The backpulse chamber is first charged with filtratefollowed by compressed air. Quickly opening a toggle valve below the chamber forcesreverse flow of filtrate upon the filter medium. Standard Bourdon tube type pressure gaugeson both the inlet and exit of the filter indicate pressure. A thermocouple mounted near thebottom of the reservoir measures slurry temperature directly. A heat exchanger and chillerunit provide temperature control. All experiments were performed at 25 ± 5°C.
Slurry is recirculated through a heat exchanger and the filter element. A magnetic flow metermeasures the volumetric flow in the system, which is displayed on a digital read out alongwith the feed vessel temperature. The filter is back-pulsed before the start each experiment by

WSRC-TR-2002-00108, Rev. 0SRT-RPP-2002-00041, Rev. 0
Page 3 of 82
pressurizing the backpulse tank to 45 psig. The toggle valve is then open repeatedly at noflow conditions. When air is observed returning to the feed vessel, back-pulsing is stopped.Each set of experimental conditions are set by adjusting the flow of air to the feed pump andadjusting the slurry flow control valve until the desired flow and transmembrane pressuresare achieved. The system was operated per an approved operating procedure.3
2.2.1 Cross-flow Filter Conditioning
The equipment internals were first rinsed with flush solutions or DI water per the stepsbelow. The filter cleaning fluids were pre-filtered with 0.22 µm nylon filters before use.The laboratory de-ionizing unit uses a 0.22 µm filter on the discharge.
A previously used filter element was used. It was first drained of any previous fluid,then filled with deionized water. This water was filtered through a 0.22 µm nylon filter,which was located on the deionizer. This water was then recirculated through the filterconcentrate side for at least 15 minutes. The filtrate generated was recycled back to thefeed tank. The system was then drained, filled with ~1 M nitric acid, and recirculatedfor at least one hour. The filtrate generated was again recycled back to the reservoir. Atleast 2 backpulses were done in this period to clean the backpulse system as well as thefilter. The system was then drained and the backpulse chamber is purged to empty it. Asolution of 0.01 M NaOH was then added and recirculated for at least 15 minutes. Atleast 2 backpulses were done in this period to clean the backpulse system as well as thefilter. The entire system and backpulse chamber were then drained and then refilledwith fresh DI water (the system is laid up with DI water).
CENTRIFUGALPUMP
FEEDTANK
PERMEATE FLOWMETER
FILTER
HEATEXCHANGER
MAGNETICFLOWMETER
BACKPULSECHAMBER
Figure 2.1 Crossflow Ultrafilter System

WSRC-TR-2002-00108, Rev. 0SRT-RPP-2002-00041, Rev. 0
Page 4 of 82
P1 P2
CW In CW Out
Drain
Feed Tank
Back-PulseTank
Air Drivefor Pump
PermeateProduct
Toggle
Back Pulse Air
PumpOiler
Regulator
House Air
3-Way
Heat Exchanger
PumpSpeed
P3
V4
V7
V3
V5
V6
V8
V1
V10
V11
V2
SlurryFlowmeter
Filter Element
CentrifugalPump
Flo
wm
eter
Figure 2.2 Cross-flow Filtration Schematic
2.3 Experimental Methods & Materials
Initially, this work was specified to be performed with no insoluble solids, then respecified toinclude 0.1 wt% insoluble solids, then again respecified to use 3 wt% insoluble solids. Giventhese changes, to complete this work on a reasonable schedule, it was decided that the bestway to proceed was to use the already made supernate simulant, some existing Envelope Dsolids simulant, and trim chemicals.
The simulant used for these experiments was made from a supernate simulant and a solidssimulant. A simulated Tank 241-AZ-101 supernate solution that was ~5M Na concentrationwas prepared using a slight modification of the Envelope B simulant recipe.4 The details ofthe recipe are given in Appendix 5.1. The solids used were an Envelope D simulant.4 Thesupernate simulant and the solids simulant were each analyzed prior to use to verify correctmakeup. The solids simulant used was actually from three different bottles of previouslymade materials that were at different insoluble solids concentrations (8.03-14.8 wt%). Notethat concentration of these solids simulants to greater than 15 wt% insoluble solids by deadend filtration and centrifugation had been tried previously with no success, so they were usedas is. The supernate simulant was mixed with calculated amounts of the solids simulants to

WSRC-TR-2002-00108, Rev. 0SRT-RPP-2002-00041, Rev. 0
Page 5 of 82
achieve a total insoluble solids content of nominally 3.0 wt%. Additional trim chemicalsneeded to be added to adjust the soluble solids concentrations to the correct values since thesolids simulant had been washed to remove soluble components (e.g., Na, nitrite, nitrate,etc.). The amounts of each simulant material and chemicals used are shown in Table 2.1. Thecompositions of the simulant materials are shown in Appendix 5.2.
Table 2.1 Amounts of Simulants and Chemicals Used
MaterialInsoluble Solids
wt%Amount
UsedSupernate simulant 0 4.0 LSolids simulant 11.2 1.84 LSolids simulant 14.8 0.25Trim chemicals 0 513 gFinal Simulant ~ 3 6.3 L
The supernate simulant was prepared to give an Al concentration of approximately10700 mg/L, but precipitation of aluminum as alumina occurred immediately. The pH wasabout 11.3 and the total hydroxide concentration was greater than 1.0M. Small amounts of Siand Li also appear to have precipitated. Analysis of precipitate from a previous attempt toprepare this simulant showed that the solids were predominantly gibbsite [Al(OH)3], NaNO2,NaNO3, and a trace amount of hydrogen aluminum silicate [H(AlSi2O6)]. The actualsupernate simulant Al concentration was 5070 mg/L. Although aluminum precipitation couldnot be avoided, it was decided to continue with the experiments since the concentration ofsoluble aluminum in the simulant was deemed to have little effect on filtration. The supernatesimulant was filtered prior to mixing with the solids simulants. Upon mixing the supernatesimulant with the solids simulants and trim chemicals, the final composition shown in Table2.2 was achieved. Note that the Al concentration is less than the original simulant. Aluminumwas not added as a trim chemical, since it was suspected that additional precipitation wouldoccur.

WSRC-TR-2002-00108, Rev. 0SRT-RPP-2002-00041, Rev. 0
Page 6 of 82
Table 2.2 Measured Initial Composition of Simulant fromSupernate, Solids, & Trim Chemicals
Filtrate Filtered Solids Total SampleTreatment: Filtered Aqua Regia Dissolution Microwave Dissolution
mg/L mg/L mg/kg mg/kg mg/L mg/L mg/L mg/LICPES: Al 1970 2100 7289 7257 2694 2662 2678 2691
B 20.2 28.1 544 461 NA NA NA NABa <0.12 <0.12 873 874 66.3 65.6 65.0 65.7Ca 0.404 0.812 2371 2342 185 182 179 177Cd 0.490 0.745 11120 11155 820 823 824 826Co <0.44 <0.44 1425 1449 107 107 105 108Cr 443 454 1660 1684 551 562 559 564Cu <0.5 <0.5 482 475 35.7 32.5 29.9 28.0Fe 0.560 0.952 142543 142434 10845 10898 10915 10895Li <1 <1 <43 <43 <30 <30 <28 <28
Mg <0.84 <0.84 245 226 <25 <25 <23 <23Mn <0.09 <0.09 3452 3452 287 289 261 261Mo 5.00 5.25 <43 <43 30.4 30.4 27.7 27.7Na 99600 105000 181250 176188 109955 106667 108417 107407Ni <0.62 <0.62 8616 8691 682 681 690 688P 711 735 1240 1016 1031 1018 1052 1022
Pb <6.9 <6.9 1552 1585 <210 <210 <191 <222Si 3.70 4.40 3196 3064 6077 6115 5653 5366Sn <2.6 <2.6 <112 <112 <79 <79 <72 <72Sr 0.165 0.170 428 422 97.6 97.0 31.7 32.1Ti <1.4 <1.4 216 215 <42 <42 <39 <39V <1.3 <1.3 <56 <56 <40 <40 <36 <36
Zn <3.7 <3.7 480 482 <112 <112 <102 <102Zr 0.997 2.15 42243 42785 3677 3669 3479 3496La <7 <7 5578 5563 358 337 230 263K 3650 3920 5753 5864 3547 3509 3786 3451
Re 33.2 34.4 52.7 62.3 <61 <61 64 64S 6190 6230 9429 9513 6572 6682 6719 6623
Ag <3 <3 599 841 <91 <91 <83 <83Ce <7.7 <7.7 1243 1300 <234 <234 <213 <213Nd <2.6 <2.6 3952 3992 390 316 300 319
IC: chloride 194 231 200fluoride 1738 2011 1694
nitrate 67107 75686 63905nitrite 54366 50080 61437
sulfate 18123 20532 17019phosphate 2547 2358 2358
TC NA 4000TIC NA 4000
TOC NA <200Total Solids (wt%) 26.5 28.0
Insoluble Solids (wt%) 2.95Specific Gravity 1.22 1.25
Numbers in red with < indicate values below detection limit

WSRC-TR-2002-00108, Rev. 0SRT-RPP-2002-00041, Rev. 0
Page 7 of 82
Samples of the slurry simulant and permeate were taken throughout the experiments. Somesamples were analyzed completely, while others were analyzed only for total solids, insolublesolids, and specific gravity. Sample results from throughout the experiments are discussed inSection 3.1. The TBP and NPH used were 99.9+ % pure. The NPH used was actuallydodecane. The TBP and NPH were first mixed to a 50:50 wt% mixture and then the mixturewas added to the simulant in the necessary quantities.
2.4 Experimental Runs Matrix
The experimental runs were divided into four sections:
1. No organics. Factorial design. Permeate flux versus transmembrane pressure (TMP) andlinear velocity. (Called “Level Z” herein.)
2. TBP and NPH both at 25 mg/L above the solubility limit. Factorial design as in #1.(Called “Level L” herein.)
3. Increase TBP and NPH to as high as 2500 mg/L each to determine concentration (impactlevel) that adversely affects the filter flux. This is the “de minimis” concentrationdetermination. (Called “Level M” herein.)
4. Organics at impact level. Factorial design as in #1. (Called “Level H” herein.)
The factorial design for the no organics level is shown in Figure 2.3. Three clean water fluxdetermination points are also shown in this Figure. The clean water flux was determined priorto the first runs with simulant sludge. The level L and level H designs are shown in Figure2.4-Figure 2.5. The clean water flux was again determined after level H was completed. Thenumbers on each experimental point indicate the order in which the experiments wereconducted; this order was randomly chosen for each level prior to the start of theexperiments. Details of these experimental designs are given in Appendix 5.3.
Between each level, approximately two liters of permeate was collected for further use in ionexchange and evaporation experiments. For all three collection periods, the permeate wascollected at a velocity of 13.4-15.9 fps, TMP of 32-39 psi, and a permeate flux of0.061-0.095 gpm/ft2. The Test Specification called for these production runs to be conductedat the optimum conditions of flow and pressure. The results of this work showed that thehighest permeate flowrate was achieved at the highest attainable velocity and any pressure(above 20 psi, since lower pressures were not tested).

WSRC-TR-2002-00108, Rev. 0SRT-RPP-2002-00041, Rev. 0
Page 8 of 82
1
3
5
7
9
11
13
15
17
0 10 20 30 40 50 60 70
Transmembrane Pressure (psi)
Vel
oci
ty (
ft/s
ec)
Surrogate Feed
Clean Water
1, 6, 11
8
4
10
5
3
2
9
7
0a 0b 0c
Centroid
Figure 2.3 Level Z (No Organics) Factorial Design
1
3
5
7
9
11
13
15
17
0 10 20 30 40 50 60 70
Transmembrane Pressure (psi)
Vel
oci
ty (
ft/s
ec) 2, 4, 11
3
9
10
1
5
7
8
6
Centroid
Figure 2.4 Level L (25 mg/L Each TBP & NPH) Factorial Design

WSRC-TR-2002-00108, Rev. 0SRT-RPP-2002-00041, Rev. 0
Page 9 of 82
1
3
5
7
9
11
13
15
17
0 10 20 30 40 50 60 70
Transmembrane Pressure (psi)
Vel
oci
ty (
ft/s
ec)
Surrogate FeedClean Water
1, 5, 11
6
9
10
7
3
8
4
2
0a 0b 0c
Centroid
Figure 2.5 Level H (2500 mg/L Each TBP & NPH) Factorial Design
3.0 Results and Discussion
3.1 Experimental Data
3.1.1 Clean Water Flux
Clean water fluxes were taken after the system was flushed with cleaning fluids asdescribed in section 2.2.1. Transmembrane pressures were between 5 and 20 psi andfluxes were measured after initial backpulsing. The purpose for obtaining the cleanwater flux measurements is to ensure the equipment is cleaned and to establish abaseline filter flux to determine if filter fouling occurs during tests with the wastesimulant sample. The high filtrate flux observed for water made it necessary to collectfiltrate in a 500 ml graduated cylinder instead of the 40 ml graduated collection vesselused in slurry operation. Figure 3.1 presents the measured clean water flux prior to andafter the experimentation. The clean water flux prior to the filtration of the Sr/TRUprecipitate of Envelope C waste, on a similar ultrafilter, is also shown.5
The post-test clean water flux data was taken after the system had been cleaned asdescribed in section 2.2.1, with the exceptions that the 0.01M NaOH flush was not doneand a flush with a low-foaming detergent (Alconox) was performed. Soaking with~1M nitric acid for several days did not return the flux back to the original values, sothe detergent was used on the assumption that the organics had affected the filter

WSRC-TR-2002-00108, Rev. 0SRT-RPP-2002-00041, Rev. 0
Page 10 of 82
(although not adversely for slurry filtration). Both TBP and NPH are relatively stable innitric acid (they are used in solvent extraction), so the apparent ineffectiveness of thenitric acid is not surprising since little organic degradation should occur.
After soaking with detergent, the system was flushed with water and then re-cleanedwith nitric acid. At this time, significant foaming occurred, so the acid was left in thesystem for several weeks. After the additional soaking, the foaming stopped and thefluxes returned to values similar to before the run. There is no comparative cleaningdata with an AZ-101 simulant without organics present to determine if the samedifficulty in cleaning would have occurred.
Also note that the final feed used, at 2500 mg/L each of TBP and NPH, was muchhigher than would ever be expected in the WTP, so the effect of these organics mayhave been much more severe that will actually occur in the WTP. We recommend thatthe effect of separable organics on cleaning be investigated during filter cleaning tests.
Figure 3.1 Clean Water Flux Prior to Experimentation
3.1.2 Experimental Runs
The no organics (Level Z) and the 25 mg/L each of TBP & NPH experiments (Level L)were run in succession per the designs shown in Figure 2.3 and Figure 2.4. Uponcompleting level L, the organics content was incrementally increased from 25 mg/Leach of TBP & NPH to 2500 mg/L of each. The organics content was increased eachtime by adding the additional organics on top of the feed in the feed tank. The pumpwas then started and run for several minutes at ~15 fps velocity to mix the organics.

WSRC-TR-2002-00108, Rev. 0SRT-RPP-2002-00041, Rev. 0
Page 11 of 82
The Test Plan specified that addition of organics cease when the “impact level” wasfound. However, no significant impact of the organics up to 2500 mg/L appeared to befound. The high organics (Level H) factorial experiment, with both TBP and NPH at2500 mg/L, was then performed per the design shown in Figure 2.5.
The experimental fluxes measured for all levels of the factorial and impact levelexperiments are shown in Appendix 5.4. Plots of these same data are also shown in thisAppendix. Figure 3.2 shows the factorial experiment arrangement with the actualvariable values. The inability to achieve the highest flow/pressure combinations had noeffect on the outcome of these tests. It should be noted that the multi-stage centrifugalpump should have been a six stage, rather than five stage pump.
1
3
5
7
9
11
13
15
17
0 10 20 30 40 50 60 70
Transmembrane Pressure (psi)
Vel
oci
ty (
ft/s
ec)
Surrogate Feed
Clean Water
Actuals UNABLE TO OPERATEIN THIS RANGE
Figure 3.2 Factorial Data Points for All Levels
Because the factorial experiment used various combinations of TMP and velocity,direct graphical comparison of the data is somewhat difficult except where thesevariables are at the same values. Figure 3.3 shows the measured fluxes versus runnumber for the centroid point of the factorial experiments; this plot also includes theimpact level determination data, which was also taken at the centroid. The minimumflux for Envelope B/D is 0.014 gpm/ft2.6 During the Level L factorial experiment, thecentrifugal pump began to leak from the mechanical seal. By the end of this level, theleak was too great to continue without repairs. To repair the pump, the system had to bedrained and flushed. The flushing of the system resulted in a step change increase ofabout 0.006 gpm/ft2 in the steady state flux. Note the two data points that were run atthe same conditions. To account for this change in flux, all of the flux data after the

WSRC-TR-2002-00108, Rev. 0SRT-RPP-2002-00041, Rev. 0
Page 12 of 82
pump repair was decreased by 0.006 gpm/ft2 to put this data on the same basis as theinitial data.
The steady state flux decreased approximately linearly until the beginning of the impactlevel (M) determination runs. This type of behavior has been seen in other ultrafiltrationwork at SRTC.7 The cause for this type of trend has been attributed to either irreversible(except with cleaning) changes in the filter membrane or particle degradation to anultimate particle size distribution.8 Both of these proposed phenomena are functionsprimarily of run time.
0.00
0.01
0.02
0.03
0.04
0.05
0.06
0 5 10 15 20 25
Cumulative Run Time (hr)
Ste
ady
Sta
te F
lux
(gp
m/f
t2 )
Level M data adjusted 0.006 gpm/ft2
downward to adjust for cleaning effectof flushing between Runs L and M
Both at 50 mg/Ltotal organics
no organics(Z)
25 mg/L eachTBP & NPH
(Level L)
25 to 2500 mg/L each TBP & NPH
(Level M)
2500 mg/L eachTBP & NPH
(Level H)
lines shown only tohighlight correlation;not a curvefit
� Original Data� Adjusted Data
RPP-WTP MINIMUM FLUX
Figure 3.3 All Centroid Flux Data
3.2 Simulant and Permeate Composition Versus Time
The total solids and suspended (insoluble) solids contents and the specific gravity of thesimulant sludge and permeate was measured periodically. More complete analyses of thecomposition of the simulant were made between each level of experiment. Figure 3.4 showsthe total solids, suspended solids, and specific gravity of the slurry throughout theexperiments. The total solids content ranged from about 27.5 to 29.0 wt% during the factorialexperiments, and increased during the concentration steps. These data are also summarized inFigure 3.5. Overall, there was a slight increase in all three quantities from level to level.These differences are due to the way each level was started. Upon completion of theconcentration step from the previous level, supernate simulant was re-added to the feed tankin the approximate amount that had been removed. The variation in the amounts of theseadditions is the reason for the different solids and specific gravity measurements.

WSRC-TR-2002-00108, Rev. 0SRT-RPP-2002-00041, Rev. 0
Page 13 of 82
0
5
10
15
20
25
30
35
0 5 10 15 20 25 30 35 40 45 50 55 60
Cumulative Run #
To
tal S
olid
s o
r S
usp
end
ed (
Inso
lub
le)
So
lids
(wt%
)
1
1.05
1.1
1.15
1.2
1.25
1.3
1.35
1.4
Sp
ecif
ic G
ravi
ty
Total Solids
Suspended Solids
Specific Gravity
NO ORGANICS(level Z)
25 mg/L EACH(level L)
INCREASE from25 mg/L EACH to2500 mg/L EACH
(level M)
2500 mg/L EACH(level H)
CO
NC
EN
TR
AT
E
CO
NC
EN
TR
AT
E
CO
NC
EN
TR
AT
E
Figure 3.4 Total Solids, Suspended Solids, and Specific Gravity versus Run
The composition of the slurry, permeate (or filtrate from slurry samples), and the filteredsolids are shown in Table 3.1. Most of the analyses of the slurry from level to level areconsistent and generally within 20%. Different types of dissolutions were sometimesnecessary for the elemental analyses to dissolve the entire sample. The microwave dissolutionwas usually used, but the peroxide fusion and aqua regia dissolutions were also used.
Since the main purpose of this work was to determine if the presence of the TBP and NPHhave any effect on the filtrate flux, it was important to eliminate other possible causes for thedata behavior. Dissolution or precipitation of selected species could have a significant effecton the filterability of the slurry. Figure 3.6-Figure 3.8 show the slurry and permeate IC andcarbon analyses plotted versus cumulative run number. Note that some of the variation seenis due to slightly different solids concentrations that existed during the different levels. Therewere several unexpected trends. The phosphate concentration in both the slurry and permeateappears to have dropped off during the high organics runs. An increase in phosphorus wasexpected with the addition of the TBP; however, the difficulty in getting a representativesample containing the organic phase contributed to this trend (see discussion in Section 3.3).The hydroxide concentration also dropped off during the experiments, starting at about0.97M and dropping to about 0.8M. In Figure 3.9-Figure 3.10, the IC and TIC/TOC data isshown in mg/L and Molar, respectively, where all concentrations have been normalized to aconstant nitrate concentration. Nitrate concentration was not expected to change except fordilution effects. These figures show that when normalized to nitrate, the concentrations ofsulfate, chloride, and fluoride stay essentially constant. The graph of Molar concentrationshows that the decrease in the hydroxide concentration is, to within the analytical accuracy,balanced by the increase in the carbonate concentration. Therefore, absorption of carbondioxide appears to account for the hydroxide decrease.

WSRC-TR-2002-00108, Rev. 0SRT-RPP-2002-00041, Rev. 0
Page 14 of 82
The data in Figure 3.11 show that the iron concentration was relatively constant during thefactorial experiments and that it increased during the concentration, as expected. Iron was themajor insoluble species in the slurry. The other significant insoluble species were Zr, and Si;the data for both of these is inconclusive. The dissolution of Zr by the microwave and aquaregia methods gave inconsistent results, whereas there was significant scatter in the Si data.The soluble species Na, Al, Cr, and K all stayed relatively constant as expected.
Since Zr and Fe were mostly insoluble, their concentrations in the slurry should parallel thesuspended solids concentration. The ratio of these elements to the TSS is shown in Figure3.12. The ratios, within experimental variation, are constant.
Figure 3.8 shows the carbon analyses during the experiments. There is good agreementbetween the TIC and carbonate analyses (although a constant offset) and also between theTOC analyses and the TOC calculated from the organics added (except for the last datapoint). The TOC calculated from the organics measured by GC-MS was generally about 1/3of the actual amount added. This discrepancy can be explained by the difficulty in getting arepresentative sample of the slurry/organic phase mixture, which is discussed in Section 3.3.The average analyses of filtrate from slurry and permeate were shown in Figure 3.2. Thecomposition of the permeate varied little during the experiments, as shown in Table 3.2. Thefirst two columns and the last column are data for dead-end filtered slurry.

WSRC-TR-2002-00108, Rev. 0SRT-RPP-2002-00041, Rev. 0
Page 15 of 82
Table 3.1 Average Compositions of Slurry, Permeate, and Solids
Filtrate orPermeate
SludgeSolids
Slurry –Level Z Start
Slurry -Level Z
Concentrated
Slurry -Level L
Start
Slurry –Level L
Concentrated
Slurry -Level H
Start
Slurry –Level H
Concentratedmg/L mg/L mg/L mg/L mg/L mg/L mg/L mg/L
Al 2339 7273 2681 2862 3038 3356 2782 NAB 21.4 503 NA NA NA NA <29.6 621Ba 0.23 931 66 94 70.8 103 297 149Ca <0.47 3131 181 256 196 277 180 1054Cd 0.87 11128 823 1189 887 1300 831 1664Co <0.44 1459 106 156 118 167 108 219Cr 525 1803 559 589 649 710 624 737Cu <0.50 378 32 44 42.8 43.8 30.0 <18.8Fe 3.58 144878 10888 15394 11548 17076 10852 21717Li <1.00 <71 <29 <29 <30.8 <30.1 <14.1 <37.5Mg <0.84 248 <24 <25 <25.9 <25.3 <17.1 <73.8Mn <0.13 3592 274 380 289 411 272 541Mo 4.51 <71 <29 <31 <32.5 <30.1 <14.1 <37.5Na 110622 178719 108112 108213 112206 114892 112549 NANi <0.71 8809 685 960 732 1058 665 1364P 742 2343 1031 1069 968 991 395 862Pb <6.90 1717 <208 207 <213 217 163 270Si 3.55 5247 5803 3838 5292 5421 NA 5801Sn <2.60 <184 <76 <75 <80.2 <78.2 <36.6 <97.5Sr <0.12 444 65 60 46.8 48.6 40 NATi <1.40 259 <41 <43 <43.2 <42.1 <20.2 <191V <1.30 <92 <38 <37 <40.1 <39.1 <18.3 <48.8Zn <3.70 513 <107 <106 <114 <111 <52.1 <139Zr 3.45 42514 3580 4970 3786 5494 2999 NALa <7.00 5510 297 361 324 498 440 893K 4141 5809 3573 3534 3619 3842 3768 NARe 38.0 127 <63 <58 <62.0 <81.0 <70.4 <37.5S 6386 9405 6649 6557 6654 6635 7105 6991Ag <3.00 1226 <87 <144 <92.5 <150 <73.8 <313Ce <7.70 1326 <224 <222 <237 <232 <119 <289Nd <2.60 3921 331 380 365 476 288 603chloride 164 NA 215 221 207 221 161 155fluoride 1629 NA 1852 1888 1866 1973 1793 1705nitrate 62749 NA 69795 70394 73099 77174 69285 66567nitrite 49750 NA 55758 55171 57827 61918 58525 59140sulfate 16286 NA 18776 17332 18714 19701 17207 16302phosphate 2108 NA 2358 2424 2167 2276 1655 1325carbonate NA NA 22302 24105 24432 29403 27588 27690hydroxide NA NA 17061 16426 16394 14799 13782 13336TS (wt%) 27.25 NA 28.04 29.04 28.8 30.5 27.7 30.1TSS (wt%) NA NA 2.95 4.93 3.08 5.23 3.53 6.12SpGr 1.235 NA 1.249 1.261 1.25 1.27 1.26 1.28

WSRC-TR-2002-00108, Rev. 0SRT-RPP-2002-00041, Rev. 0
Page 16 of 82
0
5
10
15
20
25
30
35
Level Z Start Level Z afterConcentration
Level L Start Level L afterConcentration
Level H Start Level H afterConcentration
So
lids
(wt%
)
1.24
1.25
1.26
1.27
1.28
1.29
Sp
ecif
ic G
ravi
ty
TSTSSSpGr
TS TSS SpGrLevel Z S tar t 28.04 2.95 1.25
Level Z after Concentrat ion 29.04 4.93 1.26Level L S tar t 28.82 3.08 1.25
Level L after Concentration 30.53 5.23 1.27Level H S tart 27.66 3.53 1.26
Level H after Concentration 30.14 6.12 1.28
Figure 3.5 Total Solids, Suspended Solids, and Specific Gravity versus Level
0
10000
20000
30000
40000
50000
60000
70000
80000
0 10 20 30 40 50 60
Cumulative Run #
Nit
rate
, Nit
rite
, Su
lfat
e (m
g/L
)
0
500
1000
1500
2000
2500
3000
3500
4000
Ch
lori
de,
Flu
ori
de,
Ph
osp
hat
e (m
g/L
)
nitrate
nitrite
sulfate
chloride
fluoride
phosphate
Figure 3.6 Ion Chromatography Data for Slurry Samples

WSRC-TR-2002-00108, Rev. 0SRT-RPP-2002-00041, Rev. 0
Page 17 of 82
0
10000
20000
30000
40000
50000
60000
70000
80000
90000
0 10 20 30 40 50 60
Cumulative Run #
Nit
rate
, Nit
rite
, Su
lfat
e (m
g/L
)
0
500
1000
1500
2000
2500
3000
3500
Ch
lori
de,
Flu
ori
de,
Ph
osp
hat
e (m
g/L
)
nitratenitritesulfatechloridefluoridephosphate
Figure 3.7 Ion Chromatography Data for Permeate
0
2000
4000
6000
8000
10000
12000
14000
16000
18000
0 10 20 30 40 50 60
Cumulative Run #
Co
nce
ntr
atio
n (
mg
/L)
TC
TOC
TIC
TIC from carbonate
TOC from Organics Measured
TOC from Organics Added
Free Hydroxide
Figure 3.8 Slurry Carbon and Free Hydroxide Analyses

WSRC-TR-2002-00108, Rev. 0SRT-RPP-2002-00041, Rev. 0
Page 18 of 82
0
10000
20000
30000
40000
50000
60000
70000
80000
0 10 20 30 40 50 60
Cumulative Run #
Nit
rate
, Nit
rite
, Su
lfat
e, H
ydro
xid
e (
mg
/L)
0
500
1000
1500
2000
2500
3000
3500
4000
4500
5000
Ch
lori
de,
Flu
ori
de,
Ph
osp
hat
e, T
IC, T
OC
(m
g/L
)
nitrate
nitrite
sulfate
hydroxide
chloride
fluoride
phosphate
TOC
TIC
Concentrations normalized to constant average nitrate concentration.
Figure 3.9 IC, Hydroxide, and TIC/TOC mg/L DataNormalized to Constant Average Nitrate
0
200
400
600
800
1000
1200
1400
0 10 20 30 40 50 60
Cumulative Run #
Nit
rate
, Nit
rite
, Su
lfat
e, H
ydro
xid
e, T
OC
, TIC
(m
M)
0
10
20
30
40
50
60
70
80
90
100
Ch
lori
de,
Flu
ori
de,
Ph
osp
hat
e (m
M) nitrate
nitrite
sulfate
TOC
TIC
hydroxide
TIC + OH
chloride
fluoride
phosphate
Concentrations normalized to constant average nitrate concentration.
Figure 3.10 IC, Hydroxide, and TIC/TOC Molar DataNormalized to Constant Average Nitrate

WSRC-TR-2002-00108, Rev. 0SRT-RPP-2002-00041, Rev. 0
Page 19 of 82
0
5000
10000
15000
20000
25000
0 5 10 15 20 25 30 35 40 45 50 55 60
Cumulative Run #
Co
nce
ntr
atio
n, a
ll ex
cep
t N
a (m
g/L
)
0
20000
40000
60000
80000
100000
120000
Na
Co
nce
ntr
atio
n (
mg
/L)
Al
Cr
Fe
K
S
Si
Zr
NaC
ON
CE
NT
RA
TE
CO
NC
EN
TR
AT
E
CO
NC
EN
TR
AT
E
Figure 3.11 Elemental Analyses (by ICPES) for Major Metals
0
500
1000
1500
2000
2500
3000
3500
4000
4500
5000
Level Z Start Level Z afterConcentration
Level L Start Level L afterConcentration
Level H Start Level H afterConcentration
Rat
io m
g/L
/wt%
Fe/TSS
Zr/TSS
Figure 3.12 Ratio of Iron and Zirconium to Suspended Solids

WSR
C-T
R-2
002-
0010
8, R
ev. 0
SRT
-RP
P-2
002-
0004
1, R
ev. 0
Page
20
of 8
2
Tab
le 3
.2C
ompo
siti
on o
f P
erm
eate
Filte
red
Slur
ry I
nitia
lP
erm
eate
Lev
el Z
Per
mea
te L
evel
LP
erm
eate
Lev
el H
Filte
red
Slur
ryL
evel
Hm
g/L
mg/
Lm
g/L
mg/
Lm
g/L
mg/
Lm
g/L
mg/
Lm
g/L
Al
1970
2100
2280
2290
2280
2290
2630
2620
2590
B20
.228
.126
.024
.926
.024
.915
.214
.712
.1B
a<
0.12
<0.
120.
330.
390.
330.
39<
0.12
<0.
120.
19C
a0.
400.
81<
0.4
<0.
4<
0.4
<0.
40.
400.
530.
51C
d0.
490.
750.
790.
770.
790.
770.
560.
532.
41C
o<
0.44
<0.
44<
0.44
<0.
44<
0.44
<0.
44<
0.44
<0.
44<
0.44
Cr
443
454
497
500
497
500
611
610
612
Cu
<0.
5<
0.5
<0.
5<
0.5
<0.
5<
0.5
<0.
5<
0.5
0.50
Fe0.
560.
951.
311.
201.
311.
200.
600.
6524
.4L
i<
1<
1<
1<
1<
1<
1<
1<
1<
1M
g<
0.84
<0.
84<
0.84
<0.
84<
0.84
<0.
84<
0.84
<0.
840.
84M
n<
0.09
<0.
09<
0.09
<0.
09<
0.09
<0.
09<
0.09
<0.
090.
47M
o5.
005.
255.
735.
215.
735.
212.
812.
822.
81N
a99
600
1050
0011
7000
1140
0011
7000
1140
0010
9000
1090
0011
1000
Ni
<0.
62<
0.62
<0.
62<
0.62
<0.
62<
0.62
<0.
62<
0.62
1.44
P71
173
579
476
279
476
269
569
473
0P
b<
6.9
<6.
9<
6.9
<6.
9<
6.9
<6.
9<
6.9
<6.
9<
6.9
Si3.
704.
402.
612.
322.
612.
325.
406.
282.
28Sn
<2.
6<
2.6
<2.
6<
2.6
<2.
6<
2.6
<2.
6<
2.6
<2.
6Sr
0.17
0.17
<0.
1<
0.1
<0.
1<
0.1
0.06
310.
140.
12T
i<
1.4
<1.
4<
1.4
<1.
4<
1.4
<1.
4<
1.4
<1.
4<
1.4
V<
1.3
<1.
3<
1.3
<1.
3<
1.3
<1.
3<
1.3
<1.
3<
1.3
Zn
<3.
7<
3.7
<3.
7<
3.7
<3.
7<
3.7
<3.
7<
3.7
<3.
7Z
r1.
002.
151.
721.
641.
721.
640.
990.
9719
.2L
a<
7<
7<
7<
7<
7<
7<
7<
7<
7K
3650
3920
4300
4340
4300
4340
4130
4170
4120
Re
33.2
34.4
40.2
38.2
40.2
38.2
39.1
38.9
39.6
S61
9062
3067
0064
1067
0064
1063
1062
9062
30A
g<
3<
3<
3<
3<
3<
3<
3<
3<
3C
e<
7.7
<7.
7<
7.7
<7.
7<
7.7
<7.
7<
7.7
<7.
7<
7.7
Nd
<2.
6<
2.6
<2.
6<
2.6
<2.
6<
2.6
<2.
6<
2.6
<2.
6

WSR
C-T
R-2
002-
0010
8, R
ev. 0
SRT
-RP
P-2
002-
0004
1, R
ev. 0
Page
21
of 8
2
Tab
le 3
.2C
ompo
siti
on o
f P
erm
eate
(co
ntin
ued)
Filte
red
Slur
ry I
nitia
lP
erm
eate
Lev
el Z
Per
mea
te L
evel
LP
erm
eate
Lev
el H
Filte
red
Slur
ryL
evel
Hm
g/L
mg/
Lm
g/L
mg/
Lm
g/L
mg/
Lm
g/L
mg/
Lm
g/L
Tot
alSo
lids
(wt%
)
26.5
27.6
27.2
27.0
28.0
Sp G
r1.
221.
231.
231.
241.
26C
l19
413
4F
1738
1519
NO
367
107
5839
1N
O2
5436
645
134
SO4
1812
314
448
PO
425
4716
68

WSRC-TR-2002-00108, Rev. 0SRT-RPP-2002-00041, Rev. 0
Page 22 of 82
3.3 Organics in Slurry and Permeate
The concentrations of TBP and dodecane are plotted versus run number in Figure 3.15. Asthese organics were added during Level M, the measured concentrations in the slurry weregenerally about 1/3 of what the actual additions were.
The low measured concentration of organics would, at least initially, tend to indicate that theentire amount of organics did not pass through the filter system. If this were true, the filterwould not have been challenged as much as planned. Visual observation of the top of the feedtank showed that, although the organic phase tended to float on top of the aqueous phase, itwas periodically (on the order of several seconds) pulled down into the aqueous phase andfed to the filter. Figure 3.13 shows photos of slurry samples that show the presence oforganics. No accumulation of organic phase above the liquid level, which would have beeneffectively excluded from processing, was seen. There also was no evidence of stickingelsewhere in the system.
NO ORGANICS WITH ORGANICS
ORGANIC LAYER
ORGANICSFLOATING
ON TOP
Figure 3.13 Photos of Slurry Samples
The lower than expected concentrations can be explained by the difficulty in getting arepresentative sample of the three phase (aqueous, solid, organic) mixture. Any given samplecould contain different proportions of organics and slurry. The presence of organics in thesamples taken from the piping at the pump inlet is verified by these analyses and also byvisual examination of the samples. Figure 3.14 shows how the slurry samples were taken.
Figure 3.14 Possible Organic Phase Separation in Piping

WSRC-TR-2002-00108, Rev. 0SRT-RPP-2002-00041, Rev. 0
Page 23 of 82
Due to the density difference, the organic phase will tend to float to top of pipe even inturbulent flow. The axial distribution of organic phase along the pipe will also be notuniform. Therefore, samples taken at the sample tap would be expected to have loweraverage organic concentration than the average material in the pipe. (However, this sampletap configuration should result in good samples for the slurry consisting of small particles.)
The permeate measurements show that the dodecane was always below the detection limit,which was approximately 0.12 mg/L. The TBP concentrations in the permeate ranged fromthe detection limit of 0.12 mg/L to about 0.7 mg/L. The approximate solubility of TBP inhigh Na+ solutions is 1.1 mg/L.9 The concentrations of dibutylphosphate and 1-butanol (n-butanol) were measured in two samples. A trace amount of 1-butanol was found in thepermeate samples; the DBP was below the detection limit. Slurry sample results for DBP &n-butanol were all below the detection limit. These data are summarized in Table 3.3.
0
200
400
600
800
1000
15 20 25 30 35 40 45 50 55 60
Cumulative Run #
Slu
rry
(mg
/L)
0.0
0.5
1.0
1.5
2.0
2.5
3.0
Per
mea
te (
mg
/L)
Slurry DodecaneSlurry TBPDodecane or TBP AddedPermeate TBPPermeate DodecaneApprox. Detection Limit
2500
LEVEL L
CO
NC
EN
TR
AT
E
LEVEL MADD ORGANICS
LEVEL H
CO
NC
EN
TR
AT
E
APPROXIMATETBP SOLUBILITY
DETECTION LIMIT
Figure 3.15 Organics Concentrations in Slurry and Permeate

WSRC-TR-2002-00108, Rev. 0SRT-RPP-2002-00041, Rev. 0
Page 24 of 82
Table 3.3 Dibutylphosphate and 1-Butanol in Samples
Sample
dibutylphosphate(DBP)mg/L
1-butanol(n-butanol)
mg/Lsludge (2 samples) <10 <25permeate <10 0.98permeate <10 2.0
3.4 Statistical Analysis of Data
The filtrate flux for ultrafiltration can depend on several factors. To determine if the effectsof TBP and NPH, transmembrane pressure, velocity, and run time (or approximately, numberof runs) were significant, several potential models were examined. A number of models havebeen proposed for modeling the behavior of filters. Listed below are some of these models.
Kozeny-Carman J ∝ ∆P
Brownian Diffusion J ∝ 31
CV0.503
Shear Induced Diffusion J ∝ 31
CV1.75
Inertial Lift J ∝ 3.5V
Surface Transport J ∝ 1.75V
Lift Velocity J ∝ 2.625V
Boundary Layer J ∝
C
1lnV1.75 or
C
1V1.75
where J = transmembrane flux (gpm/ft2)V = velocity (ft/sec)∆P = transmembrane pressure (psi)
C = solids (insoluble) concentration (wt%)
In addition to the variables given above, the total organics concentration and total run timewere added as variables to a generalized model that was proposed:
Generalized Model J = )bt(1QPCaV adjqpcv −∆
where Q = organics concentration + 1 (mg/L)tadj = cumulative run time (hr) up to 13.5 hr, then = 13.5 thereafter
a, v, c, p, q, b = parameters (constants)
The cumulative run time term was added to account for the leveling off behavior shown inFigure 3.3. The linear drop occurs until about 13.5 hours, then the flux is essentiallyindependent of time. The form of the organics concentration term was arbitrary since therewas no theoretical basis for adding this term. The “concentration + 1” was used to make thebaseline at zero organics have a contribution of “1” to the equation. The statistical analysesand curve fitting was performed using a statistical software package.10

WSRC-TR-2002-00108, Rev. 0SRT-RPP-2002-00041, Rev. 0
Page 25 of 82
The solids concentration term was immediately removed from the model because the solidsconcentration only varied from 2.95 to 3.53 wt%, which is too small a range to reliably fit amodel. (Actual fitting with this variable gave a stair-step predicted flux, as expect, which isnot what was seen.) Fitting of the model without the effect of solids is summarized in Table3.4.
Table 3.4 Parameter Estimates for Model with Velocity, Adjusted Time, Pressure, andOrganics Content
Approximate 95%Confidence Limit
Parameter Estimate Lower Uppera 0.002642 0.001728 0.004016v 1.350 1.234 1.467b 0.008222 -0.004988 0.019929q -0.01972 -0.03813 0.00058p -0.07914 -0.15746 0.00129
Correlation of Estimatesa v b q p
a 1.0000 -0.7219 0.1902 0.1711 -0.7145v -0.7219 1.0000 -0.1340 -0.1209 0.0461b 0.1902 -0.1340 1.0000 0.9503 -0.0074q 0.1711 -0.1209 0.9503 1.0000 -0.0244p -0.7145 0.0461 -0.0074 -0.0244 1.0000
The effect of pressure (p) is statistically insignificant since the confidence region includeszero. Both time “b” and organics “q” are also insignificant, although both parameters barelyinclude zero. Moreover, they are highly correlated, so they tend to describe the same effect.Leaving out the effect of organics, since leaving this out makes more physical sense thanleaving out time, gives the parameters in Table 3.5.
Table 3.5 Parameter Estimates for Model with Velocity and Adjusted TimeApproximate 95%Confidence Limit
Parameter Estimate Lower Uppera 0.002091 0.001543 0.002821v 1.342 1.221 1.464b 0.01942 0.01631 0.02233
Correlation of Estimatesa v b
a 1.0000 -0.9914 0.1717v -0.9914 1.0000 -0.0597b 0.1717 -0.0597 1.0000

WSRC-TR-2002-00108, Rev. 0SRT-RPP-2002-00041, Rev. 0
Page 26 of 82
With only time as a variable, the parameter “b” is significant. Parameters “a” and “v” arehighly correlated as is common with exponential models. The best model is then:
J = )t019420(1V0.002091 adj1.342 .−
The predicted values for this model for all of the data is shown in Figure 3.16. The offsetfrom each curve to the data points is due to the effect of pressure on flux. If a subset of thedata is taken, the effect of pressure can be found to be statistically significant, but the scatterin the overall data hides this effect. In reality, higher pressures appear to result in slightlyhigher fluxes. Note the circled points in the Figure; if these are eliminated, the fit of the V=11fps data is quite good.
Models with all parameters in most of the possible combinations were examined tothoroughly eliminate the possible models. Models without the time factor and with either thesolids or organics gave statistically equivalent curve fits, but the shape of the curves wereunrealistic. Figure 3.17 shows the fit of flux versus velocity, time, and organicsconcentration. Similar curves result from fitting versus velocity and just organics or solids.Figure 3.17 also shows that the adjusted time and organics concentration are highlycorrelated. A summary of the curve fits performed is given in Appendix 5.5.
0
0.01
0.02
0.03
0.04
0.05
0.06
0.07
0.08
0.09
0.1
0 5 10 15 20 25
Cumulative Run Time (hr)
Ste
ady
Sta
te F
lux
at 2
5 °C
(g
pm
/ft2 )
V = 7 fps
V = 9 fps
V = 11 fps
V = 13 fps
V = 15 fps
V = 7 Data
V = 9 Data
V = 11 Data
V = 13 Data
V = 15 Data
V = 9.6 Data
V = 7.5 Data
V = 10.0 Data
Flux = 2.091x10⁻³ V1.3418 (1 - 1.194x10⁻² tadj)
where tadj = time for time ≤ 13.5 hr = 13.5 for time > 13.5 hr
Figure 3.16 Fitted Data for Flux versus Velocity and Time

WSRC-TR-2002-00108, Rev. 0SRT-RPP-2002-00041, Rev. 0
Page 27 of 82
0
0.01
0.02
0.03
0.04
0.05
0.06
0.07
0.08
0.09
0.1
0 5 10 15 20 25
Cumulative Run Time (hr)
Ste
ady
Sta
te F
lux
at 2
5 °C
(g
pm
/ft2 )
V = 7 fps
V = 9 fps
V = 11 fps
V = 13 fps
V = 15 fps
V = 7 Data
V = 9 Data
V = 11 Data
V = 13 Data
V = 15 Data
V = 9.6 (11) Data
V = 7.5 (11) Data
V = 10.0 (11) Data
Flux = 1.953x10⁻³ V1.3567 Q-0.01968(1 - 8.437x10⁻³ timeadj)
where timeadj = time for time ≤ 13.5 hr = 13.5 for time > 13.5 hr
0
1 00 0
2 00 0
3 00 0
4 00 0
5 00 0
0 2 4 6 8 1 0 12 1 4Ad jus te d T im e (hr )
To
tal
Org
an
ics
,
TB
P+
NP
H (
mg
/L)
Figure 3.17 Fitted Data for Flux versus Velocity, Time, and Organics
3.5 Quality Assurance
This task was conducted per the requirements of a Task Technical & Quality Assurance Planthat was approved by both SRTC and RPP-WTP personnel (technical & QA manager).11
These tests were not HLW form affecting. Therefore, the Quality Assurance Requirementsand Description (DOE/RW-0333P), the principle quality assurance requirements for theCivilian Radioactive Waste Management Program, did not apply to this work. All data wasrecorded in a Laboratory Notebook.12
4.0 Conclusions
1. The presence of tributyl phosphate and normal paraffin hydrocarbon (dodecane) atconcentrations up to approximately 2500 mg/L of each has no effect on flux rate for filtrationof an AZ-101 3.5 wt% slurry simulant for a 0.1 µm sintered metal Mott filter element.
2. If a concentration exists wherein the flux is affected (de minimis), it is above the testedlevels.
3. The AZ-101 slurry simulant was filtered to an insoluble solids content of up to 6 wt%without the flux deteriorating below the lower limit of 0.014 gpm/ft2.

WSRC-TR-2002-00108, Rev. 0SRT-RPP-2002-00041, Rev. 0
Page 28 of 82
4. The permeate concentration of TBP was always less than 1 mg/L and the dodecane wasalways less than the detection limit of ~0.12 mg/L. Neither of these passed through the filterat a level higher than its solubility and so were concentrated in the slurry.
5. Cleaning of the system after use with the organics proved difficult using only water and nitricacid. It should be noted that the concentrations of separable organics were much higher thanshould actually be seen in the WTP. We recommend that the effect of TBP and NPH bestudied further during filter cleaning tests.

WSRC-TR-2002-00108, Rev. 0SRT-RPP-2002-00041, Rev. 0
Page 29 of 82
5.0 Appendices
5.1 Appendix – Supernate Recipe
Volume of Feed Made from this Recipe 8 Liters
Weigh a LARGE MIXING VESSEL of at least 8000 ml capacity
ADD THE FOLLOWING COMPOUNDS:
Transition Metals and Complexing Agents Formula Mass Needed (g) Actual Wt (g)
Alumimum Nitrate Al(NO3)3•9H2O 1186.521 1186.52
Ammonium Nitrate NH4NO3 11.759 11.76
Cesium Nitrate CsNO3 0.438 0.438
Zirconyl Nitrate ZrO(NO3)2•xH2O 0.067 0.067
Sodium Chloride NaCl 2.631 2.633
Sodium Fluoride NaF 32.06 32.064
Sodium Chromate Na2CrO4 18.189 18.1912
Sodium Sulfate Na2SO4 209.021 209.02
Sodium Perrhenate NaReO4 0.468 0.4619
ADD Formula Mass Needed (g) Actual Wt (g)
Water H2O 1600 1600.00
MIX THOROUGHLY TO DISSOLVE THE SALTS.
IN A SEPARATE CONTAINER MIX THE FOLLOWING:
Formula Mass Needed (g) Actual Wt (g)
Sodium Hydroxide NaOH 639.284 639.26
Potassium Hydroxide KOH 53.085 53.09
Water H2O 800 800.00
MIX THOROUGHLY TO DISSOLVE THE SODIUM HYDROXIDE AND POTASSIUM HYDROXIDE.
ADD Mass Needed (g) Actual Wt (g)
Sodium Phosphate Na3PO4•12H2O 48.117 48.12
Water H2O 1600 1600.00
MIX THOROUGHLY. THEN ADD THIS SOLUTION SLOWLY TO THE MIXING VESSEL WHILEMAINTAINING AGITATION.ADD Formula Mass Needed (g) Actual Wt (g)
Sodium Carbonate Na2CO3 326.057 326.06
MIX THOROUGHLY.
ADD Formula Mass Needed (g) Actual Wt (g)
Sodium Nitrate NaNO3 10.162 10.16
Sodium Nitrite NaNO2 780.663 780.66
MIX THOROUGHLY.
NEXT ADD THE FINAL WATER ADDITION Formula Mass Needed (g) Actual Wt (g)
Water H2O 2371.31 2371.30

WSRC-TR-2002-00108, Rev. 0SRT-RPP-2002-00041, Rev. 0
Page 30 of 82
5.2 Appendix – Simulant Compositions
The final simulant was made up from 4.0 liters of supernate simulant, 1.84 liters of solidssimulant #1 and 0.25 liters of solids simulant #3. Trim chemicals, in amounts shown below, werethen added to replace the washed sodium and anions. The final volume was approximately 6.3liters.
Table 5.1 Supernate Simulant SamplesFirst Supernate Sample Second Supernate Sample Overall
LIMS #300- 167560 167560 Average 169527 169527-D Average Average*
ICPES (mg/L) Al 5860 5740 5800 5060 5080 5070 5070
B <2.1 <2.1 <2.1 <2.1
Ba <0.12 <0.12 <0.12 <0.12
Ca 0.547 0.459 0.503 <0.4 <0.4
Cd <0.14 <0.14 <0.14 <0.14
Co <0.44 <0.44 <0.44 <0.44
Cr 720 721 720 727 727 727 724
Cu <0.8 <0.8 <0.5 <0.5
Fe <0.44 <0.44 <0.44 <0.44
Li 1.99 1.97 1.98 <1 <1
Mg <0.84 <0.84 <0.84 <0.84
Mn <0.09 <0.09 <0.09 <0.09
Mo <1 <1 <1 <1
Na 101000 100000 100500 114000 112000 113000 106750
Ni <0.62 <0.62 <0.62 <0.62
P 528 539 533 516 505 511 522
Pb <6.9 <6.9 <6.9 <6.9
Si 8.83 10.4 9.61 4.35 4.76 4.56 4.56
Sn <2.6 <2.6 <2.6 <2.6
Sr <0.04 <0.04 <0.02 <0.02
Ti <1.4 <1.4 <1.4 <1.4
V <1.3 <1.3 <1.3 <1.3
Zn <3.7 <3.7 <3.7 <3.7
Zr <0.6 <0.6 <0.48 <0.48
La <7 <7 <7 <7
K 3840 3860 3850 3910 3920 3915 3883
Re 40.0 40.3 40.2 39.5 39.3 39.4 39.8
S 6380 6330 6355 6180 6130 6155 6255
Ag <3 <3
Ce <7.7 <7.7
Nd <3.0 <3.0

WSRC-TR-2002-00108, Rev. 0SRT-RPP-2002-00041, Rev. 0
Page 31 of 82
Supernate Simulant Samples (continued)First Supernate Sample Second Supernate Sample Overall
LIMS #300- 167560 167560 Average 169527 169527-D Average Average*
IC (mg/L) F 1570 1574 1572 NA NA 1572 1572
formate <100 <100 <100 NA NA
Cl 139 141 140 NA NA 140 140
NO2- 60805 61724 61265 NA NA 61265 61265
NO3- 61724 62704 62214 NA NA 62214 62214
PO4(-3) 1292 1385 1339 NA NA 1339 1339
SO4(-2) 21402 21385 21394 NA NA 21394 21394
oxalate <100 <101 NA NA 0
Carbon (mg/L) TOC 4.60 4.60 4.60 NA NA 4.60 4.60
TIC <1 <1 <1 NA NA <1
TC 5.03 5.03 5.03 NA NA 5.03 5.03
Free OH NA NA NA NA NA NA
Solids Total 27.5 27.6 27.5 NA NA 27.5 27.5
Specific Gravity 1.244 1.241 1.243 NA NA 1.243 1.24
Estimated Sp Gr 1.198 1.200
* Average for Al, Li, Si from second sample only due to drop (precipitation).Values < detection limit not shown in averages.

WSRC-TR-2002-00108, Rev. 0SRT-RPP-2002-00041, Rev. 0
Page 32 of 82
Table 5.2 Sludge Solids Sample #1: Composition of solids filtered from sample.
LIMS #300- 167562 167564 MeanICPES (mg/kg) Ag 351 349 350
Al 791 799 795B NA NA NABa 257 254 255Ca 669 737 703Cd 3210 3160 3185Ce 341 306 323Co 415 413 414Cr 329 327 328Cu 139 144 141Fe 41700 40900 41300K 673 759 716La 1610 1580 1595Li <10 <10
Mg 63.1 62.8 63.0Mn 989 981 985Mo <20 <20Na 8000 8090 8045Nd 1110 1080 1095Ni 2520 2490 2505P 1130 1050 1090
Pb 486 475 480Re 17.4 18.6 18.0S 335 347 341Si 2680 4090 3385Sn <50 <50Sr 122 120 121Ti 78.8 75.7 77.3V <15 <15Zn 140 139 140Zr 13400 13300 13350
Original Sample (prior to filtration)Solids Total 14.9 14.8 14.8
Insoluble 13.7 13.1 13.4Soluble (calculated) 1.18 1.61 1.40

WSRC-TR-2002-00108, Rev. 0SRT-RPP-2002-00041, Rev. 0
Page 33 of 82
Table 5.3 Sludge Solids Sample #2: Composition of solids filtered from sample.
LIMS #300- 167566 167568 MeanICPES (mg/kg) Ag 186 182 184
Al 400 385 393B NA NA NABa 135 133 134Ca 777 771 774Cd 1680 1650 1665Ce 176 180 178Co 221 217 219Cr 176 171 174Cu 73.2 74.4 73.8Fe 21900 21800 21850K 395 433 414La 848 854 851Li <10 <10 NA
Mg 42.2 36.8 39.5Mn 523 520 521Mo <20 <20 NANa 3950 3890 3920Nd 555 537 546Ni 1320 1290 1305P 316 234 275
Pb 270 253 262Re 7.91 6.30 7.10S 173 153 163Si 3240 3290 3265Sn <50 <50 NASr 64.0 64.0 64.0Ti 42.3 39.7 41.0V <15 <15 NAZn 73.7 72.3 73.0Zr 6970 6930 6950
Original Sample (prior to filtration)Solids Total 8.05 8.00 8.03
Insoluble 7.25 7.19 7.22Soluble (calculated) 0.80 0.81 0.81

WSRC-TR-2002-00108, Rev. 0SRT-RPP-2002-00041, Rev. 0
Page 34 of 82
Table 5.4 Sludge Solids Sample #3: Composition of solids filtered from sample.
LIMS #300- 169717a 169717b CalculatedICPES (mg/kg) Ag 263
Al 597BBa 192Ca 528Cd 2392Ce 243Co 311Cr 246Cu 106Fe
Composition same asSample #2, but moreconcentrated. 31017
K 538La 1198LiMg 47.3Mn 740Mo
Calculated compositionbased on ratioing totalsolids.
Na 6042Nd 822Ni 1881P 819Pb 361Re 13.5S 256Si 2542SnSr 91.2Ti 58.0VZn 105Zr 10026
Original Sample (prior to filtration)Solids (wt%) Total 11.2 11.1 11.1
Insoluble 9.97 9.73 9.85Soluble (calculated) 1.21 1.32 1.27

WSRC-TR-2002-00108, Rev. 0SRT-RPP-2002-00041, Rev. 0
Page 35 of 82
Table 5.5 Sludge Sample #1: Composition of filtrate from sample.
LIMS #300- 167561 167563 Averagemg/L mg/L mg/L
ICPES Ag <3 <3 <3Al 5.08 <2.4 5.08B 16.4 26.9 21.6Ba <0.12 <0.12 <0.12Ca 15.2 11.9 13.6Cd <0.14 <0.14 <0.14Ce <7.7 <7.7 <7.7Co <0.44 <0.44 <0.44Cr 4.52 6.66 5.59Cu <0.6 <0.6 <0.6Fe <0.44 <0.44 <0.44K 313 444 378La <7 <7 <7Li NA NA NA
Mg 3.71 3.98 3.84Mn <0.09 <0.09 <0.09Mo 9.83 15.4 12.6Na 4190 6150 5170Nd <2.6 <2.6 <2.6Ni <0.62 <0.62 <0.62P <6.8 <6.8 <6.8
Pb <6.9 <6.9 <6.9Re 12.0 18.0 15.0S 254 363 308Si <1.3 <1.3 <1.3Sn NA NA NASr <0.15 <0.15 <0.15Ti <1.4 <1.4 <1.4V NA NA NAZn <3.7 <3.7 <3.7Zr <0.48 <0.48 <0.48
IC fluoride 47.0 69.0 58.0formate <100 <100 <100chloride 85.0 108 96.5nitrite 2916 4166 3541nitrate 2655 3916 3286
phosphate <100 <100 <100sulfate 572 837 705oxalate <100 <100 <100

WSRC-TR-2002-00108, Rev. 0SRT-RPP-2002-00041, Rev. 0
Page 36 of 82
Table 5.6 Sludge Sample #2: Composition of filtrate from sample.
LIMS #300- 167565 167567 Averagemg/L mg/L mg/L
ICPES Ag <3 <3 <3Al <2.4 <2.4 <2.4B 15.0 14.8 14.9Ba <0.12 <0.12 <0.12Ca 8.90 10.1 9.52Cd <0.14 <0.14 <0.14Ce <7.7 <7.7 <7.7Co <0.44 <0.44 <0.44Cr 2.98 3.00 2.99Cu <0.6 <0.6 <0.6Fe <0.44 <0.44 <0.44K 216 227 222La <7 <7 <7Li NA NA NA
Mg 1.59 2.03 1.81Mn <0.09 <0.09 <0.09Mo 6.90 6.48 6.69Na 2910 2790 2850Nd <2.6 <2.6 <2.6Ni <0.62 <0.62 <0.62P <6.8 <6.8 <6.8
Pb <6.9 <6.9 <6.9Re 7.81 7.78 7.79S 160 162 161Si <1.3 <1.3 <1.3Sn NA NA NASr <0.15 <0.15 <0.15Ti <1.4 <1.4 <1.4V NA NA NAZn <3.7 <3.7 <3.7Zr <0.48 <0.48 <0.48
IC fluoride 38.0 37.0 37.5formate <100 <100 <100chloride 69.0 67.0 68.0nitrite 1871 1833 1852nitrate 1627 1595 1611
phosphate <100 <100 <100sulfate 382 378 380oxalate <100 <100 <100

WSRC-TR-2002-00108, Rev. 0SRT-RPP-2002-00041, Rev. 0
Page 37 of 82
Table 5.7 Sludge Sample #3: Composition of filtrate calculated from composition ofSample #2 by ratio.
Calculated (mg/L)Ag 0Al 4.42B 18.9Ba 0Ca 11.8Cd 0Ce 0Co 0Cr 4.87Cu 0Fe 0K 330La 0Li 0
Mg 3.35Mn 0Mo 11.0Na 4506Nd 0Ni 0P 0
Pb 0Re 13.1S 269Si 0Sn 0Sr 0Ti 0V 0Zn 0Zr 0
fluoride 50.5formate 0chloride 84.1nitrite 3086nitrate 2863
phosphate 0sulfate 614oxalate 0

WSRC-TR-2002-00108, Rev. 0SRT-RPP-2002-00041, Rev. 0
Page 38 of 82
Table 5.8 Overall Compositions of Samples #1-3 Calculated from Solids and FiltrateAnalyses.
Sample #1 Sample #2 Sample #3mg/L mg/L mg/L
Metals Ag 345 172 247Al 788 368 565B 20.3 14.4 18.0Ba 252 125 180Ca 705 734 508Cd 3137 1559 2249Ce 319 166 228Co 408 205 292Cr 328 165 236Cu 139 69.1 99.9Fe 40681 20462 29166K 1060 601 820La 1571 797 1126Li 0 0 0
Mg 65.6 38.8 47.7Mn 970 488 696Mo 11.8 6.45 10.5Na 12770 6420 9975Nd 1079 511 773Ni 2467 1222 1769P 1074 258 770
Pb 473 245 339Re 31.8 14.2 25.2S 625 308 497Si 3334 3058 2390Sn 0 0 0Sr 120 59.9 85.7Ti 76.1 38.4 54.6V 0 0 0Zn 138 68.4 98.6Zr 13150 6509 9428
Anions fluoride 54.4 36.2 48.2formate 0 0 0chloride 90.4 65.6 80.1nitrite 3318 1786 2941nitrate 3079 1554 2728
phosphate 0 0 0sulfate 660 367 585oxalate 0 0 0
Solids (wt%) Insoluble 13.4 7.22 9.85Soluble 1.40 0.805 1.27Total 14.8 8.03 11.1
Specific gravity 1.09 1.04 1.06

WSRC-TR-2002-00108, Rev. 0SRT-RPP-2002-00041, Rev. 0
Page 39 of 82
Table 5.9 Trim Chemicals Added
Chemical Amount (g)NaOH 141.01NaCl 0.25NaF 7.79NaNO2 204.04NaNO3 190.06Na3PO4*12H2O 12.45Na2SO4 71.60KNO3 18.14NaReO4 0.0548

WSR
C-T
R-2
002-
0010
8, R
ev. 0
SRT
-RP
P-2
002-
0004
1, R
ev. 0
Page
40
of 8
2
5.3
App
endi
x –
Exp
erim
enta
l Des
ign
Tab
le 5
.10
Exp
erim
enta
l Des
ign
Tab
le
Tes
t P
hase
TB
P/N
PH
Lev
el(e
ach)
(m
g/L
)R
unN
ame
Run
Ord
er(r
ando
miz
ed)
Fact
oria
lD
esig
n St
dO
rder
Fact
oria
lD
esig
nL
evel
Pre
ssur
e(p
sid)
Vel
ocity
(ft/s
)
Vol
umet
ric
Flow
rate
(gpm
)Sa
mpl
e T
ime
Cle
an w
ater
flu
xw
ater
Z-0
a0a
511
3.79
-w
ater
Z-0
b0b
1511
3.79
-w
ater
Z-0
c0c
2511
3.79
-N
O O
RG
AN
ICS
EX
PE
RIM
EN
TA
L D
ESI
GN
0Z
-11
900
4011
3.79
SS f
lux
"Z
-22
1-
-30
93.
10SS
flu
x"
Z-3
32
- +
3013
4.47
SS f
lux
"Z
-44
4+
+50
134.
47SS
flu
x"
Z-5
53
+ -
509
3.10
SS f
lux
"Z
-66
1000
4011
3.79
SS f
lux
"Z
-77
70a
407
2.41
SS f
lux
"Z
-88
80A
4015
5.16
SS f
lux
"Z
-99
5a0
2011
3.79
SS f
lux
"Z
-10
106
A0
6011
3.79
SS f
lux
"Z
-11
1111
0040
113.
79SS
flu
xC
olle
ct 2
lite
rs p
erm
eate
in 5
00 m
l fra
ctio
nsev
ery
500
ml p
erm
eate
Add
2 li
ters
new
fee
dL
OW
TB
P/N
PH
LE
VE
L E
XP
ER
IME
NT
AL
DE
SIG
N:
25 p
pm e
ach
TB
P &
NP
H a
dded
25L
-11
3+
-50
93.
10SS
flu
x"
L-2
29
0040
113.
79SS
flu
x"
L-3
38
0A40
155.
16SS
flu
x"
L-4
410
0040
113.
79SS
flu
x"
L-5
52
- +
3013
4.47
SS f
lux
"L
-66
70a
407
2.41
SS f
lux
"L
-77
1-
-30
93.
10SS
flu
x"
L-8
85
a020
113.
79SS
flu
x"
L-9
94
+ +
5013
4.47
SS f
lux
"L
-10
106
A0
6011
3.79
SS f
lux
"L
-11
1111
0040
113.
79SS
flu
xC
olle
ct 2
lite
rs p
erm
eate
in 5
00 m
l fra
ctio
ns"
--
ever
y 50
0 m
l per
mea
te

WSR
C-T
R-2
002-
0010
8, R
ev. 0
SRT
-RP
P-2
002-
0004
1, R
ev. 0
Page
41
of 8
2
Tab
le 5
.10
Exp
erim
enta
l Des
ign
Tab
le (
cont
inue
d)
Tes
t P
hase
TB
P/N
PH
Lev
el(e
ach)
(m
g/L
)R
unN
ame
Run
Ord
er(r
ando
miz
ed)
Fact
oria
lD
esig
n St
dO
rder
Fact
oria
lD
esig
nL
evel
Pre
ssur
e(p
sid)
Vel
ocity
(ft/s
)
Vol
umet
ric
Flow
rate
(gpm
)Sa
mpl
e T
ime
Add
2 li
ters
new
fee
dA
dd T
BP
/NP
H b
ack
to ~
25 p
pm e
ach
DE
TE
RM
INE
IM
PA
CT
LE
VE
L25
M-1
140
113.
79SS
flu
x75
M-2
240
113.
79SS
flu
x15
0M
-33
4011
3.79
SS f
lux
250
M-4
440
113.
79SS
flu
x50
0M
-55
4011
3.79
SS f
lux
750
M-6
640
113.
79SS
flu
x10
00M
-77
4011
3.79
SS f
lux
1250
M-8
840
113.
79SS
flu
x15
00M
-99
4011
3.79
SS f
lux
2000
M-1
010
4011
3.79
SS f
lux
2500
M-1
111
4011
3.79
SS f
lux
IMP
AC
T L
EV
EL
EX
PE
RIM
EN
TA
L D
ESI
GN
2500
H-1
19
0040
113.
79SS
flu
x"
H-2
27
0a40
72.
41SS
flu
x"
H-3
32
- +
3013
4.47
SS f
lux
"H
-44
5a0
2011
3.79
SS f
lux
"H
-55
1000
4011
3.79
SS f
lux
"H
-66
80A
4015
5.16
SS f
lux
"H
-77
3+
-50
93.
10SS
flu
x"
H-8
81
- -
309
3.10
SS f
lux
"H
-99
4+
+50
134.
47SS
flu
x"
H-1
010
6A
060
113.
79SS
flu
x"
H-1
111
1100
4011
3.79
SS f
lux
Col
lect
2 li
ters
per
mea
te I
N 5
00 m
l inc
rem
ents
ever
y 50
0 m
lpe
rmea
teC
lean
wat
er f
lux
wat
erH
-0a
0a5
113.
79-
wat
erH
-0b
0b15
113.
79-
wat
erH
-0c
0c25
113.
79-

WSR
C-T
R-2
002-
0010
8, R
ev. 0
SRT
-RP
P-2
002-
0004
1, R
ev. 0
Page
42
of 8
2
5.4
App
endi
x –
Exp
erim
enta
l Res
ults
Run
Tar
get
Vel
ocit
y(f
ps)
Tar
get
Pre
ssur
e(p
si)
Tim
e(m
in)
Flo
w(g
pm)
Flo
w(f
ps)
Inle
t P
(psi
g)O
utle
t P
(psi
g)
Tim
e fo
r40
ml o
fP
erm
eate
(sec
)
Run
Tim
e(m
in)
Flu
x(g
pm/f
t2 )T
emp
(°C
)T
emp.
Com
p.
Cor
r.F
lux
(gpm
/ft2 )
Z-1
03.
8411
.15
4340
53.1
60
0.06
0722
1.08
906
0.06
62
53.
9411
.45
4239
59.8
95
0.05
3923
1.05
8322
0.05
71
103.
8011
.04
4340
57.9
810
0.05
5723
1.05
8322
0.05
89
153.
8511
.18
4440
59.1
150.
0546
241.
0286
490.
0562
203.
8911
.30
4340
60.2
920
0.05
3624
1.02
8649
0.05
51
253.
6610
.63
4340
61.1
325
0.05
2824
1.02
8649
0.05
43
303.
7710
.95
4138
63.4
630
0.05
0924
1.02
8649
0.05
23
1140
Mea
n:3.
8211
.10
42.7
139
.57
Mea
n St
eady
Sta
te:
0.05
3941
.14
Z-2
03.
068.
8932
3098
.14
00.
0329
241.
0286
490.
0338
53.
048.
8332
2998
.97
50.
0326
241.
0286
490.
0336
103.
109.
0134
3198
.67
100.
0327
241.
0286
490.
0337
153.
139.
0934
3110
4.96
150.
0308
251
0.03
08
203.
309.
5931
2811
1.38
200.
0290
231.
0583
220.
0307
253.
068.
8930
2711
3.7
250.
0284
231.
0583
220.
0301
303.
088.
9530
2711
4.75
300.
0281
231.
0583
220.
0298
930
Mea
n:3.
119.
0331
.86
29.0
0M
ean
Stea
dy S
tate
:0.
0303
30.4
3Z
-30
4.47
12.9
835
2748
.53
00.
0665
231.
0583
220.
0704
54.
5013
.07
3231
52.7
25
0.06
1323
1.05
8322
0.06
48
104.
4813
.01
3228
53.9
810
0.05
9824
1.02
8649
0.06
15
154.
4012
.78
3329
53.8
715
0.05
9924
1.02
8649
0.06
17
204.
5913
.33
3329
5420
0.05
9824
1.02
8649
0.06
15
254.
4913
.04
3330
52.9
425
0.06
1024
1.02
8649
0.06
27
304.
5513
.22
3329
56.1
730
0.05
7525
10.
0575
1330
Mea
n:4.
5013
.06
33.0
029
.00
Mea
n St
eady
Sta
te:
0.06
0931
.00
Z-4
04.
0111
.65
4947
46.3
40
0.06
9727
0.94
5607
0.06
59
54.
1812
.14
5248
47.8
45
0.06
7528
0.91
9786
0.06
21
104.
3412
.61
5147
51.2
910
0.06
3028
0.91
9786
0.05
79
154.
3412
.61
5348
52.2
315
0.06
1828
0.91
9786
0.05
69

WSR
C-T
R-2
002-
0010
8, R
ev. 0
SRT
-RP
P-2
002-
0004
1, R
ev. 0
Page
43
of 8
2
Run
Tar
get
Vel
ocit
y(f
ps)
Tar
get
Pre
ssur
e(p
si)
Tim
e(m
in)
Flo
w(g
pm)
Flo
w(f
ps)
Inle
t P
(psi
g)O
utle
t P
(psi
g)
Tim
e fo
r40
ml o
fP
erm
eate
(sec
)
Run
Tim
e(m
in)
Flu
x(g
pm/f
t2 )T
emp
(°C
)T
emp.
Com
p.
Cor
r.F
lux
(gpm
/ft2 )
204.
3412
.61
5350
52.9
120
0.06
1027
0.94
5607
0.05
77
254.
3712
.69
5349
52.0
525
0.06
2027
0.94
5607
0.05
87
304.
3212
.55
5350
52.8
300.
0612
280.
9197
860.
0563
1350
Mea
n:4.
2712
.41
52.0
048
.43
Mea
n St
eady
Sta
te:
0.05
7450
.21
Z-5
03.
088.
9550
4871
.53
00.
0451
260.
9723
320.
0439
53.
008.
7149
4779
.06
50.
0408
260.
9723
320.
0397
102.
988.
6652
4981
.06
100.
0398
260.
9723
320.
0387
153.
038.
8052
5083
.23
150.
0388
251
0.03
88
203.
209.
3051
4887
.53
200.
0369
260.
9723
320.
0359
253.
229.
3551
4890
.13
250.
0358
260.
9723
320.
0348
303.
088.
9552
5083
.49
300.
0387
260.
9723
320.
0376
950
Mea
n:3.
088.
9651
.00
48.5
7M
ean
Stea
dy S
tate
:0.
0368
49.7
9Z
-60
3.78
10.9
841
3863
.54
00.
0508
201.
1539
160.
0586
53.
7911
.01
4239
64.4
25
0.05
0120
1.15
3916
0.05
78
103.
7911
.01
4340
67.6
610
0.04
7721
1.12
0909
0.05
35
153.
7710
.95
4138
68.6
815
0.04
7022
1.08
906
0.05
12
203.
7810
.98
4238
69.2
520
0.04
6622
1.08
906
0.05
08
253.
7510
.89
4239
69.0
225
0.04
6823
1.05
8322
0.04
95
303.
7510
.89
4239
68.4
330
0.04
7224
1.02
8649
0.04
85
1140
Mea
n:3.
7710
.96
41.8
638
.71
Mea
n St
eady
Sta
te:
0.04
9640
.29
Z-7
02.
406.
9741
3997
.52
00.
0331
251
0.03
31
52.
376.
8841
3910
0.21
50.
0322
251
0.03
22
102.
477.
1842
4010
6.14
100.
0304
251
0.03
04
152.
427.
0342
4010
8.91
150.
0297
260.
9723
320.
0288
202.
417.
0042
4011
1.24
200.
0290
251
0.02
90
252.
406.
9742
4011
4.4
250.
0282
251
0.02
82
302.
406.
9742
4011
5.77
300.
0279
251
0.02
79
740
Mea
n:2.
417.
0041
.71
39.7
1M
ean
Stea
dy S
tate
:0.
0285
40.7
1Z
-80
5.07
14.7
343
3836
.89
00.
0875
241.
0286
490.
0900

WSR
C-T
R-2
002-
0010
8, R
ev. 0
SRT
-RP
P-2
002-
0004
1, R
ev. 0
Page
44
of 8
2
Run
Tar
get
Vel
ocit
y(f
ps)
Tar
get
Pre
ssur
e(p
si)
Tim
e(m
in)
Flo
w(g
pm)
Flo
w(f
ps)
Inle
t P
(psi
g)O
utle
t P
(psi
g)
Tim
e fo
r40
ml o
fP
erm
eate
(sec
)
Run
Tim
e(m
in)
Flu
x(g
pm/f
t2 )T
emp
(°C
)T
emp.
Com
p.
Cor
r.F
lux
(gpm
/ft2 )
55.
1715
.02
4338
43.1
15
0.07
4925
10.
0749
105.
1314
.90
4239
44.2
100.
0731
241.
0286
490.
0752
155.
2415
.22
4338
45.4
815
0.07
1025
10.
0710
205.
1414
.93
4339
45.4
120
0.07
1125
10.
0711
255.
0814
.76
4339
45.4
325
0.07
1126
0.97
2332
0.06
91
305.
0614
.70
4339
46.2
730
0.06
9826
0.97
2332
0.06
79
1540
Mea
n:5.
1314
.89
42.8
638
.57
Mea
n St
eady
Sta
te:
0.06
9840
.71
Z-9
03.
7810
.98
2219
57.2
00.
0565
231.
0583
220.
0597
53.
6910
.72
2017
68.4
50.
0472
211.
1209
090.
0529
103.
7310
.84
2017
72.4
510
0.04
4621
1.12
0909
0.05
00
153.
6910
.72
2017
71.5
615
0.04
5121
1.12
0909
0.05
06
203.
7510
.89
2017
69.4
320
0.04
6522
1.08
906
0.05
07
253.
9011
.33
2118
62.2
250.
0519
231.
0583
220.
0549
303.
9111
.36
2219
63.9
930
0.05
0522
1.08
906
0.05
50
1120
Mea
n:3.
7810
.98
20.7
117
.71
Mea
n St
eady
Sta
te:
0.05
2819
.21
Z-1
00
3.10
9.01
5856
71.5
50
0.04
5123
1.05
8322
0.04
78
53.
229.
3560
5781
.14
50.
0398
231.
0583
220.
0421
103.
339.
6760
5886
.81
100.
0372
241.
0286
490.
0383
153.
229.
3560
5787
.14
150.
0371
241.
0286
490.
0381
202.
908.
4260
5789
.87
200.
0359
251
0.03
59
253.
7410
.86
6056
93.7
125
0.03
4525
10.
0345
303.
6010
.46
5955
94.0
430
0.03
4325
10.
0343
1160
Mea
n:3.
309.
5959
.57
56.5
7M
ean
Stea
dy S
tate
:0.
0357
58.0
7Z
-11
03.
7010
.75
4239
66.2
80
0.04
8720
1.15
3916
0.05
62
53.
5510
.31
4138
72.3
75
0.04
4621
1.12
0909
0.05
00
103.
7510
.89
4138
74.5
410
0.04
3322
1.08
906
0.04
72
153.
8311
.13
4137
73.5
150.
0439
231.
0583
220.
0465
203.
8511
.18
4239
69.7
420
0.04
6324
1.02
8649
0.04
76
253.
8011
.04
4239
70.9
525
0.04
5524
1.02
8649
0.04
68
303.
8211
.10
4340
71.8
300.
0450
231.
0583
220.
0476

WSR
C-T
R-2
002-
0010
8, R
ev. 0
SRT
-RP
P-2
002-
0004
1, R
ev. 0
Page
45
of 8
2
Run
Tar
get
Vel
ocit
y(f
ps)
Tar
get
Pre
ssur
e(p
si)
Tim
e(m
in)
Flo
w(g
pm)
Flo
w(f
ps)
Inle
t P
(psi
g)O
utle
t P
(psi
g)
Tim
e fo
r40
ml o
fP
erm
eate
(sec
)
Run
Tim
e(m
in)
Flu
x(g
pm/f
t2 )T
emp
(°C
)T
emp.
Com
p.
Cor
r.F
lux
(gpm
/ft2 )
1140
Mea
n:3.
7610
.91
41.7
138
.57
Mea
n St
eady
Sta
te:
0.04
7140
.14
L-1
03.
018.
7452
4964
.79
00.
0498
260.
9723
320.
0485
52.
868.
3150
4879
.11
50.
0408
260.
9723
320.
0397
103.
008.
7149
4784
.95
100.
0380
251
0.03
80
152.
998.
6950
4887
.73
150.
0368
251
0.03
68
202.
978.
6351
4889
.58
200.
0360
241.
0286
490.
0371
252.
968.
6053
5087
.67
250.
0368
241.
0286
490.
0379
303.
229.
3551
4890
.01
300.
0359
251
0.03
59
950
Mea
n:3.
008.
7250
.86
48.2
9M
ean
Stea
dy S
tate
:0.
0369
49.5
7L
-20
3.60
10.4
642
3955
.96
00.
0577
260.
9723
320.
0561
53.
6410
.57
4138
65.2
15
0.04
9524
1.02
8649
0.05
09
103.
6410
.57
4037
71.1
810
0.04
5423
1.05
8322
0.04
80
153.
5910
.43
4037
73.6
715
0.04
3823
1.05
8322
0.04
64
203.
6410
.57
4138
70.9
320
0.04
5524
1.02
8649
0.04
68
253.
6310
.54
4037
70.4
325
0.04
5925
10.
0459
303.
7911
.01
4138
73.2
630
0.04
4125
10.
0441
1140
Mea
n:3.
6510
.59
40.7
137
.71
Mea
n St
eady
Sta
te:
0.04
5839
.21
L-3
05.
2215
.16
4338
36.6
80
0.08
8025
10.
0880
55.
0714
.73
4339
39.1
55
0.08
2527
0.94
5607
0.07
80
105.
0414
.64
4137
42.8
510
0.07
5427
0.94
5607
0.07
13
155.
0814
.76
4035
46.2
215
0.06
9926
0.97
2332
0.06
79
205.
0714
.73
4136
48.3
320
0.06
6825
10.
0668
255.
2115
.13
4338
48.3
425
0.06
6825
10.
0668
305.
2015
.11
4440
45.8
630
0.07
0425
10.
0704
1540
Mea
n:5.
1314
.89
42.1
437
.57
Mea
n St
eady
Sta
te:
0.06
8039
.86
L-4
03.
8211
.10
4138
60.8
30
0.05
3125
10.
0531
53.
6410
.57
4239
65.0
85
0.04
9624
1.02
8649
0.05
10
103.
7310
.84
3936
71.0
710
0.04
5424
1.02
8649
0.04
67
153.
8411
.15
4139
71.8
515
0.04
4926
0.97
2332
0.04
37

WSR
C-T
R-2
002-
0010
8, R
ev. 0
SRT
-RP
P-2
002-
0004
1, R
ev. 0
Page
46
of 8
2
Run
Tar
get
Vel
ocit
y(f
ps)
Tar
get
Pre
ssur
e(p
si)
Tim
e(m
in)
Flo
w(g
pm)
Flo
w(f
ps)
Inle
t P
(psi
g)O
utle
t P
(psi
g)
Tim
e fo
r40
ml o
fP
erm
eate
(sec
)
Run
Tim
e(m
in)
Flu
x(g
pm/f
t2 )T
emp
(°C
)T
emp.
Com
p.
Cor
r.F
lux
(gpm
/ft2 )
203.
8211
.10
4139
72.4
220
0.04
4625
10.
0446
253.
8211
.10
4139
73.0
525
0.04
4225
10.
0442
303.
8711
.24
4240
70.6
730
0.04
5725
10.
0457
1140
Mea
n:3.
7911
.01
41.0
038
.57
Mea
n St
eady
Sta
te:
0.04
4539
.79
L-5
04.
3812
.72
3228
44.5
10
0.07
2626
0.97
2332
0.07
05
54.
5813
.30
3329
52.4
95
0.06
1526
0.97
2332
0.05
98
104.
4712
.98
3228
56.8
210
0.05
6825
10.
0568
154.
4512
.93
3228
59.4
150.
0544
251
0.05
44
204.
6013
.36
3329
56.2
320
0.05
7425
10.
0574
254.
5813
.30
3329
55.5
125
0.05
8226
0.97
2332
0.05
66
304.
6413
.48
3430
54.0
730
0.05
9726
0.97
2332
0.05
81
1330
Mea
n:4.
5313
.15
32.7
128
.71
Mea
n St
eady
Sta
te:
0.05
6630
.71
L-6
02.
326.
7441
3997
.41
00.
0332
231.
0583
220.
0351
52.
326.
7442
4010
5.48
50.
0306
241.
0286
490.
0315
102.
467.
1541
3911
4.36
100.
0282
251
0.02
82
152.
447.
0941
3911
6.96
150.
0276
251
0.02
76
202.
406.
9742
4011
7.63
200.
0275
260.
9723
320.
0267
252.
406.
9742
4012
4.94
250.
0258
251
0.02
58
302.
366.
8642
4013
1.37
300.
0246
241.
0286
490.
0253
740
Mea
n:2.
396.
9341
.57
39.5
7M
ean
Stea
dy S
tate
:0.
0264
40.5
7L
-70
3.18
9.24
3230
76.3
80
0.04
2325
10.
0423
53.
098.
9833
3179
.61
50.
0406
251
0.04
06
103.
098.
9834
3281
.17
100.
0398
251
0.03
98
153.
129.
0634
3183
.27
150.
0388
260.
9723
320.
0377
203.
149.
1234
3292
.720
0.03
4824
1.02
8649
0.03
58
253.
088.
9533
3194
.36
250.
0342
231.
0583
220.
0362
303.
139.
0932
3096
.95
300.
0333
241.
0286
490.
0343
930
Mea
n:3.
129.
0633
.14
31.0
0M
ean
Stea
dy S
tate
:0.
0360
32.0
7L
-80
3.86
11.2
123
1959
.82
00.
0540
251
0.05
40

WSR
C-T
R-2
002-
0010
8, R
ev. 0
SRT
-RP
P-2
002-
0004
1, R
ev. 0
Page
47
of 8
2
Run
Tar
get
Vel
ocit
y(f
ps)
Tar
get
Pre
ssur
e(p
si)
Tim
e(m
in)
Flo
w(g
pm)
Flo
w(f
ps)
Inle
t P
(psi
g)O
utle
t P
(psi
g)
Tim
e fo
r40
ml o
fP
erm
eate
(sec
)
Run
Tim
e(m
in)
Flu
x(g
pm/f
t2 )T
emp
(°C
)T
emp.
Com
p.
Cor
r.F
lux
(gpm
/ft2 )
53.
7110
.78
2017
63.7
50.
0507
251
0.05
07
103.
7410
.86
2319
66.3
610
0.04
8725
10.
0487
153.
7210
.81
2219
67.3
515
0.04
7925
10.
0479
203.
6210
.52
2118
69.0
920
0.04
6726
0.97
2332
0.04
54
253.
6110
.49
2117
70.3
925
0.04
5925
10.
0459
303.
6710
.66
2118
70.6
230
0.04
5725
10.
0457
1120
Mea
n:3.
7010
.76
21.5
718
.14
Mea
n St
eady
Sta
te:
0.04
6319
.86
L-9
04.
3212
.55
5350
46.4
40
0.06
9525
10.
0695
54.
2312
.29
5147
51.6
65
0.06
2526
0.97
2332
0.06
08
104.
1712
.11
5148
53.9
110
0.05
9926
0.97
2332
0.05
82
154.
2612
.37
5047
58.4
215
0.05
5325
10.
0553
204.
2412
.32
5147
60.9
200.
0530
251
0.05
30
254.
2512
.35
4946
62.0
725
0.05
2024
1.02
8649
0.05
35
304.
1011
.91
4844
61.8
630
0.05
2225
10.
0522
1350
Mea
n:4.
2212
.27
50.4
347
.00
Mea
n St
eady
Sta
te:
0.05
3548
.71
L-1
00
2.35
6.83
5957
90.0
90
0.03
5826
0.97
2332
0.03
49
52.
447.
0959
5612
2.24
50.
0264
251
0.02
64
102.
838.
2260
5713
0.2
100.
0248
251
0.02
48
152.
707.
8460
5813
4.59
150.
0240
251
0.02
40
202.
617.
5860
5713
620
0.02
3725
10.
0237
252.
567.
4460
5713
8.64
250.
0233
251
0.02
33
302.
587.
4960
5714
1.8
300.
0228
241.
0286
490.
0234
1160
Mea
n:2.
587.
5059
.71
57.0
0M
ean
Stea
dy S
tate
:0.
0236
58.3
6L
-11
03.
5610
.34
4037
62.0
70
0.05
2025
10.
0520
53.
8011
.04
4340
68.7
50.
0470
241.
0286
490.
0484
103.
7310
.84
4239
73.3
210
0.04
4024
1.02
8649
0.04
53
153.
7610
.92
3835
81.2
115
0.03
9824
1.02
8649
0.04
09
203.
9611
.50
4239
78.3
120
0.04
1224
1.02
8649
0.04
24
253.
9911
.59
4340
74.0
925
0.04
3626
0.97
2332
0.04
24
303.
8311
.13
4037
77.7
830
0.04
1526
0.97
2332
0.04
04

WSR
C-T
R-2
002-
0010
8, R
ev. 0
SRT
-RP
P-2
002-
0004
1, R
ev. 0
Page
48
of 8
2
Run
Tar
get
Vel
ocit
y(f
ps)
Tar
get
Pre
ssur
e(p
si)
Tim
e(m
in)
Flo
w(g
pm)
Flo
w(f
ps)
Inle
t P
(psi
g)O
utle
t P
(psi
g)
Tim
e fo
r40
ml o
fP
erm
eate
(sec
)
Run
Tim
e(m
in)
Flu
x(g
pm/f
t2 )T
emp
(°C
)T
emp.
Com
p.
Cor
r.F
lux
(gpm
/ft2 )
1140
Mea
n:3.
8011
.05
41.1
438
.14
Mea
n St
eady
Sta
te:
0.04
1539
.64
M-1
03.
8211
.10
4339
57.6
00.
0561
231.
0583
220.
0593
53.
8611
.21
4137
64.8
35
0.04
9823
1.05
8322
0.05
27
50 m
g/L
103.
8411
.15
4238
63.3
810
0.05
1025
10.
0510
153.
8111
.07
4137
66.2
515
0.04
8726
0.97
2332
0.04
74
203.
7810
.98
4137
66.0
420
0.04
8927
0.94
5607
0.04
62
253.
8111
.07
4036
66.6
425
0.04
8526
0.97
2332
0.04
71
303.
7210
.81
4137
70.1
930
0.04
6026
0.97
2332
0.04
47
353.
7710
.95
4137
69.0
435
0.04
6826
0.97
2332
0.04
55
1140
Mea
n:3.
8011
.04
41.2
537
.25
Mea
n St
eady
Sta
te:
0.04
5139
.25
M-2
03.
8011
.04
4038
56.9
10
0.05
6726
0.97
2332
0.05
52
53.
8611
.21
4239
59.4
65
0.05
4327
0.94
5607
0.05
14
150
mg/
L10
3.83
11.1
341
3867
.43
100.
0479
260.
9723
320.
0466
153.
8411
.15
4340
63.4
815
0.05
0926
0.97
2332
0.04
95
203.
7710
.95
4340
63.7
820
0.05
0627
0.94
5607
0.04
79
253.
8411
.15
4137
67.9
325
0.04
7527
0.94
5607
0.04
50
303.
7410
.86
4340
67.8
230
0.04
7626
0.97
2332
0.04
63
1140
Mea
n:3.
8111
.07
41.8
638
.86
Mea
n St
eady
Sta
te:
0.04
5640
.36
M-3
03.
9211
.39
4238
56.9
40
0.05
6725
10.
0567
53.
7610
.92
4138
62.1
25
0.05
2026
0.97
2332
0.05
05
300
mg/
L10
3.82
11.1
043
4067
.72
100.
0477
260.
9723
320.
0464
153.
8011
.04
4239
65.8
715
0.04
9025
10.
0490
203.
8111
.07
4138
67.3
120
0.04
8025
10.
0480
253.
8211
.10
4139
68.6
625
0.04
7026
0.97
2332
0.04
57
303.
8011
.04
4138
72.2
230
0.04
4725
10.
0447
353.
8343
4071
.95
350.
0449
260.
9723
320.
0436
1140
Mea
n:3.
8211
.09
41.7
538
.75
Mea
n St
eady
Sta
te:
0.04
4740
.25
M-4
03.
8011
.04
4238
57.9
90
0.05
5724
1.02
8649
0.05
73
53.
7510
.89
4139
67.8
75
0.04
7624
1.02
8649
0.04
89

WSR
C-T
R-2
002-
0010
8, R
ev. 0
SRT
-RP
P-2
002-
0004
1, R
ev. 0
Page
49
of 8
2
Run
Tar
get
Vel
ocit
y(f
ps)
Tar
get
Pre
ssur
e(p
si)
Tim
e(m
in)
Flo
w(g
pm)
Flo
w(f
ps)
Inle
t P
(psi
g)O
utle
t P
(psi
g)
Tim
e fo
r40
ml o
fP
erm
eate
(sec
)
Run
Tim
e(m
in)
Flu
x(g
pm/f
t2 )T
emp
(°C
)T
emp.
Com
p.
Cor
r.F
lux
(gpm
/ft2 )
500
mg/
L10
3.80
11.0
442
3871
.06
100.
0454
241.
0286
490.
0467
153.
7510
.89
4141
70.5
315
0.04
5825
10.
0458
203.
8611
.21
4439
69.1
620
0.04
6725
10.
0467
253.
8511
.18
4240
74.6
625
0.04
3324
1.02
8649
0.04
45
303.
8611
.21
4339
74.0
230
0.04
3624
1.02
8649
0.04
49
1140
Mea
n:3.
8111
.07
42.1
439
.14
Mea
n St
eady
Sta
te:
0.04
4740
.64
M-5
03.
7810
.98
4239
62.8
80
0.05
1423
1.05
8322
0.05
44
53.
8311
.13
4340
68.9
35
0.04
6823
1.05
8322
0.04
96
1000
mg/
L10
3.86
11.2
141
3874
.73
100.
0432
231.
0583
220.
0457
153.
8411
.15
4138
79.6
615
0.04
0523
1.05
8322
0.04
29
203.
8511
.18
4138
77.0
220
0.04
1924
1.02
8649
0.04
31
253.
8811
.27
4239
76.7
825
0.04
2125
10.
0421
303.
8911
.30
4239
74.0
530
0.04
3625
10.
0436
1140
Mea
n:3.
8511
.18
41.7
138
.71
Mea
n St
eady
Sta
te:
0.04
2940
.21
M-5
b0
3.87
11.2
441
3863
.43
00.
0509
211.
1209
090.
0571
53.
8411
.15
4138
68.8
25
0.04
6922
1.08
906
0.05
11
1000
mg/
L10
3.77
10.9
541
3871
.64
100.
0451
231.
0583
220.
0477
153.
8711
.24
4340
71.8
915
0.04
4923
1.05
8322
0.04
75
203.
7510
.89
4138
73.2
520
0.04
4124
1.02
8649
0.04
53
253.
8711
.24
4340
69.7
825
0.04
6325
10.
0463
303.
7911
.01
4239
71.5
830
0.04
5125
10.
0451
353.
7210
.81
4037
74.3
135
0.04
3526
0.97
2332
0.04
23
1140
Mea
n:3.
8111
.07
41.5
038
.50
Mea
n St
eady
Sta
te:
0.04
6140
.00
M-6
03.
6810
.69
4138
61.9
60
0.05
2125
10.
0521
53.
8611
.21
4239
64.6
95
0.04
9924
1.02
8649
0.05
14
1500
mg/
L10
3.82
11.1
042
3969
.94
100.
0462
241.
0286
490.
0475
153.
8111
.07
4239
71.0
515
0.04
5525
10.
0455
203.
8111
.07
4239
70.0
420
0.04
6125
10.
0461
253.
8311
.13
4239
70.3
625
0.04
5926
0.97
2332
0.04
46
303.
8311
.13
4239
72.2
930
0.04
4725
10.
0447

WSR
C-T
R-2
002-
0010
8, R
ev. 0
SRT
-RP
P-2
002-
0004
1, R
ev. 0
Page
50
of 8
2
Run
Tar
get
Vel
ocit
y(f
ps)
Tar
get
Pre
ssur
e(p
si)
Tim
e(m
in)
Flo
w(g
pm)
Flo
w(f
ps)
Inle
t P
(psi
g)O
utle
t P
(psi
g)
Tim
e fo
r40
ml o
fP
erm
eate
(sec
)
Run
Tim
e(m
in)
Flu
x(g
pm/f
t2 )T
emp
(°C
)T
emp.
Com
p.
Cor
r.F
lux
(gpm
/ft2 )
1140
Mea
n:3.
8111
.06
41.8
638
.86
Mea
n St
eady
Sta
te:
0.04
4640
.36
M-7
03.
8011
.04
4239
61.0
50
0.05
2924
1.02
8649
0.05
44
53.
6710
.66
4138
68.4
75
0.04
7225
10.
0472
2000
mg/
L10
3.82
11.1
043
4070
.10
100.
0461
251
0.04
61
153.
8111
.07
4340
69.9
315
0.04
6225
10.
0462
203.
7911
.01
4239
71.7
920
0.04
5025
10.
0450
253.
8111
.07
4239
74.0
225
0.04
3625
10.
0436
303.
8111
.07
4340
74.1
330
0.04
3625
10.
0436
1140
Mea
n:3.
7911
.00
42.2
939
.29
Mea
n St
eady
Sta
te:
0.04
3640
.79
M-8
03.
8811
.27
4239
62.9
10
0.05
1325
10.
0513
53.
9111
.36
4138
67.1
50.
0481
251
0.04
81
2500
mg/
L10
3.85
11.1
842
3966
.81
100.
0483
251
0.04
83
153.
8811
.27
4310
67.7
815
0.04
7625
10.
0476
203.
7610
.92
4138
74.5
420
0.04
3325
10.
0433
253.
8611
.21
4239
70.8
425
0.04
5625
10.
0456
303.
8811
.27
4340
70.5
630
0.04
5825
10.
0458
1140
Mea
n:3.
8611
.21
42.0
034
.71
Mea
n St
eady
Sta
te:
0.04
4938
.36
M-9
03.
8711
.24
4239
51.0
20
0.06
3327
0.94
5607
0.05
99
53.
9711
.53
4239
55.0
15
0.05
8726
0.97
2332
0.05
71
3000
mg/
L10
3.81
11.0
742
3967
.56
100.
0478
260.
9723
320.
0465
153.
7810
.98
4138
69.4
415
0.04
6526
0.97
2332
0.04
52
203.
7911
.01
4239
70.6
620
0.04
5726
0.97
2332
0.04
44
253.
8511
.18
4340
68.8
525
0.04
6927
0.94
5607
0.04
44
303.
8211
.10
4340
70.6
330
0.04
5727
0.94
5607
0.04
32
1140
Mea
n:3.
8411
.16
42.1
439
.14
Mea
n St
eady
Sta
te:
0.04
4040
.64
M-1
00
3.85
11.1
842
3964
.09
00.
0504
251
0.05
04
53.
7710
.95
4239
70.9
15
0.04
5524
1.02
8649
0.04
68
4000
mg/
L10
3.77
10.9
543
4074
.32
100.
0435
231.
0583
220.
0460
153.
9911
.59
4440
75.9
115
0.04
2523
1.05
8322
0.04
50

WSR
C-T
R-2
002-
0010
8, R
ev. 0
SRT
-RP
P-2
002-
0004
1, R
ev. 0
Page
51
of 8
2
Run
Tar
get
Vel
ocit
y(f
ps)
Tar
get
Pre
ssur
e(p
si)
Tim
e(m
in)
Flo
w(g
pm)
Flo
w(f
ps)
Inle
t P
(psi
g)O
utle
t P
(psi
g)
Tim
e fo
r40
ml o
fP
erm
eate
(sec
)
Run
Tim
e(m
in)
Flu
x(g
pm/f
t2 )T
emp
(°C
)T
emp.
Com
p.
Cor
r.F
lux
(gpm
/ft2 )
203.
6510
.60
4138
77.3
420
0.04
1824
1.02
8649
0.04
30
253.
8211
.10
4239
77.2
225
0.04
1824
1.02
8649
0.04
30
303.
7510
.89
4239
77.0
630
0.04
1924
1.02
8649
0.04
31
1140
Mea
n:3.
8011
.04
42.2
939
.14
Mea
n St
eady
Sta
te:
0.04
3040
.71
M-1
10
3.86
11.2
143
4064
.97
00.
0497
231.
0583
220.
0526
53.
8611
.21
4340
68.0
95
0.04
7423
1.05
8322
0.05
02
5000
mg/
L10
3.79
11.0
141
3872
.63
100.
0445
231.
0583
220.
0471
153.
7610
.92
4239
72.3
615
0.04
4624
1.02
8649
0.04
59
203.
7310
.84
4037
75.7
420
0.04
2625
10.
0426
253.
7610
.92
4239
76.0
725
0.04
2525
10.
0425
303.
8211
.10
4340
76.8
130
0.04
2024
1.02
8649
0.04
32
1140
Mea
n:3.
8011
.03
42.0
039
.00
Mea
n St
eady
Sta
te:
0.04
2840
.50
H-1
03.
8511
.18
4239
59.7
60
0.05
4024
1.02
8649
0.05
56
53.
7810
.98
4138
66.1
55
0.04
8825
10.
0488
103.
9811
.56
4238
69.1
610
0.04
6724
1.02
8649
0.04
80
153.
8311
.13
4340
67.5
415
0.04
7823
1.05
8322
0.05
06
203.
9811
.56
4239
74.8
420
0.04
3224
1.02
8649
0.04
44
253.
9611
.50
4239
75.2
425
0.04
2924
1.02
8649
0.04
42
303.
9211
.39
4239
74.5
230
0.04
3325
10.
0433
1140
Mea
n:3.
9011
.33
42.0
038
.86
Mea
n St
eady
Sta
te:
0.04
3740
.43
H-2
02.
386.
9143
4110
4.33
00.
0310
251
0.03
10
52.
557.
4143
4011
5.35
50.
0280
241.
0286
490.
0288
102.
477.
1841
3812
1.33
100.
0266
241.
0286
490.
0274
152.
477.
1842
3912
5.12
150.
0258
241.
0286
490.
0265
202.
406.
9744
4112
1.79
200.
0265
241.
0286
490.
0273
252.
346.
8043
4012
5.42
250.
0257
251
0.02
57
302.
356.
8343
4012
5.65
300.
0257
251
0.02
57
740
Mea
n:2.
427.
0442
.71
39.8
6M
ean
Stea
dy S
tate
:0.
0263
41.2
9H
-30
4.43
12.8
732
2947
.18
00.
0684
251
0.06
84

WSR
C-T
R-2
002-
0010
8, R
ev. 0
SRT
-RP
P-2
002-
0004
1, R
ev. 0
Page
52
of 8
2
Run
Tar
get
Vel
ocit
y(f
ps)
Tar
get
Pre
ssur
e(p
si)
Tim
e(m
in)
Flo
w(g
pm)
Flo
w(f
ps)
Inle
t P
(psi
g)O
utle
t P
(psi
g)
Tim
e fo
r40
ml o
fP
erm
eate
(sec
)
Run
Tim
e(m
in)
Flu
x(g
pm/f
t2 )T
emp
(°C
)T
emp.
Com
p.
Cor
r.F
lux
(gpm
/ft2 )
54.
5113
.10
3127
56.9
75
0.05
6725
10.
0567
104.
5313
.16
3228
57.1
100.
0566
251
0.05
66
154.
5113
.10
3228
57.9
115
0.05
5825
10.
0558
204.
5013
.07
3228
58.5
320
0.05
5225
10.
0552
254.
5213
.13
3128
58.4
925
0.05
5226
0.97
2332
0.05
37
304.
5013
.07
3228
59.3
330
0.05
4425
10.
0544
1330
Mea
n:4.
5013
.07
31.7
128
.00
Mea
n St
eady
Sta
te:
0.05
4829
.86
H-4
03.
8411
.15
2319
64.9
70
0.04
9723
1.05
8322
0.05
26
53.
8511
.18
2319
66.0
25
0.04
8923
1.05
8322
0.05
18
103.
8011
.04
2319
69.4
910
0.04
6523
1.05
8322
0.04
92
153.
7810
.98
2320
70.4
415
0.04
5823
1.05
8322
0.04
85
203.
7610
.92
2319
73.1
200.
0442
231.
0583
220.
0468
253.
8311
.13
2219
75.7
525
0.04
2623
1.05
8322
0.04
51
303.
8011
.04
2219
76.9
430
0.04
2023
1.05
8322
0.04
44
1120
Mea
n:3.
8111
.06
22.7
119
.14
Mea
n St
eady
Sta
te:
0.04
5420
.93
H-5
03.
7210
.81
4138
64.3
70
0.05
0223
1.05
8322
0.05
31
53.
8211
.10
4239
68.3
50.
0473
231.
0583
220.
0500
103.
8411
.15
4138
72.5
510
0.04
4524
1.02
8649
0.04
58
153.
8811
.27
4239
72.2
150.
0447
241.
0286
490.
0460
203.
8611
.21
4239
72.6
420
0.04
4525
10.
0445
253.
8411
.15
4239
73.9
825
0.04
3725
10.
0437
303.
8111
.07
4138
74.8
300.
0432
251
0.04
32
1140
Mea
n:3.
8211
.11
41.5
738
.57
Mea
n St
eady
Sta
te:
0.04
4340
.07
H-6
05.
1915
.08
4239
41.7
50
0.07
7325
10.
0773
55.
2515
.25
4339
44.1
55
0.07
3125
10.
0731
105.
2715
.31
4439
45.8
910
0.07
0426
0.97
2332
0.06
84
155.
2915
.37
4439
46.7
315
0.06
9126
0.97
2332
0.06
72
205.
2515
.25
4439
48.2
820
0.06
6925
10.
0669
255.
2915
.37
4439
48.0
425
0.06
7226
0.97
2332
0.06
54
305.
2615
.28
4439
49.2
430
0.06
5626
0.97
2332
0.06
38

WSR
C-T
R-2
002-
0010
8, R
ev. 0
SRT
-RP
P-2
002-
0004
1, R
ev. 0
Page
53
of 8
2
Run
Tar
get
Vel
ocit
y(f
ps)
Tar
get
Pre
ssur
e(p
si)
Tim
e(m
in)
Flo
w(g
pm)
Flo
w(f
ps)
Inle
t P
(psi
g)O
utle
t P
(psi
g)
Tim
e fo
r40
ml o
fP
erm
eate
(sec
)
Run
Tim
e(m
in)
Flu
x(g
pm/f
t2 )T
emp
(°C
)T
emp.
Com
p.
Cor
r.F
lux
(gpm
/ft2 )
1540
Mea
n:5.
2615
.27
43.5
739
.00
Mea
n St
eady
Sta
te:
0.06
5841
.29
H-7
03.
068.
8951
4973
.84
00.
0437
251
0.04
37
53.
098.
9850
4886
.85
0.03
7225
10.
0372
103.
098.
9851
4989
.65
100.
0360
251
0.03
60
153.
078.
9252
4990
.51
150.
0357
260.
9723
320.
0347
203.
088.
9552
5092
.66
200.
0349
260.
9723
320.
0339
253.
058.
8652
5094
.24
250.
0343
260.
9723
320.
0333
303.
129.
0652
5010
0.17
300.
0322
251
0.03
22
353.
169.
1851
4910
0.59
350.
0321
251
0.03
21
950
Mea
n:3.
098.
9851
.38
49.2
5M
ean
Stea
dy S
tate
:0.
0328
50.3
1H
-80
3.13
9.09
3330
83.1
10
0.03
8923
1.05
8322
0.04
11
53.
149.
1233
3085
.32
50.
0378
241.
0286
490.
0389
103.
169.
1832
2988
.27
100.
0366
241.
0286
490.
0376
153.
149.
1232
2990
.07
150.
0359
241.
0286
490.
0369
203.
139.
0933
3094
.79
200.
0341
241.
0286
490.
0350
253.
139.
0933
3096
.94
250.
0333
241.
0286
490.
0343
303.
129.
0632
2997
.99
300.
0330
241.
0286
490.
0339
930
Mea
n:3.
149.
1132
.57
29.5
7M
ean
Stea
dy S
tate
:0.
0350
31.0
7H
-90
4.36
12.6
750
4656
.78
00.
0569
241.
0286
490.
0585
54.
3712
.69
5147
58.9
65
0.05
4825
10.
0548
104.
4412
.90
5147
62.1
210
0.05
2024
1.02
8649
0.05
35
154.
3912
.75
5248
60.9
515
0.05
3025
10.
0530
204.
3812
.72
5248
60.7
420
0.05
3225
10.
0532
254.
4312
.87
5248
60.0
225
0.05
3825
10.
0538
304.
4212
.84
5149
58.2
830
0.05
5426
0.97
2332
0.05
39
354.
4112
.81
5248
59.6
735
0.05
4126
0.97
2332
0.05
26
1350
Mea
n:4.
4012
.78
51.3
847
.63
Mea
n St
eady
Sta
te:
0.05
3649
.50
H-1
00
3.24
9.41
6057
75.6
10
0.04
2725
10.
0427
53.
159.
1558
5683
.39
50.
0387
251
0.03
87

WSR
C-T
R-2
002-
0010
8, R
ev. 0
SRT
-RP
P-2
002-
0004
1, R
ev. 0
Page
54
of 8
2
Run
Tar
get
Vel
ocit
y(f
ps)
Tar
get
Pre
ssur
e(p
si)
Tim
e(m
in)
Flo
w(g
pm)
Flo
w(f
ps)
Inle
t P
(psi
g)O
utle
t P
(psi
g)
Tim
e fo
r40
ml o
fP
erm
eate
(sec
)
Run
Tim
e(m
in)
Flu
x(g
pm/f
t2 )T
emp
(°C
)T
emp.
Com
p.
Cor
r.F
lux
(gpm
/ft2 )
103.
369.
7659
5788
.710
0.03
6425
10.
0364
153.
5110
.20
5956
92.1
715
0.03
5025
10.
0350
203.
4910
.14
5856
93.3
820
0.03
4626
0.97
2332
0.03
36
253.
5110
.20
5957
94.1
525
0.03
4325
10.
0343
303.
4710
.08
5856
96.5
330
0.03
3526
0.97
2332
0.03
25
1160
Mea
n:3.
399.
8558
.71
56.4
3M
ean
Stea
dy S
tate
:0.
0335
57.5
7H
-11
03.
7911
.01
4138
61.6
50
0.05
2426
0.97
2332
0.05
09
53.
8211
.10
4238
66.8
95
0.04
8326
0.97
2332
0.04
69
103.
8211
.10
4239
70.5
310
0.04
5825
10.
0458
153.
8011
.04
4239
71.6
615
0.04
5125
10.
0451
203.
8111
.07
4239
73.2
720
0.04
4125
10.
0441
253.
7710
.95
4239
73.4
725
0.04
4025
10.
0440
303.
8111
.07
4239
75.5
300.
0428
251
0.04
28
1140
Mea
n:3.
8011
.05
41.8
638
.71
Mea
n St
eady
Sta
te:
0.04
3640
.29

WSRC-TR-2002-00108, Rev. 0SRT-RPP-2002-00041, Rev. 0
Page 55 of 82
0.00
0.01
0.02
0.03
0.04
0.05
0.06
0.07
0.08
0.09
0.10
0 5 10 15 20 25 30 35
Time (min)
Co
rrec
ted
Flu
x (g
pm
/ft2 )
Z-2 (30.4 psi TMP, 9.0 fps)
Z-5 (49.8 psi TMP, 9.0 fps)
Nominal P V 30 9 50 9
0.00
0.01
0.02
0.03
0.04
0.05
0.06
0.07
0.08
0.09
0.10
0 5 10 15 20 25 30 35
Time (min)
Co
rrec
ted
Flu
x (g
pm
/ft2 )
Z-9 (19.2 psi TMP, 11.0 fps)
Z-1 (41.1 psi TMP, 11.1 fps)
Z-6 (40.3 psi TMP, 11.0 fps)
Z-11 (40.1 psi TMP, 10.9 fps)
Z-10 (58.1 psi TMP, 9.6 fps)
Nominal P V 20 11 40 11 60 11
Data at 60 psi TMP and nominal 11 fps is actually at 9.6 fps. At 11 fps, flux would be expected to be greater than other data
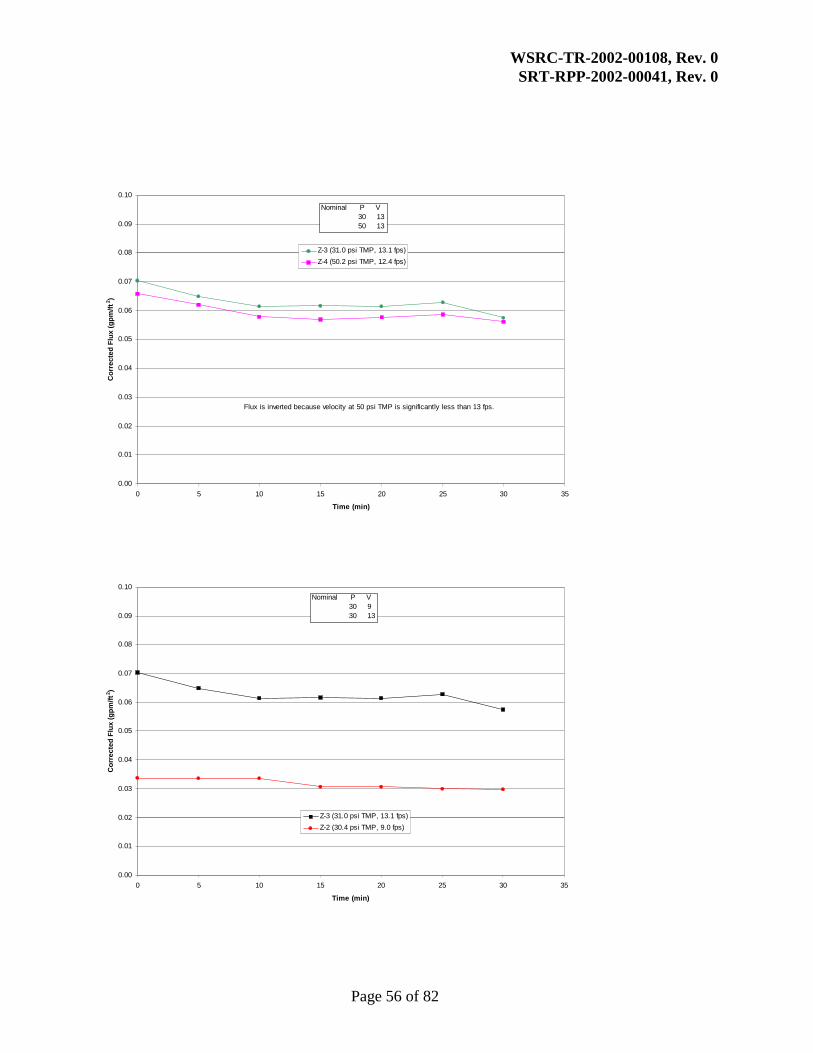
WSRC-TR-2002-00108, Rev. 0SRT-RPP-2002-00041, Rev. 0
Page 56 of 82
0.00
0.01
0.02
0.03
0.04
0.05
0.06
0.07
0.08
0.09
0.10
0 5 10 15 20 25 30 35
Time (min)
Co
rrec
ted
Flu
x (g
pm
/ft2 )
Z-3 (31.0 psi TMP, 13.1 fps)
Z-4 (50.2 psi TMP, 12.4 fps)
Nominal P V 30 13 50 13
Flux is inverted because velocity at 50 psi TMP is significantly less than 13 fps.
0.00
0.01
0.02
0.03
0.04
0.05
0.06
0.07
0.08
0.09
0.10
0 5 10 15 20 25 30 35
Time (min)
Co
rrec
ted
Flu
x (g
pm
/ft2 )
Z-3 (31.0 psi TMP, 13.1 fps)
Z-2 (30.4 psi TMP, 9.0 fps)
Nominal P V 30 9 30 13
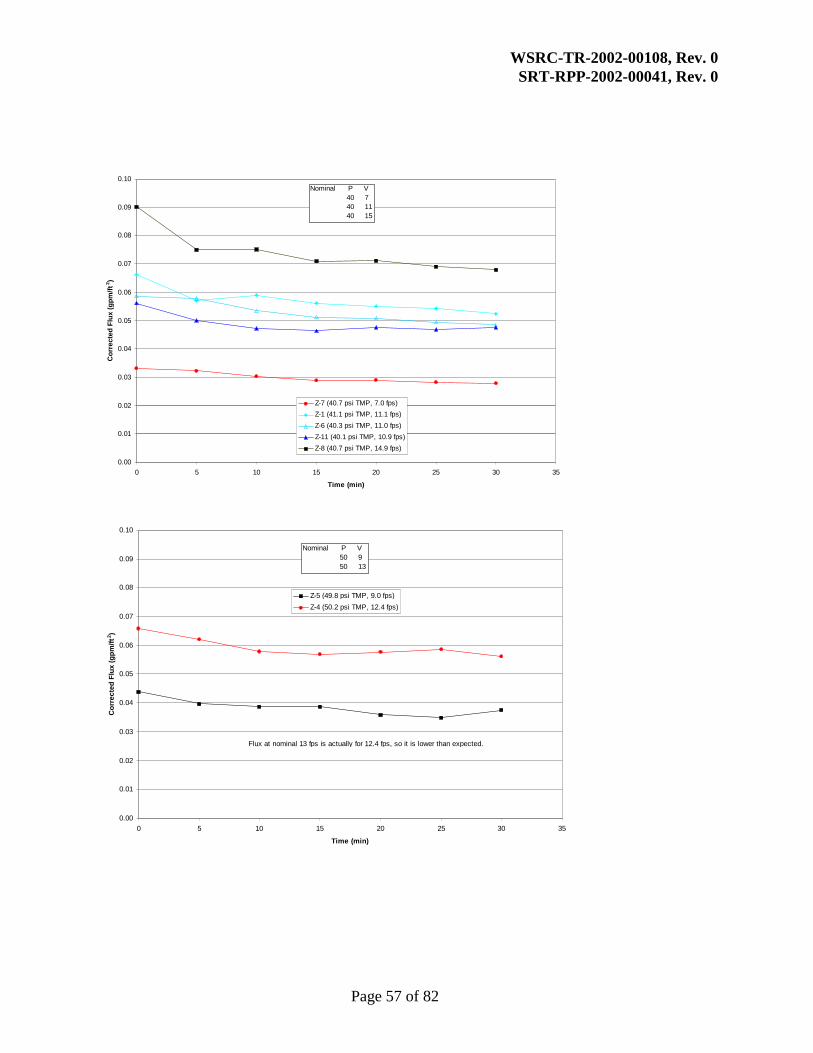
WSRC-TR-2002-00108, Rev. 0SRT-RPP-2002-00041, Rev. 0
Page 57 of 82
0.00
0.01
0.02
0.03
0.04
0.05
0.06
0.07
0.08
0.09
0.10
0 5 10 15 20 25 30 35
Time (min)
Co
rrec
ted
Flu
x (g
pm
/ft2 )
Z-7 (40.7 psi TMP, 7.0 fps)
Z-1 (41.1 psi TMP, 11.1 fps)
Z-6 (40.3 psi TMP, 11.0 fps)
Z-11 (40.1 psi TMP, 10.9 fps)
Z-8 (40.7 psi TMP, 14.9 fps)
Nominal P V 40 7 40 11 40 15
0.00
0.01
0.02
0.03
0.04
0.05
0.06
0.07
0.08
0.09
0.10
0 5 10 15 20 25 30 35
Time (min)
Co
rrec
ted
Flu
x (g
pm
/ft2 )
Z-5 (49.8 psi TMP, 9.0 fps)
Z-4 (50.2 psi TMP, 12.4 fps)
Nominal P V 50 9 50 13
Flux at nominal 13 fps is actually for 12.4 fps, so it is lower than expected.

WSRC-TR-2002-00108, Rev. 0SRT-RPP-2002-00041, Rev. 0
Page 58 of 82
0.00
0.01
0.02
0.03
0.04
0.05
0.06
0.07
0.08
0.09
0.10
0 5 10 15 20 25 30 35
Time (min)
Co
rrec
ted
Flu
x (g
pm
/ft2 )
L-7 (32.1 psi TMP, 9.1 fps)
L-1 (49.6 psi TMP, 8.7 fps)
Nominal P V 30 9 50 9
0.00
0.01
0.02
0.03
0.04
0.05
0.06
0.07
0.08
0.09
0.10
0 5 10 15 20 25 30 35
Time (min)
Co
rrec
ted
Flu
x (g
pm
/ft2 )
L-8 (19.9 psi TMP, 10.8 fps)
L-2 (39.2 psi TMP, 10.6 fps)
L-4 (39.8 psi TMP, 11.0 fps)
L-11 (39.6 psi TMP, 11.1 fps)
L-10 (58.4 psi TMP, 7.5 fps)
Nominal P V 20 11 40 11 60 11

WSRC-TR-2002-00108, Rev. 0SRT-RPP-2002-00041, Rev. 0
Page 59 of 82
0.00
0.01
0.02
0.03
0.04
0.05
0.06
0.07
0.08
0.09
0.10
0 5 10 15 20 25 30 35
Time (min)
Co
rrec
ted
Flu
x (g
pm
/ft2 )
L-5 (30.7 psi TMP, 13.2 fps)
L-9 (48.7 psi TMP, 12.3 fps)
Nominal P V 30 13 50 13
Flux is inverted because velocity at 50 psi TMP is significantly less than 13 fps.
0.00
0.01
0.02
0.03
0.04
0.05
0.06
0.07
0.08
0.09
0.10
0 5 10 15 20 25 30 35
Time (min)
Co
rrec
ted
Flu
x (g
pm
/ft2 )
L-7 (32.1 psi TMP, 9.1 fps)
L-5 (30.7 psi TMP, 13.2 fps)
Nominal P V 30 9 30 13

WSRC-TR-2002-00108, Rev. 0SRT-RPP-2002-00041, Rev. 0
Page 60 of 82
0.00
0.01
0.02
0.03
0.04
0.05
0.06
0.07
0.08
0.09
0.10
0 5 10 15 20 25 30 35
Time (min)
Co
rrec
ted
Flu
x (g
pm
/ft2 )
L-6 (40.6 psi TMP, 6.9 fps)
L-2 (39.2 psi TMP, 10.6 fps)
L-4 (39.8 psi TMP, 11.0 fps)
L-11 (39.6 psi TMP, 11.1 fps)
L-3 (39.9 psi TMP, 14.9 fps)
Nominal P V 40 7 40 11 40 15
0.00
0.01
0.02
0.03
0.04
0.05
0.06
0.07
0.08
0.09
0.10
0 5 10 15 20 25 30 35
Time (min)
Co
rrec
ted
Flu
x (g
pm
/ft2 )
L-1 (49.6 psi TMP, 8.7 fps)
L-9 (48.7 psi TMP, 12.3 fps)
Nominal P V 50 9 50 13

WSRC-TR-2002-00108, Rev. 0SRT-RPP-2002-00041, Rev. 0
Page 61 of 82
0.00
0.01
0.02
0.03
0.04
0.05
0.06
0.07
0.08
0.09
0.10
0 5 10 15 20 25 30 35
Time (min)
Co
rrec
ted
Flu
x (g
pm
/ft2 )
H-8 (31.1 psig TMP, 9.1 fps)
H-7 (50.3 psig TMP, 9.0 fps)
Nominal P V 30 9 50 9
0.00
0.01
0.02
0.03
0.04
0.05
0.06
0.07
0.08
0.09
0.10
0 5 10 15 20 25 30 35
Time (min)
Co
rrec
ted
Flu
x (g
pm
/ft2 )
H-4 (20.9 psig TMP, 11.1 fps)
H-1 (40.4 psig TMP, 11.3 fps)
H-5 (40.1 psig TMP, 11.1 fps)
H-11 (40.3 psig TMP, 11.1 fps)
H-10 (57.6 psig TMP, 9.9 fps)
Nominal P V 20 11 40 11 60 11
Data at 60 psi TMP and nominal 11 fps is actually at 9.9 fps. At 11 fps, flux would be expected to be greater than other data

WSRC-TR-2002-00108, Rev. 0SRT-RPP-2002-00041, Rev. 0
Page 62 of 82
0.00
0.01
0.02
0.03
0.04
0.05
0.06
0.07
0.08
0.09
0.10
0 5 10 15 20 25 30 35
Time (min)
Co
rrec
ted
Flu
x (g
pm
/ft2 )
H-3 (29.9 psig TMP, 13.1 fps)
H-9 (49.5 psig TMP, 12.8 fps)
Nominal P V 30 13 50 13
0.00
0.01
0.02
0.03
0.04
0.05
0.06
0.07
0.08
0.09
0.10
0 5 10 15 20 25 30 35
Time (min)
Co
rrec
ted
Flu
x (g
pm
/ft2 )
H-8 (31.1 psi TMP, 9.11 fps)
H-3 (29.9 psi TMP, 13.1 fps)
Nominal P V 30 9 30 13

WSRC-TR-2002-00108, Rev. 0SRT-RPP-2002-00041, Rev. 0
Page 63 of 82
0.00
0.01
0.02
0.03
0.04
0.05
0.06
0.07
0.08
0.09
0.10
0 5 10 15 20 25 30 35
Time (min)
Co
rrec
ted
Flu
x (g
pm
/ft2 )
H-2 (41.3 psi TMP, 7.0 fps)
H-1 (40.4 psi TMP, 11.3 fps)
H-5 (40.1 psi TMP, 11.1 fps)
H-11 (40.3 psi TMP, 11.1 fps)
H-6 (41.3 psi TMP, 15.3 fps)
Nominal P V 40 7 40 11 40 15
0.00
0.01
0.02
0.03
0.04
0.05
0.06
0.07
0.08
0.09
0.10
0 5 10 15 20 25 30 35
Time (min)
Co
rrec
ted
Flu
x (g
pm
/ft2 )
H-9 (49.5 psi TMP, 12.8 fps)
H-7 (50.3 psi TMP, 9.0 fps)
Nominal P V 40 7 40 11 40 15

WSRC-TR-2002-00108, Rev. 0SRT-RPP-2002-00041, Rev. 0
Page 64 of 82
0.0300
0.0350
0.0400
0.0450
0.0500
0.0550
0.0600
0.0650
0.0700
0 5 10 15 20 25 30 35
Time (min)
Co
rrec
ted
Flu
x (g
pm
/ft2
)
Z-1 (41.1 psi TMP, 11.1 fps)
Z-6 (40.3 psi TMP, 11.0 fps)
Z-11 (40.1 psi TMP, 10.9 fps)
L-2 (39.2 psi TMP, 10.6 fps)
L-4 (39.8 psi TMP, 11.0 fps)
L-11 (39.6 psi TMP, 11.1 fps)
0.030
0.035
0.040
0.045
0.050
0.055
0.060
0.065
0.070
0.075
0.080
0 5 10 15 20 25 30 35
Time (min)
Co
rrec
ted
Flu
x (g
pm
/ft2 )
Z-1
Z-6
Z-11
L-2
L-4
L-11
H-1
H-5
H-11

WSRC-TR-2002-00108, Rev. 0SRT-RPP-2002-00041, Rev. 0
Page 65 of 82
0.0400
0.0420
0.0440
0.0460
0.0480
0.0500
0.0520
0.0540
0.0560
0.0580
0.0600
0 5 10 15 20 25 30 35 40
Time (min)
Co
rrec
ted
Flu
x (g
pm
/ft2
)
M-1 (Org=50) (39.3 psi TMP, 11.0 fps)
M-2 (Org=150) (40.4 psi TMP, 11.1 fps)
M-3 (Org=300) (40.3 psi TMP, 11.1 fps)
M-4 (Org=500) (40.6 psi TMP, 11.1 fps)
M-5 (Org=1000) (40.2 psi TMP, 11.2 fps)
M-5b (Org=1000) (40.0 psi TMP, 11.1 fps)
M-6 (Org=1500) (40.4 psi TMP, 11.1 fps)
M-7 (Org=2000) (40.8 psi TMP, 11.0 fps)
M-8 (Org=2500) (40.4 psi TMP, 11.1 fps)
M-9 (Org=3000) (40.6 psi TMP, 11.2 fps)
M-10 (Org=4000) (40.7 psi TMP, 11.0 fps)
M-11 (Org=5000) (40.5 psi TMP, 11.0 fps)

WSRC-TR-2002-00108, Rev. 0SRT-RPP-2002-00041, Rev. 0
Page 66 of 82
5.5 Appendix – Curve Fits from JMP
Fit of )bt(1SQPaVFlux adjsqpv −=
Flux = gpm/ft2
V = velocity (fps)P = transmembrane pressure (psi)Q = total organics (TBP+NPH) (mg/L)tadj = cumulative run time (adjusted after t=13.5) (hr)S = solids concentration (wt%)a, b, p, q, s are parameters
Nonlinear Fit
Converged in the Gradient
Criterion Current Stop LimitIteration 59 60Shortening 0 15Obj Change 8.212934e-13 0.0000001Prm Change 0.0000079245 0.0000001Gradient 1.988623e-16 0.000001
Parameter Current Valuea 0.005626668v 1.3465218598b 0.0033701345q -0.010193617p -0.071298492s -0.736696127
SSE 0.0002544523N 45
Alpha 0.050Convergence Criterion 0.00001Goal SSE for CL 0.0002811028
SolutionSSE DFE MSE RMSE0.0002544523 39 0.0000065 0.0025543

WSRC-TR-2002-00108, Rev. 0SRT-RPP-2002-00041, Rev. 0
Page 67 of 82
Parameter EstimateApprox.Standard Error
LowerConfidenceLimit
UpperConfidenceLimit
a 0.005627 0.002171 0.002543 0.002543v 1.3465 0.05437 1.2371 1.4569b 0.003370 0.006026 -0.009993 0.015354q -0.01019 0.00946 -0.02964 0.00979p -0.07130 0.03728 -0.14592 0.0049s -0.7367 0.3231 -1.3829 -0.0905Correlation of Estimates
a v b q p sa 1.0000 -0.3946 -0.1704 0.5026 -0.2821 -0.8592v -0.3946 1.0000 -0.1163 -0.1184 0.0458 0.0298b -0.1704 -0.1163 1.0000 0.6311 -0.0420 0.3103q 0.5026 -0.1184 0.6311 1.0000 0.0219 -0.4931p -0.2821 0.0458 -0.0420 0.0219 1.0000 -0.0960s -0.8592 0.0298 0.3103 -0.4931 -0.0960 1.0000

WSRC-TR-2002-00108, Rev. 0SRT-RPP-2002-00041, Rev. 0
Page 68 of 82
Fit of )bt(1QPaVFlux adjqpv −=
Flux = gpm/ft2
V = velocity (fps)P = transmembrane pressure (psi)Q = total organics (TBP+NPH) (mg/L)tadj = cumulative run time (adjusted after t=13.5) (hr)a, b, p, q, v are parameters
Nonlinear Fit
Converged in the Gradient
Criterion Current Stop LimitIteration 4 60Shortening 0 15Obj Change 0.000308719 0.0000001Prm Change 0.0646007448 0.0000001Gradient 7.7701505e-8 0.000001
Parameter Current Valuea 0.00264206v 1.3503668344b 0.0082221362q -0.019724438p -0.079136273
SSE 0.0002869069N 45
Alpha 0.050
Convergence Criterion 0.05Goal SSE for CL 0.000316161
SolutionSSE DFE MSE RMSE0.0002869069 40 0.0000072 0.0026782

WSRC-TR-2002-00108, Rev. 0SRT-RPP-2002-00041, Rev. 0
Page 69 of 82
Parameter EstimateApprox.Standard Error
LowerConfidenceLimit
UpperConfidenceLimit
a 0.002642 0.000547 0.001728 0.004016v 1.350 0.057 1.234 1.467b 0.008222 0.005655 -0.004988 0.019929q -0.01972 0.00877 -0.03813 0.00058p -0.07914 0.03911 -0.15746 0.00129
Correlation of Estimatesa v b q p
a 1.0000 -0.7219 0.1902 0.1711 -0.7145v -0.7219 1.0000 -0.1340 -0.1209 0.0461b 0.1902 -0.1340 1.0000 0.9503 -0.0074q 0.1711 -0.1209 0.9503 1.0000 -0.0244p -0.7145 0.0461 -0.0074 -0.0244 1.0000
0.01
0.02
0.03
0.04
0.05
0.06
0.07
0.08
Pre
d aV
v (1
-bt)
Pp
.0100 .0200 .0300 .0400 .0500 .0600 .0700 .0800
SS Flux Cor

WSRC-TR-2002-00108, Rev. 0SRT-RPP-2002-00041, Rev. 0
Page 70 of 82
Fit of )bt(1QPaVFlux adjqpv −=
Flux = gpm/ft2
V = velocity (fps)P = transmembrane pressure (psi)Q = total organics (TBP+NPH) (mg/L)tadj = cumulative run time (adjusted after t=13.5) (hr)a, b, p, q, v are parameters
Nonlinear Fit
Converged in the Gradient
Criterion Current Stop LimitIteration 4 60Shortening 0 15Obj Change 0.000308719 0.0000001Prm Change 0.0646007448 0.0000001Gradient 7.7701505e-8 0.000001
Parameter Current Valuea 0.00264206v 1.3503668344b 0.0082221362q -0.019724438p -0.079136273
SSE 0.0002869069N 45
Alpha 0.050
Convergence Criterion 0.05Goal SSE for CL 0.000316161
SolutionSSE DFE MSE RMSE0.0002869069 40 0.0000072 0.0026782

WSRC-TR-2002-00108, Rev. 0SRT-RPP-2002-00041, Rev. 0
Page 71 of 82
Parameter EstimateApprox.Standard Error
LowerConfidenceLimit
UpperConfidenceLimit
a 0.002642 0.000547 0.001728 0.004016v 1.350 0.057 1.234 1.467b 0.008222 0.005655 -0.004988 0.019929q -0.01972 0.00877 -0.03813 0.00058p -0.07914 0.03911 -0.15746 0.00129
Correlation of Estimatesa v b q p
a 1.0000 -0.7219 0.1902 0.1711 -0.7145v -0.7219 1.0000 -0.1340 -0.1209 0.0461b 0.1902 -0.1340 1.0000 0.9503 -0.0074q 0.1711 -0.1209 0.9503 1.0000 -0.0244p -0.7145 0.0461 -0.0074 -0.0244 1.0000
0.01
0.02
0.03
0.04
0.05
0.06
0.07
0.08
Pre
d aV
v (1
-bt)
Pp
.0100 .0200 .0300 .0400 .0500 .0600 .0700 .0800
SS Flux Cor

WSRC-TR-2002-00108, Rev. 0SRT-RPP-2002-00041, Rev. 0
Page 72 of 82
Fit of )bt(1QaVFlux adjqv −=
Flux = gpm/ft2
V = velocity (fps)Q = total organics (TBP+NPH) (mg/L)tadj = cumulative run time (adjusted after t=13.5) (hr)a, b, q, v are parameters
Nonlinear Fit
Converged in the Gradient
Criterion Current Stop LimitIteration 3 60Shortening 0 15Obj Change 0.0003080764 0.0000001Prm Change 0.0667741471 0.0000001Gradient 8.4865869e-8 0.000001
Parameter Current Valuea 0.0019529218v 1.3566523696b 0.0084367207q -0.019681765
SSE 0.0003152431N 45
Alpha 0.050
Convergence Criterion 0.05Goal SSE for CL 0.0003465571
SolutionSSE DFE MSE RMSE0.0003152431 41 0.0000077 0.0027729

WSRC-TR-2002-00108, Rev. 0SRT-RPP-2002-00041, Rev. 0
Page 73 of 82
Parameter EstimateApprox.Standard Error
LowerConfidenceLimit
UpperConfidenceLimit
a 0.001953 0.000291 0.001438 0.00264v 1.357 0.059 1.238 1.477b 0.008437 0.005831 -0.005246 0.020509q -0.01968 0.00907 -0.03875 0.00143
Correlation of Estimatesa v b q
a 1.0000 -0.9858 0.2638 0.2191v -0.9858 1.0000 -0.1333 -0.1195b 0.2638 -0.1333 1.0000 0.9504q 0.2191 -0.1195 0.9504 1.0000
0.01
0.02
0.03
0.04
0.05
0.06
0.07
0.08
Pre
d aV
v (1
-bN
) Q
q
.0100 .0200 .0300 .0400 .0500 .0600 .0700 .0800
SS Flux Cor

WSRC-TR-2002-00108, Rev. 0SRT-RPP-2002-00041, Rev. 0
Page 74 of 82
Fit of )bt(1SaVFlux adjsv −=
Flux = gpm/ft2
V = velocity (fps)P = transmembrane pressure (psi)Q = total organics (TBP+NPH) (mg/L)tadj = cumulative run time (adjusted after t=13.5) (hr)a, b, s, v are parameters
Converged in the Gradient
Criterion Current Stop LimitIteration 59 60Shortening 0 15Obj Change 3.8329933e-7 0.0000001Prm Change 0.0001371318 0.0000001Gradient 1.089313e-10 0.000001Parameter Current Valuea 0.0054779622v 1.3458730305b 0.007057525s -0.942319127Lock
SSE 0.0002839426N 45Alpha 0.050Convergence Criterion 0.00001Goal SSE for CL 0.0003121475
SolutionSSE DFE MSE RMSE0.0002839426 41 0.0000069 0.0026316
Parameter EstimateApprox.Standard Error
LowerConfidenceLimit
UpperConfidenceLimit
a 0.005478 0.001809 0.001860 0.009096v 1.3459 0.0551 1.2354 1.4571b 0.007058 0.004624 -0.002942 0.016239s -0.9423 0.2959 -1.5341 -0.3505

WSRC-TR-2002-00108, Rev. 0SRT-RPP-2002-00041, Rev. 0
Page 75 of 82
Correlation of Estimatesa v b s
a 1.0000 -0.3827 -0.8121 -0.9096v -0.3827 1.0000 -0.0522 -0.0313b -0.8121 -0.0522 1.0000 0.9247s -0.9096 -0.0313 0.9247 1.0000

WSRC-TR-2002-00108, Rev. 0SRT-RPP-2002-00041, Rev. 0
Page 76 of 82

WSRC-TR-2002-00108, Rev. 0SRT-RPP-2002-00041, Rev. 0
Page 77 of 82
Fit of svSaVFlux =Flux = gpm/ft2
V = velocity (fps)S = solids concentrationa, v, s are parameters
Nonlinear Fit
Converged in the Gradient
Criterion Current Stop LimitIteration 4 60Shortening 0 15Obj Change 0.0013144702 0.0000001Prm Change 0.0009129883 0.0000001Gradient 3.9218594e-7 0.000001
Parameter Current Valuea 0.0080168667v 1.3501400332s -1.333106672
SSE 0.0002983598N 45Alpha 0.050Convergence Criterion 0.00001Goal SSE for CL 0.0003272513
SolutionSSE DFE MSE RMSE0.0002983598 42 0.0000071 0.0026653
Parameter EstimateApprox.Standard Error
LowerConfidenceLimit
UpperConfidenceLimit
a 0.008017 0.001568 0.005391 0.010643v 1.3501 0.0558 1.2388 1.4624s -1.3331 0.1148 -1.5648 -1.1023Correlation of Estimates
a v sa 1.0000 -0.7276 -0.7156v -0.7276 1.0000 0.0438s -0.7156 0.0438 1.0000

WSRC-TR-2002-00108, Rev. 0SRT-RPP-2002-00041, Rev. 0
Page 78 of 82
0.01
0.02
0.03
0.04
0.05
0.06
0.07
0.08P
red
aVv
Ss
.0100 .0200 .0300 .0400 .0500 .0600 .0700 .0800
SS Flux Cor
0.01
0.02
0.03
0.04
0.05
0.06
0.07
0.08
Pre
d aV
v S
s
0 5 10 15
t adj

WSRC-TR-2002-00108, Rev. 0SRT-RPP-2002-00041, Rev. 0
Page 79 of 82
Fit of )bt(1aVFlux adjv −=
Flux = gpm/ft2
V = velocity (fps)tadj = cumulative run time (adjusted after t=13.5) (hr)a, b, v are parameters
Nonlinear Fit
Converged in the Gradient
Criterion Current Stop LimitIteration 2 60Shortening 0 15Obj Change 0.0000272661 0.0000001Prm Change 0.0050122417 0.0000001Gradient 9.3709483e-9 0.000001
Parameter Current Valuea 0.0020910329v 1.3418623025b 0.0194210721
SSE 0.0003425838N 45
Alpha 0.050
Convergence Criterion 0.05Goal SSE for CL 0.0003757578
SolutionSSE DFE MSE RMSE0.0003425838 42 0.0000082 0.002856
Parameter Estimate
Approx.StandardError
LowerConfidenceLimit
UpperConfidenceLimit
a 0.002091 0.000311 0.001543 0.002821v 1.342 0.0602 1.221 1.464b 0.01942 0.00149 0.01631 0.02233

WSRC-TR-2002-00108, Rev. 0SRT-RPP-2002-00041, Rev. 0
Page 80 of 82
Correlation of Estimatesa v b
a 1.0000 -0.9914 0.1717v -0.9914 1.0000 -0.0597b 0.1717 -0.0597 1.0000
0.01
0.02
0.03
0.04
0.05
0.06
0.07
0.08
Pre
d aV
^v (
1-bt
)
.0100 .0200 .0300 .0400 .0500 .0600 .0700 .0800
SS Flux Cor
-0.01
-0.005
0
0.005
aVv
(1-b
t) R
esid
uals
.01 .02 .03 .04 .05 .06 .07 .08
Pred aV^v (1-bt)

WSRC-TR-2002-00108, Rev. 0SRT-RPP-2002-00041, Rev. 0
Page 81 of 82
-0.01
-0.005
0
0.005
aVv
(1-b
t) R
esid
uals
-5 0 5 10 15 20 25 30
Approx. Cumul. Time (hr)

WSRC-TR-2002-00108, Rev. 0SRT-RPP-2002-00041, Rev. 0
Page 82 of 82
6.0 References1 Test Specification for Evaluating Effect of Tri-Butyl Phosphate and Normal Paraffin
Hydrocarbon in Simulated Low-Activity Waste Solution on Ultrafiltration and IonExchange Systems, TSP-W375-00-00036, Rev. 1, Washington Group International, RPP-WTP, Richland, Washington, June 14, 2001.
2 LAW Evaporation: Antifoam / Defoamer Testing for Low Activity Waste Solution,TSP-W375-00-00035, Rev. 0, CH2M HILL Hanford Group, Inc., Richland, Washington,December 15, 2000.
3 Procedure for the Operation of the Cold Ultrafilter, IWT-OP-140, Rev. 0, WestinghouseSavannah River Co., Aiken, SC, November 2001.
4 R. E. Eibling and C. A. Nash, Hanford Waste Simulants Created to Support the Researchand Development on the River Protection Project – Waste Treatment Plant, SRT-RPP-2000-00017, Rev. 0 (WSRC-TR-2000-00338, Rev. 0), Westinghouse Savannah River Co.,Aiken, SC, February 2001.
5 C. A. Nash, S. W. Rosencrance, W. R. Wilmarth, Entrained Solids, Strontium-TransuranicPrecipitation, and Crossflow Filtration of AN102 Small C, SRT-RPP-2000-00003, Rev. 0(WSRC-TR-2000-00341, Rev. 0), Westinghouse Savannah River Co., Aiken, SC, August,2000.
6 E. Slaathaug, et. al, Configuration of the Ultrafiltration System, 24590-PTF-RPT-ENG-01-002, Rev. 0, RPP-WTP, Bechtel Washington Group, July 30, 2001.
7 M. R. Poirier, T. M. Jones, S. D. Fink, Impact of Strontium Nitrate and SodiumPermanganate Addition an Solid-Liquid Separation of SRS High Level Waste, WSRC-TR-2001-00554, Rev. 0, Westinghouse Savannah River Co., Aiken, SC, November 16, 2001.
8 M. R. Poirier, personal communication to J. R. Zamecnik, Westinghouse Savannah RiverCo., Aiken, SC, December, 2001.
9 M. J. Barnes, D. T. Hobbs, R. F. Swingle, Tributylphosphate in the In-Tank PrecipitationProcess Facilities, WSRC-RP-93-1162, Rev. 0, Westinghouse Savannah River Co.,Aiken, SC, November 23, 1993.
10 JMP, Version 4.0.4 for Windows, SAS Institute, Cary, NC.11 J. R. Zamecnik, M. A. Baich, Task Technical and Quality Assurance Plan In Support of
RPP – Evaluating The Effects Of Tri-Butyl Phosphate And Normal Paraffin HydrocarbonIn Simulated Low-Activity Waste Solution On Ultrafiltration, WSRC-TR-2001-00217,Rev. 0 (SRT-RPP-2001-0053, Rev. 0), Westinghouse Savannah River Co., Aiken, SC,November 2, 2001
12 Laboratory Notebook, WSRC-NB-2001-00144, Westinghouse Savannah River Co., Aiken,SC.