this document is the unedited author’s version of a
TRANSCRIPT

1
This document is the unedited Author’s version of a Submitted Work that was
subsequently accepted for publication in Colloids and Surfaces A: Physicochemical and
Engineering Aspects, copyright © Elsevier after peer review. To access the final edited and
published work see: http://dx.doi.org/10.1016/j.colsurfa.2017.02.065

2
High-Performance Iron Oxide-Graphene Oxide Nanocomposite Adsorbents
for Arsenic Removal
Hui Su,1 Zhibin Ye1,* and Nuri Hmidi2
1 Bharti School of Engineering, Laurentian University, Sudbury, Ontario P3E 2C6, Canada 2 Goldcorp Incorporated, Red Lake Gold Mines, 15 Mine Road, Box 2000, Balmertown,
Ontario P0V 1C0, Canada
* Corresponding author. Email: [email protected]; Telephone: 1 (705) 6751151 ext. 2343

3
Abstract
We report the synthesis of a new range of iron oxide-graphene oxide (GO) nanocomposites
having different iron oxide content (36–80 wt%) as high-performance adsorbents for arsenic
removal. Synthesized by co-precipitation of iron oxide on GO sheets that are prepared by an
improved Hummers method, the iron oxide in the nanocomposites is featured primarily in the
desirable form of amorphous nanoparticles with an average size of ca. 5 nm. This unique
amorphous nanoparticle morphology of the iron oxide beneficially endows the nanocomposites
with high surface area (up to 341 m2 g-1 for FeOx-GO-80 having the iron oxide content of 80
wt%) and predominant mesopore structures, and consequently increased adsorption sites and
enhanced arsenic adsorption capacity. FeOx-GO-80 shows high maximum arsenic adsorption
capacity (qmax) of 147 and 113 mg g−1 for As(III) and As(V), respectively. These values are the
highest among all the iron oxide-GO/reduced GO composite adsorbents reported to date and are
also comparable to the best values achieved with various sophisticatedly synthesized iron oxide
nanostructures. More strikingly, FeOx-GO-80 is also demonstrated to nearly completely
(>99.98%) removes arsenic by reducing the concentration from 118 (for As(III)) or 108 (for
As(V)) to < 0.02 µg L−1, which is far below the limit of 10 µg L−1 recommended by the World
Health Organization (WHO) for drinking water. The excellent adsorption performance, along
with their low cost and convenient synthesis, makes this range of adsorbents highly promising
for commercial applications in drinking water purification and wastewater treatment.
Keywords: graphene oxide, arsenic adsorption, iron oxide, nanocomposite, adsorbent.

4
1. Introduction
Arsenic is one of the most toxic and carcinogenic chemical elements. Arsenic contamination of
natural water sources due to mineral leaching and/or anthropogenic activities has been
considered as one of the most serious environmental problems worldwide [1–3]. Inorganic
arsenic species, primarily in the forms of arsenate (As(V)) and arsenite (As(III)), are believed to
be more toxic than the organic forms. Both As(V) and As(III) exist in natural water, with the
latter being more toxic and more difficult to remove than the former [1–3]. To date, a variety of
techniques has been developed to remove arsenic from both natural and industrial water sources
such as coagulation, adsorption, ion exchange, membrane filtration, biological remediation, etc.
[3,4] In particular, adsorption is considered to be most economical and efficient over other
techniques, especially in the low concentration range. A wide range of adsorbents has been
studied to remove arsenic from water and wastewater, including commercial activated carbons,
metal oxides, soils and constituents, natural minerals, etc. [3,4]
Compared to other types of adsorbents, iron oxide-derived adsorbents have received enormous
attention for arsenic removal due to their superior performance for arsenic adsorption [5]. In this
regard, iron oxides in various forms have been studied and developed for arsenic removal,
including amorphous iron oxide [6,7], goethite (α-FeOOH) [8], hematite (α-Fe2O3) [8,9],
crystalline magnetic maghemite (γ-Fe2O3) and magnetite (Fe3O4) nanoparticles [10–12], as well
as other iron oxide nanostructures [13–20]. Among them, amorphous iron oxides show the
highest adsorption capacity (as high as 260 and 200 mg g-1 for As(III) and As(V), respectively)
due to its highest specific surface area [8], but with the shortcomings of its difficulty (as fine
powders) for separation following adsorption and its tendency to form low-surface-area
crystalline iron oxides during preparation [4]. On the contrary, magnetic crystalline iron oxides

5
[10–12] and the various iron oxide nanostructures [13–20] generally show lowered adsorption
capacity due to their low specific surface area.
Iron oxide-derived nanocomposite adsorbents prepared by loading iron oxides onto various
substrates have also been extensively developed and investigated for arsenic adsorption [3,4].
Typical substrates include low-cost abundant ones, such as naturally occurring minerals [21],
activated carbons [22], graphene oxide (GO) [23–33], and cellulose [34], as well as some
specially synthesized costly ones, such as mesoporous carbons [35,36], carbon nanotubes [37],
macroporous silica [38], etc. Such nanocomposite adsorbents facilitate their more convenient
separation following adsorption. However, their maximum arsenic adsorption capacity is often
relatively low, except in one case with specially designed, costly macroporous silica as the
substrate [38]. Due to its unique two-dimensional one-atom-thick sheet structure with high
surface area and abundant oxygen-containing functionalities, GO prepared easily from abundant
graphite by oxidization and reduced GO (RGO) prepared by subsequent reduction of GO have
recently received enormous interest for environmental remediation applications [39–42].
Crystalline magnetic iron oxide nanoparticles have been loaded onto GO or RGO, rendering
nanocomposite adsorbents for arsenic adsorption [23,33]. However, the arsenic adsorption
capacity achieved thus far with the iron oxide-GO/RGO nanocomposite adsorbents is commonly
very low [only up to 54 and 73 mg g-1 reported for As(III) and As(V), respectively], with
significant room for further improvements.
Tackling the above issues, we report in this paper the synthesis of a range of cost-effective
amorphous iron oxide-GO nanocomposite adsorbents of significantly improved arsenic
adsorption capacity. The key to the enhanced adsorption capacity is the unique loading of
primarily amorphous iron oxide nanoparticles of high specific surface area on GO. The
composite adsorbents have been designed to contain different contents of the amorphous iron

6
oxide, and have been thoroughly characterized for their compositional, structural, and textural
properties. A systematic study on the performance of these composite adsorbents for the
adsorption of As(III) and As(V) has been undertaken. Our results suggest their high potential as
cost-effective adsorbents for arsenic removal from both drinking water and industrial
wastewater.
2. Experimental Section
2.1 Materials
Natural graphite flake (+100 mesh: ≥ 75.5%, Aldrich), potassium permanganate (99.0+%, Sigma
Aldrich), hydrogen peroxide (50%, Fisher Scientific), sulfuric acid (96.9 wt%, Fisher Scientific),
phosphoric acid (85+%, Acros), ferrous sulfate heptahydrate (99+%, Sigma Aldrich), ferric
sulfate hydrate (97%, Fe 21.6%, Sigma Aldrich), ammonium hydroxide solution (28–30%,
Sigma Aldrich), hydrochloric acid (37%, Fisher Scientific), methanol (ACS reagent, Fisher
Scientific), were used as received without any additional purification. Deionized water was
purified by a Barnstead/Synbron Nanopure II purification system.
Sodium (meta) arsenite (NaAsO2, ≥90%, Aldrich) and sodium arsenate dibasic heptahydrate
(Na2HAsO4·7H2O, ≥98%, Aldrich) were selected as the source of As(III) and As(V),
respectively. As(III) and As(V) stock solutions at the arsenic concentration of 2,000 mg L-1 were
prepared in deionized water. The standard arsenic solutions with different concentrations were
diluted from the 2,000 mg L-1 stock solutions with the pH adjusted to desired values with HNO3
or NaOH.

7
2.2 Synthesis of graphene oxide (GO)
GO was synthesized by exfoliation of natural graphite flakes with the use of an improved
Hummers method reported by Tour et al. [43] In a typical process, a mixture of concentrated
H2SO4/H3PO4 (360:40 mL) was prepared in a round-bottom flask, then 3 g of graphite flakes
were added to the mixture under vigorous mechanic stirring for 10 min to obtain a dark-colored
suspension. Subsequently, 18 g of KMnO4 were added slowly into the above suspension in an ice
bath. The mixture was stirred vigorously for 36 h at 50 ºC. A reddish brown viscous mixture was
obtained. This mixture was cooled to room temperature, and then poured slowly into 400 mL of
cold deionized water containing 3 mL of H2O2 (50%). Afterwards, the suspension was
centrifuged and washed sequentially with HCl, water, then methanol for several times, until pH
reached 6. The solid material was collected after centrifugation and dispersed again in 1200 mL
of water as the stock solution (GO concentration of 3.5 mg mL-1; 4.2 g in total) for subsequent
use.
2.3 Preparation of amorphous iron oxide-GO nanocomposites (FeOx-GOs)
FeOx-GO composites were synthesized by the co-precipitation method. The GO suspension (64
mL, containing 0.22 g of GO) was first diluted with 160 mL of water. An aqueous solution of
Fe2(SO4)3 and FeSO4 at 1:1 molar ratio (or Fe3+ : Fe2+ = 2:1) was prepared. In the case for the
preparation of the nanocomposite with 80 wt% of iron oxide (FeOx-GO-80), the amounts of
ferric sulfate hydrate and ferrous sulfate heptahydrate were 1.51 g and 0.81 g, respectively. The
solutions of Fe2(SO4)3 and FeSO4 were added into the GO suspension slowly at room
temperature. Subsequently, 30% ammonia solution was added under stirring to this suspension to
make pH = 10. The suspension was heated to 85 ºC and was rapidly stirred for 40 min. It was
then cooled down to room temperature. The resulting black suspension was filtered, washed with

8
water and methanol several times, and finally dried overnight under vacuum at 60 ºC, rendering
850 mg of FeOx-GO-80. Two other nanocomposites (FeOx-GO-36 and FeOx-GO-60) containing
different contents (36 and 60 wt%, respectively) of iron oxide were similarly prepared. The pure
iron oxide control sample was synthesized with the same method, but in the absence of GO.
2.4 Characterizations and Measurements
Thermogravimetric analysis (TGA) of the FeOx-GO nanocomposites was carried out on a Q50
TGA from TA instruments. Measurements were performed in an air atmosphere. In a typical
measurement, the sample (10 mg) was heated to 100 ºC at a rate of 10 ºC min-1, held at 100 ºC
for 10 min, and then heated to 800 ºC at a rate of 10 ºC min-1. Braunauer–Emmett–Teller (BET)
specific surface area, pore volume, and pore size distribution of the samples were determined by
N2 sorption at 77 K using a Micromeritics ASAP 2020 physiosorption analyzer. Before the
sorption measurements, the samples were degassed under vacuum at 100 ºC for at least 12 h. X-
ray photoelectron spectroscopy (XPS) measurements of FeOx-GO nanocomposites were carried
out on a Thermo Scientific Theta Probe XPS spectrometer. A monochromatic Al Kα X-ray
source was used, with a spot area of 400 µm. The samples were run in a standard mode, i.e., all
angles collected (60º angular acceptance) for the survey spectra, and for the region spectra.
Wide-angle x-ray diffraction (XRD) patterns of the FeOx-GO nanocomposites were recorded on
an X’Pert Pro diffractometer with Cu radiation (wavelength 1.54 Å) at room temperature.
Transmission electron microscopy (TEM) images were taken on a JEOL 2010F field emission
electron microscope operated at 200 keV. The TEM samples were prepared by depositing a few
drops of a dilute dispersion of the FeOx-GO composites in methanol on holey grids, followed
with drying. Atomic force microscopy (AFM) imaging of the GO sample was performed on a
Bruker multimode atomic force microscope in the tapping mode with a phosphorous-doped
silicon tip having a force constant of 20–80 N m-1. AFM samples were prepared by placing a

9
freshly cleaved mica piece in the dilute dispersion (ca. 0.1 mg mL-1) of the GO sample overnight
for sample deposition, which was then taken out and dried for the imaging. Fourier-transformed
infrared (FTIR) spectra were obtained on a Thermo Scientific Nicolet 6700 Analytical FTIR
spectrometer. The samples were prepared as pellets using spectroscopic-grade KBr. Zeta
potential measurements of the dilute dispersions (0.1 mg mL-1) of the various FeOx-GO
composites were performed with a Brookhaven NanoBrook Omni Instrument at 25 ºC. The
concentration of arsenic was measured with an Analytik Jena 810 inductively coupled plasmon
mass spectrometry (ICP-MS) system with a detection limit of 50 µg L−1 or with a Thermal Fisher
iCAP Q ICP-MS system with a detection limit of 0.02 µg L−1 for the solutions with arsenic in the
very low concentration range. Raman spectra (excitation at 514 nm) were recorded on a
Reinshaw Invia Laser Raman spectrometer.
2.5 Arsenic Adsorption
All the arsenic adsorption experiments were undertaken at room temperature, i.e., 23 ºC, which is
most common for arsenic adsorption studies. Batch equilibrium adsorption of arsenic was carried
out at an adsorbent loading of 0.8 mg mL-1. Typically, the FeOx-GO composites (2.4 mg) were
dispersed in the As(III) and As(V) solutions (3 mL) at different initial concentrations (0.1–1200
mg L-1) and pH, followed by magnetic stirring (300 rpm) for 24 h to achieve adsorption
equilibrium. Afterwards, the suspension was filtered with a 0.2 µm Teflon syringe filter and the
equilibrium concentration of non-adsorbed arsenic in the filtrate solution was measured. The
equilibrium adsorption uptake (qe in mg g-1) was calculated according to Equation 1 from the
difference between the initial arsenic concentration (C0, mg L-1) and the equilibrium one (Ce, mg
L-1):
qe = (C0 – Ce)V/m (1)
where V is the solution volume (L), and m is the mass of the adsorbent (g).

10
The adsorption isotherms were fitted with the Langmuir model (Equation 2).
qe = abCe/(1 + bCe) (2)
where a is the saturated/maximum adsorbed capacity (mg g-1) and b is the Langmuir constant
that directly relates to the adsorption affinity (L mg-1).
The adsorption kinetic curves with FeOx-GO-80 were obtained as follows. FeOx-GO-80 at the
same amount (2.4 mg) was dispersed in a series of As(III) and As(V) standard solutions of the
same volume (3 mL) and concentration [400 mg L−1 for As(III) and 350 mg L−1 for As(V)]. Each
dispersion was stirred for a prescribed time (ranging from 15 min to 24 h) and was then quickly
filtered for measurement of the corresponding equilibrium concentration of As(III) and As(V) in
the filtrate, thus giving rise to the time-dependent adsorption capacity. The adsorption kinetics
was fitted with the pseudo-second-order kinetic model (Equation 3 or 4) based on which the
initial adsorption rate could be obtained (Equation 5).
dqt/dt = k2(qe – qt)2 (3)
t/qt = 1/(k2qe2) + t/qe (4)
V0 = k2qe2 (5)
where qt is the amount (mg g-1) of arsenic adsorbed on adsorbent at various time t, k2 is the rate
constant (g mg-1 min-1), qe is the equilibrium adsorption capacity (mg g-1), and V0 is the initial
adsorption rate (mg g-1 min-1).
The effects of coexisting anions (CO32–, SO4
2–, and PO43–) on the batch adsorption of As(III) and
As(V) were investigated with FeOx-GO-80 at the initial arsenic concentration of around 100 µg
L-1 at the pH of 6.5. The molar concentration of the coexisting anions was set excessively at
1,000 times of that of arsenic (i.e., 184, 189, and 282 mg L-1 for K2CO3, Na2SO4, and K3PO4
respectively), with the adsorbent loading of 5 mg in 6.25 mL (i.e., 0.8 mg mL-1). Each adsorption

11
underwent for 24 h under stirring. Afterwards, the suspension was filtered and the filtrate was
analyzed with ICP-MS for equilibrium arsenic concentration and the subsequent calculation of
the equilibrium adsorption capacity by Equation 1.
3. Results and Discussion
3.1 Synthesis and Characterization of FeOx-GOs Nanocomposites
The Hummers method [44] or modified Hummers method has been commonly used for the
preparation of GO in the previous studies on iron oxide-GO/RGO composite adsorbents for
arsenic adsorption [23–33]. Unlike those previous studies, GO used herein was synthesized with
an improved Hummers method developed by Tour et al. [43] Relative to the Hummers and
modified Hummers methods, the improved method is noted for improved oxidation efficiency
and the greater retention of the graphitic basal plane framework. Figure S1 in Supporting
Information shows an AFM image of the GO sample synthesized and employed herein. It
consists of typical 2-dimensional sheet-like structures, which are loosely bound. The sheets have
the lateral dimension within the range of ca. 1–10 µm and the thickness of around 1–2 nm (see
Figure S1). The GO sample was characterized with XPS. Its C1s XPS spectrum (see Figure S2) is
deconvoluted into four peaks that correspond to the following functional groups: carbon sp2
(C=C, 284.8 eV), epoxy/hydroxyls (C–O, 287.0 eV), carbonyl (C=O, 288.8 eV), and
carboxylates (O–C=CO, 289.9 eV) [45]. Integration of the deconvoluted peaks indicates that the
GO sample has 64% oxidized carbon and 36% graphitic carbon. This indicates a very high
degree of functionalization, where the edges and basal plane of each sheet should be
functionalized with oxygen-containing polar groups, such as carboxyl, epoxy, hydroxyl, etc.

12
Due to the high degree of functionalization, the GO powder readily disperses in water to form a
stable aqueous suspension upon ultrasonication and stirring. To prepare FeOx-GO composites,
iron salts, Fe2(SO4)3 and FeSO4 at 1:1 molar ratio, were added into the aqueous GO suspension
as the iron oxide precursors. Iron compounds have been reported to form cross-linking with the
oxygen functionalities on the surface of carbon materials [45]. Subsequently, ammonium
hydroxide was added into the mixture, followed with subsequent reaction at 85 ºC and post-
treatment (precipitation, washing, and drying at 60 ºC). With the equal molar feeding of the two
iron salts, we expected to obtain iron oxide with Fe3+ and Fe2+ at a molar ratio of 2 in the
composites. Scheme 1 shows the schematic synthesis. By controlling the feed ratio of the iron
salts to GO, three FeOx-GO composites having different iron oxide contents were prepared.
Meanwhile, a pure iron oxide control sample was also synthesized in the absence of GO for the
purpose of comparison.
Scheme 1. Schematic synthesis of FeOx-GO nanocomposites.
The resulting composites were thoroughly characterized. Figure 1 shows the TGA curves of the
composites and their differential curves, along with those of GO and the iron oxide control
sample. GO shows a characteristic two-step weight loss. The first step (loss of ca. 40%) occurs

13
within 150–250 ºC with the peak weight loss at 203 ºC. It can be attributed to the evaporation of
adsorbed water and the decomposition of thermally labile oxygen-containing functional groups.
The second weight loss takes place within 400–500 ºC (peak at 467 ºC) with negligible char
yield at 600 ºC. It is ascribed to the decomposition of more stable oxygen functionalities and the
combustion of GO framework [46]. On the contrary, the iron oxide control sample shows
negligible weight loss even at 600 ºC. The FeOx-GO composites show weight loss within 100–
420 ºC. Their char yield at 600 ºC, which represents the content of iron oxide in the
nanocomposites, is 36, 60, and 80 wt%, respectively. In consequence, the composites are termed
correspondingly as FeOx-GO-36, FeOx-GO-60, and FeOx-GO-80, with the number representing
the mass percentage of iron oxide in the composites. In particular, the iron oxide content in
FeOx-GO-80 is significantly higher than the typical values (around 10–60 wt%) in iron oxide-
GO composites synthesized in earlier works for arsenic adsorption [23–33]. On the basis of their
differential curves, the major weight loss of the composites occurs within 250–500 ºC, along
with a long tail/shoulder peak within 100–250 ºC. This indicates the significant overlap of the
two weight-loss steps due to the decrease of combustion/degradation temperature. With the
increase of the iron oxide content, the peak weight-loss temperature shows a continuous decrease
from 360 ºC for FeOx-GO-36 to 338 ºC for FeOx-GO-60 and to 318 ºC for FeOx-GO-80. This
can be ascribed to the enhanced surface area and pore volume with the increase of iron oxide
content in the composites as shown below, which lead to the enhanced contact of GO surface
with air for combustion. Meanwhile, it can also result from the existence of iron oxide on the GO
surface, which acts as catalysts for the carbon combustion since their exothermic oxidation takes
place at lower temperatures [36].

14
Figure 1. TGA curves (a) and differential curves (b) for GO, FeOx-GO-36, FeOx-GO-60, FeOx-
GO-80 and the iron oxide control sample in the air atmosphere.
Figure 2 shows the TEM images and high-resolution TEM images of two composites, FeOx-GO-
36 and FeOx-GO-80, as well as those of GO and the iron oxide control sample. GO appears as
wrinkled sheets under TEM (Figure 2(a)). The iron oxide control sample consists of
nanoparticles with sizes in the range of 10–20 nm (Figure 2(g)). Figure S3 shows the particle
size distribution on the basis of 120 nanoparticles examined under TEM, with the average size of
15 nm. The atomic lattice fringes in the high-resolution TEM images (Figure 2(h)) confirm the
single crystalline nature of the nanoparticles with an interplanar spacing of about 0.25 nm, which
matches well with the (311) lattice spacing of crystalline Fe3O4 [47]. In the two composites, GO
sheets are decorated irregularly with iron oxide nanoparticles (see Figure 2(c) and (e)). From the
high-resolution images (Figure 2(d) and (f)), the iron oxide nanoparticles have an average size of
about 5 nm and are primarily amorphous with no distinct crystalline lattice fringes observed.
This is in sharp contrast to the crystalline Fe3O4 nanoparticles observed in the iron oxide control
sample, which was prepared under the same conditions except in the absence of GO. Clearly, the
presence of GO in the coprecipitation preparation of iron oxide promotes the formation of
amorphous iron oxide nanoparticles in the composites.

15
Figure 2. TEM and high-resolution TEM images of GO (a and b), FeOx-GO-36 (c and d),
FeOx-GO-80 (e and f), and the iron oxide control sample (g and h). (d)

16
To further elucidate the distribution of iron oxide species in the composites, the two composites
(FeOx-GO-36 and FeOx-GO-80) were characterized with the dark-field scanning TEM (DF-
STEM) technique. As shown in Figure S4(a), bright spots can be found in the dark domain of
FeOx-GO-80 containing C and O, indicating the existence of heavy atoms, namely Fe. Figure
S4(b)–(d) show the elemental mapping of C, O, and Fe within the domain. All the three elements
are uniformly distributed, confirming the uniform dispersion of iron oxide within the composite.
Similarly, the uniform distribution of iron oxide is also confirmed in FeOx-GO-36 having a lower
iron oxide content (see Figure S5).
FTIR spectra of GO, the FeOx-GO composites, and the iron oxide control sample are shown in
Figure 3. The spectrum of GO shows C=O (1729 cm-1), aromatic C=C (1620 cm-1), carboxyl
O=C–O (1400 cm-1), epoxy C–O (1225 cm-1), and alkoxy C–O (1053 cm-1) stretching vibrations
[48]. The spectrum of iron oxide sample shows two broad bands in the low frequency region
(750−400 cm−1), corresponding to the Fe–O vibration in Fe3O4 [36]. The infrared spectra of
FeOx-GO-36, FeOx-GO-60, and FeOx-GO-80 all show a broad band with the peak maximum at
1578 cm-1, corresponding to aromatic C=C stretch in GO [23]. Other bands arising from GO
become indistinct in the composites due to its lowered content. In FeOx-GO-80, the presence of
iron oxide can be confirmed from the bands at 552 cm−1 and 442 cm-1. FeOx-GO-36 and FeOx-
GO-60 show also similar spectral characteristics with more or less differences in the absorption
intensities in the low wavenumber range due to their relatively lowered iron oxide content.

17
Figure 3. FTIR spectra of GO, FeOx-GO composites, and the iron oxide control sample.
Two composites, FeOx-GO-36 and FeOx-GO-80, as well as GO and the iron oxide control
sample, were also characterized with XPS (see Figure 4). From the survey scan (Figure 4(a)), the
surface of GO contains 40.4 atom% of C and 55.0 atom% of O (see Figure 4(b)). Impurities at
small amounts are noticed in the samples on the basis of the peaks found in the higher energy
region of the XPS spectra. After loading the amorphous iron oxide at the increasing content, the
counts of O1s and C1s in the composites decrease (34.5 atom% of C and 36 atom% of O for FeOx-
GO-36, 13.1 atom% of C and 27.7 atom% of O for FeOx-GO-80) whereas the counts of Fe
increase dramatically (25.2 and 57.7 atom% for FeOx-GO-36 and FeOx-GO-80, respectively).
Two photoelectron peaks located at 711.1 (Fe2p3/2) and 724.6 eV (Fe2p1/2) are found in the Fe2p
spectra of the composites and the iron oxide control sample (Figure 4(c)–(e)) [23]. Each peak is
deconvoluted to the constituting peaks attributable to Fe3+ and Fe2+, respectively, as well as their
satellite peaks [49,50]. The Fe3+/Fe2+ molar ratio in the iron oxide control sample is estimated to
2.03 according to the deconvoluted Fe2p3/2 peaks, which is nearly identical to the theoretical
value of 2 for Fe3O4. This also confirms that the pure iron oxide control sample is in the form of
Fe3O4 nanoparticles. The Fe3+/Fe2+ molar ratio in FeOx-GO-36 and FeOx-GO-80 is estimated to

18
be 2.92 and 1.87, respectively. While the latter for FeOx-GO-80 is close to the expected
theoretical value for Fe3O4, the former for FeOx-GO-36 at a lower iron oxide loading deviates
significantly from the theoretical value. This may result from the stronger complexation of Fe3+
than Fe2+ ions with oxygen functionalities on GO during the preparation and thus the higher
incorporation within the composite [24].
Figure 4. (a) XPS survey scan of GO, FeOx-GO-36, FeOx-GO-80, and the iron oxide control
sample, (b) the content of C, O, and Fe in the samples measured by XPS, (c)–(e) Fe2p spectra in
FeOx-GO-36, FeOx-GO-80, and the iron oxide control sample, respectively.
The O1s spectra of the samples are shown in Figure S2(b). In the spectra of the two composites,
three deconvoluted peaks at 530.3, 531.6, and 533.6 eV are attributed to the oxygen atoms
bonded to O–Fe, carboxyl O=C, and hydroxyl O–H, respectively [23]. In the spectrum of pure
iron oxide, the former one is predominant with the negligible presence of the latter two. On the
contrary, the former one is absent in GO. In the C1s spectra (Figure S2(a)), three deconvoluted
peaks at 284.8, 286.9, and 288.8 eV, can be found in the composites, assignable to the C atoms
19
in C–C, C–O, and C=O groups in GO. By comparing the deconvoluted peaks, it appears that,
after loading iron oxide onto GO, the relative intensity of the peak for C–O bonds has been
significantly reduced while with the increasing intensity of that for C–C bonds, suggesting the
partial conversion of GO to chemically converted graphene (CCG) [51]. Such a conversion may
result from the partial reduction of GO by Fe2+ in the composites. This may also contribute to the
above noted deviation of Fe3+/Fe2+ ratio from the expected theoretical value of 2 in the
composites.
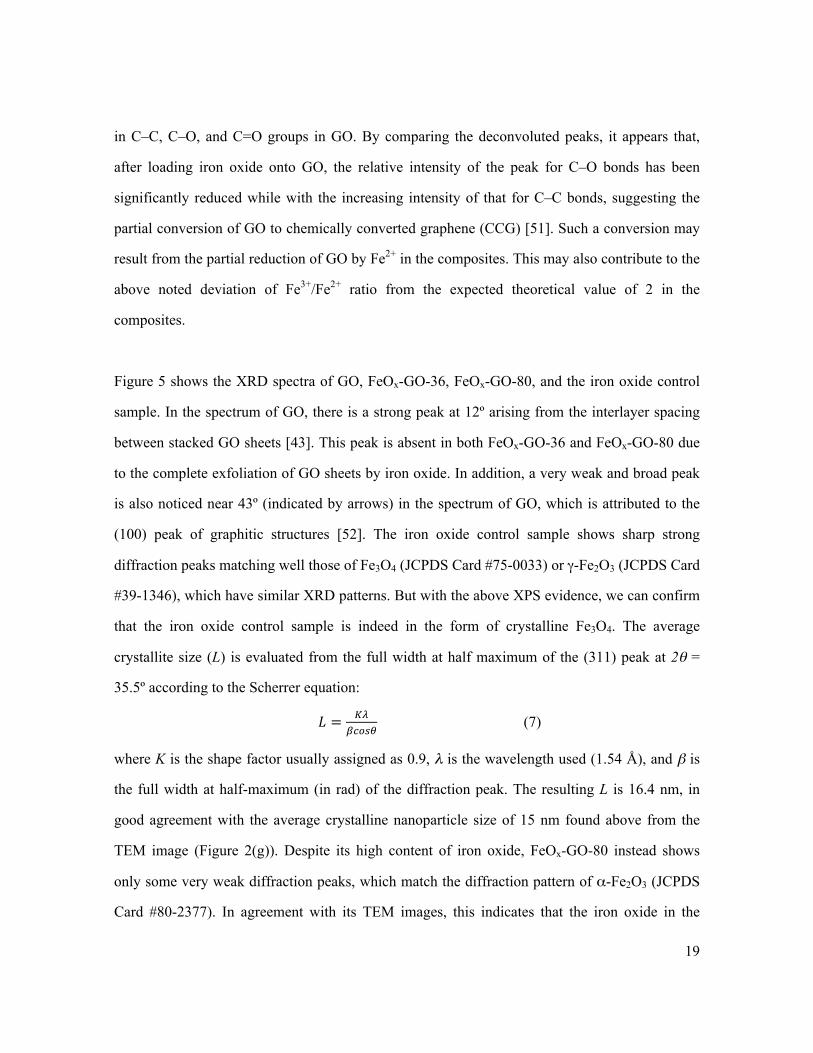
Figure 5 shows the XRD spectra of GO, FeOx-GO-36, FeOx-GO-80, and the iron oxide control
sample. In the spectrum of GO, there is a strong peak at 12º arising from the interlayer spacing
between stacked GO sheets [43]. This peak is absent in both FeOx-GO-36 and FeOx-GO-80 due
to the complete exfoliation of GO sheets by iron oxide. In addition, a very weak and broad peak
is also noticed near 43º (indicated by arrows) in the spectrum of GO, which is attributed to the
(100) peak of graphitic structures [52]. The iron oxide control sample shows sharp strong
diffraction peaks matching well those of Fe3O4 (JCPDS Card #75-0033) or γ-Fe2O3 (JCPDS Card
#39-1346), which have similar XRD patterns. But with the above XPS evidence, we can confirm
that the iron oxide control sample is indeed in the form of crystalline Fe3O4. The average
crystallite size (L) is evaluated from the full width at half maximum of the (311) peak at 2θ =
35.5º according to the Scherrer equation:
! = !"!"#$% (7)
where K is the shape factor usually assigned as 0.9, λ is the wavelength used (1.54 Å), and β is
the full width at half-maximum (in rad) of the diffraction peak. The resulting L is 16.4 nm, in
good agreement with the average crystalline nanoparticle size of 15 nm found above from the
TEM image (Figure 2(g)). Despite its high content of iron oxide, FeOx-GO-80 instead shows
only some very weak diffraction peaks, which match the diffraction pattern of α-Fe2O3 (JCPDS
Card #80-2377). In agreement with its TEM images, this indicates that the iron oxide in the

20
composites is primarily in the amorphous form without a significant presence of crystalline
nanoparticles. Like FeOx-GO-80, FeOx-GO-36 also shows weak (104) and (110) diffraction
peaks characteristic of α-Fe2O3; but other peaks are not clearly observable due to the low iron
oxide content. Due to the primarily amorphous nature of the iron oxide, the three FeOx-GO
composites synthesized herein were found only weakly magnetic.
Figure 5. Wide-angle XRD patterns of (a) GO, (b) FeOx-GO-36, (c) FeOx-GO-80, and (d) the
iron oxide (Fe3O4) control sample.
Figure S6 in Supporting Information shows the Raman spectra of GO, FeOx-GO-36, FeOx-GO-
80, and the Fe3O4 control sample. Within the low wavenumber range (150–850 cm-1), FeOx-GO-
36, FeOx-GO-80, and the Fe3O4 control sample show similar spectra with no distinct difference
Fe3O4:JCPDS#75-0033
α-Fe2O3:JCPDS#80-2377
γ-Fe2O3:JCPDS#39-1346
10 20 30 40 50 60 70
Inte
nsity
/ a.
u
2θ / o
�111�
�220�
�311�
�400� �422�
�511� �440�
�110� �116�
↓
�214�
(d)
○
�012� �104� ○
○ ○
○
�113� �024� ○ ○ ○
�300�
α-Fe2O3 ○
Fe3O4
(c)
(b)
(a)

21
despite their different crystal structures, with Raman peaks observed at 218, 290, and 400 cm-1.
In addition, the defect band at 1350 cm-1 and the graphene band at 1610 cm-1 are present in GO
and the two composites, with the former indicative of the defects in the graphene moiety. The
intensity ratio (ID/IG) of the defect band to the graphene band increases from 0.79 in GO to 0.93
and 0.95 for FeOx-GO-36 and FeOx-GO-80, respectively, indicating the chemical
interaction/complexation between the iron oxide and the moieties on GO [51].
The FeOx-GO composites, along with GO and the iron oxide control sample, were further
characterized with N2 sorption analysis at 77 K for their textural properties. Table 1 summarizes
the characterization data, including surface area, pore volume, and average meso-/macro-pore
size. Figure 6(a) shows their N2 adsorption-desorption curves. All samples except the iron oxide
control sample show type IV adsorption isotherms, with the steep adsorption at low relative
pressure range (0–0.1) and the presence of a H2 type hysteresis loop in the medium to high
relative pressure range (0.4–0.9) [53]. This indicates these samples contain both micropores and
mesopores. The iron oxide control sample instead shows only a slight uptake at the low relative
pressure end (P/P0 < 0.05), and a sharp uptake with a H3 type hysteresis loop at high relative
pressure end (P/P0 > 0.9) [53], indicating that the sample contains predominantly large
mesopores and/or macropores (average size: 28 nm). In this sample, the mesopores/macropores
should be the inter-nanoparticle pores resulting from the aggregation/packing of the crystalline
Fe3O4 nanoparticles. GO and the iron oxide control sample have a surface area of 129 and 71 m²
g-1, respectively, and a pore volume of 0.09 and 0.36 cm3 g-1, respectively. On the basis of its
surface area and magnetite density (5.18 g cm-1) [10], the crystalline Fe3O4 nanoparticles in the
iron oxide control sample have an estimated average diameter of 16 nm, which is nearly identical
to the average size estimated above from XRD or TEM.

22
Figure 6. (a) N2 adsorption-desorption isotherm of FeOx-GO composites, GO, and the iron
oxide control sample, (b) DFT meso-/macro-pore size distribution curves, (c) dependencies of
surface area and pore volume data on the iron oxide content.

23
Table 1.
Results from
N2 sorption characterization.
Samples
Surface Area (m
² g-1) a
Pore Volum
e (cm³ g
-1) b
Average M
eso-
/Macropore Size
(nm) c
SBET
Sd<20Å
%S
d<20Å S
d>20Å %
Sd>20Å
Vtotal
Vd<20Å
%V
d<20Å V
d>20Å(des)
%V
d>20Å D
meso/m
acro
GO
129
85 66%
44
34%
0.09 0.05
53%
0.04 47%
27
FeOx -G
O-36
327 131
40%
196 60%
0.20
0.07 35%
0.13
65%
6
FeOx -G
O-60
331 78
24%
253 76%
0.21
0.04 20%
0.17
80%
6
FeOx -G
O-80
341 38
11%
303 89%
0.29
0.02 7%
0.27
93%
7
Iron Oxide
71 1.4
2%
69.6 98%
0.36
0.00 0%
0.36
100%
28
a) BET surface area (S
BET ), surface area of micropores (S
d <20 Å) and surface area of m
eso-/macro-pores (S
d >20 Å) determ
ined with
the t-plot method. The percentage data denote the percentage of surface area of m
icropores or meso- and m
acropores relative to the
total surface area. b) Total pore volume (V
total ), micropore volum
e (Vd <20 Å
) determined w
ith the t-plot method. The percentage data
denote the percentage of pore volume of m
icropores relative to the total pore volume. c) A
verage meso-/m
acropore size (Dm
eso/macro )
determined from
the N2 desorption data w
ith NLD
FT model.

24
Relative to GO and the crystalline Fe3O4 control sample, the three composites show significantly
enhanced surface area (327–341 m² g-1) and pore volume (0.20–0.29 cm3 g-1). Meanwhile, both
surface area and pore volume show slight increases with the increase of the iron oxide content
from FeOx-GO-36 to FeOx-GO-80. From the data in Table 1 and the pore size distribution in
Figure 6(b), the enhanced surface area and pore volume arise mainly from the generation of more
mesopores with sizes ≤ 12 nm. Both the micropore surface area and micropore volume of the
composites show a trend of decrease with the increase of iron oxide content (see Figure 6(c) and
Table 1). Relative to the value of about 27 nm for both GO and the iron oxide control sample, the
average meso-/macropore size of the composites is about 7 nm, which is in the same range as the
average size (ca. 5 nm) of the amorphous iron oxide nanoparticles seen above from the TEM
images. This indicates that the generated mesopores are primarily inter-particle pores resulting
from the packing/aggregation of the amorphous iron oxide nanoparticles. The surface area data
of the three composites are also significantly higher than those of other iron oxide-GO/RGO
nanocomposites [23,30] and various iron oxide nanostructures [13-21] reported in the literature.
Clearly, the loading of the amorphous iron oxide nanoparticles on GO renders enhanced surface
area and pore volume through the creation of more mesopore structures, which is beneficial to
arsenic adsorption due to the increased active sites for the adsorption as shown below.
Unlike the composites herein, the iron oxides present in other iron oxide-GO/RGO composites
reported in the literature for arsenic adsorption are often in the form of crystalline nanoparticles,
despite very similar synthesis procedures and conditions as we used herein [23–33]. Though a
precise mechanism is not known, we reason that this results from the different GO/RGO
substrates employed, which affects the morphology of the loaded iron oxides. The exclusive
formation of crystalline Fe3O4 nanoparticles in the control sample prepared in the absence of GO
herein supports this hypothesis. The GO substrate synthesized herein via the improved method
should be more oxidized than those commonly synthesized via the Hummers or modified

25
Hummers method for the preparation of composites in the literature. The higher level of
oxidation likely improves the complexation of iron species with GO, inhibits the formation of
crystallization nuclei, and thus promotes the formation of amorphous iron oxide nanoparticles.
3.2 Arsenic Adsorption with FeOx-GO Nanocomposites
The performance of the FeOx-GO nanocomposites for batch adsorption of both As(III) and
As(V) has been systematically investigated, along with GO and the iron oxide control sample for
comparison. The effect of the dosage (0.1–1 mg mL-1) of FeOx-GO-80 on the adsorption of
As(III) (at pH = 7) and As(V) (at pH = 3) was first studied at the initial concentration of 1200
and 350 mg L−1, respectively. The pH values were so chosen as to achieve optimum adsorption
as shown below in the study on the effects of pH. Figure S7 shows the dependencies of the
equilibrium adsorption amount (qe) on the adsorbent dosage. In general, qe changes only
marginally across the whole adsorbent dosage range, with the highest values obtained at the
dosage of 0.8 mg mL-1 for both As(III) and As(V). The adsorbent dosage of 0.8 mg mL-1 was
thus chosen for all subsequent investigations.
Figure 7 shows the arsenic adsorption isotherms of the various composite adsorbents as well as
of GO and the iron oxide control sample in a broad equilibrium concentration range. The initial
arsenic concentrations are 25–1200 mg L−1 for As(III) at pH = 7 and 25–350 mg L−1 for As(V) at
pH = 3. All the isotherms have been found to follow the Langmuir adsorption model (Equation
2) well with the high correlation coefficients (R2 ≈ 1, see Table S1 for fitting results) found. On
the contrary, the isotherms do not fit the Freundlich model well (see Figure S8 and Table S2).
Particularly, no Freundlich fitting can be made with respect to the As(V) adsorption isotherms of
the nanocomposite adsorbents or the Fe3O4 control sample. This suggests that the adsorption of

26
both As(III) and As(V) with the adsorbents herein can be regarded as monolayer adsorption
processes.
Figure 7. (a) As(III) adsorption isotherms (at pH = 7) and (b) As(V) adsorption isotherms (at
pH = 3) of FeOx-GO nanocomposites, GO, and the iron oxide control sample. All the isotherms
are well fitted with the Langmuir model (solid line).
Among the adsorbents, GO shows the poorest adsorption performance with the lowest isotherms.
Its maximum/saturated adsorption capacity (qmax) is only 19 and 28 mg g-1 for As(III) and As(V),
respectively. The iron oxide control sample (qmax values of 110 and 65 mg g-1) has its isotherms
nearly overlapping with those of FeOx-GO-36 (qmax values of 90 and 59 mg g-1), indicating their
similar adsorption performance. Despite its lower surface area, the much higher qmax values
found with the iron oxide control sample than those with GO confirms the significantly higher
affinity of the iron oxide surface for the arsenic species. With the increase of iron oxide content
from FeOx-GO-36 to FeOx-GO-80, the isotherms for both As(III) and As(V) continuously shift
upward, indicating the improved adsorption. FeOx-GO-80 is featured with highest qmax values of
147 and 113 mg g−1 for As(III) and As(V), respectively, among all the adsorbents. While the
surface area of three composites are only slightly different, the significant increase in qmax from

27
FeOx-GO-36 to FeOx-GO-80 possibly results from the generation of significantly more iron
oxide active sites of higher adsorption affinity per unit area with the increase of iron oxide
content. Meanwhile, the increase in the more accessible mesopore surface area, along with the
reduction in micropore surface area, upon the increase of iron oxide content as shown above also
endows the improved accessibility of the active sites.
Table 2. Comparison of maximum arsenic adsorption capacities achieved with iron oxide-
GO/RGO nanocomposites.
Adsorbent Iron oxide content SBET (m2/g)
qmax (mg g-1) Reference As(III) As(V)
Amorphous iron oxide-GO nanocomposites
80 wt% of amorphous iron
oxide 341 147 113 this study
Fe3O4-RGO composites 75 wt% of Fe3O4 117 13.10 5.83 [23] Fe(OH)3-GO composites 54 wt% of Fe(OH)3 23.78 [24] Fe3O4-GO-LDH composites 21.1 wt% of Fe3O4 123.3 73.14 [25]
Fe3O4-GO composites 80% of Fe3O4 59.6 [26] Fe-Fe2O3-graphene nanoplatelet composites 11.34 [27]
Fe-GO nanocomposites 165 3.26 [30] Fe3O4-RGO nanocomposites 7.5 16 [31]
α-Fe2O3-Fe3O4-GO composite
51.7 wt% of iron oxide 26.76 54.18 [32]
Fe3O4-RGO composite 3.36 [33]
The qmax values found with FeOx-GO-80 herein are the highest among all the iron oxide-
GO/RGO composite adsorbents reported to date and are also comparable to the best values
achieved thus far with various sophisticatedly synthesized iron oxide nanostructures [13–20].
Table 2 compares the arsenic adsorption capacity achieved with various iron oxide-GO/RGO
composite adsorbents. Meanwhile, all the FeOx-GO nanocomposites and the iron oxide control
sample show higher qmax for As(III) than for As(V), while opposite for GO. This suggests the

28
different interactions of the arsenic species with the adsorbents. It is desirable because of the
prevalence of As(III) in groundwater and wastewater, which has higher toxicity than As(V) [1–
3].
Not only featured with high adsorption capacity in the high arsenic concentration range, FeOx-
GO-80 also exhibits superior arsenic removal efficiency at the low arsenic concentration range.
At the low initial arsenic concentrations (118 and 108 µg L-1 for As(III) and As(V), respectively,
with pH of 6.5 typical for drinking waters), the equilibrium arsenic concentration after
adsorption with FeOx-GO-80 at the dosage of 0.8 mg mL-1 can be reduced to lower than 0.02 µg
L-1 for both As(III) and As(V), which is much lower than the maximum arsenic level of 10 µg L-
1 suggested by World Health Organization (WHO) for drinking water [54]. This corresponds to
>99.98% of arsenic removal. No other adsorbents have been previously demonstrated to remove
arsenic to such a low concentration. With a high-performance γ-Fe2O3-macroporous silica
composite adsorbent [38], Yu et al. previously reported to reduce the arsenic concentration to < 2
µg L-1 from the initial arsenic concentration of 100 µg L-1. In this regard, FeOx-GO-80 well
competes with it while with the advantage of more convenient, cost effective synthesis.
Figure 8(a) shows the adsorption kinetics curves with FeOx-GO-80 as the adsorbent at initial
arsenic concentration of 400 and 350 mg L−1 for As(III) and As(V), respectively. For both
As(III) and As(V), the adsorption can be divided into two stages, a rapid uptake within the first
15 min of contact and a slow uptake thereafter until equilibrium is reached. In particular, the
majority of the arsenic uptake, 70 and 77% for As(III) and As(V), respectively, occurs within the
first 15 min, indicating the very fast adsorption rate. The pseudo-second-order kinetic model
(Equations 3 and 4), widely used to fit the kinetic process of metal ion adsorption at the
solid/water interfaces, is employed to fit the curves. Excellent fitting of the experimental data is
achieved with the model, with the correlation coefficients of 0.9998 and 0.9992, respectively

29
(see Figure 8(b) and Table S1), indicating the adsorption process occurs through the chemical
interaction [55]. Meanwhile, the adsorption rates for both As(III) and As(V) are similarly high,
with the same rate constant k2 of 0.001 g mg-1 min-1 achieved. The k2 value is very high, in
particular for As(III), when compared to other superior adsorbents reported in the literature. For
example, the high-performance γ-Fe2O3-macroporous silica composite adsorbent reported by Yu
et al. has the k2 values of 0.00015 and 0.0014 g mg-1 min-1 for As(III) and As(V), respectively,
under similar conditions [38]. Therein, the adsorption rate for As(III) is 10 times slower than for
As(V). The significantly high adsorption rate found with FeOx-GO-80 for more toxic As(III) is
thus remarkable, confirming its superior kinetics performance.
Figure 8. (a) As(III) and As(V) adsorption kinetic curves with FeOx-GO-80 (initial arsenic
concentration of 400 and 350 mg L−1 for As(III) (pH = 7) and As(V) (pH = 3), respectively; (b)
fitting of the kinetic curves with the pseudo-second-order model.
The effects of the pH of the medium on arsenic adsorption have also been investigated since it
changes the surface charge of FeOx-GO composites and arsenic species distribution [1–4]. Figure
9(a) shows qe as a function of pH (within 2–10) with FeOx-GO-80 at the initial As(III) and As(V)
concentration of 350 mg L−1. With the increase of pH from 2 to 10, qe for As(V) keeps dropping
from 118 mg g−1 at pH = 2 to 55 mg g−1 at pH = 10. On the contrary, qe for As(III) stays nearly at
(a) (b)

30
a plateau (105 mg g−1) within the pH range of 7–10 and shows a steady drop to 70 mg g−1 with
the decrease of pH from 7 to 2. Similar trends of the effects of pH have commonly been
observed with iron oxide-based adsorbents and can be explained by the changes in surface
charge of the adsorbents and the arsenic speciation [7–9,12,21–24,26,32,34,37,38]. Figure 9(b)
shows the dependence of surface charge of FeOx-GO-80 on pH. Increasing pH leads to a
continuous decrease of its surface charge, with the point of zero charge (pHPZC) being about 5.9.
Its surface is positively charged at pH < pHPZC. Under most pH conditions, As(V) is present in
negative ionic form (H2AsO4− at pH 2.2–6.5, HAsO4
2− at pH 6.5–11.5), whereas As(III) is in a
neutral form (H3AsO3 at pH below 9.2) [2]. The electrostatic interactions between positively
charged FeOx-GO-80 and negatively charged As(V) species result in the strong adsorption of
FeOx-GO-80 when pH < pHPZC. The surface of FeOx-GO-80 is negatively charged at pH >
pHPZC, repulsing the negatively charged As(V) species. As such, increasing the pH leads to
continuous reductions in qe for As(V).
However, the adsorption mechanism of As(III) on FeOx-GO-80 is different given the opposite
trend of change. We first suspected that the lower As(III) uptake at the acidic conditions (2–6)
might result from the dissolution and leaching of the iron oxide species from FeOx-GO-80 into
the solution [23]. This was, however, ruled out. No Fe species was detected within the detection
limit (< 0.5 ppm) of atomic absorption spectroscopy in the equilibrium solutions even at the
highly acidic condition with pH = 2, demonstrating the strong binding of the iron oxide species
on GO. The results suggest that As(III) is adsorbed onto FeOx-GO-80 through a surface
complexation mechanism, rather than electrostatic interactions [23]. The adsorption capacity
increase with increasing pH may be attributed to the enhanced surface hydroxyl groups at higher
pH values for complexation [37]. Similar patterns of dependence have been noted in the
literature [37]. However, the precise mechanism is currently still unknown and requires further
investigation.

31
Figure 9. (a) Arsenic uptake of FeOx-GO-80 as a function of pH (initial arsenic concentration
of 350 mg L-1); (b) Zeta potential of FeOx-GO-80 as a function of pH.
We have also examined the effects of coexisting anions (SO42-, CO3
2-, and PO43-) on the arsenic
adsorption with FeOx-GO-80 (dosage: 0.8 mg mL-1) at the low initial arsenic concentration (118
and 108 µg L-1 for As(III) and As(V), respectively) and at the initial pH of 6.5 (i.e., mimicking
drinking water). To simulate the extreme situations, the concentration of the coexisting anions is
set excessively high, with molar concentration being 1,000 times that of arsenic. Figure 10 shows
the residual arsenic concentrations achieved after the adsorption. In the presence of SO42-, CO3
2-,
and PO43-, As(III) concentration is effectively reduced to < 0.02, < 0.02, and 10 µg L-1,
respectively, and As(V) concentration is correspondingly reduced to < 0.02, 22, and 76 µg L-1,
respectively. Clearly, the presence of SO42- has no appreciable effect on the adsorption of both
As(III) and As(V). CO32- shows negligible impact on As(III) adsorption but slightly reduces the
adsorption of As(V). Its effect on As(V) adsorption may be explained by an increase in pH after
its dissolution in the arsenic solution [32]. Though causing only a small reduction in the
adsorption of As(III), PO43- shows the expected most intense reduction in the adsorption of
As(V). PO43- is a known strong competing anion for arsenic adsorption and can strongly compete
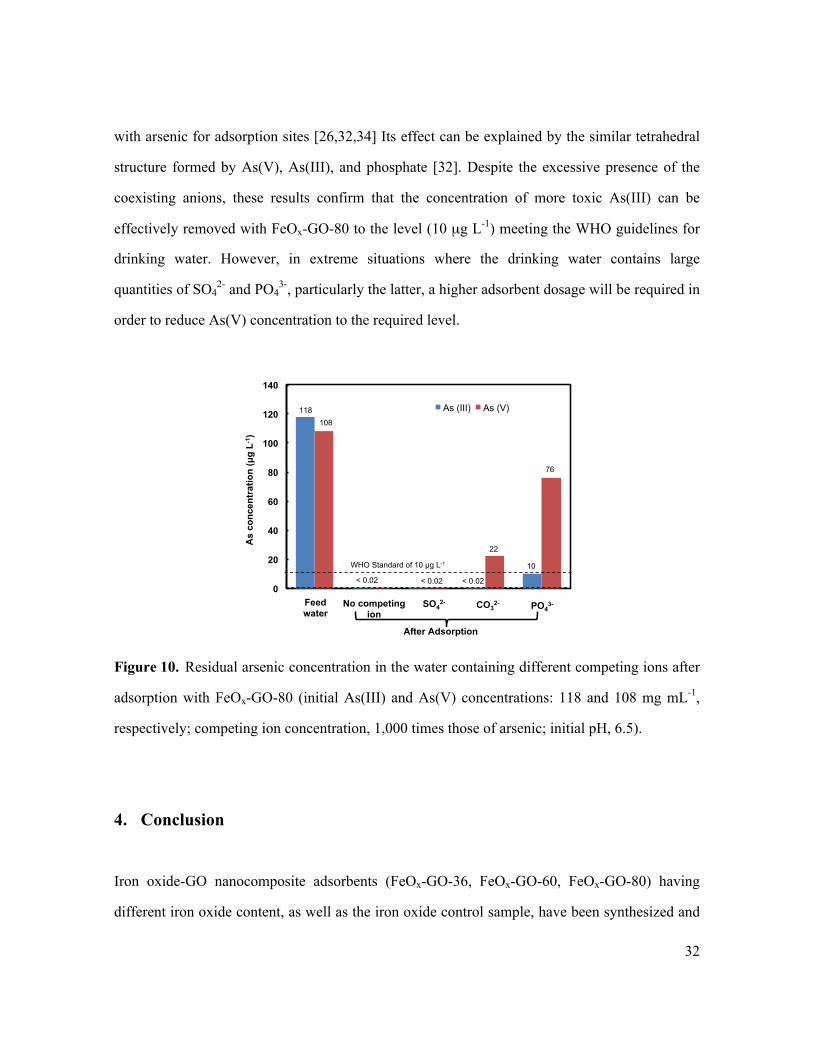
32
with arsenic for adsorption sites [26,32,34] Its effect can be explained by the similar tetrahedral
structure formed by As(V), As(III), and phosphate [32]. Despite the excessive presence of the
coexisting anions, these results confirm that the concentration of more toxic As(III) can be
effectively removed with FeOx-GO-80 to the level (10 µg L-1) meeting the WHO guidelines for
drinking water. However, in extreme situations where the drinking water contains large
quantities of SO42- and PO4
3-, particularly the latter, a higher adsorbent dosage will be required in
order to reduce As(V) concentration to the required level.
Figure 10. Residual arsenic concentration in the water containing different competing ions after
adsorption with FeOx-GO-80 (initial As(III) and As(V) concentrations: 118 and 108 mg mL-1,
respectively; competing ion concentration, 1,000 times those of arsenic; initial pH, 6.5).
4. Conclusion
Iron oxide-GO nanocomposite adsorbents (FeOx-GO-36, FeOx-GO-60, FeOx-GO-80) having
different iron oxide content, as well as the iron oxide control sample, have been synthesized and
0
20
40
60
80
100
120
140
As
conc
entr
atio
n (µ
g L-
1 )
As (III) As (V)
Feed water
SO42- CO3
2- PO43- No competing
ion
WHO Standard of 10 µg L-1
< 0.02 < 0.02 < 0.02
After Adsorption
118
108
22
10
76

33
investigated for arsenic removal. Detailed characterization of the nanocomposites has been
undertaken systematically with TGA, TEM, FTIR, XPS, XRD, Raman, and N2 sorption. In
particular, the evidence from XRD and TEM confirms that the iron oxide is primarily in the form
of amorphous iron oxide nanoparticles (ca. 5 nm in size), which distribute uniformly in the
nanocomposites, along with a minor presence of crystalline α-Fe2O3. On the contrary, the iron
oxide control sample prepared in the absence of GO is crystalline Fe3O4, demonstrating the
pronounced inhibiting effects of the GO substrate on crystal formation in the nanocomposites.
The nanocomposites have significantly enhanced surface area (327–341 m2/g) relative to GO and
the crystalline iron oxide control sample, which shows slight increases with the increase of iron
oxide content.
The nanocomposite adsorbents show significantly high arsenic adsorption capacities relative to
GO and the iron oxide control sample. Increased arsenic adsorption capacities are found with the
increase of iron oxide content due to the increase in surface area and the generation of more
accessible active sites. In particular, FeOx-GO-80 shows high qmax values of 147 and 113 mg g−1
for As(III) and As(V), respectively, which are highest among various iron oxide-GO/RGO
composite adsorbents reported to date. Meanwhile, FeOx-GO-80 has been demonstrated to
remarkably reduce the arsenic concentration from 118 (for As(III)) or 108 µg L-1 (for As(V)) to
< 0.02 µg L-1. The kinetic study also confirms the fast uptake of arsenic with FeOx-GO-80. The
pH study indicates that As(V) is adsorbed through electrostatic interactions while As(III) is
adsorbed by surface complexation. In addition, FeOx-GO-80 shows well-retained adsorption
performance towards As(III) despite the excessive presence of co-existing anions (SO42-, CO3
2-,
and PO43-). With the superior performance, this class of FeOx-GO nanocomposites has high
potential for arsenic removal in practical water treatment, particularly in drinking water
purification, given the low cost of GO that can be produced cost-effectively from abundant
natural graphite and the convenient synthesis of the nanocomposites. Further mechanistic studies

34
and the evaluation on the reusability of the nanocomposites and their suitability in column
studies are to be undertaken.
Supporting Information Available
AFM image of GO (Figure S1); C1s and O12 XPS spectra of GO, FeOx-GO-36, FeOx-GO-80
and the iron oxide control sample (Figure S2); particle size distribution of the Fe3O4
nanoparticles in the iron oxide control sample (Figure S3); DF-STEM image and elemental maps
of FeOx-GO-80 and FeOx-GO-36 (Figures S4 and S5); Raman spectra (Figure S6); arsenic
adsorption uptake with FeOx-GO-80 at different dosages (Figure S7); summary of fitting
parameters of arsenic adsorption isotherms and kinetics (Tables S1 and S2).
Acknowledgement
We thank the Natural Science and Engineering Research Council (NSERC) of Canada for
funding this research through an Engage Grant (EGP 491823-15) and a Discovery Grant
(RGPIN-2015-03815).
References
[1] B.K. Mandal, K.T. Suzuki, Arsenic round the world: a review, Talanta 58 (2002) 201–235.
[2] P.L. Smedley, D.G. Kinniburgh, A review of the source, behavior and distribution of arsenic
in natural waters, Appl. Geochem. 17 (2002) 517–568.
[3] T.S.Y. Choong, T.G. Chuah, Y. Robiah, F.L.G. Koay, I. Azni, Arsenic toxicity, health
hazards and removal techniques from water: an overview, Desalination 217 (2007) 139–166.

35
[4] D. Mohan, C.U. Pittman Jr, Arsenic removal from water/wastewater using adsorbents – a
critical review, J. Hazard. Mater. 142 (2007) 1–53.
[5] S.C.N. Tang, I.M.C. Lo, Magnetic nanoparticles: essential factors for sustainable
environmental applications, Water Res. 47 (2013) 2613–2632.
[6] M.L. Pierce, C.B. Moore, Adsorption of arsenite and arsenate on amorphous iron hydroxide,
Water Res. 16 (1982) 1247–1253.
[7] K.P. Raven, A. Jain, R.H. Loeppert, Arsenite and arsenate adsorption on ferrihydrite:
kinetics, equilibrium and adsorption envelopes, Environ. Sci. Technol. 32 (1998) 344–349.
[8] S. Dixit, J.G. Hering, Comparison of arsenic(V) and arsenic(III) sorption onto iron oxide
minerals: implications for arsenic mobility, Environ. Sci. Technol. 37 (2003) 4182–4189.
[9] S. Luther, N. Borgfeld, J. Kim, J.G. Parsons, Removal of arsenic from aqueous solution: a
study of the effects of pH and interfering ions using iron oxide nanomaterials, Microchem. J.
101 (2012) 30–36.
[10] S. Yean, L. Cong, C.T. Yavuz, J.T. Mayo, W.W. Yu, A.T. Kan, V.L. Colvin, M.B. Tomson,
Effect of magnetite particle size on adsorption and desorption of arsenite and arsenate, J.
Mater. Res. 20 (2005) 3255–3264.
[11] C.T. Yavuz, J.T. Mayo, W.W. Yu, A. Prakash, J.C. Falkner, S. Yean, L. Cong, H.J. Shipley,
A. Kan, M. Tomson, D. Natelson, V.L. Colvin, Low-field magnetic separation of
monodisperse Fe3O4 nanocrystals, Science 314 (2006) 964–967.
[12] T. Tuutijärvi, J. Lu, M. Sillanpää, G. Chen, As(V) adsorption on maghemite nanoparticles, J.
Hazard. Mater. 166 (2009) 1415–1420.
[13] L.-S. Zhong, J.-S. Hu, H.-P. Liang, A.-M. Cao, W.-G. Song, L.-J. Wan, Self-assembled 3D
flowerlike iron oxide nanostructures and their application in water treatment, Adv. Mater. 18
(2006) 2426–2431.

36
[14] F. Mou, J. Guan, Z. Xiao, Z. Sun, W. Shi, X.-A. Fan, Solvent-mediated synthesis of
magnetic Fe2O3 chestnut-like amorphous-core/γ-phase-shell hierarchical nanostructures with
strong As(V) removal capability, J. Mater. Chem. 21 (2011) 5414–5421.
[15] F. Mou, J. Guan, H. Ma, L. Xu, W. Shi, Magnetic iron oxide chestnutlike hierarchical
nanostructures: preparation and their excellent arsenic removal capabilities, ACS Appl.
Mater. Interfaces 4 (2012) 3987–3993.
[16] C.-Y. Cao, J. Qu, W.-S. Yan, J.-F. Zhu, Z.-Y. Wu, W.-G. Song, Low-cost synthesis of
flowerlike α-Fe2O3 nanostructures for heavy metal ion removal: adsorption property and
mechanism, Langmuir 28 (2012) 4573–4579.
[17] B. Wang, H. Wu, L. Yu, R. Xu, T.-T. Lim, X.W. Lou, Template-free formation of uniform
urchin-like α-FeOOH hollow spheres with superior capability for water treatment, Adv.
Mater. 24 (2012) 1111–1116.
[18] T. Wang, L. Zhang, H. Wang, W. Yang, Y. Fu, W. Zhou, W. Yu, K. Xiang, Z. Su, S. Dai, L.
Chai, Controllable synthesis of hierarchical porous Fe3O4 particles mediated by
poly(diallyldimethylammonium chloride) and their application in arsenic removal, ACS
Appl. Mater. Interfaces 5 (2013) 12449–12459.
[19] Z. Wei, R. Xing, X. Zhang, S. Liu, H. Yu, P. Li, Facile template-free fabrication of hollow
nestlike α-Fe2O3 nanostructures for water treatment, ACS Appl. Mater. Interfaces 5 (2013)
598–604.
[20] G.K. Das, C.S. Bonifacio, J. De Rojas, K. Liu, K. van Benthem, I.M. Kennedy, Ultra-long
magnetic nanochains for highly efficient arsenic removal from water, J. Mater. Chem. A. 2
(2014) 12974–12981.
[21] M. Jang, S.-H. Min, T.-H. Kim, J.K. Park, Removal of arsenite and arsenate using hydrous
ferric oxide incorporated into naturally occurring porous diatomite, Environ. Sci. Technol.
40 (2006) 1636–1643.

37
[22] Z. Gu, J. Fang, B. Deng, Preparation and evaluation of GAC-based iron-containing
adsorbents for arsenic removal, Environ. Sci. Technol. 39 (2005) 3833–3843.
[23] V. Chandra, J. Park, Y. Chun, J.W. Lee, I.-C. Hwang, K.S. Kim, Water-dispersible
magnetite-reduced graphene oxide composites for arsenic removal, ACS Nano 4 (2010)
3979–3986.
[24] K. Zhang, V. Dwivedi, C. Chi, J. Wu, Graphene oxide/ferric hydroxide composites for
efficient arsenate removal from drinking water, J. Hazard. Mater. 182 (2010) 162–169.
[25] X.-L. Wu, L. Wang, C.-L. Chen, A.-W. Xu, X.-K. Wang, Water-dispersible magnetite-
graphene-LDH composites for efficient arsenate removal, J. Mater. Chem. 21 (2011) 17353–
17359.
[26] G. Sheng, Y. Li, X. Yang, X. Ren, S. Yang, J. Hu, X. Wang, Efficient removal of arsenate
by versatile magnetic graphene oxide composites, RSC Adv. 2 (2012) 12400–12407.
[27] J. Zhu, R. Sadu, S. Wei, D.H. Chen, N. Haldolaarachchige, Z. Luo, J.A. Gomes, D.P.
Young, Z. Guo, Magnetic graphene nanoplatelet composites toward arsenic removal, ECS J.
Solid State Sci. Techn. 1 (2012) M1–M5.
[28] J. Zhu, S. Wei, H. Gu, S.B. Rapole, Q. Wang, Z. Luo, N. Haldolaarachchige, D.P. Young, Z.
Guo, One-pot synthesis of magnetic graphene nanocomposites decorated with core@double-
shell nanoparticles for fast chromium removal, Environ. Sci. Technol. 46 (2012) 977–985.
[29] Y. Wang, Q. He, H. Qu, X. Zhang, J. Guo, J. Zhu, G. Zhao, H.A. Colorado, J. Yu, L. Sun, S.
Bhana, M.A. Khan, X. Huang, D.P. Young, H. Wang, X. Wang, S. Wei, Z. Guo, Magnetic
graphene oxide nanocomposites: nanoparticles growth mechanism and property analysis, J.
Mater. Chem. C 2 (2014) 9478–9488.
[30] G. Gollavelli, C.-C. Chang, Y.-C. Ling, Facile synthesis of smart magnetic graphene for safe
drinking water: heavy metal removal and disinfection control, ACS Sustainable Chem. Eng.
1 (2013) 462–472.

38
[31] B. Paul, V. Parashar, A. Mishra, Graphene in the Fe3O4 nano-composite switching the
negative influence of humic acid coating into an enhancing effect in the removal of arsenic
from water, Environ. Sci.: Water Res. Technol. 1 (2015) 77–83.
[32] F. Yu, S. Sun, J. Ma, S. Han, Enhanced removal performance of arsenate and arsenite by
magnetic graphene oxide with high iron oxide loading, Phys. Chem. Chem. Phys. 17 (2015)
4388–4397.
[33] J. Ding, B. Li, Y. Liu, X. Yan, S. Zeng, X. Zhang, L. Hou, Q. Cai, J. Zhang, Fabrication of
Fe3O4@reduced graphene oxide composite via novel colloid electrostatic self-assembly
process for removal of contaminants from water, J. Mater. Chem. A 3 (2015) 832–839.
[34] X. Yu, S. Tong, M. Ge, J. Zuo, C. Cao, W. Song, One-step synthesis of magnetic composites
of cellulose@iron oxide nanoparticles for arsenic removal, J. Mater. Chem. A 1 (2013) 959–
965.
[35] Z. Wu, W. Li, P.A. Webley, D. Zhao, General and controllable synthesis of novel
mesoporous magnetic iron oxide@carbon encapsulates for efficient arsenic removal, Adv.
Mater. 24 (2012) 485–491.
[36] M. Baikousi, A.B. Bourlinos, A. Douvalis, T. Bakas, D.F. Anagnostopoulos, J. Tucek, K.
Safarova, R. Zboril, M.A. Karakassides, Synthesis and characterization of γ-Fe2O3/carbon
hybrids and their application in removal of hexavalent chromium ions from aqueous
solutions, Langmuir 28 (2012) 3918–3930.
[37] B. Chen, Z. Zhu, J. Ma, Y. Qiu, J. Chen, Surfactant-assisted Ce-Fe mixed oxide decorated
multiwalled carbon nanotubes and their arsenic adsorption performance, J. Mater. Chem. A
1 (2013) 11355–11367.
[38] J. Yang, H. Zhang, M. Yu, I. Emmanuelawati, J. Zou, Z. Yuan, C. Yu, High-content, well-
dispersed γ-Fe2O3 nanoparticles encapsulated in macroporous silica with superior arsenic
removal performance, Adv. Funct. Mater. 24 (2014) 1354–1363.

39
[39] H. Chang, H. Wu, Graphene-based nanocomposites: preparation, functionalization, and
energy and environmental applications, Energy Environ. Sci. 6 (2013) 3483–3507.
[40] J. Zhu, M. Chen, Q. He, L. Shao, S. Wei, Z. Guo, An overview of the engineered graphene
nanostructures and nanocomposites, RSC Adv. 3 (2013) 22790–22824.
[41] K.C. Kemp, H. Seema, M. Saleh, N.H. Le, K. Mahesh, V. Chandra, K.S. Kim,
Environmental applications using graphene composites: water remediation and gas
adsorption, Nanoscale 5 (2013) 3149–3171.
[42] R.K. Upadhyay, N. Soin, S.S. Roy, Role of graphene/metal oxide composites as
photocatalysts, adsorbents and disinfectants in water treatment: a review, RSC Adv. 4
(2014) 3823–3851.
[43] D.C. Marcano, D.V. Kosynkin, J.M. Berlin, A. Sinitskii, Z. Sun, A. Slesarev, L.B. Alemany,
W. Lu, J.M. Tour, Improved synthesis of graphene oxide, ACS Nano 4 (2010) 4806–4814.
[44] W.S. Hummers, R.E. Offeman, Preparation of graphitic oxide, J. Am. Chem. Soc. 80 (1958)
1339.
[45] C.P. Huang, L.M. Vane, Enhancing As5+ removal by a Fe2+-treated activated carbon, J.
Water Pollut. Control Fed. 61 (1989) 1596–1603.
[46] S. Stankovich, D.A. Dikin, R.D. Piner, K.A. Kohlhaas, A. Kleinhammes, Y. Jia, Y. Wu, S.T.
Nguyen, R.S. Ruoff, Synthesis of graphene-based nanosheets via chemical reduction of
exfoliated graphite oxide, Carbon 45 (2007) 1558–1565.
[47] W. Zhang, X. Shi, Y. Zhang, W. Gu, B. Li, Y. Xian, Synthesis of water-soluble magnetic
graphene nanocomposites for recyclable removal of heavy metal ions, J. Mater. Chem. A 1
(2013) 1745–1753.
[48] S. Park, J. An, I. Jung, R.D. Piner, S.J. An, X. Li, A. Velamakanni, R.S. Ruoff, Colloidal
suspension of highly reduced graphene oxide in a wide variety of organic solvents, Nano
Lett. 9 (2009) 1593–1597.

40
[49] H. Kong, J. Song, J. Jang, One-step fabrication of magnetic γ-Fe2O3/polyrhodanine
nanoparticles using in situ chemical oxidation polymerization and their antibacterial
properties, Chem. Commun. 46 (2010) 6735–6737.
[50] G. Bhargava, I. Gouzman, C.M. Chun, T.A. Ramanarayanan, S.L. Bernasek,
Characterization of the “native” surface thin film on pure polycrystalline iron: a high
resolution XPS and TEM study, Appl. Surface Sci. 253 (2007) 4322–4329.
[51] S. Bera, M. Ghosh, M. Pal, N. Das, S. Saha, S. K. Dutta, S. Jana, Synthesis, characterization
and cytotoxicity of europium incorporated ZnO-graphene nanocomposites on human MCF7
breast cancer cells. RSC Adv. 4 (2014) 37479–37490.
[52] L. Xu, J.-W. McGraw, F. Gao, M. Grundy, Z. Ye, Z. Gu, J.L. Shepherd, production of high-
concentration graphene dispersions in low-boiling-point organic solvents by liquid-phase
noncovalent exfoliation of graphite with a hyperbranched polyethylene and formation of
graphene/ethylene copolymer composites, J. Phys. Chem. C 117 (2013) 10730–10742.
[53] K.S.W. Sing, D.H. Everett, R.A.W. Haul, L. Moscou, R.A. Pierotti, J. Rouquerol, T.
Siemieniewska, Reporting physisorption data for gas/solid systems with special reference to
the determination of surface area and porosity, Pure Appl. Chem. 57 (1985) 603–619.
[54] World Health Organization, Guidelines for Drinking Water Quality 2011.
[55] Y.S. Ho, G. Mckay, The kinetics of sorption of divalent metal ions onto sphagnum moss
peat, Water Res. 34 (2000) 735–742.

41
Supporting Information for
High-Performance Iron Oxide-Graphene Oxide Nanocomposite Adsorbents
for Arsenic Removal
Hui Su,1 Zhibin Ye1,* and Nuri Hmidi2
1 Bharti School of Engineering, Laurentian University, Sudbury, Ontario P3E 2C6, Canada 3 Goldcorp Incorporated, Red Lake Gold Mines, 15 Mine Road, Box 2000, Balmertown,
Ontario P0V 1C0, Canada
* Corresponding author. Email: [email protected]; Telephone: 1 (705) 6751151 ext. 2343

42
Figure S1 (a) AFM height image of GO; (b) height profiles across three profiles denoted in (a).

43
Figure S2. The C1s (a) and O1s (b) scan results of GO, FeOx-GO-36, FeOx-GO-80 and the iron
oxide control sample.

44
Figure S3. Particle size distribution of the Fe3O4 nanoparticles (on the basis of 120 nanoparticles found in TEM) in the iron oxide control sample.
9-11 11-13 13-15 15-17 17-19 19-21 21-23
Particle Size / nm

45
Figure S4. DF-STEM image (a) and the corresponding C (b), O (c), and Fe (d) elemental maps
of FeOx-GO-80.

46
Figure S5. DF-STEM image (a) and the corresponding C (b) O (c) and Fe (d) elemental maps
of FeOx-GO-36.

47
Figure S6. Raman spectra of GO, FeOx-GO-36, FeOx-GO-80, and the Fe3O4 control sample.
150 250 350 450 550 650 750 850
Ram
an In
tens
ity (a
.u.)
Wavenumber / cm-1
Fe3O4
FeOx-GO-80
FeOx-GO-36
GO
Fe3O4
FeOx-GO-80
FeOx-GO-36
GO
(a)
1000 1200 1400 1600 1800 2000
Ram
an In
tens
ity (a
.u.)
Wavenumber / cm-1
FeOx-GO-80
FeOx-GO-36
GO
D-band: 1350 cm-1
G-band: 1610 cm-1
ID/IG = 0.79
ID/IG = 0.93
ID/IG = 0.95
Fe3O4
(b)

48
Figure S7. Arsenic adsorption with FeOx-GO-80 at different dosages (0.1–1 mg mL-1). Initial
arsenic concentration: 1200 and 350 mg L−1 for As(III) (at pH = 7) and As(V) (at pH = 3),
respectively.

49
Figure S8. Freundlich fitting of the isotherms of (a) As(III) adsorption and (b) As(V) adsorption.
In the case of As(V) adsorption isotherms in (b), no fitting can be made except that of GO.
0
20
40
60
80
100
120
140
160
0 200 400 600 800 1000 1200 1400
q e /
mg
g-1
Ce / mg L-1
FeOx-GO-80 FeOx-GO-60 Iron oxide FeOx-GO-36 GO
(a)
0
20
40
60
80
100
120
0 50 100 150 200 250 300 350
q e /
mg
g-1
Ce / mg L-1
FeOx-GO-80 FeOx-GO-60 Iron oxide FeOx-GO-36 GO
(b)
50
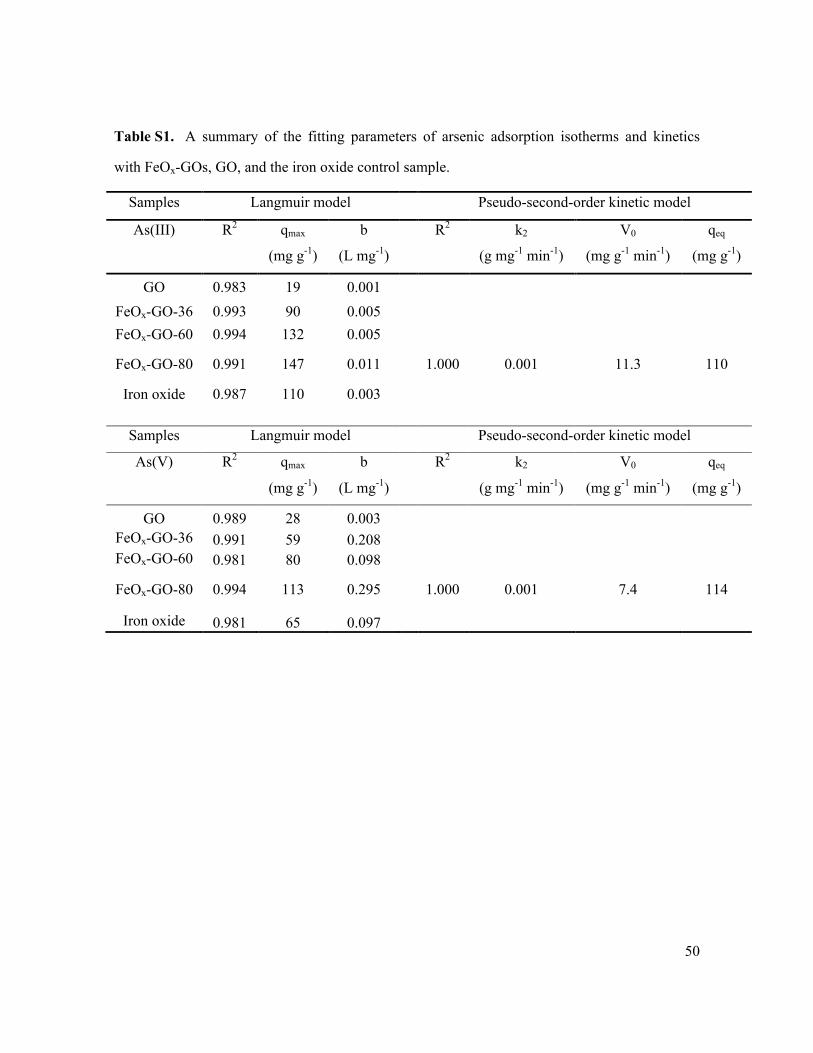
Table S1. A summary of the fitting parameters of arsenic adsorption isotherms and kinetics
with FeOx-GOs, GO, and the iron oxide control sample.
Samples Langmuir model Pseudo-second-order kinetic model
As(III) R2 qmax
(mg g-1)
b
(L mg-1)
R2 k2
(g mg-1 min-1)
V0
(mg g-1 min-1)
qeq
(mg g-1)
GO 0.983 19 0.001 FeOx-GO-36 0.993 90 0.005 FeOx-GO-60 0.994 132 0.005
FeOx-GO-80 0.991 147 0.011 1.000 0.001 11.3 110
Iron oxide 0.987 110 0.003
Samples Langmuir model Pseudo-second-order kinetic model
As(V) R2 qmax
(mg g-1)
b
(L mg-1)
R2 k2
(g mg-1 min-1)
V0
(mg g-1 min-1)
qeq
(mg g-1)
GO 0.989 28 0.003 FeOx-GO-36 0.991 59 0.208 FeOx-GO-60 0.981 80 0.098
FeOx-GO-80 0.994 113 0.295 1.000 0.001 7.4 114 Iron oxide 0.981 65 0.097

51
Table S2. A summary of the Freundlich fitting of arsenic adsorption isotherms with FeOx-GOs,
GO, and the iron oxide control sample.
Samples Freundlich model
As (III) R2 n k (mg(1-n) Ln g-1)
GO 0.95957 1.757253062 0.22156 FeOx-GO-36 0.92455 2.505261048 5.02003 FeOx-GO-60 0.93902 2.506516944 7.58209 FeOx-GO-80 0.9454 3.118665211 15.9901
Fe3O4 0.9478 2.012234385 2.66561
Samples Freundlich model
As (V) R2 n k (mg(1-n) Ln g-1) GO 0.99606 1.576839383 0.38473
FeOx-GO-36 FeOx-GO-60 FeOx-GO-80 Fe3O4