this document is the annual review of - rubicon-nz.com · this document is the annual review of ......
TRANSCRIPT


This document is the Annual Review of
operations for Rubicon’s 2012 fiscal year
(i.e. for the 12 months ended 30 June 2012).
It addresses in summary the operational and
financial highlights for the period in each of
the Company’s major business activities –
ArborGen and Tenon.
Our Annual Review for 2011 and our Interim Review for
2012 (i.e. the six months ended 31 December 2011) are
each available on our website at www.rubicon-nz.com. In
addition to our shareholder Reviews, from time to time we
make announcements to the New Zealand Exchange. These
can be viewed either on the NZX website or on Rubicon’s own
website, where a complete history of our market releases is
maintained.
There are statements included in this Review that are “forward
looking statements.” As these forward-looking statements
are predictive in nature, they are subject to a number of risks
and uncertainties relating to Rubicon, including – the markets
and geographies in which ArborGen and Tenon operate and
compete, foreign exchange rate fluctuations, US housing
market conditions, US and global credit market conditions,
intellectual property protection, regulatory approvals, public
and customer acceptance of biotechnology products, the
success of ArborGen’s research and development activities,
weather conditions – and other factors (many of which are
beyond the control of Rubicon). Accordingly, actual results
and conditions may differ materially from those expressed or
implied by such statements.
Rubicon’s functional currency is the US dollar, and accordingly,
unless otherwise stated all references to dollars in this Review
are references to US dollars.

1Rubicon Annual Review 2012
The focus of ArborGen over the past 12 months has been
on the commercial operating business that is already in
place today, and on putting in place initiatives to grow
and expand its product portfolio and reach, in order to
accelerate revenue growth in future periods.
During the period under review, specifi c initiatives in relation to
this focus included –
Expanding People Capability
• The appointment of a new CEO. Andrew Baum has extensive
experience in scaling up operations in biotechnology and
clean-technology businesses. He began his career at Calgene,
an agricultural biotechnology fi rm, advancing to Senior
Vice President of Operations, where he was responsible for
ensuring the on-schedule launch of the world’s fi rst genetically
engineered cotton and vegetable oil products, before going
on to become President of the Oils Division. When Calgene
was subsequently acquired by Monsanto, Andrew became
Director of Business Development in Monsanto’s Sustainable
Development sector. He later joined Sembiosys Genetics as
CEO, which he then led from its evolution from a university-
based research initiative into a fully integrated publicly traded
biotechnology company.
Andrew has also served as a member of the Board of the
Biotechnology Industry Organization (BIO) and as Secretary
and Vice Chairman of Food and Agriculture at BIO.
• The appointment of a new VP of Marketing, Sales and
Product Development. John Pait brings to ArborGen an
impressive career in forest sector management. He has a
long history in the forestry sector, having previously worked
as Director of Forest Productivity at Georgia Pacifi c and Plum
Creek Timber, and more recently as Senior Vice President for
US Markets for CellFor (see CellFor acquisition discussion
below, under Accessing Growth). With his experience in
forestry management, product development, and sales and
marketing, John brings the critical skills needed to help drive
the adoption of ArborGen’s higher value MCP and varietal
products, particularly in the US market – i.e. those products
that can make a step-change difference to ArborGen’s
performance over the next 2-3 years.
John will be expanding his sales and marketing team to
ensure ArborGen has the complete set of resources necessary
to allow the full market potential of ArborGen’s products to
be realised.
• The appointment of a VP of Manufacturing. Warren Banner,
who for the past three and a half years has been responsible
for developing ArborGen’s varietal manufacturing capability,
has been promoted to this new role, assuming responsibility
for delivering ArborGen’s traditional nursery crop in the US
as well as the scale-up of all ArborGen’s new high value
softwood and hardwood products. Warren came to ArborGen
with 26 years of management experience in the horticulture
industry, having previously held positions as General Manager,
Production Manager, and Director of Operations. Warren
will work in close collaboration with John Pait to ensure
manufacturing capability matches customer demand for
ArborGen’s higher value products.
• The appointment of a new CFO. ArborGen is well-advanced
with a selection and appointment to this position. The CFO
appointment is the fi nal role required in order to establish the
new ArborGen executive team, and the expectation is that
this outstanding position will be announced early in the next
quarter.
ArborGen

2 Rubicon Annual Review 2012
ArborGen

3Rubicon Annual Review 2012
ArborGen
Expanding Physical Resources – Growing Manufacturing Capacity
ArborGen’s new manufacturing scale-up facilities (pictured left),
which were only completed in February this year, have been
purpose built to meet ArborGen’s expanding operational needs.
The complex, which is situated on 13.5 acres in South Carolina
(US), comprises over 55,000 square feet of science laboratories,
varietal and biotech manufacturing facilities, and certain specialist
greenhouse and container grow-out operations. This site will be
the core base for the manufacture of ArborGen’s highest value
(non-biotech) pine products – i.e. loblolly pine varietal seedlings
– as well as for the development of its future generation biotech
products.
Expanding Capital Resources – Funding the Base Business
As previously disclosed, the three existing Partners have agreed to
fund ArborGen through to the completion of the 2012/13 fi scal
year (i.e. the year ending 31 March 2013), at the rate of $6 million
per partner.
In addition, ArborGen’s core US bank has agreed to extend
its existing fi nancing facility out to 31 August 2013. This
renegotiated facility (documentation was still being agreed at the
time of writing this Review) will likely comprise a core loan plus a
working capital line, and may expand the total bank commitment
to $27 million. The structure of the new loan (when fi nalised) will
be a refl ection of the increasing commercialisation of ArborGen’s
operating business, and the resultant need for further working
capital funding as the company continues to expand and grow its
sales of higher-value products.
ArborGen’s three-year Australasian bank facility expires later in
the year, and the company has begun positive discussions with
its existing New Zealand domestic bank to renew and extend
the loan.
Reallocating Resources
Last month ArborGen undertook a company-wide restructuring
process to refocus and align the organisation’s resources - physical,
people and fi nancial – with the company’s existing commercial
base business. It is this base business, and the opportunities
that its existing market channels and pipeline of fully developed
(non-biotech) products currently offer, which has the potential to
generate a step-change in ArborGen’s near-term fi nancial results.
Whilst this restructuring has meant that some of the longer-term
biotech ‘discovery’ projects have had to be scaled back in size
and timing, for the most part it simply means that this work has
to be done in another, smarter way. For example, ArborGen is
now investing additional resource into marker-assisted breeding
technology, which has the potential to ‘short-cut’ the considerable
time and expense usually associated with varietal selection for
future traditional and biotech products. Another example of this
resource re-allocation, is the increased people resource that will
now be applied to sales and marketing activities, in order to turn
ArborGen’s extensive forestry biometric product performance
data into sales information, and, from that information, into
realised higher value seedling sales.
In general, the restructuring will see greater resources being
applied to the base business, and resources allocated to future
biotech potential will be targeted on research and development
for the creation of the truly ‘blockbuster’ category of products –
i.e. traits that are highly demanded by customers but which are
unattainable under traditional breeding technologies. Overall, this
restructuring will see a reduction in pure science spend, and an
increased spend in operational and commercial activities.
Accessing Growth
In our Interim Review we showed the schematic on the next page.
ArborGen can expand into each of these stars off the back of
its existing base business. The extracts that follow speak to the
potential offered by just a few of these opportunities.

4 Rubicon Annual Review 2012
ArborGen
ArborGen ExistingBase Business Potential
ArborGen ‘Tomorrow’
ArborGen Existing Base
Business Today
Exi ng market recovery and market share
growth
UShardwoodstradi onal
markets
USExi ng
products bioenergy
market
Brazil nonbiotech
tradi onal
ANZ & USbiotech,
tradi onal & bioenergy markets
Brazil biotech, tradi onal &
charcoal markets
Geographic & product step-outs
Improved gene cs in
= Valued in share price today
= Potential value upside beyond current share price
productstradi onal
5Rubicon Annual Review 2012
ArborGen
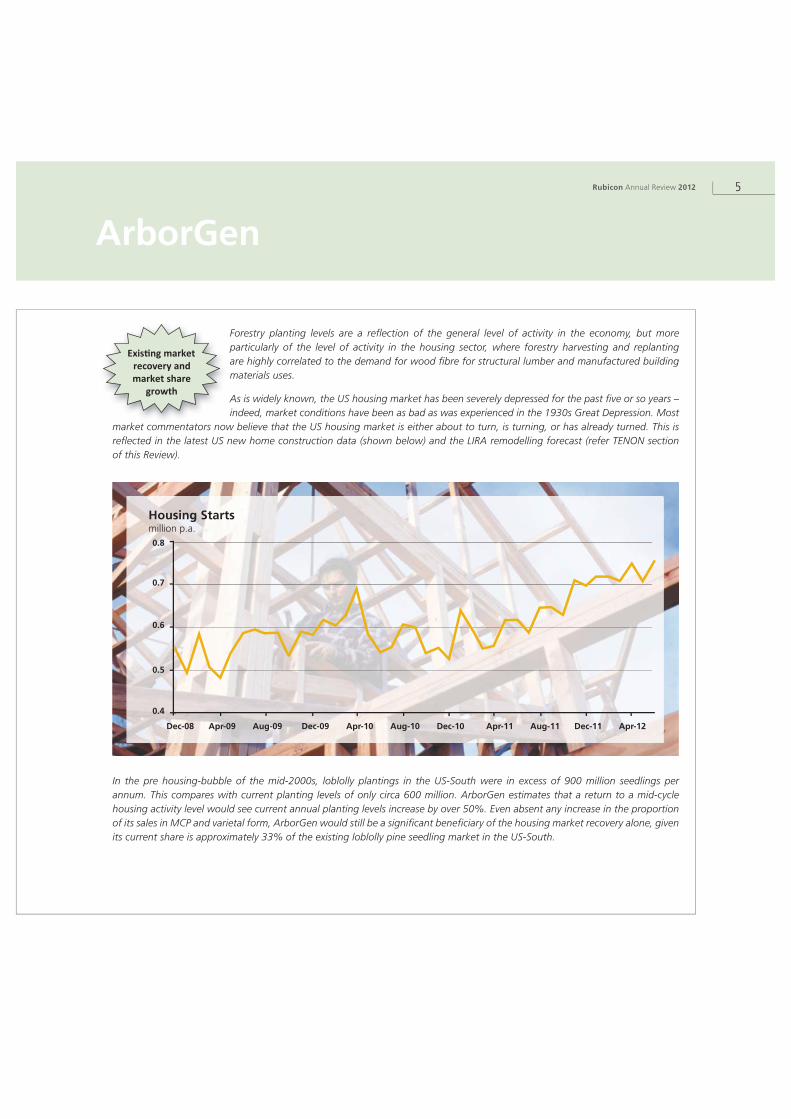
In the pre housing-bubble of the mid-2000s, loblolly plantings in the US-South were in excess of 900 million seedlings per
annum. This compares with current planting levels of only circa 600 million. ArborGen estimates that a return to a mid-cycle
housing activity level would see current annual planting levels increase by over 50%. Even absent any increase in the proportion
of its sales in MCP and varietal form, ArborGen would still be a signifi cant benefi ciary of the housing market recovery alone, given
its current share is approximately 33% of the existing loblolly pine seedling market in the US-South.
Exi ng market recovery and market share
growth
Housing Startsmillion p.a.
Dec-08 Apr-09 Aug-09 Dec-09 Apr-10 Aug-10 Dec-10 Apr-11 Aug-11 Dec-11 Apr-12
0.8
0.7
0.6
0.5
0.4
Forestry planting levels are a refl ection of the general level of activity in the economy, but more
particularly of the level of activity in the housing sector, where forestry harvesting and replanting
are highly correlated to the demand for wood fi bre for structural lumber and manufactured building
materials uses.
As is widely known, the US housing market has been severely depressed for the past fi ve or so years –
indeed, market conditions have been as bad as was experienced in the 1930s Great Depression. Most
market commentators now believe that the US housing market is either about to turn, is turning, or has already turned. This is
refl ected in the latest US new home construction data (shown below) and the LIRA remodelling forecast (refer TENON section
of this Review).
6 Rubicon Annual Review 2012
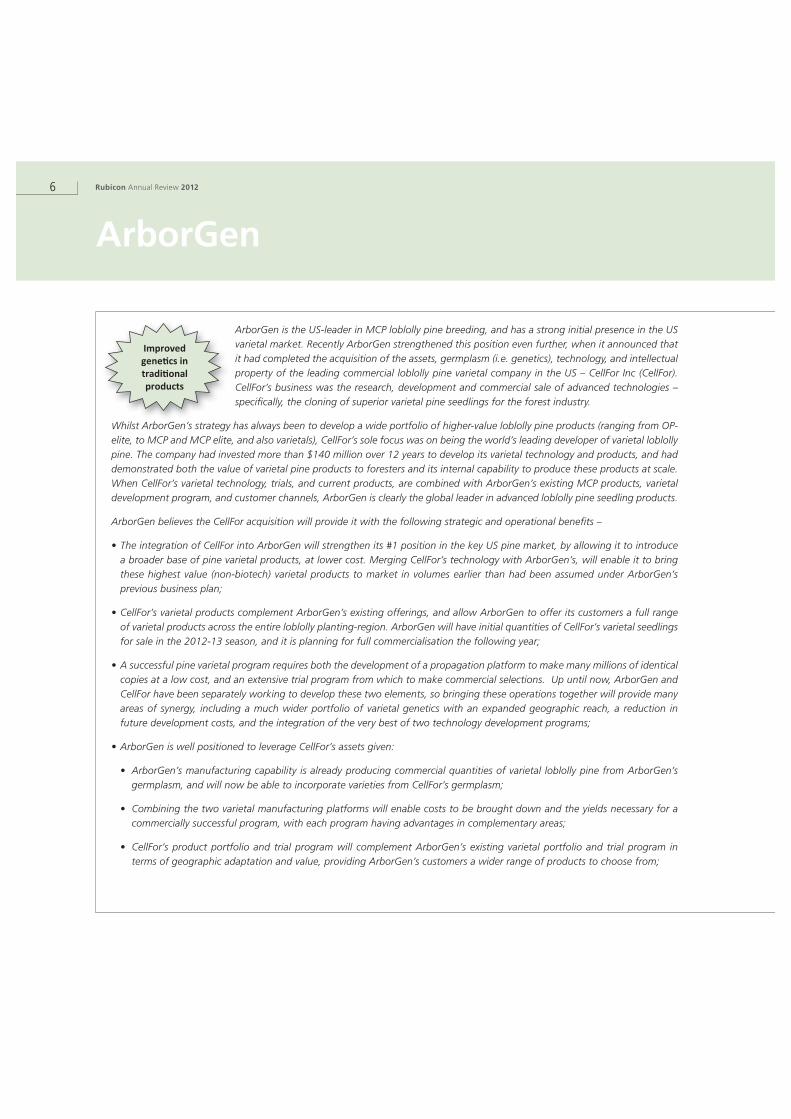
ArborGen is the US-leader in MCP loblolly pine breeding, and has a strong initial presence in the US
varietal market. Recently ArborGen strengthened this position even further, when it announced that
it had completed the acquisition of the assets, germplasm (i.e. genetics), technology, and intellectual
property of the leading commercial loblolly pine varietal company in the US – CellFor Inc (CellFor).
CellFor’s business was the research, development and commercial sale of advanced technologies –
specifi cally, the cloning of superior varietal pine seedlings for the forest industry.
Whilst ArborGen’s strategy has always been to develop a wide portfolio of higher-value loblolly pine products (ranging from OP-
elite, to MCP and MCP elite, and also varietals), CellFor’s sole focus was on being the world’s leading developer of varietal loblolly
pine. The company had invested more than $140 million over 12 years to develop its varietal technology and products, and had
demonstrated both the value of varietal pine products to foresters and its internal capability to produce these products at scale.
When CellFor’s varietal technology, trials, and current products, are combined with ArborGen’s existing MCP products, varietal
development program, and customer channels, ArborGen is clearly the global leader in advanced loblolly pine seedling products.
ArborGen believes the CellFor acquisition will provide it with the following strategic and operational benefi ts –
• The integration of CellFor into ArborGen will strengthen its #1 position in the key US pine market, by allowing it to introduce
a broader base of pine varietal products, at lower cost. Merging CellFor’s technology with ArborGen’s, will enable it to bring
these highest value (non-biotech) varietal products to market in volumes earlier than had been assumed under ArborGen’s
previous business plan;
• CellFor’s varietal products complement ArborGen’s existing offerings, and allow ArborGen to offer its customers a full range
of varietal products across the entire loblolly planting-region. ArborGen will have initial quantities of CellFor’s varietal seedlings
for sale in the 2012-13 season, and it is planning for full commercialisation the following year;
• A successful pine varietal program requires both the development of a propagation platform to make many millions of identical
copies at a low cost, and an extensive trial program from which to make commercial selections. Up until now, ArborGen and
CellFor have been separately working to develop these two elements, so bringing these operations together will provide many
areas of synergy, including a much wider portfolio of varietal genetics with an expanded geographic reach, a reduction in
future development costs, and the integration of the very best of two technology development programs;
• ArborGen is well positioned to leverage CellFor’s assets given:
• ArborGen’s manufacturing capability is already producing commercial quantities of varietal loblolly pine from ArborGen’s
germplasm, and will now be able to incorporate varieties from CellFor’s germplasm;
• Combining the two varietal manufacturing platforms will enable costs to be brought down and the yields necessary for a
commercially successful program, with each program having advantages in complementary areas;
• CellFor’s product portfolio and trial program will complement ArborGen’s existing varietal portfolio and trial program in
terms of geographic adaptation and value, providing ArborGen’s customers a wider range of products to choose from;
ArborGen
Whil A b G ’
Improved gene cs in tradi onal products
7Rubicon Annual Review 2012
ArborGen
• ArborGen already has in place sales and marketing channels that address the entire US-South loblolly pine market today;
and
• With John Pait as ArborGen’s new Vice President of Marketing, Sales and Product Development, ArborGen has someone
who until recently held a similar role at CellFor, who understands CellFor’s varieties and technology, and who will be able to
help speed the integration of CellFor’s germplasm and production technology into ArborGen’s existing programs.
The consideration paid by ArborGen for CellFor was CDN $1.1 million in cash plus a warrant over ArborGen’s shares. These
warrants are exercisable at the time of a liquidation event (including a sale transaction or IPO), and when exercised, will reduce
Rubicon’s (and International Paper’s and MeadWestvaco’s) interest in ArborGen from 33.33% to 31.67%. ArborGen believes that
the future revenue and earnings streams that will accrue to the company from the CellFor acquisition will more than offset the
dilution to the existing Partners from the issuance of the warrants.
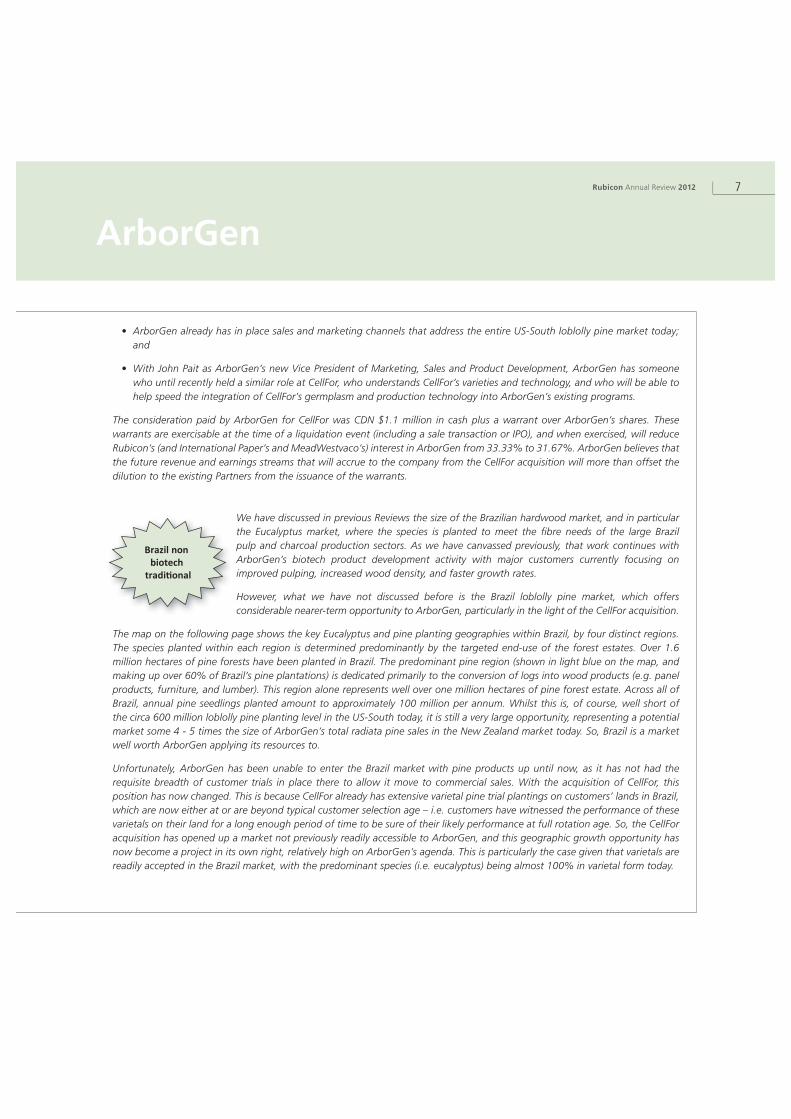
We have discussed in previous Reviews the size of the Brazilian hardwood market, and in particular
the Eucalyptus market, where the species is planted to meet the fi bre needs of the large Brazil
pulp and charcoal production sectors. As we have canvassed previously, that work continues with
ArborGen’s biotech product development activity with major customers currently focusing on
improved pulping, increased wood density, and faster growth rates.
However, what we have not discussed before is the Brazil loblolly pine market, which offers
considerable nearer-term opportunity to ArborGen, particularly in the light of the CellFor acquisition.
The map on the following page shows the key Eucalyptus and pine planting geographies within Brazil, by four distinct regions.
The species planted within each region is determined predominantly by the targeted end-use of the forest estates. Over 1.6
million hectares of pine forests have been planted in Brazil. The predominant pine region (shown in light blue on the map, and
making up over 60% of Brazil’s pine plantations) is dedicated primarily to the conversion of logs into wood products (e.g. panel
products, furniture, and lumber). This region alone represents well over one million hectares of pine forest estate. Across all of
Brazil, annual pine seedlings planted amount to approximately 100 million per annum. Whilst this is, of course, well short of
the circa 600 million loblolly pine planting level in the US-South today, it is still a very large opportunity, representing a potential
market some 4 - 5 times the size of ArborGen’s total radiata pine sales in the New Zealand market today. So, Brazil is a market
well worth ArborGen applying its resources to.
Unfortunately, ArborGen has been unable to enter the Brazil market with pine products up until now, as it has not had the
requisite breadth of customer trials in place there to allow it move to commercial sales. With the acquisition of CellFor, this
position has now changed. This is because CellFor already has extensive varietal pine trial plantings on customers’ lands in Brazil,
which are now either at or are beyond typical customer selection age – i.e. customers have witnessed the performance of these
varietals on their land for a long enough period of time to be sure of their likely performance at full rotation age. So, the CellFor
acquisition has opened up a market not previously readily accessible to ArborGen, and this geographic growth opportunity has
now become a project in its own right, relatively high on ArborGen’s agenda. This is particularly the case given that varietals are
readily accepted in the Brazil market, with the predominant species (i.e. eucalyptus) being almost 100% in varietal form today.
Brazil nonbiotech
tradi onal

8 Rubicon Annual Review 2012
ArborGen
A second potential geographic step-out for ArborGen, is the China market - one that represents a
very large market opportunity, although not yet as advanced (by ArborGen) as the Brazil market. In
China there are favourable industry dynamics, with a national policy that focuses on the conservation
of protected natural forests and the encouragement of the establishment of commercial plantations,
in order to lift forest productivity and to meet increasing domestic demand for wood fi bre. The 12th
Five Year Plan (announced in 2011) targets an increase the country’s forest stock by 600 million cubic
metres and its area of forest cover by 12.5 million hectares by 2015 - in line with China’s 2020 goal to
increase forest coverage by 40 million hectares (which would (on average) equate to approximately 3
billion seedlings planted per annum). The driver for this policy is the fact that China continues to face challenges in meeting its
demand for wood fi bre and forest products – it is now the world’s largest single importer of logs, wood pulp, and recovered
paper (for recycle applications).
70% Pine plantation with output used for building and furniture applications
90% Eucalyptus with output used in the well established pulp and pig iron industries
An emerging region experiencing new pulp, pig iron and diversified wood products investment
An emerging region expected to increasingly support new pulp & paper, pig iron and biomass investments
Brazil Commercial Forest Plantation Regions
Geographic & product step-outs

9Rubicon Annual Review 2012
ArborGen
Because of this, China has established a number of policy initiatives aimed at expanding the country’s area of forest cover.
Financing programs are now in place to promote and subsidise the establishment of fast-growing and high-yielding timber
plantations in selected regions, through the use of extended debt repayment periods, discounted state bank loans, and favourable
interest rates.
Looking at the map below, the opportunity for ArborGen is in the South, where both pine and eucalyptus are grown. ArborGen
already has loblolly pine trials established (through its partners, International Paper and MeadWestvaco) which have shown
outstanding results compared to the local genetics. For Eucalyptus, the geography and climatic zones essentially replicate the US
South, so ArborGen’s cold tolerant eucalyptus program has the potential to be applied in China also.
Future Eucalypt, Poplar, Chinese Fir, Pine
Current Eucalypt, Poplar, Chinese Fir, Pine
Poplar, Chinese Fir, Pine
Pine, Spruce, Fir
Poplar
Poplar, Chinese Fir
Main Species Deployed in China’s Commercial Forest Plantations

10 Rubicon Annual Review 2012
Tenon
There are many data points now emerging that indicate
that after fi ve years of year-on-year decline, the US housing
cycle is at last showing signs of turning for the positive.
However, that was unfortunately not the case for the majority of
fi scal 2012 reported upon in this Review. Indeed, Tenon believes
that the fi nancial year just completed will prove to have been the
‘dead bottom’ of the cycle from a macro-conditions and earnings
perspective.
Despite the conditions, Tenon’s revenues, at $334 million, were $8
million (or 2.5%) higher than the previous year. Pleasingly, in the
second half of the fi scal year it recorded revenue of $172 million,
which was $10 million up on the $162 million reported in the
fi rst half, and $8 million up on the corresponding period last year.
This revenue performance is refl ective of a considerable amount
of hard work on the promotion of existing programs as well as on
new product introductions. To this point, the chart below shows
the increasing percentage of Tenon’s distribution revenues that
now comes from products introduced over the past six years.
Whilst Tenon’s revenue performance was good, weak macro-
conditions combined with a strong NZD:USD exchange rate,
conspired to squeeze Tenon’s overall gross operating margins.
Although the second half gross profi t was up 5% on the fi rst
half, the gross profi t for fi scal 2012 was down $5 million on that
recorded in fi scal 2011.
Tenon responded to these tough operating conditions by pushing
harder on effi ciency and cost-out initiatives. Examples of these
restructuring and business re-engineering initiatives in the period
included –
• The closure of Tenon’s Canadian manufacturing site and the
integration of that activity into the existing North Carolina
operation. This restructuring will not only lower Tenon’s
overall North American manufacturing cost base through the
manufacturing and labour effi ciencies gained, but it will also
release cash upon the sale of the now surplus Canadian land
and buildings which can then be applied to debt reduction;
• A $5 million profi t improvement program put in place at the
large clearwood manufacturing operation at Taupo, targeted
at ensuring the site’s profi tability at current demand levels and
sustained high NZD:USD exchange rate;
New Products
As a % of total distribution revenue
2007 2008 2009 2010 2011 2012
25
20
15
10
5
0
%

11Rubicon Annual Review 2012
Tenon
• A reorganisation of the US wholesale operation and vendor
distributor arrangements in the decorative category;
• An operational effi ciency program established at Empire, to
reduce operating costs while maintaining Tenon’s excellence
standard in customer service; and
• The reduction in administrative costs through the closure of
Tenon’s Annapolis offi ce.
While some of these initiatives were completed during the year,
and made an initial contribution to the second half’s result,
some (such as the Canadian reorganisation) are on-going, which
means that their full impact will not be felt until the second half
of fi scal 2013.
Each of these initiatives involved some up-front costs, which
have been provided for in the 2012 fi scal year results. In total,
$5 million of costs relating to these initiatives was recorded
in the period under review ($3 million of which is reported in
the Restructuring line on the face of the Consolidated Income
Statement, with the balance being in the administrative expense
and gross earnings lines). While the cash component of these
costs had an immediate negative impact on Tenon’s debt level
(with net debt rising from $36 million at December to $39 million
at year end), these were changes that had to be made in order
to enhance the future earnings power of the business. Tenon is
confi dent that the expenditure on these initiatives will generate
benefi ts in future periods well in excess of their cost. Indeed,
Tenon will need to extract the lion’s share of these benefi ts in
fi scal 2013 in order to drive its debt balance back down to the
targeted mid-$30 million level by June 2013.
Reported Operating earnings before fi nancing expense was a
loss of $8 million, or a loss of $3 million before the $5 million
of costs noted above. However, the earnings fi gure that equity
analysts tend to focus on for company comparative purposes is
EBITDA (i.e. Operating earnings before fi nancing expense, tax,
depreciation, and amortisations), because that number removes
distortions caused by differences in asset age and depreciation
policies, and by different debt:equity funding structures. To assist
the reader with that same analysis, this next chart shows Tenon’s
EBITDA reconciliation from last year’s result to this year’s result
(adjusted for the $5 million of costs noted above).
EBITDAReconciliation
US$m
June 2011 M&B lumber North American Operating cost FX June 2012 pricing market conditions savings
8
7
6
5
4
3
2
1
0
Excludes $2 million Fair Value gain on Forest Assets
Excludes $5 million restructuring and businessre-engineering costs noted above

12 Rubicon Annual Review 2012
6
4
2
0
-2
-4
-6
-8
-10
-12
Home Centre Retailers Average Same Store Sales
% change from previous comparable period
New and Existing Housing
NZD/USD Exchange Rate
NZD/USD exchange rates shown are effective (i.e. hedged)
Moulding and Better Lumber Pricing
US$ mbf
Q4 Q1
2010
Q2 Q3 Q4 Q2 Q3 Q4 Q1
2012
Q2
0.5
0.0
1.0
1.5
2.0
2.5
2
0
4
6
8
10
12
14million p.a. months supply
Jun-00 Jun-01 Jun-02 Jun-03 Jun-04 Jun-05 Jun-06 Jun-07 Jun-08 Jun-09 Jun-10 Jun-11
Jun-00 Jun-01 Jun-02 Jun-03 Jun-04 Jun-05 Jun-06 Jun-07 Jun-08 Jun-09 Jun-10 Jun-11
0.45
0.35
0.55
0.65
0.75
0.85
1st h
alf 2
011
aver
age
0.71
24
2nd
half
2011
aver
age
0.74
48
1st h
alf 2
012
aver
age
0.81
09
2nd
half
2012
aver
age
0.79
29
Jun-00 Jun-01 Jun-02 Jun-03 Jun-04 Jun-05 Jun-06 Jun-07 Jun-08 Jun-09 Jun-10 Jun-11
$800
$600
$1,000
$1,200
$1,400
$1,600
Jun-12
Jun-12
0.95
Jun-12
1st h
alf 2
011
aver
age
$1,0
71
2nd
half
2011
aver
age
$1,1
84
1st h
alf 2
012
aver
age
$1,2
24
2nd
half
2012
aver
age
$1,2
14
Q1
2011
QQ1
2007
Q2 Q3 Q1
2008
Q4 Q2 Q4Q3 Q1
2009
Q2 Q3
Housing Starts (million pa) Existing home inventory (months)
Tenon

13Rubicon Annual Review 2012
The short summary is that, had the NZD:USD cross rate not
strengthened from an average (hedged) rate of 73 cents in fi scal
2011 to over 80 cents this last year, then Tenon’s fi scal 2012
EBITDA (as shown above) would have equalled that of the previous
year, despite the tougher market demand conditions experienced
this past year. Attempting to hedge currency movements in the
year proved extremely diffi cult, as the NZD:USD rate fl uctuated
widely across the period between a low of 74 cents and a high
of 88 cents. Currency aside, it is also important to note that the
gains from all of Tenon’s cost-out and profi t improvement plans
that were operative in the period almost offset the signifi cant
decline in demand conditions sustained in fi scal 2012. So, if the
consensus view is correct and the cycle has indeed bottomed (and
assuming the NZ dollar does not strengthen from today), then
this means Tenon will have traversed the longest and deepest
housing recession since the 1930s depression without having
recorded an EBITDA loss (adjusting for the restructuring and
business re-engineering costs discussed above) in any reporting
period – something few industry participants have been able to
achieve.
Although relative performance may have been good, we are very
conscious that Tenon’s absolute performance in recent times –
particularly this past year - has been quite underwhelming. We
do believe that everything that could realistically have been done
in order to address operating performance in Tenon’s North
American activities has been done. Extensive changes to Tenon’s
operating model have been made in recent times, including –
• Organic Growth – Tenon has expanded its presence in the
retail, professional, and wholesale channels. It now services
some 40% more retail stores than it did approaching the last
cycle peak. It now has six distribution centres in the US, a
global logistics operation that sources over 8,000 containers
of product globally each year, and its products now appear in
some 2,000 stores.
• Changed Customer Focus – Tenon has fundamentally
restructured the way its core customers are serviced. Each
customer now has a single interface with the company,
regardless of where in the world, or from which Tenon
manufacturing entity their products are produced or sourced.
This customer-focus change has resulted in a higher level of
service delivery and product innovation, and tighter customer
relationships. This in turn has resulted in new opportunities
with key customers, ranging from organically growing Tenon’s
existing business, to new product introductions, to entering
new market segments.
The launch in the period, of the new Perennial Wood™
outdoor decking range, is a good example of these latter
two categories – i.e. a totally new product, in a new market
segment. Perennial Wood™ has been developed by the
Eastman Chemical Company, a global chemical manufacturing
company with annual sales revenue of more than $6 billion.
Eastman has partnered with Empire (Tenon’s core distribution
business in the US) in the initial roll-out of this new product
into Lowe’s stores in the US market. The initial launch into
the retail market comprises a 100 Lowe’s store trial in New
England, and sees Empire as the exclusive Perennial Wood™
decking distributor into this channel.
The potential outdoor applications for Perennial Wood™ in
the US market are extensive. The fi rst product being launched,
Perennial Wood™ decking, will be sold into the $4 billion
per annum US decking and railing market – a market larger
than Tenon’s entire traditional indoor mouldings segment,
and this is only one market where Eastman’s modifi ed wood
technology is applicable. There are many further applications
for Eastman’s technology in other outdoor applications, and
Tenon believes they will be equally well received upon their
future introduction.
• Profit improvement / Efficiency Programs – The
restructuring and business re-engineering programs instituted
in fi scal 2012 (discussed above) represent only a few of the
total series of initiatives of this type that have been put in
place to address the performance of the base US operating
business. These initiatives, which began with the $5 million
‘One-Company’ program several years ago, have in total now
either removed cost, or increased operational effi ciencies, to
the extent of $20 million per annum.
As a result of all these changes, Tenon’s US business is far better
positioned today, both operationally and strategically, than it was
when the company entered the cycle downturn fi ve or so years ago.
Tenon

14 Rubicon Annual Review 2012
Tenon
To bring some perspective to that statement, Tenon believes it
now holds the #1 position in interior mouldings (as sold through
its full service distribution business), the #1 position in stair parts
distribution in the large Texas pro-dealer market, the #2 position
in imported clear and fi nger jointed mouldings (as sold through
its US wholesale operation), and a leading position in decorative
mouldings sold to the large format home improvement retailers.
In short, Tenon now holds industry-leading positions in each of the
businesses in which it operates in North America, and a platform
for growth is in place to take advantage of the increased demand
that will occur as market recovery brings a return to mid-cycle
conditions. The only change to Tenon’s North American growth
model moving forward is one of relative focus. Given the current
point in the housing cycle, Tenon is keen to more aggressively
consider acquisition opportunities, particularly in the professional
builder market where it can leverage its existing positions to create
additional value. In order to do this, Tenon will need to lower its
current debt levels and / or access new equity funding, or just be
fi nancially ‘smart’ in the way it makes its acquisitions. Whilst the
timing of these opportunities is not controllable – i.e. they arise
when they arise – Tenon will be seeking them out in fi scal 2013.
Growth
Equally as important to this continued growth within North America,
is the desire to also balance this current single-market exposure by
establishing new revenue streams outside of North America, where
Tenon can take its existing capabilities and establish new in-market
positions that will allow it to replicate its North American success
elsewhere. Tenon has been clear that this focus will be on two
markets – Australia and China.
In that regard, Tenon announced in February this year that it had
established an initial beachhead in Australia, by acquiring the #2
hardwood mouldings manufacturing and distribution position there
(previously held by Whiteline Timber Products). Through established
links to quality reseller chains (e.g. Mitre10) and independent stores,
Tenon Australia will be offering a variety of mouldings, high-grade
boards, and architraves into the Australian market, and it will
become a comprehensive supplier of these products in multiple
profi les and species.
Tenon would not have taken this initial Australia beach-head
unless it was believed that a position of economic scale could be
established, that would justify its presence there. We will comment
on Tenon’s progress towards this wider Australian growth goal in
subsequent Reviews to shareholders.
China is, of course, quite a different proposition from either North
America or Australia. To profi tably enter China and make money
under a sustainable business model, Tenon must ultimately have an
in-market presence there. This in turn must involve the participation
of joint venture Chinese partners, which was the successful model
adopted when Tenon moved in-market into North America, either
taking initial JV (e.g. American Wood Mouldings) or minority (e.g.
The Empire Company) positions.
It is no secret that partner selection is critical, and that China is
littered with “how not to do it” examples of Western companies
poorly executing their entry strategies. We believe Tenon has the
right approach – i.e. establish a sales history of delivering high
quality product into China that builds company credibility, use that
to develop an understanding of the wholesale and retail market
channels there, and then build an in-market presence through local
partnering to create a position of real scale.
The fi rst of these steps has already been achieved, with
manufactured product out of Tenon’s Taupo site being sold into
China now representing 15% of all its third party sales from New
Zealand. We know that the China market is large and growing,
that there is an increasing wood fi bre defi cit, and that there is a
willingness of the Chinese consumer to pay for valuable product. By
way of example, Tenon is now achieving in China the same price as
it is receiving in the US market, for the highest grade of clear lumber
it sells (i.e. mouldings and better lumber) – a product that increased
in price, year-on-year, by $90 per thousand board feet – i.e. over 8%
in the past year. There is every reason to believe that this demand
for ‘clear’ products will continue as China grows (and as the US
market recovers).
As to the second phase – i.e. developing an understanding of the
customer channels in China, we believe the next step for Tenon
should be to take a position in the wholesale market there.
Understanding the wholesale market is the next natural move, as
it ‘follows’ Tenon’s current product fl ows one-step closer to the
Chinese end-consumer. Supplying product into China through an
‘owned’ wholesale channel would, of course, be the other side
of the ‘China coin’ for Tenon, as it currently sources an extensive

15Rubicon Annual Review 2012
Tenon
amount of decorative and specialist millwork product from China
and sells it through its US distribution entities into the North
American retail and pro-builder markets. So it already has a good
feeling for this type of activity. We do not believe the spend on
establishing a wholesale market presence need be large, and Tenon
is already well advanced in exploring opportunities in this regard.
We will report on this later in the fi scal year.
The fi nal step – establishing an in-market presence in China of scale
– is the critical phase. While Tenon has also made progress on this,
this work is still far from complete, and it will not be making the
mistake of rushing this fi nal phase, which is of course the defi ning
step. Any such move would be transformative in nature, rather than
incremental, and would likely require Tenon shareholder approval in
order to proceed. You will read more on this in upcoming Reviews.
16 Rubicon Annual Review 2012
Rubicon
As Rubicon’s functional currency is the US dollar, our fi nancial statements
generally refer to US dollars unless otherwise stated. All numbers are
rounded to the nearest million. Rubicon has majority ownership (59%) of
Tenon, and NZ International Financial Reporting Standards (IFRS) require
Tenon’s Income, Cash Flows and Balance Sheet fi nancial statements to be
consolidated into Rubicon’s statements. This is the basis upon which our
fi nancial statements are presented in this Review.
The next table provides a ‘snap-shot’ of our consolidated
operating earnings performance for the period under review –
i.e. it reports on the Group’s operating earnings before fi nancing
expense, depreciation and amortisations (i.e. EBITDA) for the
twelve months to 30 June 2012, compared with the prior period
(i.e. the 12 months to 30 June 2011). As discussed in the TENON
section of this Review, we focus on EBITDA in this analysis, as that
is the measurement most analysts use to compare companies,
because EBITDA is a measurement that allows comparability
across companies with different aged assets and depreciation
policies, and different funding structures (i.e. different debt :
equity mixes).
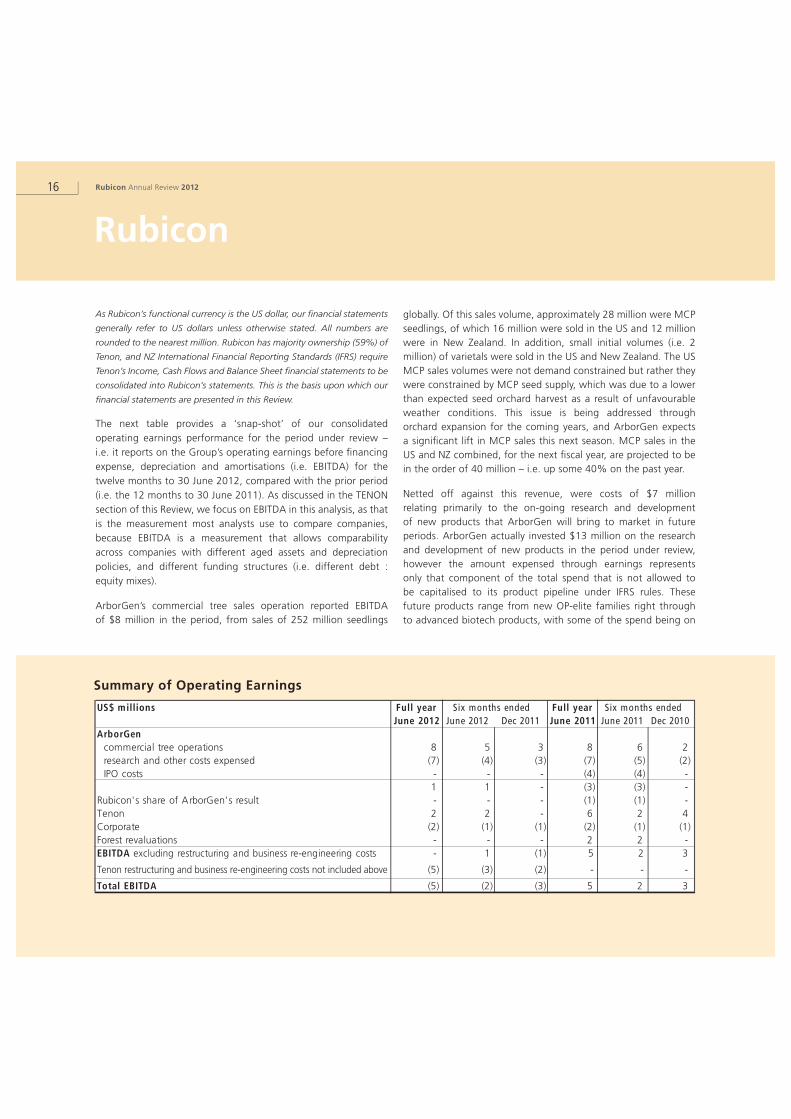
ArborGen’s commercial tree sales operation reported EBITDA
of $8 million in the period, from sales of 252 million seedlings
globally. Of this sales volume, approximately 28 million were MCP
seedlings, of which 16 million were sold in the US and 12 million
were in New Zealand. In addition, small initial volumes (i.e. 2
million) of varietals were sold in the US and New Zealand. The US
MCP sales volumes were not demand constrained but rather they
were constrained by MCP seed supply, which was due to a lower
than expected seed orchard harvest as a result of unfavourable
weather conditions. This issue is being addressed through
orchard expansion for the coming years, and ArborGen expects
a signifi cant lift in MCP sales this next season. MCP sales in the
US and NZ combined, for the next fi scal year, are projected to be
in the order of 40 million – i.e. up some 40% on the past year.
Netted off against this revenue, were costs of $7 million
relating primarily to the on-going research and development
of new products that ArborGen will bring to market in future
periods. ArborGen actually invested $13 million on the research
and development of new products in the period under review,
however the amount expensed through earnings represents
only that component of the total spend that is not allowed to
be capitalised to its product pipeline under IFRS rules. These
future products range from new OP-elite families right through
to advanced biotech products, with some of the spend being on
Summary of Operating Earnings
US$ millions Full year Six months ended Full year Six months endedJune 2012 June 2012 Dec 2011 June 2011 June 2011 Dec 2010
ArborGencommercial tree operations 8 5 3 8 6 2
research and other costs expensed (7) (4) (3) (7) (5) (2)
IPO costs - - - (4) (4) -
1 1 - (3) (3) -
Rubicon's share of ArborGen's result - - - (1) (1) -
Tenon 2 2 - 6 2 4
Corporate (2) (1) (1) (2) (1) (1)
Forest revaluations - - - 2 2 -
EBITDA excluding restructuring and business re-engineering costs - 1 (1) 5 2 3
Tenon restructuring and business re-engineering costs not included above (5) (3) (2) - - -
Total EBITDA (5) (2) (3) 5 2 3

17Rubicon Annual Review 2012
Rubicon
traditional products that will be released within the next couple
of planting seasons. It is important to understand that ArborGen’s
commercial operations are cash and EBITDA positive today,
excluding this expenditure currently being made to develop these
next generations of products.
Rubicon’s consolidated EBITDA fell to a loss of $5 million (or
breakeven excluding the $5 million of restructuring and business
re-engineering costs incurred at Tenon), and this movement was
solely attributable to the drop in earnings of Tenon that was
recorded in the period. As noted in the TENON section of this
Review, cost savings implemented were almost able to offset the
decline in general US market conditions that was experienced in
the year, which meant that the year-on-year reduction in Tenon’s
EBITDA (excluding the $5 million of costs noted above) was
largely due to the NZD:USD exchange rate strengthening from a
(hedged) average of 73 cents in fi scal 2011 to an average of over
80 cents for the year under review – i.e. a $4 million negative
EBITDA impact from currency alone.
As discussed above, Tenon believes that its last 12 months
result refl ects the very bottom of its earnings cycle based on a
consensus view that the US housing market is set to improve
from this point on.
As we have said before, this result (which after fi nancing
expense, taxation and $5 million of restructuring and business
re-engineering costs at Tenon noted above, fell to a bottom line
loss of $12 million), is not at all indicative of the underlying value
of our Tenon and ArborGen investments. In ArborGen’s case, this
is because it is still a developing business with the bulk of its value
represented by its future higher genetic value products, which
are yet to be commercialised in the market. In Tenon’s case, it is
because of the extremely depressed US housing market that has
been operating at a level not seen since the 1930’s depression
era. We remain confi dent that as ArborGen matures and Tenon
activities are supported by a recovering US housing market, our
future earnings results will grow to refl ect the true value of both
of these businesses.
At balance date, Rubicon’s consolidated debt was $59 million,
made up of $39 million in Tenon and $20 million in Rubicon itself.
Rubicon’s facility with the ANZ was fully drawn at balance date,
however immediately post balance date Rubicon completed a
US$15 million capital raise (see GOVERNANCE section below) that
reduced the facility balance to US$5 million. Upon completion of
the capital raise, the ANZ agreed to extend the life of its bank
facility out to 1 July 2014, subject to satisfactory progress being
made towards an IPO of ArborGen.
As Rubicon owns only 31.67% of ArborGen, ArborGen is treated
as an associate and its debt is not consolidated into Rubicon’s
balance sheet. ArborGen’s debt is non-recourse to Rubicon
Limited, and this is also the case for Tenon’s debt. For the terms
of these three debt facilities, shareholders’ attention is drawn to
the full description outlined in notes 5.1 (c), 5.2 (d), 5.3, and 19
to our full audited fi nancial statements for fi scal 2012 (as shown
in the Rubicon 2012 Statutory Report).
GOVERNANCE
Our ASM was held in Auckland (NZ) on 16th December 2011.
Two new Directors were elected at the meeting – David Knott
(who represents Knott Partners, who together with associated
parties controls 28% of Rubicon’s issued share capital, and who
has been a very strong supporter of Rubicon for many years now)
and George Karaplis (an independent Director, with a strong
background in value creation in technology companies). We are
very pleased and fortunate to have both David’s and George’s
contribution moving forward as we look to unlock value in our
ArborGen and Tenon investments. Over 80% of the Company’s
issued shares were voted at the ASM, and all resolutions were
passed with more than a 99% majority.
Our next ASM will be held in Wellington (NZ) in December 2012.
We will notify shareholders of the time and venue later in the
year, and we look forward to meeting those shareholders who
are able to attend.
On 5 July 2012 (i.e. after balance date) we concluded a capital
raise by way of a 1:3 rights offering, raising the full NZ$21 million
(US$15 million net of fees) we sought. All of Rubicon’s Directors
and offi cers took up their rights in full, and the fact that not one
share of the offer needed to be allocated to outside investors, was
an indication of the extremely strong support the offer received
from the Company’s existing shareholder base - support for which
18 Rubicon Annual Review 2012
Rubicon
we are very grateful. The cash proceeds of the offer, which were
used to reduce Rubicon Limited’s existing debt balance, now
provide us with the fl exibility to meet our current and future
potential commitments to ArborGen out to early calendar 2014
(should that be required). With that capital raise completed, we
can now focus on rewarding shareholders by addressing the
considerable value that we all see in our ArborGen and Tenon
investments, according to the existing plans we have outlined.
OUTLOOK
ArborGen
During the period under review, ArborGen undertook a company-
wide restructuring process. As summarised in the ARBORGEN
section of this Review, the purpose of the restructuring was to –
‘… refocus and align the organisation’s resources - physical,
people and fi nancial – with the company’s existing commercial
base business. It is this base business, and the opportunities
that its existing market channels and pipeline of fully developed
(non-biotech) products currently offer, which has the potential to
generate a step-change in ArborGen’s near-term fi nancial results.’
Growing the base business, by –
• Participating in increased industry sales that will occur with
recovery in the US housing cycle;
• Moving customers up the genetic value ladder to MCP and
varietal offerings;
• Building on new business opportunities - e.g. bioenergy in the
US; and
• Investing in geographic growth – e.g. Brazil and China
will now be the immediate ArborGen focus going forward, and
we will be reporting on each of these in subsequent Reviews.
The acquisition of CellFor is a good example of both the allocation
of resources to, and increased intensity on, the base business
that will be applied moving forward. As already discussed, the
rationale for this resource reallocation is that a tighter strategic
and operational focus on that business will yield benefi ts in the
form of faster revenue and earnings growth. ArborGen’s overall
goal in this respect is to be both profi table and self-funding (i.e.
Partner contributions no longer required) from completion of its
fi scal 2014 year onwards. Whether this is achieved will ultimately
depend on the success of this restructuring process in quickly
increasing the size, scope and fi nancial performance of the base
business over the next 2-3 years.
ArborGen will also continue with its biotech investment program
in the manner outlined –
“…resources allocated to future biotech potential will be
targeted on research and development for the creation of the
truly ‘blockbuster’ category of products – i.e. traits that are
highly demanded by customers but which are unattainable under
traditional breeding technologies.”
This will mean, by way of examples, that the current work on freeze
tolerant eucalyptus (which will have application both in the US
and China markets), short rotation eucalyptus (for application in
the pulp and biomass markets), and improved pulping eucalyptus
products (for the large Brazil pulp market) will all continue as
before. However, the superior performance now being generated
from ArborGen’s elite MCP and best varietal families requires the
short rotation loblolly pine product to be redefi ned, to focus the
targeted biotech trait on improved wood density – a trait which is
so critical for structural lumber applications.
We will be reporting on progress towards all of these goals in
subsequent Reviews.
Tenon
This Review has also presented the ‘go-forward’ plan for Tenon.
In North America, Tenon will complete the restructuring initiatives
already under way, and release surplus cash to pay-down debt.
New product introductions will continue, with the goal being
to expand the breadth of product range into the retail and pro-
builder channels that Tenon has created over the past fi ve years.
Examples of this, which will be reported on in the new fi scal
year, are ‘FindIt”, a new internally developed proprietary pull-out
19Rubicon Annual Review 2012
Rubicon
kitchen cabinet product which Tenon has been asked by Lowe’s
to distribute into 800 stores commencing in the fi rst quarter of
next year, the addition of a new Empire range of “Plank Paneling”
products into 815 Lowe’s stores commencing October this year,
and a new doors program at Southwest which will target the large
Texas pro-builder market. As previously mentioned, Tenon will also
be targeting expansion potential in the US pro-builder channel, by
way of acquisitions, as opportunities present themselves.
In Australia, Tenon will be expanding its initial entry position
and moving to build a position of scale in this close geographic
market.
China will play an increasing role in Tenon’s future. The immediate
plan is to continue to increase the sale of product out of Taupo
directed into the China market, and to take a position in the
wholesale market there – a pre-requisite to building an in-market
position of size.
Growth into Australia and China will eventually reduce Tenon’s
current single-market dependence on the US for cash fl ow.
However, rebalancing Tenon’s portfolio across geographies will
take time, and the reality remains that despite best efforts, in
the very immediate term Tenon’s earnings will remain reliant on
recovery in the North American market. In this respect, increasingly
there are favourable data points emerging that indicate the worst
is now behind us and that we will over time begin to see a return
to mid-cycle operating conditions.
Factors supporting a US housing recovery which we have
commented upon previously, include –
• US housing affordability at an all time high;
• US new home inventories at a 40-year low;
• US mortgage rates at an all time low;
• Robust population growth in line with long-term trends;
• Housing starts per head of population at a 60-year low;
• Housing activity well below the underlying long-term trend;
and
• An aging housing stock, with two thirds of the total being well
over 25 years old, and the median age over 35 years.
Although ‘sticky’ unemployment, constrained access to credit,
and the shadow inventory of homes potentially for sale, remain
outstanding as issues to be resolved before a full US housing
recovery can take place, recent data highlight some emerging
positives. These include –
• House prices, which are off their peak by approximately 33%,
appear to have stabilised, and are now beginning to show some
gains. The closely watched Case-Shiller 20-city composite price
index rose 2.2% in May, marking two consecutive months of
house price gains. The alternative CoreLogic index reported
house prices rising 1.3% in June, and 2.5% on a June ‘year-on-
year’ basis (or 3.2% excluding distressed sales). The National
Association of Realtors commentary on existing house prices in
July was as follows –
“… all home price measures now are showing positive
movement and that is building confi dence in the market …
The national median existing-home price for all housing types
was $187,300 in July, up 9.4 percent from a year ago. The last
time there were fi ve back to back monthly price increases from
a year earlier was in January to May of 2006. The July gain was
the strongest since January 2006.”
Home prices are closely correlated with home sales in a housing
recovery. That house prices now appear to be stabilising is a
very important market signal, in that those potential buyers
who may have been standing back waiting to see where the
market ‘fl oor’ might be, should now be encouraged to re-
enter the market. As house prices recover, the equity people
have in their homes increases. This in turn goes to reduce the
number of ‘underwater’ home mortgages, and therefore, the
potential shadow inventory that might come onto the market.
Increased home equity is also an important source of funding
for homeowners (i.e. they can borrow against their home
equity) that can be spent on other items, which in turn re-
ignites the economy in a self-reinforcing cycle;
• Sales of existing homes in July (seasonally adjusted) were up
2.3% to 4.47 million (annualised), which was 10.4% above
the July 2011 fi gure.

20 Rubicon Annual Review 2012
Rubicon
• Over the past two years, “for sale” existing housing inventory
has declined from a peak of 12 months of demand, to now be
at 6.4 months, and listed inventory in July was 23.8% lower
than the level a year ago. While six months is considered to
indicate a ‘balanced’ market, there remains the unquantifi able
size of the ‘shadow supply’ of inventory that might come onto
the market via foreclosures. To this point, a recent Goldman
Sachs equity research report (July 23rd 2012) had the following
to say –
“Our housing checks have been indicating since the turn of the
year that inventory is scarce in good markets and our state-
wide analysis points to a 15% reduction in shadow inventory
in the fi ve key new home markets (Arizona, California,
Florida, Nevada, and Texas). At the same time, the growth in
building permits suggests a 34% increase in demand in those
same states … bottom line, we expect any further decline in
inventory to serve as a platform for price appreciation, further
aiding sales”;
• Housing starts increased to a seasonally adjusted annual rate of
746,000 in July, up 21.5% on July last year. Whilst this is well
down on the previous cycle peak of 2.3 million homes, it is also
well off the low of 500,000 new house starts recorded only 18
months ago;
• New home sales in July were up 3.6% on June, and up 25.3%
on the July 2011 fi gure. Although the median sales price was
down slightly (2.5%), inventory fell to a record low of 142,000
in the month, equating to only a 4.6 months supply at the
current sales rate;
Lending indicator of remodeling activity (LIRA)
Homeowner Improvements 4-quarter moving totals$ billions - July 2012 projections
$150
$140
$130
$120
$110
$100
$90
$80
Q2
Q2
Q1
2007 Q3
Q4
Q2
Q1
2008 Q3
Q4
Q2
Q1
2009 Q3
Q4
Q2
Q1
2010 Q3
Q4
Q2
Q1
2011 Q3
Q4
Q2(
e)
Q1
2012
Q3
(p)
Q4
(p)
Q1
2013
(p)
$33b fall
21Rubicon Annual Review 2012
Steve Kasnet Luke Moriarty
Chairman Chief Executive Offi cer
24 August 2012
• As an indicator of future expected activity, building permits
for July were 812,000 units - 6.8% up on June and 29.5% up
on the previous July. In addition, builder confi dence increased
in June to its highest point in over fi ve years, with builders
reporting the highest sales levels since February 2007; and
• While Tenon will participate in any recovery of new house
construction through its existing positions in the pro-
builder channel, it is recovery in the remodelling and
renovation segment that Tenon is most exposed to. Here too,
commentators are projecting a more positive outlook. By
way of example, the chart on the previous page shows the
remodelling activity forecast from the Joint Center for Housing
Studies of Harvard University released last month.
Although recovery is likely to be gradual, these points are all
indicative of a much stronger earnings profi le for Tenon in the
future. For now however, given the considerable uncertainty that
remains as to both the movement in the NZ dollar and the timing
of any recovery, like most industry participants Tenon will not be
giving earnings guidance for fi scal 2013, other than to say that
any short-term lift in its earnings as a result of market recovery
is unlikely to be felt until the second half of fi scal 2013. We will
however update you on Tenon’s progress as events unfold during
the year.
Finally, we would like to thank all of our shareholders, employees,
customers, and other stakeholders for your continued support
throughout this past year. As always, it is very much appreciated.
Rubicon

22 Rubicon Annual Review 2012
Rubicon Limited and Subsidiaries
Consolidated Income StatementFor the year ended 30 June 2012
RUBICON GROUP
Year ended Year ended
June 12 June 11
US$m US$m
Revenue 334 326
Cost of sales (254) (241)
Gross earnings 80 85
Earnings from associate - (1)
Distribution expense (71) (72)
Administration expense (16) (15)
Fair value gain on forest assets - 2
Restructuring costs (3) -
Operating earnings before fi nancing expense (10) (1)
Financial expense (4) (4)
Earnings before taxation (14) (5)
Income tax benefi t 2 (1)
Net Earnings (12) (6)
Attributable to:
Equity holders of the parent (8) (5)
Minority interest (4) (1)
Net Earnings (12) (6)
Basic/diluted earnings per share information (cents per share): (2.8) (1.8)
Weighted average number of shares outstanding (millions of shares) 285 285

23Rubicon Annual Review 2012
Rubicon Limited and Subsidiaries
Consolidated Statement of Comprehensive IncomeFor the year ended 30 June 2012
RUBICON GROUP
Year ended Year ended
June 12 June 11
US$m US$m
Net Earnings (12) (6)
Movement in currency translation reserve (1) 2
Other comprehensive income (net of tax) (1) 2
Total comprehensive income (13) (4)
Total comprehensive income attributable to:
Rubicon shareholders (8) (4)
Minority shareholders (5) –
Total comprehensive income (13) (4)

24 Rubicon Annual Review 2012
Rubicon Limited and Subsidiaries
Statement of Changes in EquityFor the year ended 30 June 2012
RUBICON GROUP
Year ended Year ended
June 12 June 11
US$m US$m
Total comprehensive income (13) (4)
Movement in Rubicon shareholders’ equity:
Increase resulting from Tenon share buy back 1 –
Movement in minority shareholders’ equity:
Decrease resulting from Tenon share buy back (1) –
Total movement in shareholder equity attributable to:
Rubicon shareholders’ equity (7) (4)
Minority shareholders’ equity (6) –
Opening equity attributable to:
Rubicon shareholders 148 152
Minority shareholders 56 56
Opening total Group equity 204 208
Closing equity attributable to:
Rubicon shareholders 141 148
Minority shareholders 50 56
Closing Total Group Equity 191 204

25Rubicon Annual Review 2012
Rubicon Limited and Subsidiaries
Consolidated Statement of Cash FlowsFor the year ended 30 June 2012
RUBICON GROUP
Year ended Year ended
June 12 June 11
US$m US$m
Cash was provided from operating activities
Receipts from customers 327 328
Cash provided from operating activities 327 328
Payments to suppliers, employees and other (333) (324)
Income tax received/(paid) – (1)
Cash (used in) operating activities (333) (325)
Net cash from operating activities (6) 3
Investment in fi xed assets (2) (2)
Investment in associate (9) (4)
Net cash from (used in) investing activities (11) (6)
Debt drawdowns 19 51
Debt repayment (1) (42)
Interest paid (3) (5)
Capital return by way of share buy back
To Tenon minority shareholders (1) -
Net cash from (used in) fi nancing activities 14 4
Net movement in cash (3) 1
Opening cash, liquid deposits and overdrafts 2 1
Closing Cash, Liquid Deposits and Overdrafts (1) 2
Net earnings (12) (6)
Adjustment for:
Financial expense 4 4
Depreciation 5 6
Taxation (2) –
Earnings from associate – 1
Forest asset valuation – (2)
Other 2 (1)
Cash fl ow from operations before net working capital movement (3) 2
Trade and other receivables (7) 2
Inventory (1) 6
Trade and other payables 5 (7)
Net working capital movement (3) 1
Net cash from operating activities (6) 3

26 Rubicon Annual Review 2012
RUBICON GROUP
June 12 June 11
US$m US$m
Current assets
Cash and liquid deposits – 2
Trade and other receivables 31 25
Inventory 53 53
Assets held for sale 3 2
Total current assets 87 82
Non current assets
Fixed assets 25 29
Forest assets 3 3
Investment in associate 72 63
Goodwill 85 85
Deferred taxation asset 11 9
Total non current assets 196 189
Total assets 283 271
Current liabilities
Bank overdraft (1) –
Trade, other payables and provisions (33) (27)
Current debt (1) (9)
Total current liabilities (35) (36)
Term liabilities
Term debt (57) (31)
Total term liabilities (57) (31)
Total liabilities (92) (67)
Net Assets 191 204
Equity
Share capital 163 163
Reserves (22) (15)
Equity attributable to Rubicon shareholders 141 148
Equity attributable to minority shareholders 50 56
Total Group Equity 191 204
Net Asset Backing US 50 cps US 52 cps
Stephen Kasnet Luke Moriarty Mark Taylor
Chairman Chief Executive Offi cer Chief Financial Offi cer
24 August 2012
Each of the above signatories certifi es that these fi nancial statements comply with generally accepted accounting standards and present a
true and fair view of the fi nancial affairs of the Rubicon Group.
Rubicon Limited and Subsidiaries
Consolidated Balance SheetAs at 30 June 2012
27Rubicon Annual Review 2012
BASIS OF PRESENTATION
The summary fi nancial statements presented are for the year to 30 June 2012 (with the comparative period being the year ended 30
June 2011) and are those of Rubicon Limited and its subsidiaries (the Rubicon Group). They have been prepared in accordance with New
Zealand Financial Reporting Standard No 43 (Summary Financial Statements). They have been extracted from the full fi nancial statements
that have been prepared in accordance with New Zealand Standards, which ensures compliance with International Financial Reporting
Standards. The full fi nancial statements, signed on 24 August 2012, have been audited by KPMG and given an unqualifi ed opinion. The
Group is a profi t-orientated entity. For a complete understanding of the affairs of the Group, the full fi nancial statements can be found
at www.rubicon-nz.com.
The consolidated fi nancial statements are expressed in Rubicon’s functional currency, US$.
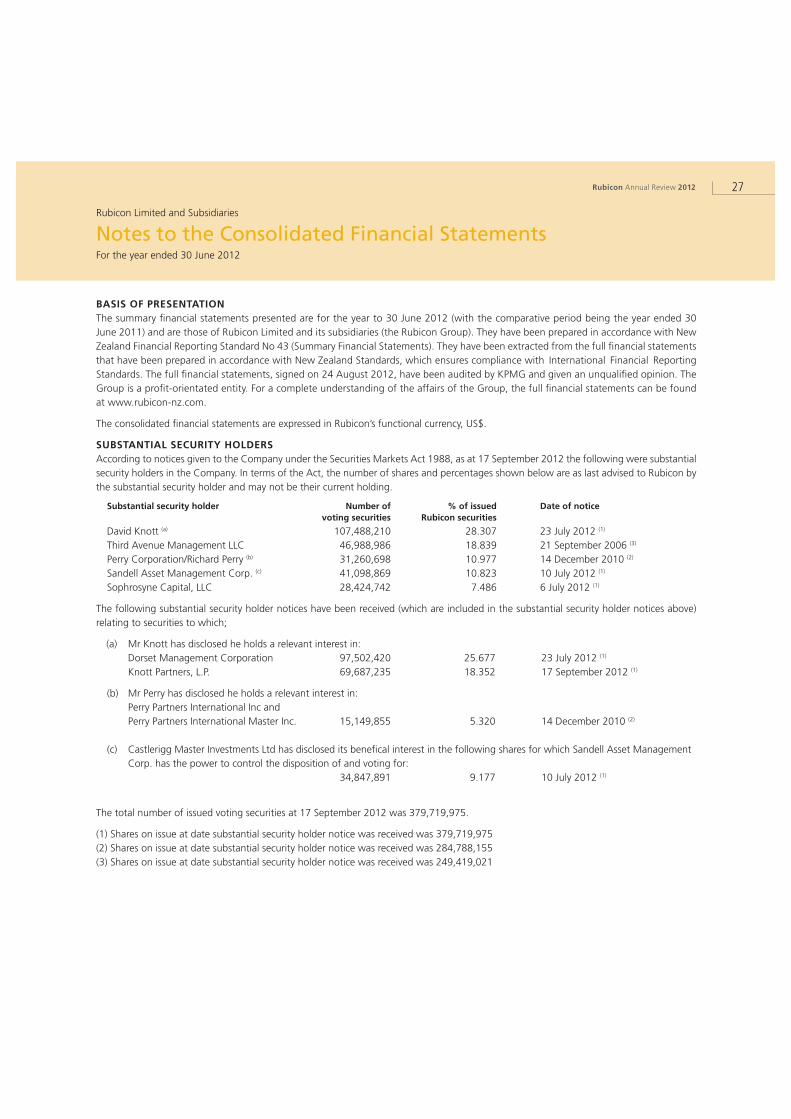
SUBSTANTIAL SECURITY HOLDERS
According to notices given to the Company under the Securities Markets Act 1988, as at 17 September 2012 the following were substantial
security holders in the Company. In terms of the Act, the number of shares and percentages shown below are as last advised to Rubicon by
the substantial security holder and may not be their current holding.
Substantial security holder Number of % of issued Date of notice
voting securities Rubicon securities
David Knott (a) 107,488,210 28.307 23 July 2012 (1)
Third Avenue Management LLC 46,988,986 18.839 21 September 2006 (3)
Perry Corporation/Richard Perry (b) 31,260,698 10.977 14 December 2010 (2)
Sandell Asset Management Corp. (c) 41,098,869 10.823 10 July 2012 (1)
Sophrosyne Capital, LLC 28,424,742 7.486 6 July 2012 (1)
The following substantial security holder notices have been received (which are included in the substantial security holder notices above)
relating to securities to which;
(a) Mr Knott has disclosed he holds a relevant interest in:
Dorset Management Corporation 97,502,420 25.677 23 July 2012 (1)
Knott Partners, L.P. 69,687,235 18.352 17 September 2012 (1)
(b) Mr Perry has disclosed he holds a relevant interest in:
Perry Partners International Inc and
Perry Partners International Master Inc. 15,149,855 5.320 14 December 2010 (2)
(c) Castlerigg Master Investments Ltd has disclosed its benefi cal interest in the following shares for which Sandell Asset Management
Corp. has the power to control the disposition of and voting for:
34,847,891 9.177 10 July 2012 (1)
The total number of issued voting securities at 17 September 2012 was 379,719,975.
(1) Shares on issue at date substantial security holder notice was received was 379,719,975
(2) Shares on issue at date substantial security holder notice was received was 284,788,155
(3) Shares on issue at date substantial security holder notice was received was 249,419,021
Rubicon Limited and Subsidiaries
Notes to the Consolidated Financial StatementsFor the year ended 30 June 2012

28 Rubicon Annual Review 2012
Rubicon Limited and Subsidiaries
Board of Directors
Stephen Kasnet
Director and Chairman
BA University of Pennsylvania (Philadelphia)
Steve is a former President and CEO of Raymond Property Company
and Dartmouth Street Capital, which are real estate companies
engaged in the acquisition, development, renovation, ownership
and management of residential and commercial real estate in the
Boston area. Prior to this he was President and CEO of Harbor
Global Company Limited, which maintained the largest real estate
investment fund in Russia and owned and managed one of Russia’s
leading asset management and mutual fund complexes.
He is CEO of Calypso Management LLC, Chairman of Directors of
Columbia Labs, Inc, Trustee of Governors Academy, President of
Ocean Manchester Corporation and Director of Tenon Limited, First
National Bank of Ipswich and Two Harbours Investment Corp.
Hugh Fletcher
Director
MBA Stanford University; MCom (Hons), BSc University of Auckland
Hugh is Chairman of IAG (New Zealand) Holdings Limited and IAG
(New Zealand) Limited, and a Director of Fletcher Building Limited,
Vector Limited and Insurance Australia Group Limited.
He is also a Trustee of The University of Auckland Foundation, the
Dilworth Trust, the Fletcher Trust and The New Zealand Portrait
Gallery, and a member of the Asia Pacifi c Committee of the
Trilateral Commission and the Australia and New Zealand Advisory
Board of L.E.K. Consulting.
Hugh has broad pastoral farming interests. His executive experience
includes six years as Managing Director and Chief Operating Offi cer
of Fletcher Challenge Limited, before he became CEO from 1987–
1997.
Bill Hasler
Director
MBA Harvard; BA Pomona College (California), CPA
Bill is former Vice Chairman and Board Director of KPMG Peat
Marwick, a position he held from 1984–1991 after being
responsible for KPMG’s western US operations from 1984–1986,
and subsequently heading their worldwide management consulting
practice from 1986–1991.
Upon leaving KPMG, Bill became Dean and Departmental Chair
of the Haas School of Business at the University of California in
Berkeley. He held this position from 1991–1998, and continues
today as Dean Emeritus.
In addition, Bill is a Director of Globalstar Inc, Inside Track Inc, Aviat
Networks, TOUSA Inc, Mission West Properties Inc, BoardVantage
and ETWater Inc and is a Trustee of Schwab Funds. He is also a
consultant to, and investor in several private technology companies.
George Karaplis
Director
BEng. and MBA, McGill University
George has over 35 years’ experience building and growing
shareholder value and has a proven track record in ‘turnaround’
and high growth companies.
He is currently Deputy Chairman of Netia, a Polish integrated
telecom services and media solutions’ company, a Director of Tenon
Limited, and he has previously led France Telecom’s Global One
business in Greece as Managing Director. He also acted as Chief
Financial Offi cer and General Manager of International Investments
for the Hellenic Telecommunications Organisation.
Prior to that Mr Karaplis held a number of management positions
in Canada and Europe. He has relevant experience in the forestry
and wood products industry from his previous employment with
Domtar, a Canadian Paper and Forest Product producer.

29Rubicon Annual Review 2012
Rubicon Limited and Subsidiaries
Board of Directors
David Knott
Director
B.A. University of Pennsylvania, M.B.A. Wharton School of the
University of Pennsylvania
David is the Chief Executive Offi cer, Chief Investment Manager and
Managing Partner of Knott Partners who, with associated entities,
is Rubicon’s largest shareholder. He has served as Chief Investment
Manager of Knott Partners from 1987, and prior to this he was a
General Partner and analyst at Mandrakos Associates.
David currently serves on the board of Directors of Paramount
Resources and Ligand Pharmaceuticals, Inc. He is also a Director
of Boy’s and Girl’s Harbor and Say Yes to Education, and the
Undergraduate Financial Aid at the University of Pennsylvania.
Luke Moriarty
Chief Executive Offi cer
MS Stanford University; LLB (Hons) and BCA Victoria University
Luke has a strong background in business and commercial
transactions, both in New Zealand and North America. His fi nancial
experience has included extensive international business valuation,
acquisition, divestment and joint venture analysis and negotiation,
and structuring and execution in multi-billion dollar transactions –
ranging from minority buyouts to trade sales and IPOs.
He spent several years in North America, and while there led the
fi nancial restructuring of Fletcher Challenge Canada, through the
sale of TimberWest Forests and Blandin Paper Company. He joined
the Fletcher Challenge Executive Offi ce in 1999, and in 2000 was
instrumental in the structuring of the fi nancial separation of the
Fletcher Challenge Group, including the establishment of Tenon
(then Fletcher Challenge Forests) and the formation of Rubicon in
2001.
Luke is a Director and the CEO of Rubicon, the Chairman of Tenon
Limited, and a Director of ArborGen Inc. Luke is also a Monetary
Policy Advisor to the Governor of the Reserve Bank of New Zealand.

Investor Enquiries/Registered Office
Level 1, 7-9 Fanshawe Street, Auckland
PO Box 68 249, Newton,
Auckland 1145, New Zealand
Telephone: 64 9 356 9800
Facsimile: 64 9 356 9801
Email: [email protected]
Website: www.rubicon-nz.com
Stock Exchange ListingThe Company’s shares (RBC) are listed
on the NZSX.
Shareholder EnquiriesShareholders with enquiries about share
transactions or changes of address should contact
the Share Registrar:
Computershare Investor Services Limited
Level 2, 159 Hurstmere Road
Takapuna, Auckland
Private Bag 92 119,
Auckland 1142, New Zealand
Telephone: 64 9 488 8777
Facsimile: 64 9 488 8787
Email: [email protected]
www.rubicon-nz.com