this document has been reproduced from the … · einzel lens. as a consequence of those...
TRANSCRIPT

OCA TECHNICAL REPORT 63-7-G
GEOPHYSICS CORPORATION OF AM2RICA Bedford Massachusetts
FINAL REPORT
Covering the period 29 March 1963 - 30 September 1963
Project Director Principal Scientist Richard Fo K Herzog Helim t J Liebl
Prepared for Jet Propulsion Laboratory
CntAtfnnia Institute of Technolog Pasadena California
GPO PRICE $
CFSTI PRICE(S) $
Hard copy (HC) SPUTERING ION SOURCE
FINAL REPORT
THIRD PHASE Microfiche (MF) P1W
46 CONTRACT NO 9505765k
RIPROWefDlOrBOST -AAILABLamp COPY
N66L 24405 (ACCESSION NUM ER) (THRU)
INFORMATION SERVICE ACOTOR
_SPdn9fi~fd Va 22151 (NASACOR ORAP
httpsntrsnasagovsearchjspR=19660015116 2018-07-28T235338+0000Z
N 0 T I C E
THIS DOCUMENT HAS BEEN REPRODUCED FROM THE
BEST COPY FURNISHED US BY THE SPONSORING
AGENCY ALTHOUGH IT IS RECOGNIZED THAT CER-
TAIN PORTIONS ARE ILLEGIBLE IT IS BEING RE-
LEASED IN THE INTEREST OF MAKING AVAILABLE
AS MUCH INFORMATION AS POSSIBLE
TABLE OF CONTENTS
Section Title Page
I INTRODUCTION I
2 MODIFICATION OF THE APPARATUS 2
21 General 2 22 Duoplasmitron 2 23 Power Supply 5 24 Primary Ion Beam Optics 5 25 Secondary Ion Optics 7
3 RESULTS a 31 Ions Sputtered From Pure Elements 8 3o2 Ions Sputtered From Alloys 12
321 General 12 322 Effect of Sample Preparation on
Relative Spectral Peak Heights 13 323 Effect of Bombarding Period on
Relative Spectral Peak Heights 13 324 Effect of Primary Beam Energy on
Absolute Spectral Peak Heights 14 325 Effect of Primary Beam Energy on
Relative Sensitivities 14 326 Effect of Concentration on
Relative Sensitivities 15
33 Ions Sputtered From Compounds 17
CONCLUSION 19
SECTION 1
INTRODUCTION
The first phase of the work consisted in the design construction and
assembly of a novel ion source for solids whereby the sample it bombarded
with an intense beamof fast noble gas ions which results in sputtering of
the sample material A fraction of the sputtered material was expected to
be ionized These ions can be accelerated and analyzed in a mass spectrometer
A final report covering the first phase was submitted to JPL on 28 January 1962
The buuunu nUase of the work involved the testing of the ion source wxua
particular emphasis on operational performance and applicability to the
qualitative analysis of different types of solids A final reportcovering
the second phase was submitted to JPL on 15 December 1962
The third phase of the work which is now completed dealt mainly with
improvements of the source and power supply and the applicability of the ion
source for the cuantitativa analysis of solids
SECTION 2
MODIFICATION OF THE APPARATUS
21 GENERAL
The first task was the modification and improvement of the ion source
built under JL Contract No 950118 including the associated power supply
with the aim to permit operation at higher energies of the primary beam to
increase the density of the bombarding ion beam and to reduce its cross section
Operation of the ion source constructed in the first phase of the investigatio
was limited to a beam energy below 15 kv because of flashovers which occured
between the duoplasmatron anode and the ion acceleration electrode or at the
einzel lens As a consequence of those flashovers high voltage transients
reached the duoplasmatron power supply causing frequent component breakdownas
Therefore the purpose of the redesign was not only to allow operation at higher
voltages but also to prevent component breakdown in case of flashover With
this aim in mindq a new duoplasmatrom and power supply was built
22 DUOPLASMATRON
A The following considerations led to the new design The plasma density on
the axis of the duoplasmatron near the anode increases rapidly with magnetic field
strength until after passing a flat maximum it decreases slightly Zn prauuice
therefore the duoplasmatron must lie operated above a minimum magnetic field
strength to provide maximum plasma densityalong the axis In conventional
duoplasmatrons- the magnetic field is produced by a solenoid of 2000 to 7000
ampere turns providing a magnetic field bf the order of 2000 Oerstedt between
the pole pieces Therefore replacement of the solenoid by a permanent magnet
of equivalent strength appeared to be feasible and oflered the following
advantages
(1)- No power supply for the magnetic field is needed This is especially
advantageous because the duoplasmatron operates at a high potential above ground
and the power for the solenoid has to be supplied by a high voltage isolation
transformer
(2) The heat generated in the solenoid is of the same oAar as the heat
generated by the arc for a given cooling rate a higher arc current can be
drawn if the solenoid is replaced by a permanent magnet
(3) Since the baffle electrode which forms one pole of the magnetic field
operates at an electrical potential different from that of the anode which
forms the other magnetic pole it is necessary in the case of a solenoid to
have an additional air gap in the path of the magnetic flux through the iron
enclosure to provide electrical insulation For a given magnetic field strength
the presence of the air gap requires additional magnetic induction This is
avoided if one chooses ceramic permanent magnetic material which is electrically
insulating
(4) There are ceramic magnete on the market which have an exceptionally
high coercive force typically around 2$000 Oarstedt Thus the required magnetic
length is relatively small therefore less iron is needed and since the ceramic
material itself is much lighter than copper the whole assembly becomes
considerally shorter and lighter than an equivalent design employing a
magnet coil
The replacement of the solenoid by a permanent magnet is considered to be
an important step towards the development of a flyable modal
Figure 1 shows the new duoplasmatron in detail The magnetic field is
produced by three rings (1) consisting of Indox V which were magnetized
axially The magnetic flux passes through the cover plate (2)into the baffle
electrode (3) across the gap and through the anode holder (4)and the base
plate (5)back to the magnet All these parts are made of Armco iron and are
nickel plated The axial field generated in the gap amounts to about 7000 gauss
The anode (6)is of copper and carries a 008 inch center hole through which th
ions are extracted The anode is pressed against the cooling plate (7) also
of copper by the-magnaetic force which the field exerts on the anode holder
The baffle electrode is centered and kept at the correct distance from the anode
by a short tubular insulator (8) made of alumina A copper ring (9)is brazed
to the baffle electrode and six insulated screws (10)hold the inner assembly
together The cooling plate the insulator the baffle electrode with the
copper ring aid a teflon ring (11) carrying two gaskets enclose a circular
channel (12) for the coolant A stainless steel flange (13) carries the two
fila~ feeithroughs (14) and the gas inlet tuba (15) The filament (16)
consists of platinum wire mash This is coated with barium carbonate prior to
installation it is subsequently reduced to barium oxide by an activation process
The performance of the new duoplasmatron exceeded expectations
23 POWER SUPPLY
Figure 2 represents a schematic of the new power supply for the duoplasmatron
The components are mounted within a cabinet with rounded corners in order to
avoid corona discharges The cabinet is insulated from ground and connected
to the high voltage terminal Therefore it has to be placed inside a grounded
screen to protect the operator and to shield the other equipment against
A distance of four inches between cabinet And acreen eliminatestrnsients
the possibility of flashover to ground Due to the reduced power consumption
of the new duoplasmatron the rating of the 30 kv isolation transformer was
reduced below that required previously As a consequence of the more compact
design of the power supply the total capacitance to ground is also reduced
considerably less electrostatic energy is stored and any internal flashoverf
are less energetic No breakdown of rectifier diodes which was the main
trouble before has occured with the new power supply
24 PRIMARY ION BEAM OPTICS
One of the main objectives of the new design was the increase of the
operating volkage For this purpose the distance between theion acceleration
electrode and the ion extraction hole in the duoplasmatron anode was increased
to an optimum value where the ion beam just missed striking the inner wall of
the opening in the apex of the acceleration electrode This change in addition
to a careful polish of all the edges of the einzel lens components permitted
the acceleration of the ion beam up to at least 25 kv
Another ob3actLve was the reduction of the diameter of the bombarding beam
With the previous arrangement the diameter of the primary ion beam at the
target could not be reduced t6 lass than 3 mm mainly because of distortion
by the deflection condensers Two alternatives were available to correct this
either to rebuild the deflection condenser in a more sophisticated form or
simpler to eliminate it completely and let the beam travel down straight to
the target In this case the target had to be tilted so that the secondary
ion optics wasno longer axially symmetric4 Although it wasexpected that
this latter modification might significantly decrease the secondary ion
collection efficiency this was not the case and this design was adopted
accordinlv
Itwas also considered desirable to operate the center electrode of
the ainzel lens at the same voltage as the anode of the duoplasmatron Thus
the high voltage feedthrough a likely source of flashovers could be eliminated
by connecting the center electrode internally with the duoplasmatton anode
This also resulted in the elimination of the voltage divider required in the
previous desing the corresponding decreasein power consumption reduced the
rating of the hgh-voltage power supply4
However the correct image adjustment of the einzel lens had now to be
determined by experimenting with several inserts in the center electrode
with different inner diameters Withthefinal setting a beam diameter at
the target of about one half of a millimeter has been achieved However
this intense core of the beam is surrounded by a weak halo of scattered
ions A mask with a one millimeter hole has been mounted above the sample
to prevent the halo of the beam hitting the sample
25 SECONDARY ION OPTICS
Since in the new arrangement the surface of the target has to be inclined
at an angle of 30 degrees to the previous vertical positionrthesample holder
had to be redesignad Again six samples can be mounted simultaneously which
are brought into the primary beam by rotation of the shaft
A series of experiments was carried out in order to determine the optimum
length of the first bubularrelactrode of the secondary ion optics for best
ion collection efficiency Zt turned out to be the same as tne one uses in
the previous arrangement6
SECTION 3
RESULTS
31 ION SPUTTERED FROM PURE ELEMENTS
Complete secondary ion spectra up to mass number 350 were taken from
the following elements Al Ye Co Ni Cu Zn Zr Nb AS Cd Sn Ta Pb
Figure 3 is an example of a typical spectrum obtained from a pure iron
sample
The samples were made up from the purest elements available All elements
were bombarded with 10 kv argon ions
In the following table only those ions are listed which are deduced from
the major peaks the ions known as instrumental background and the ions trom
elements present as impuritiea are omitted
Table 1
Aluminum
3+ 2+ + + Al Al amp A1 2 0 A120R+ Al3Th A10T Al5 AlJ6 Al A18 A19r All 0
Iron
a+ Feo e0 r0 pFaG04Fe+FO + PO+ VR+ Fe -PF acoa VF 4 Fe FeC YeO2 Ye 2 Ye2Ou Fe2 0 Ye 3 030 Ye 3 32
Cobalt
C oo+Ccoo+ Cooe+ + + +O + coo+ CO On+ C0+ Co~~~oC~i ~~Co012 C02 0C1 02 20 2oO 0204P0
00311 0030) 00301 004) co04o+ o 00500C O3H+ C 3 + O3 H + C 0+C4 + n 5+ C5 +
Nickel
Ni+ iNoH+ +I1 q+ I+ Ni 4 + Ni5+N i0+2+ NiO Nplusmn20+ Ni+ 3 Ni3O+ Ni40+
Copper
2+ + + + + 3-+ + +0u0 u2 01+ Cu201+ Cu3 3OCu CuO 2Cu Cu 0u302
Zinc
++ Zn2 02 Zn23 3 30+ ZnT302Zn+ZnH nO+ ZnOH + Zn2 Z 2
Zirconium
Zr+ ZV0+Z2tfZ +r + Zr+ +0V + ZrZr Zr rOZrZr 3 2 20
2+ + + + ~j+ +io4~+ +2Nb Nb Nb NbC NbO2 2 21 2 3+3
Silver
2+Ag A92 63 A
Cadmiuia
cad2 Cd+ ad -d Cd-O+ Cd-+
Tin
2+ + +
+ Sn Sn2+Sn2
Tantalum
Ta2 + TaO +TaO 2
Lead
P3+P b2+ P + 9 b+
Generally the parent peak of the singly charged ion is by far the largest
peak The intensities of the doubly charged ions and of the diatomic ions are
lower by about one order of magnitude than the intensities of the singly charged
ions and the intensities of the triply charged ions and the triatomic ions are
lower by two orders of magnitude Quadruply charged ions were not detected
however higher pblymeric ions have been found in the 6ase of aluminum as high
as Al10
A surprisingly large number of oxide and hydroxide ions have been found
It seems to be rather unlikely that these are actual constituents of the sample
since the surface layer which might contain those components is rapidly removed
by the bombarding beam Contamination of the bombarding argon beam by small
amounts of water vapor and air might cause the production of these ions A
thorough investigation is planned with the new equipment designed especially
to reduce the background
10
The following table contains preliminary figures for the sensitivity of
pure elements relative to iron if the samples are bombarded by 10 kv argon
ions
Table 2
Fe 1 (by definition) Zr 018
Al 65 Nb 235
Co 072 As 025
Ni 056 Cd 152
Cu 018 Sn 028
Zn 061 Ta 005
Ph 045
This comparison has been performed with the parent peaks only which are due
to singly charged ions The samples were tested by keeping the primary ion
beam as constant as possible and adjusting the secondary ion beam for maximum
output of the mass spectrometer Corrections were applied to compensate for
the effect of different voltages used to accelerate the secondary ions Naturally
the accuracy of this method is rather limited and the measurements will be
repeated with the new source now under development which will permit a more
direct comparison Nevertheless it can be seen already that the sensitivities
for the majority of elements lie within one order of magnitude
It might be expected that the relative secondary ion yields of the constituents
of an alloy will differ significantly from the relative secondary ion yields
obtained from pure elements0 It can be argued that the probability of producing
a sputtered-ion rather than a sputtered neutral particle depends not only on
11
certain physical properties of the particle in particular its ionization
potential but also on certain physical or chemical properties of bulk material
as a whole from which the particle-originates in particular its work function
Fortunately it has been found experimentally (See SECTION 326) that the
composition of the supporting bulk material has only little influence on the
sputtering yield and ionization of one particular component
32 IONS SPUTTERED FROM ALLOYS
321 General
In order to investigate the quantitative behavior of secondary ion
released from the surface of_ alloys a number of certified samples were obtained -
from the National Bureau of StandardsTbThesewere
Iron -Alloys
1TBS Standard 444 629 Fe 0019 Ti 012 V 205 Cr 462 Mn 1017 Ni
022 Go
Nbs btandard V40L 965 Fe (001 Ti) 0024 V 013 Cr 036 Mm 173 Nit
0267 Co
NES Standard 465 994 Fe 020 Ti 0002 V 0004 Cr 0032 Mn 0026 Ni
0008 Co
The sample material was supplied in the form of 732-inch diameter rods
frbm these discs of 116-inch thickness were cutb The flat surfaces Af the
discs to be exposed to the bombarding beam of argon ions were polished
Figure 4 is an example of a spectrum from a steel sample
12
Tin Alloys
NBS Standard 54d 8857 Sn 7047 Sb 0627 Pb 362 Cu 0088 As
Sn 079 Sb 690 Pb 0004 Cu 0129AsNBS Standard 127A 3003
IBS Standard 53d- 494 Sn 992 Sb 8467 Pbp 0268 Cu 00457As
These samplezmaterials are supplied in powder formfrom which LtU
)elleots were pressed
322 Effect of sample preparation on relative spectral peak heights
The effect of sample preparation prior to mounting in the ion
source was investigated with three samples of stainless steel Standard 444
After polishing with emery cloth the first sample was wiped only with tissue
paper the second was rinsed in acetone and the third was dipped in a 507
solution of hydrochloric acid rinsed with distilled water and dried with
tank nitrogen
The relative peak heights of iron chromium and manganese showed
It appears that any contaminatingno significant variation from sample to sample
surface layer was removed in a period appreciably shorter than that required to
record the spectrum
323 Effect of bombarding period on relative spectral peak heights
mple of 444 Stainless steel was mounted and the primary
seam of 5kv argon ions was switched on After apperiod of several minutes shy
13
which is required for adjustments the first secondary ion spectrum was
recorded the recording wag-repeatedVgdy45ifut fot-eriodcdf oedhour
The relative peak amplitudes remained unchanged within the experimental limits
of reproducibility This result indicates that an equilibrium is reached within
the period required for initial adjustmentsi
324 Effect of primary beam energy on absolute spectral peak heights
The spectrum or a sampLe of 444 Stainless Steel was recorded with
primary boam energies varying In steps from 5 1w to 25 ki (Figure 5 curve 1)
and then a second time starting from 5 kv again (curve 2) The intensity
seems to level off for Fe above 20 kv while for Cr it dontinues to increase
The higher intensity at the second run maybe the result of surface cleanup
Luring the first run
325 Effect of primary beam energy on relative sensitivities
From the run described above the sensitivities of Ni Mn Cr and V
celative to iron were evaluated by dividing the peak height~ratios by the actual
Itwas expected that the discriminshyrelative atomic concentrations (Figure 6)
ation between different elements would decrease with increasing bombarding
energy (See Final Report - Second Phase Section 4) For the elements Vanadium
and Chromium wncn nave a muca nigner sensitivity than iron the curves show
indeed a slightly decreasing tendency up to about 20 kv From there on however
With manganese and nickel this effect is not noticeablethey increase again
14
One possible explanation for this behavior might be that up to about
20 kv the argon ions loose their energyclose enough to the surface so that
the apparent temperature of the surface increases At energies above 20 kv
they penetrate deeper into the lattice and less energyis absorbed in the surface
layers so that the apparent temperature decreases again
Thisresult indicates that one does not gain anything by using bombarding
energis -higher than 20 kv as far as discrimination betweendifferent elements
is concerned
326 Effect of concentration on relative sensitivities
The relative sensitivities ot the main constituents in the three
iron alloys were obtained from the mass spectra in the same manner as described
in 325 and compared with the actual certified concentrations The relative
sensitivities thus deduced for three different concentrations are plotted in
Figure 7 for 10 kv and 15 kv primary beam energy
Generally it seems that the relative sensitivities of each element
tested so far (Ni Cr Co Ti V) deviate from the mean value byiless than plusmn50
over the wide range of doncentrations covered The only exception is manganese
mass number 55 where on one sample a larger deviation has been found Further
experiments will be needed to explain this abnormal behavior The-isolated
points which are not connected with thecurves are shifted by the instrumental
background which becomes significant at theselow concentrations and tends to
15
increase the apparent sensitivity for minor constituents Extension of
quantitative measurements to lower concentrations will be possible with the
improved design of the ion source now under development
Figure 8 shows a similar plot obtained from the three tin alloys Here
the maximum deviation of the relative sensitivities of the constituents (Cu As
Sb Pb) lie within plusmn281 with the only exception of copper at the lowest concenshy
tration of 000004 which again can be explained by instrumental background
The fact that the relative sensitivities are essentially independent of
he relative concentrations is of extreme importance for the performance of a
iuantitative analysis The beat way to perform such an analysis is to compare
the mass spectraof the unknown sample with two or more calibration samples
of known composition These calibration samples should consist of the same
constituents as the sample to be analysed The concentration of the components
of the calibration samples whould cover a wide range which covers the concentrashy
tions to be expected in the sample to be analysed Naturally before this
quantitative analysis can be done it is necessary to know approximately the
composition of the-sample A qualitative mass spectrum with an evaluation of
the peak heights is the first step in this-direction After the relative
sensitivities of all components have been measured with the calibration samples
these figurescan be applied to the unknown sample and relative concentrations
of its components can be computed Judging from the results obtained sofarltshy
it is expected that in this way the error-in the measured composition can be
16
reduced to less than plusmn50 The use of a single calibration sample is possible
if a slightly higher error is tolerable A fair accuracy can be achieved even
without any sp2ciaalibration if the relative sensitivity values of the
pure elements are used for the evaluation of the mass spectra For instance
the sensitivity ratio NiFe and CoFe agreed perfectly and PbSn within the
50 error limit only the sensitivity ratio of CuSn asderived from pure elements
was slightly below the value obtained from alloys
33 IONS SPUTTERED FROM COMPOUNDS
Some preliminary runs were made in order to compare the secondary ion
spectrum ofa-metal with that of soma of 2xs compounas The element chosen was
zirconium and the compounds were zirconium oxide ZrO2 zirconium oxychloride
ZrOCI2H20 zirconium nitrate Zr(N03)4 zirconium sulphate Zr(S04)2 because
this region 6f the mass spectrum is relatively free of instrumental background
The pure zirconium metal was supplied in the form of a rod 3mm in diameter
from which a short piece was cut and mounted on the samnle holder The compounds
were supplied in the powder form which waspressed into pellets of 14 inch
diameter and 116 inch thickness mounted on the sample holder simultaneously
with the metal
The spectrum-of the pure zirconium metal showed the peaks listed in Table 1
TheZr+ and ZrO+ peaks were about equally high and about ten times as intense
as the Zr0 2+ and Zr2 peaks the Zr20+ peaks were bout ond third as high as
the Zr2+ peaks The other peaks were extremely small Strong outgassing from
the compound samples must have occurred since the chlorine peaks appeared also
in the spectrum of the pure element
With the zirconium oxide sample the ibns Zr+ ZrO+ and ZrO2+appeared in
about the same relative ratio as with the pure metal however the intensity
was reduced to about 110- The Zr + peak did not appear-at all whereas the
Zr2 02+ peaks appeared with about the same intensity as the ZrO + peaks There
was also a weak 0+ peak but no 02+ peak
The spectrum of zirconium oxychloride showed the peaks Zr ZrO ZrCl
Zr20 and Zr2Cl in about equal intensities Besides these 0+ HO 07 and
Cl peaks appeared
When zirconium nitrate was bombarded it comenced to outgas so vehemently
that the pressure rose considerably Intense peaks appeared representing Zr F
ZrOt and Zr0 2 The ZrO peaks were about twice as high as the Zr+ peaks No+ + N peaks was found only a weak N peak
With zirconium subbhate only very weak4 peaks of Zr and ZtO were found
None of the other constituents appeared
18
SECTION 4
CONCLUSION
The sputtering ion source for the analysis DfE solids which was built
and tested under Contract No 950118 has been modified and improved during
this phase of the contract in order to allow operation at higher bombarding
ion energies (upto 25 kv) and to reduce the diameter of the bombarded spot
on the sample to about one-half millimeter
Extensive runs have been performed to investigate whether the new ion
source can be used for a onantitative analysis The conclusion so far is
that the sputtering ion source showed superior performance compared with the
standard spark source in regard to precision of the analysis and it is
expected that the -sputtering source will become an extremely valuable tool
for solids analysis However the complexity of the problems and the large
number of parameters involved demand still much more calibration work withh
awider variety of tesot samples in order to fully understand the behavior
oz tne sputtering ion source ana to evaluate the overall accuracy of this
analytical method So far the choice of samples was seriously limited because
of interference with instrumental background The reduction of this background
is the main objective of the proposed future work
x~o
i
I0 20 1070 75 s 65 60 1 -+ I 02 C F Fe LCuOH bull FeOH+ FeO+ FeC+ cu Fe
iu-e 2 I I of ionk-y [ c s L a pl[ e icn c ur facebilardadl iihL
10 kay adeu[T irm1a$ Salehad 15g S k0pZ~uM Lila acclOerarina field
55
I10deg - t I11 111 i I -111111 IVTYI -11~I IITT --I- i z Ishy
0 H
gt 10-
NBS STANDARDS 54D 127A 53d
(TIN ALLOYS)
b
-
---------shy
w
0001
Figure 8
001 01 1 10 ATOMIC CONCENTRATION RELATIVE T d TIN
Effect of concentration on relative sensitivities for NBS standards 54D 127A and 53d (tin alloys)
I00 I I l iiil a I II I I I I ii] = - lll I I I j Ii I II
-- 0lkv FOR shy
( Cr (IRON ALLOYS) ONLY I[Okv
15kvTi1v LTi
0I T- 1 v Cr 10 I kvV
15kv ____________
L - 10kv
ILl
t I ii l iiil Ii ilulll Ii lii i l I ltl 1111l 1l11 00001 0001 001 0
ATOMIC CONCENTRATION RELATIVE TO IRON
Figure 7 Effect of concentration on relative sensitivities for NBS Standards 4444 ann uutOn alloys)
0------- -Q--shy
30 I V
D 2
1 gt 20
NBS STANDARD 444
(STAINLESS STEEL)
J
-
z3 LUI
2
- 9- ---o 1 2
-8
Cr
M n
N i
FOR Ni
O NLY
-5a
5 10 15 20 25 key
ENERGY OF BOMBARDING ARGON IONS Figure 6 Effoct of prnLary beam energy on relative spectral peak heights for NBS Standard 444 (sLainless stcel)
NBS STANDARD 444
a(STAINLESS 3
STEEL)
0shy
r~Cr
2 - -J Cr
z 0
ofc) Fe
u)
0 -I
I -I I
5 I0 15 20 key 25
ENERGY OF BOMBARDING ARGON IONS - V rrnrr nF nrvmn-v bnam nnerrv on absolute soectral pe-ak hcights for NIBS Standard 444(stainless sLool)
F NBS STANDARD 461 10 kv Ar- Ions
xid XI0Q
40 45 5o 60 5 5 M
Ar K Ti V Cr Mn Fe Co Ni TiO CrO MnO Fe FeOH
Figure 4 Part of secondary ion specLrum from a surface of 1DS Standard 461 (low alloy steel) bombarded with 10 key argon ions scanned by sweepiig the magnetic field shy
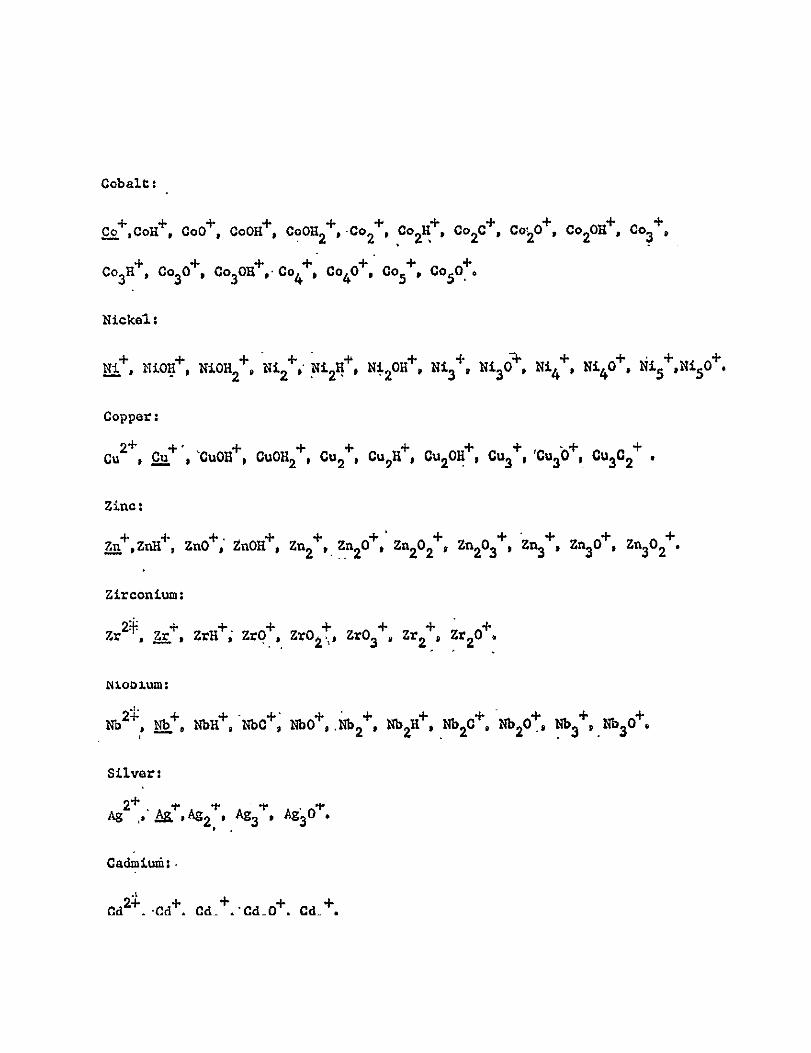

F NBS STANDARD 461 10 kv Ar- Ions
xid XI0Q
40 45 5o 60 5 5 M
Ar K Ti V Cr Mn Fe Co Ni TiO CrO MnO Fe FeOH
Figure 4 Part of secondary ion specLrum from a surface of 1DS Standard 461 (low alloy steel) bombarded with 10 key argon ions scanned by sweepiig the magnetic field shy