this document comprises a registration document (the
TRANSCRIPT


This document comprises a registration document (the “Registration Document”) relating to Made.com Limited(the “Company”) and has been prepared in accordance with the prospectus regulation rules (the “ProspectusRegulation Rules”) of the Financial Conduct Authority (the “FCA”) made under section 73A of the FinancialServices and Markets Act 2000 (as amended) (“FSMA”). This Registration Document has been approved by theFCA as competent authority under Regulation (EU) 2017/1129 as it forms part of retained EU law as defined inthe EU (Withdrawal) Act 2018 (the “UK Prospectus Regulation”), and has been made available to the public inaccordance with the Prospectus Regulation Rules. The FCA only approves this Registration Document as meetingthe standards of completeness, comprehensibility and consistency imposed by the UK Prospectus Regulation, andsuch approval should not be considered as an endorsement of the Company that is the subject of this RegistrationDocument.
The Company and its directors (whose names appear on page 25 of this Registration Document) (the “Directors”)accept responsibility for the information contained in this Registration Document. To the best of the knowledge ofthe Company and the Directors, the information contained in this Registration Document is in accordance with thefacts and this Registration Document makes no omission likely to affect the import of such information.
No representation or warranty, express or implied, is made and no responsibility or liability is accepted by anyperson other than the Company and its Directors, as to the accuracy, completeness, verification or sufficiency ofthe information contained herein, and nothing in this Registration Document may be relied upon as a promise orrepresentation in this respect, as to the past or future. No person is or has been authorised to give any informationor to make any representation not contained in or not consistent with this Registration Document and, if given ormade, such information or representation must not be relied upon as having been authorised by the Company.Without limitation, the contents of the website of the Group do not form part of this Registration Document andinformation contained therein should not be relied upon by any person. The delivery of this RegistrationDocument shall not, under any circumstances, create any implication that there has been no change in thebusiness or affairs of the Group since the date of this Registration Document or that the information containedherein is correct as of any time subsequent to its date.
This Registration Document speaks as of its date and should be read in its entirety. Capitalised terms used in thisRegistration Document which are not otherwise defined have the meanings given to them inPart XI: “Definitions”.
Made.com Limited
(Incorporated under the Gibraltar Companies Act 2014 and registered in Gibraltar with registered number 113041)
This Registration Document may be combined with a securities note and summary to form a prospectus inaccordance with the Prospectus Regulation Rules. A prospectus is required before an issuer can offer transferablesecurities to the public or request the admission of transferable securities to trading on a regulated market.However, this Registration Document, where not combined with the securities note and summary to form aprospectus, does not constitute an offer or invitation to sell or issue, or a solicitation of an offer or invitation topurchase or subscribe for, any securities in the Company in any jurisdiction, nor shall this Registration Documentalone (or any part of it), or the fact of its distribution, form the basis of, or be relied upon in connection with, oract as any inducement to enter into, any contract or commitment whatsoever with respect to any offer orotherwise.
Nothing in this Registration Document constitutes an offer of securities for sale in any jurisdiction and is not forrelease, publication or distribution, in whole or in part, directly or indirectly, in or into or from the United States(including its territories or possessions, any state of the United States and the District of Columbia), Canada,Australia, Japan, Switzerland or any other jurisdiction where such distribution is unlawful, subject to certainlimited exceptions. The Ordinary Shares have not been, and will not be, registered under the US Securities Act of1933, as amended (the “Securities Act”) or the securities laws of any state of the United States and may not beoffered, sold, pledged or otherwise transferred in or into the United States absent registration under the SecuritiesAct except to qualified institutional buyers (“QIBs”) as defined in, and pursuant to, Rule 144A under theSecurities Act (“Rule 144A”) or another exemption from, or in transactions not subject to, the registrationrequirements of the Securities Act. This Registration Document may only be distributed outside the United Statesin reliance on Regulation S of the Securities Act and within the United States to QIBs in reliance on Rule 144Aof the Securities Act. Any securities referred to in this Registration Document have not been and will not beregistered under the applicable securities laws of Australia, Canada, Japan or Switzerland and, subject to certainexceptions, may not be offered or sold within Australia, Canada, Japan or Switzerland or to any national, residentor citizen of Australia, Canada, Japan or Switzerland.
The date of this Registration Document is 25 May 2021. This Registration Document speaks only as of the datehereof.
CONTENTS
PAGE
PART I RISK FACTORS.......................................................................................................... 3
PART II PRESENTATION OF FINANCIAL AND OTHER INFORMATION ...................... 21
PART III DIRECTORS, SECRETARY, REGISTERED OFFICE, LEGAL ADVISERAND AUDITORS........................................................................................................
25
PART IV INDUSTRY OVERVIEW............................................................................................ 26
PART V BUSINESS OVERVIEW............................................................................................. 31
PART VI DIRECTORS, SENIOR MANAGERS AND CORPORATE GOVERNANCE........ 50
PART VII SELECTED FINANCIAL INFORMATIION ............................................................. 60
PART VIII OPERATING AND FINANCIAL REVIEW .............................................................. 64
PART IX GROUP HISTORICAL FINANCIAL INFORMATION............................................ 85
PART X ADDITIONAL INFORMATION ................................................................................ 136
PART XI DEFINITIONS ............................................................................................................. 155
2
PART I
RISK FACTORS
The risk factors described below are not an exhaustive list or explanation of all risks relating to Made.comLimited (the “Company” and together with its subsidiaries, “we”, “us”, “our”, the “Group” or “MADE”)and should be used as guidance only. Additional risks and uncertainties relating to the Group that are notcurrently known to the Company, or that the Company currently deems immaterial, may individually orcumulatively also have a material adverse effect on the Group’s business, financial condition, results ofoperations and prospects.
RISKS ASSOCIATED WITH MADE’S BUSINESS
MADE depends on a strong brand and a positive customer experience, and unfavourable customer feedback ornegative publicity could adversely affect its brand.
Enhancing, investing in and maintaining the Made.com brand is fundamental to MADE’s efforts to attract,maintain and expand the MADE customer base. Brand identity is a critical factor in retaining existingcustomers and attracting new customers. MADE has expended and will continue to expend time andresources on marketing and customer relations, but its marketing efforts and other promotional activities maynot achieve the desired results of increasing the number of new customers. If MADE is unable to maintainor enhance consumer awareness of the brand and generate demand in a cost-effective manner, this wouldnegatively impact its ability to compete and could have a material adverse effect on MADE’s business,financial condition, results of operations and prospects.
Promotion and enhancement of the Made.com brand depends on MADE’s ability to provide a positivecustomer experience. Any failure to offer high quality products across a range of different designs and pricepoints, reasonable lead times, excellent customer service or efficient and reliable delivery, or any substantialproduct recall or product liability claim, could damage MADE’s reputation and brand and result in the lossof customer confidence and a reduction in purchases. If its brand is damaged, MADE may also facedifficulty retaining and recruiting designers, which could negatively impact MADE’s product offerings andsales.
A significant portion of MADE’s customers’ experience depends on third parties that are outside of itscontrol, including third party vendors, manufacturers, logistics providers and various social media providers,distributors and influencers. If these third parties do not meet MADE’s or its customers’ expectations, itsbrand may suffer irreparable damage. For example, delays in the delivery of MADE’s products to customersas a result of global freight disruptions, as experienced in relation to the COVID-19 pandemic and the SuezCanal blockage in March 2021, could negatively affect MADE’s customers experience and affect theirperception of the Made.com brand.
Customer complaints or negative publicity about MADE’s website, products, product delivery times,customer support, customer data handling or security practices, especially on blogs, online ratings, reviewservices and social media platforms could rapidly and severely diminish the use of its website and currentand potential customers’ confidence in MADE, which could result in harm to its brand and its business.Further, MADE believes that a large part of the growth in its customer base to date has originated fromsocial media and affiliate marketing. If MADE is not able to develop and maintain positive relationshipswith its social media or affiliate marketing partners, or if it or such partners are targets of negative publicity,including in connection with reactions to social or political events, its ability to leverage social media oraffiliate marketing platforms to drive customers to its website may be adversely affected, which would havea material adverse effect on MADE’s business, financial condition, results of operations and prospects.
MADE may not be able to anticipate, identify and respond quickly to new and changing design trends andshifting customer preferences.
The furniture and homeware market is largely driven by design trends and customer preferences, which canshift quickly. MADE’s continued success depends on its ability to anticipate, gauge and react in a timelyand cost-effective manner to the latest design trends, changes in customer preferences for its products,customer attitudes towards different brands and designs, as well as where and how customers shop for theseproducts. MADE must continually work to design, produce and market new and highly curated products andmaintain and enhance the recognition of its brand and develop its approach as to how and where it marketsand sells its products. As MADE is reliant on its in-house and external designers for the development ofnew products, it must attract and retain designers and motivate them to meet its demand for high-quality
3

and innovative designs. MADE must also provide its customers with good service throughout their shoppingexperience and keep up-to-date with current technology trends, including the proliferation of mobile usageand evolving creative user interfaces, which may increase its costs and may not yield higher sales or morecustomers. MADE’s inability to attract, motivate and retain innovative and creative designers and anticipate,gauge and react efficiently to changes in customer preferences and trends, especially with respect to itsmillennial customers, who form the largest cohort of MADE’s customer base, could have a material adverseeffect on MADE’s business, financial condition, results of operations and prospects.
MADE is exposed to consequences of periods of long lead times, including reduced conversion rates anddeclines in average order value (“AOV”).
MADE has experienced, and may continue to experience, temporary supply chain disruptions, resulting inmaterial extensions to the typical lead times offered to customers. Extended lead times could negativelyimpact conversion rates as customers tend to be less inclined to make orders when lead times are long, andresult in an increased interval between timing of a sale to recognition of revenue, during which periodcustomers can cancel their orders. In addition, longer lead times result in a reduction in units per order andAOV as customers tend to be less inclined to add products to their basket when time to delivery isextended. Supply chain disruptions can occur as a result of various factors, including global economic andpolitical conditions. For example, MADE has been experiencing longer lead times in the delivery of itsproducts to customers in connection with the COVID-19 pandemic. In the first half of 2020, outbreaks ofthe COVID-19 pandemic in Asia affected MADE’s suppliers in the region and consequently impactedproduction cycles, leading to production delays and a consequential increase in lead times. Customer leadtimes were further extended by global freight disruptions in the second half of 2020, resulting in part fromthe COVID-19 pandemic, and also by the blockage of the Suez Canal in March 2021, which led to severalvessels containing MADE’s products being held up behind the stranded vessel for approximately one week,affecting a number of MADE’s customer orders. One of MADE’s strategic priorities is to reduce lead times.There is no assurance that MADE will be successful in achieving this, particularly if supply chaindisruptions continue, either in connection with the COVID-19 pandemic or otherwise. An extended period oflong lead times, or repeated periods of delay, could have a material adverse effect on MADE’s customersatisfaction and brand image and lead to an increase in order cancellation rates, which in turn could have amaterial adverse effect on MADE’s business, reputation, financial condition, results of operations andprospects.
MADE’s failure to retain existing customers or maintain customer spending levels may impair its gross sales.
A significant portion of MADE’s gross sales are generated from sales to existing customers, particularlythose existing customers who are highly engaged and make frequent and/or large purchases of the productsMADE offers. If existing customers no longer find MADE’s offering appealing (including as a result of longlead times), or if MADE is unable to update its offering to meet current trends and customer demands in atimely manner, its existing customers may not make, or may make fewer or smaller purchases in the future.A decrease in the number of MADE’s existing customers who make repeat orders or a decrease in theiraverage spending on MADE’s products could negatively impact its results of operations.
Further, MADE believes that its future success will depend in part on its ability to convert new customersinto retained customers with repeat orders and increase sales to its existing customers over time, and if it isunable to do so, its business may suffer. Failure to generate repeat orders or maintain high levels ofcustomer engagement and average spend, could have a material adverse effect on MADE’s business,financial condition, results of operations and prospects.
MADE depends on the success of its marketing efforts. If it fails to acquire new customers through itsmarketing efforts in a cost-effective manner, it may not be able to increase sales or deliver profitability.
Acquiring customers in a cost-effective manner is important to MADE’s success. In order to expand itscustomer base, MADE must appeal to and acquire customers who have historically used other means ofshopping for furniture and homeware products and may prefer alternatives to MADE’s offering, such astraditional bricks and mortar retailers and the websites of MADE’s competitors. MADE makes significantinvestments related to customer acquisition and expects to continue to spend significant amounts to acquireadditional customers. For example, part of MADE’s strategy is to increase its brand awareness and toaccelerate acquisition of new customers in France and Germany, by adopting strategies broadly similar tothose that have been adopted in the United Kingdom (such as increased media investment, extending brandadvocacy activity and supporting with performance marketing as required). MADE has accordingly made,and intends to make further, marketing investments in these markets. Such investments in acquiring
4

customers may not succeed, or the costs involved may outweigh the benefits. For example, the marketingand advertising strategies used by MADE in connection with such investments may be subject to differentregulatory standards in different jurisdictions, further increasing MADE’s costs associated with customeracquisition in these markets. MADE has previously had to make certain changes to the local languageversions of its website to accommodate different regulatory requirements with respect to customer reviewsand has had to adapt its marketing strategy in relation to promotional sales in different jurisdictions tosatisfy local regulatory requirements. Failure to carry out these marketing investments in a cost-effectivemanner could have a material adverse effect on MADE’s business, financial condition, results of operationsand prospects.
Further, as part of its marketing strategy, MADE uses third party social media platforms as marketing tools.For example, MADE currently maintains Instagram, Facebook, Twitter, Pinterest and YouTube accounts. Asexisting e-commerce and social media platforms continue to rapidly evolve and new platforms develop,MADE must continue to maintain a presence on these platforms and establish a presence on new oremerging popular social media platforms. If it is unable to use some of its social media platforms asmarketing tools in a cost effective manner, its ability to attract new customers may suffer and its financialcondition may be negatively impacted. Furthermore, as laws and regulations rapidly evolve to govern theuse of these platforms, the failure by MADE or its employees to abide by applicable laws and regulationsin the use of these platforms or otherwise could subject it to regulatory investigations, lawsuits, liability,fines or other penalties and have a material adverse effect on its business, financial condition, results ofoperations and prospects.
MADE is also subject to certain risks due to its reliance on digital channels in its advertising efforts. Digitalchannels change their algorithms periodically, and MADE’s rankings in organic searches and visibility insocial media feeds could be adversely affected by those changes. Search engine companies, such as Googleand Bing, may also determine that MADE is not in compliance with their guidelines and penalise it in theiralgorithms. If digital platforms change or penalise MADE with their algorithms, terms of service, displayand featuring of search results, or if competition increases for advertisements, it may be unable to attractcustomers in a cost effective manner. In general, MADE’s relationships with digital platforms are notcovered by long-term contractual agreements and do not require any specific performance commitments. Inaddition, many of the platforms and agencies with whom MADE has advertising arrangements provideadvertising services to other companies, including retailers with whom MADE competes. As competition foronline advertising has increased, the cost for some of these services has also increased. MADE’s failure topromote awareness in its brand, drive customer engagement or attract new customers, or the inability tomanage marketing expenses in a cost-effective manner, could have a material adverse effect on MADE’sbusiness, financial condition, results of operations and prospects.
MADE relies on email and other messaging services in its marketing efforts, and restrictions on sending emailsor messages, or delays in their delivery, could adversely affect its business.
MADE depends upon email and other messaging services to promote its website and products. It circulatesemails and alerts to inform customers of products available for purchase on its website and promotions/salesand believes that these emails help generate a substantial portion of its revenue. If MADE is unable todeliver emails or other messages to its customers, if such messages are delayed, or if customers decline toreceive them or open them, its revenue and profitability could be adversely affected. Changes in howwebmail apps organise, filter and prioritise email could reduce the number of customers opening MADE’smarketing emails. Actions by third parties to block, impose restrictions on or charge for the delivery ofemails or other messages could impair its ability to communicate with its customers using emails or othermessages. Additionally, there could be legal or regulatory changes limiting MADE’s right to send suchmessages or imposing additional requirements on MADE, such as requirements and limitations on the use of“cookies” and similar tracking technologies used for behavioural marketing and other tracking and analyticspurposes. MADE’s use of email and other messaging services could also result in legal claims against it,which could increase its expenses and potentially expose it to additional liability.
In addition, European and international governmental authorities continue to evaluate the data protection andprivacy implications in the use of “cookies” and similar tracking technologies, especially where these areused for behavioural marketing and other tracking and analytics purposes. Regulations governing the use ofcookies, in particular for online tracking and marketing practices, or a loss in the ability to make effectiveuse of services that employ such technologies, could limit MADE’s ability to track trends, optimise itsproduct offering or acquire new customers on cost-effective terms and consequently could adversely affectits business, financial condition and results of operations.
5

MADE also relies on social networking and messaging services to communicate with its customers. Changesto the terms and conditions of these services could limit its promotional capabilities, and there could be adecline in the use of such social networking services by customers and potential customers. In addition,MADE relies on a third party service provider to deliver emails and delays or errors in the delivery of suchemails or other messaging could occur and are largely beyond its control. The realisation of any such risks,alone or in combination, could damage MADE’s reputation and have a material adverse effect on itsbusiness, financial condition, results of operations and prospects.
MADE may face product returns, product recalls and product liability claims.
MADE is subject to standard UK, EU and national regulations and legislation regarding distance selling,including sale of goods and consumer rights regulations and legislation. For example, online sales toconsumers in the United Kingdom are subject to the UK Consumer Contracts (Information, Cancellation andAdditional Charges) Regulations 2013. In general, this gives consumers the right to return products for anyreason within a period of 14 days after the date on which goods are delivered. In response to the COVID-19 pandemic, MADE extended its returns period to 30 days, which it currently intends to maintain post theCOVID-19 pandemic. In addition, MADE is required to include standard terms of warranties for its productspursuant to applicable regulations and guidelines. The exercise by consumers of their rights under theseregulations and MADE’s return policy could cause MADE to have unanticipated returns, resulting in anincrease in inventory, which may include damaged goods. In addition, MADE may be required to refund,repair, replace and/or pay compensation for any furniture or homeware products that do not meet theexpress terms of the contract for sale, the implied terms of satisfactory quality, fitness for purpose orcorrespondence with description or any mandatory warranties to customers, including those regarding hiddendefects. While the customer may have similar rights against the manufacturer of the furniture or homewareitem, these rights are in addition to the rights that the customer has against MADE as the seller. If claimsare made against MADE by customers, it may not be able to recover the costs of such claims from themanufacturer, particularly if the manufacturer has entered into administration or becomes insolvent.
Further, the sale of furniture and homewares involves the risk of injury to MADE’s customers or otherpersons and damage to property, as well as costs of replacement. The actual or alleged sale of defectiveproducts by MADE could result in product recalls or product liability claims, the settlement or outcome ofwhich could have a material adverse effect on its reputation, business, financial condition, results ofoperations and prospects. Although MADE insures itself against such claims to a level and at a cost itdeems appropriate, its insurance policies are subject to exclusions and limitations, and it cannot guaranteethat all claims will be fully or adequately covered.
Even if an event causing a product recall proves to be unfounded or if a product liability claim againstMADE is unsuccessful or is not fully pursued, the negative publicity surrounding any assertion that theproducts sold by it caused injury or damage, or any product recall or allegation that the products sold byMADE were defective, could adversely affect both its reputation with existing and potential new customersand its corporate and brand image, which in turn could have a material adverse effect on MADE’s business,financial condition, results of operations and prospects.
MADE relies on third party suppliers for its products, especially those that are foreign-sourced.
MADE purchases products from over 200 suppliers including from factories in China, India, Vietnam, theUK and Continental Europe. Consequently, MADE faces a variety of risks generally associated with doingbusiness in foreign markets and importing products from these regions. These risks and uncertaintiesinclude, amongst other, political instability resulting in the disruption of trade, delays associated withcustoms procedures, including increased security requirements applicable to foreign goods, imposition oftaxes, other charges and restrictions on imports, increased transportation costs, war, fear of war or acts ofterrorism, economic uncertainties including inflation, recession and currency and interest rate fluctuations andchanges in regulation and governmental policies and the consistency with which such regulations andpolicies are interpreted or enforced. In the event of any of such risks materialising, MADE may incursubstantial costs and experience substantial disruption and delay in switching to a different third partysupplier or moving production of its products to another region.
In addition to the wider political and economic risks, MADE faces risks that its foreign third party suppliersmay not adhere to MADE’s quality control standards and it may not be able to identify deficiencies beforethe merchandise is delivered to its customers. Quality control problems could result in regulatory action,such as restrictions on importation, products of inferior quality or product stock outages or shortages, whichcould harm MADE’s sales and create inventory write-downs for unusable products. There is also a risk thatone or more of its foreign suppliers may not adhere to fair labour standards or may engage in child labour
6

practices. Any of these risks, in isolation or in combination, could harm MADE’s brand or result in delaysin completing, or failure to complete, customers’ orders or transferring supply contracts to other suppliers inother jurisdictions in order to complete customers’ orders or cancellation of customers’ orders or productreturns. This could in turn have a material adverse effect on MADE’s brand, reputation, business, financialcondition, results of operations and prospects.
The inability of MADE’s suppliers to meet product demand could have a material adverse effect on its business.
As a growth business, MADE has been experiencing an increase in demand for its products, which hastranslated into an increase in demand with respect to its suppliers. MADE generally does not have long-termarrangements with its suppliers to guarantee availability of products, components or services, as it typicallyplaces orders for products, and its suppliers typically agree to manufacture products, pursuant to individualpurchase orders and invoices, which could lead to MADE’s inability to secure products to meet customerdemand. In addition, MADE’s suppliers are subject to certain risks, including availability of raw materials,legal disputes, labour shortages, union activity, inclement weather, natural disasters and general economicand political conditions that might limit their ability to provide MADE with quality merchandise on a timelybasis. If MADE’s current suppliers were to stop delivering products, components or services to it onacceptable terms, or delay deliveries, it may be unable to procure alternatives from other suppliers in atimely and efficient manner and on acceptable terms, or at all, which could have a material adverse impacton MADE’s volume or timing of transactions with such third party suppliers and on its sales to customers.
In addition, as a consequence of the COVID-19 pandemic, MADE has been experiencing longer lead timesin connection with the delivery of its products to customers as a result of supply chain disruptions(principally from suppliers in Asia). There is no assurance that such disruptions will not continue, either inconnection with the COVID-19 pandemic or otherwise. The failure of one or more of MADE’s suppliers tomeet this increased demand and supply products to it on a timely basis, or at all, or at the prices it expects,may have a material adverse effect on its business, financial condition, results of operations and prospects.
MADE relies on third party freight service providers and disruptions to freight can adversely affect MADE.
MADE relies on third parties with respect to freight services in relation to its products and is dependent onthe continued efficient operation of such services. MADE cannot control all of the various factors that mightaffect the timely and effective shipment of products from its suppliers. All products that MADE purchasesoverseas must be shipped to one of its warehouses by third party freight service providers. MADE’sdependence on imports shipped by third party freight service providers exposes it to various risks, such as,damage, destruction or confiscation of products in transit to the warehouse, work stoppages (including as aresult of strikes), transportation and other delays in shipments (including as a result of inspection processesor other port-of-entry limitations or restrictions in the United Kingdom or Belgium as MADE’s main ports-of-entry) and lack of freight availability and freight cost increases, including as a result of events such asBrexit, the COVID-19 pandemic and the Suez Canal blockage.
If MADE is unable to obtain sufficient freight capacity on a timely basis or at expected shipping rates, itmay not be able to ensure that it receives products from its suppliers in a timely manner, which couldimpact its lead times and have a material adverse effect on MADE’s customer satisfaction and lead to anincrease in order cancellation rates, as MADE’s customers can cancel an order at any point prior todispatch. For example, as a result of the COVID-19 pandemic, which has led to market-wide reducedfreight capacity, MADE has been experiencing delays in freight shipping and higher freight costs, which hasadversely impacted its gross margins. The impact of such disruptions was more acute in the first quarter of2021. MADE has also been subject to a greater administrative burden and port disruptions as a result ofBrexit and growing regulation and increasing customs scrutiny on imported goods, including a recent EUTimber Regulations (“EUTR”) audit, driven by an EU-wide initiative. In connection with such EUTR audit,MADE has experienced a delay in the release of certain of its containers (from around October 2020 toNovember/December 2020, when the majority of its containers subject to the audit began to be cleared) andhas had to comply with further diligence requests from Belgian regulators, with respect to its foreignsuppliers of timber products, leading to a delay in the delivery of some products to customers. WhileMADE’s containers have been released, there is no guarantee that similar audits and inspections might notresult in future delays. MADE has also experienced a delay in the delivery of some products as a result ofthe blockage of the Suez Canal in March 2021, as vessels containing MADE products were held up behindthe stranded vessel for approximately one week, affecting a number of MADE’s customer orders. Thecontinued impact, worsening or repeat of such events and factors could have a material adverse effect onMADE’s business, financial condition, results of operations and prospects.
7

MADE’s business is dependent on the continued efficient operation of several warehouses.
MADE predominantly relies on third party service providers for storage and warehouse management of itsproducts (other than in relation to furniture items in the UK, which are managed from a logistics centreoperated by MADE), and accordingly is reliant on the continued efficiency of such third party serviceproviders. The inability of MADE or MADE’s third party service providers to manage their operationsefficiently could have a material adverse effect on MADE’s processes and operations. In addition, there is arisk that MADE’s third party providers may not be able to scale their operations in line with MADE’sgrowing business and its increased demand for storage and warehouse facilities. Such inability to scale couldlimit MADE’s operations and in turn have a material adverse effect on its business, financial condition,results of operations and prospects.
MADE, and its third party service providers, are also exposed to risks due to external factors beyond theircontrol, including, but not limited to, accidents, vandalism, natural hazards, acts of terrorism, damage andloss caused by fire, power failures, floods or other events that could potentially lead to the interruption ofbusiness operations, personal injuries, damage to third party property or the environment. For example,MADE’s logistics centre activities are subject to specific risks such as fire, falls from height, objects fallingfrom storage shelving and during movement, or traffic movements which could result in damage toequipment, damage to the property of third parties and personal injury or death. Accidents or other incidentsthat occur at MADE’s logistics centres or other facilities or involve its personnel or operations, could resultin claims for damages against it and could damage its reputation. Although MADE insures itself againstsuch losses to a level and at a cost it deems appropriate, its insurance policies are subject to exclusions andlimitations, and it cannot guarantee that all material events of damage or loss will be fully or adequatelycovered by an applicable insurance policy. In addition, MADE’s insurance providers could become insolvent.
Damage resulting from any of these events may cause significant disruption to MADE’s, or its third partyservice provider’s, operations and take considerable time to repair. Moreover, the complete destruction of awarehouse through a single catastrophic event, such as a fire, may increase lead times for products stored atthe warehouses, affecting the efficiency of MADE’s operations. The direct effect of any such event andprolonged period before rectification could have a material adverse effect on MADE’s business, financialcondition, results of operations and prospects.
MADE relies on third party carriers to make deliveries to its customers.
Third party carriers, including two-man carriers with respect to furniture items and parcel carriers withrespect to homeware items, make all of MADE’s deliveries to its customers and there is a risk that theymay cease making deliveries for MADE at any time. In addition, the quotes for the delivery companies arerefreshed periodically. If MADE was to lose a significant number of its third party carriers due to adisagreement on a price increase or any other reason, and was unable to recruit a sufficient number ofqualified replacement delivery teams in a timely manner, its ability to make deliveries would be materiallyadversely affected.
MADE is also subject to the risks associated with the ability of its carriers to provide prompt deliveryservices. The efficiency of delivery to the ultimate customer is exposed to factors such as traffic congestion,road works, inclement weather (particularly flooding or snow), power loss, earthquakes, labour disputes, actsof war or terrorism and travel and other restrictions, including as a result of events such as the COVID-19pandemic, all of which could render deliveries difficult or impossible. Any significant interruption toMADE’s delivery of products may have a material adverse effect on its reputation, business, financialcondition, results of operations and prospects.
MADE may face labour disputes and work stoppages in relation to its workforce.
MADE’s operations may be adversely affected by labour disputes and work stoppages in relation to itsworkforce. For example, MADE has a collective bargaining agreement and a works-council in place inFrance, which give employee representatives the right to be consulted on various employee-related matters.There is a risk that MADE may face employee-related disagreements, which may result in extended workstoppages or prolonged labour disputes. Any extended work stoppage or labour dispute within MADE couldadversely affect its ability to continue its operations, which could have a material adverse effect on itsbusiness, financial condition, results of operations and prospects.
8

MADE’s sourcing and logistics costs are subject to movements in the prices for raw materials and fuel as wellas other factors beyond its control, and it may not be able to pass on price increases to its customers.
MADE’s sourcing and logistics costs depend on the development of prices for certain raw materials as wellas fuel. In addition, its sourcing costs are also influenced by the capacity utilisation rates at its suppliers,quantities demanded from its suppliers and product specification. As a result, MADE’s costs of materials canvary materially in the short-term and, in cases of supply shortages, can increase significantly. MADE istypically impacted by raw material, fuel price and carrier charge increases as its suppliers and third partyservice providers attempt to pass along these increases to it. Although it may attempt to pass on costincreases to its customers with higher selling prices via regular price reviews, it may not always be able todo so. Additionally, any price increases could adversely affect MADE’s sales. The volatility in MADE’ssourcing and logistics costs and its limited ability to pass them on to customers may adversely affect itsbusiness, financial condition, results of operations and prospects.
Customer growth and activity on mobile devices depend on the effective use of mobile operating systems,networks and standards that MADE does not control.
Purchases using mobile devices by customers generally, and by MADE’s customers specifically, haveincreased significantly, and MADE expects this trend to continue. To optimise the mobile shoppingexperience, MADE is dependent on its customers downloading its specific mobile application for theirparticular device or accessing its website from an internet browser on their mobile device. As new mobiledevices and operating systems are released, it is difficult to predict challenges MADE may encounter indeveloping applications for these alternative devices and operating systems, and it may need to devotesignificant resources to the creation, support and maintenance of such applications. In addition, MADE’sfuture growth and its results of operations could suffer if it experiences difficulties in the future inintegrating its mobile application into mobile devices, if problems arise with MADE’s relationships withproviders of mobile operating systems or mobile application stores, such as those of the Apple App Store orGoogle Play, if its application receives unfavourable treatment compared to competing applications, such asthe order of its products within application stores, or if it faces increased costs to distribute or havecustomers use its mobile application. MADE is further dependent on the interoperability of its website withpopular mobile operating systems that it does not control, such as iOS and Android, and any changes insuch systems that degrades the functionality of its website or gives preferential treatment to competitiveproducts could adversely affect the usage of its website on mobile devices. In the event that it is moredifficult for MADE’s customers to access and use its website on their mobile devices, or if its customerschoose not to access or use its website on their mobile devices or choose to use mobile products that donot offer access to its website, its customer growth could be harmed and its business, financial condition,results of operations and prospects may be materially and adversely affected.
Further, MADE continually upgrades existing technologies and business applications, and it may be requiredto implement new technologies or business applications in the future. The implementation of upgrades andchanges requires significant investments. MADE’s results of operations may be affected by the timing,effectiveness and costs associated with the successful implementation of any upgrades or changes to itssystems and infrastructure.
MADE is exposed to risks in relation to an actual or perceived decline in its creditworthiness.
If MADE’s creditworthiness declines, or is perceived by its supplies or other counterparties to decline,MADE may be unable to secure favourable payment or other contractual terms, which could have a materialadverse effect on its business. For example, MADE has in the past been asked by certain suppliers andother counterparties to provide letters of credit/guarantee from other members of the MADE group, toaddress concerns such counterparties have had regarding the creditworthiness of MADE as a growthbusiness. MADE’s reputation and the consequential informal supplier ‘credit rating’ may be affected byvarious factors including the general economic environment, its financial performance and ability to sustaingrowth as well as its overall brand reputation. If there is a significant decrease in MADE’s ability to fulfillits payment obligations, its suppliers may choose to reduce their credit exposure to it, including by seekingto change their payment terms, for example by decreasing payment periods, or refusing to contract withMADE. Any such actions could have a material adverse effect on MADE’s product offering and thus onsales, which in turn could have a material adverse effect on its business, financial condition, results ofoperations and prospects.
9
MADE’s recent growth rates may not be sustainable or indicative of its future growth, profitability and cashflow.
MADE’s historical gross sales, net revenue, profitability and cash flow may not be indicative of its futureperformance. MADE may not be successful in executing its growth strategy, and even if it achieves itsstrategic plan, it may not be able to achieve or sustain profitability. In future periods, MADE’s gross salesand net revenue could decline or grow more slowly than it expects. MADE believes that its continuedgrowth will depend upon, among other factors, its ability to acquire new customers and retain existingcustomers, maintain or grow its relationships with third party designers, product suppliers, logistics providersor other third party providers, retain and/or hire new employees, maintain or grow its margins, develop newfeatures to enhance the customer experience on its website, increase the frequency with which new andexisting customers purchase products on its website through merchandising, data analytics and technology,decrease its lead times, invest in its online infrastructure to enhance and scale the systems its customers useto interact with its website, access new complementary product categories and expand internationally.
In addition, MADE’s continued growth depends on whether the online furniture and homeware marketcontinues to shift online and grow at historic rates, especially as stay-at-home orders in relation to theCOVID-19 pandemic are relaxed, people return to work and bricks and mortar furniture and homewarestores re-open. Further, MADE’s continued growth may be impacted by declines in discretionary income andspending levels as income that may have accumulated during the lock-down periods begins to reduce andcustomers who made purchases during those periods may become less inclined to make further purchases orincrease the spending of their discretionary income on entertainment and travel and away from discretionarygoods like new furniture and homeware.
It is not certain that MADE will be able to achieve any of the foregoing. MADE’s customer base may notcontinue to grow or may decline as a result of increased competition and the maturation of its business.Failure to sustain its growth could have a material adverse effect on its business, financial condition, resultsof operations and prospects.
Additionally, costs may increase in future periods due to, among other things, inflation, regulatoryrequirements, competitive pressures, commodity price increases and increased labour costs, which couldnegatively affect its future results of operations and ability to sustain profitability. MADE expects tocontinue to expend substantial financial and other resources, in connection with its growth strategy, onacquiring and retaining customers, its technology infrastructure and the development of new features, salesand marketing and international expansion. These investments may not result in increased gross sales and sonet revenue. If MADE cannot successfully generate revenue at a rate that exceeds the costs associated withits business, it may not be able to achieve or sustain profitability or generate positive cash flow on asustained basis. If MADE fails to continue to increase its revenue and grow its overall business, results ofoperations and prospects could be adversely affected.
Inability to forecast business accurately could prevent MADE from properly planning expenses and processcapacity.
MADE bases its current and future expense levels on its operating forecasts and estimates of futurerevenues, gross margins and bottom-up estimates of functional cost changes. Revenue and results ofoperations are difficult to forecast because the purchasing behaviour of MADE’s existing customers, as wellas its success in acquiring new customers, may vary and is subject to global economic conditions andrestrictions, such as those resulting from the COVID-19 pandemic, and general customer preferences.
In addition, MADE’s historical growth rates, trends and other key performance metrics may not bemeaningful predictors of future growth. MADE’s business is affected by general economic and businessconditions in the markets in which it operates. Any failure to accurately predict sales could have a materialadverse effect on its business, financial condition and prospects.
MADE’s future results may differ materially from what is expressed or implied by the medium-term ambitionsincluded in this Registration Document and investors should not place undue reliance on this information.
The medium-term ambitions set forth in this Registration Document represent MADE’s current ambitions forthe medium term. The actual results of the Group may differ materially from what is expressed or impliedby these medium-term ambitions which may not be achievable in the anticipated timeframe or at all. Thesemedium-term ambitions are based upon a number of assumptions and estimates, which are subject tosignificant business, operational, economic and other risks, many of which are outside of MADE’s control.Accordingly, such assumptions may prove to be incorrect. In addition, unanticipated events may materiallyadversely affect the actual results that MADE achieves in future periods whether or not MADE’s
10

assumptions were reasonable as of the date such assumptions were made. For example, MADE cannotassure that any estimates, ambitions, targets, forward looking statements or opinions contained herein orwhich may have been expressed in the past will remain accurate or will not abruptly change following theCOVID-19 pandemic, including any relaxation of lockdown and social-distancing measures that have beenimposed in connection with the COVID-19 pandemic. The Group’s actual results may vary materially fromthese ambitions and investors should not place undue reliance on them.
MADE may face unexpected increases in operating and other expenses, which may reduce its profitability.
MADE’s operating and other expenses could increase without a corresponding increase in revenue, whichwould have a material adverse effect on MADE’s business, financial condition, results of operations andprospects. Factors that could increase operating and other expenses include, amongst other, payroll expenses(for example, due to increases in the minimum wage or National Insurance contributions), costs associatedwith MADE’s third party freight, warehousing or delivery service providers (for example, due to the effectsof the COVID-19 pandemic), marketing costs, rental costs under property leases, increases in taxes or otherstatutory charges (for example, business rates in the United Kingdom or introduction of new e-commercerelated taxes), costs of products from MADE’s suppliers due to input cost inflation and exchange ratepressures resulting in higher manufacturers’ prices which it cannot fully pass on to customers, or to anydeterioration in the relationships with its suppliers, costs associated with compliance with regulations andmaintaining the right sustainability credentials and increases in insurance premiums. To the extent that suchincreases in operating and other expenses exceed or are not in line with increases in MADE’s revenue,profitability will be reduced and any such reduction could have a material adverse effect on its business,financial condition, results of operations and prospects.
MADE might elect to pursue new business opportunities, offer new products or expand to new geographicmarkets, which could prove to be non-cost-effective or otherwise unsuccessful.
If MADE chooses to expand its offering to include other types of products, develop any new businesses,expand its marketplace (including, for example, the expansion of its homewares platform to offer selectedthird party homeware brands) or enter into joint ventures and strategic partnerships which it believes wouldbe compatible with, adjacent to, or complementary to its existing business, there can be no guarantee thatany such endeavour will succeed. Any such initiative that is not favourably received by consumers orsuppliers could damage MADE’s reputation and brand, and any expansion or alteration of its operationscould require significant additional expenses and divert management and other resources, which could inturn negatively affect its results of operations. In addition, if MADE was to expand into new geographicmarkets and needed to develop a new brand for this purpose, or if it was to try to reposition its brand inexisting geographic markets, consumers might not accept its revised brand image. If MADE launches butfails to generate satisfactory returns from any such initiative, it could have a material adverse effect on itsbusiness, financial condition, results of operations and prospects.
The loss of senior management or key employees could adversely affect MADE’s business.
MADE’s success in the furniture and homeware industry, including its ability to anticipate and effectivelyrespond to changing industry trends, is dependent on its ability to attract and retain qualified personnel,including, but not limited to, its executive team, particularly its chief executive officer, chief financial officer,chief operating officer and chief technology officer. Competition for qualified personnel, includingtechnology, product design, sourcing and merchandising and marketing and creative personnel, is strong, andMADE cannot be sure that it will be able to attract and retain a sufficient number of qualified personnel inthe future, or that the costs of doing so will not adversely affect its results of operations. Any loss ofqualified personnel, high employee turnover or persistent difficulties in filling job vacancies with suitableapplicants could have a material adverse effect on its ability to compete effectively in its business andconsiderable expertise could be lost by it or access thereto gained by its competitors. Furthermore, if MADEis unable to retain, attract and motivate talented employees with the appropriate skills at cost-effectivecompensation levels, if changes to its business adversely affect morale or retention or if it is unable tomaintain its collaborative and entrepreneurial culture, its business, financial condition, results of operationsand prospects may be adversely affected.
MADE may not be able to protect its intellectual property rights adequately or may be accused of infringingintellectual property rights of others.
MADE relies on unregistered and registered trademarks, design rights, copyrights, domain names andconfidentiality and on licence agreements with its employees, developers, designers and others, to ensureaccess to, capture, protect and enforce its proprietary rights. These means of protecting its intellectual
11

property might not be effective, and MADE is aware that there are instances where it appears that its brandor designs are being imitated, copied or adapted by competitors. Poor quality imitations or the freeavailability of imitations may impair or dilute its brand and/or the goodwill in its brand. Effectiveintellectual property protection, including the registration of trademarks, designs and domain names, may notbe available in every country in which MADE’s products are manufactured, sold, marketed, imported ormade available. MADE may be unable to prevent third parties from using or acquiring intellectual propertyincluding trademarks, design rights, copyrights and domain names that are similar to, infringe upon, ordiminish the value of its trademarks, designs, copyrights, domain names and other proprietary rights.
Further, MADE might not be able to discover or determine the extent of any unauthorised use of itsproprietary rights. The protection of MADE’s intellectual property may require the expenditure of significantfinancial and managerial resources. Moreover, the steps MADE takes to protect its intellectual propertymight not be adequate to ensure that its rights are protected or maintained or to prevent third parties frominfringing or misappropriating its proprietary rights. It also cannot be certain that others will notindependently develop, or otherwise acquire, equivalent or superior designs, websites or other intellectualproperty rights. Where MADE makes applications to register intellectual rights, there is no certainty that allof these applications will proceed to registration. In particular, MADE may be unable to achieve registrationor other protection of certain of its intellectual rights in new countries that it may decide to enter in thefuture, due to the prior use by or earlier registration by other parties of the same or similar rights. Equally,MADE may lose its current rights to invalidity or revocation actions in the future. MADE’s currentapplications to register intellectual property are in some cases the subject of oppositions from third partiesand MADE may from time to time be involved in communications with intellectual property registriesregarding the protectability and registrability of certain of its intellectual property in certain jurisdictions,including its main brand.
Other parties may also claim that MADE infringes their proprietary rights (including with respect to thirdparty proprietary and open source software, that MADE relies on). MADE has been subject to, and expectsto continue to be subject to, claims and legal proceedings regarding alleged infringement by it of theintellectual property rights of third parties. Such claims, whether or not meritorious, may result in theexpenditure of significant financial and managerial resources, injunctions against it, or the payment ofdamages. MADE may need to obtain licences from third parties who allege that it has infringed their rights,but such licences may not be available on terms acceptable to it, or at all.
Furthermore, MADE currently is the registrant of the internet domain name for its website, as well asvarious related domain names. However, it has not registered its domain names in all major internationaljurisdictions. Domain names generally are regulated by internet regulatory bodies. As MADE’s businessgrows, it may incur material costs in connection with the registration, maintenance and protection of itsdomain names. In addition, the regulations governing domain names and laws protecting marks and similarproprietary rights could change in ways that block or interfere with its ability to use relevant domains or itscurrent brand. Also, MADE might not be able to prevent third parties from registering, using or retainingdomain names that interfere with its customer communications or infringe or otherwise decrease the value ofits marks, domain names and other proprietary rights. Regulatory bodies may also establish additionalgeneric or country-code top-level domains or may allow modifications of the requirements for registering,holding or using domain names. As a result, MADE might not be able to register, use or maintain thedomain names that use the name Made.com in all of the countries and territories in which it currentlyconducts or intends to conduct business.
It is difficult for MADE to monitor unauthorised uses of its intellectual property, and if MADE becomesaware of a third party’s unauthorised use or misappropriation of its intellectual property, it may not bepracticable, effective or cost-efficient for MADE to enforce its intellectual property and contractual rightsfully. In order to protect or enforce its intellectual property rights, MADE may be required to spendsignificant resources. Regardless of the merits of any such claim as a claimant or defendant, litigation couldbe costly, time consuming, distracting and MADE may not prevail, which could result in the impairment orloss of its intellectual property rights. To the extent claims against MADE are successful, MADE may haveto pay substantial monetary damages or discontinue or modify certain products that are found to be inviolation of another party’s rights. MADE may have to seek a license to continue offering its products,which may not be available on reasonable terms, or at all. Any failure of MADE to secure, protect andenforce its intellectual property rights could materially adversely affect its business, financial condition,results of operations and prospects.
12

Failure to invest in and adapt to technological developments and industry trends could harm MADE’s business.
MADE relies on its IT systems to operate its business and has developed proprietary software to facilitateits business operations, data gathering analysis and online marketing capabilities and has invested significantcapital and man hours into building and updating its information technology platform and infrastructureincluding replacing legacy systems with successor systems, making changes to legacy systems or acquiringnew systems with new functionality, hiring employees with information technology expertise and buildingnew policies, procedures, training programmes and monitoring tools. These types of activities subject it toinherent costs and risks associated with replacing and changing these systems, including impairment of itsability to leverage its e-commerce channels and fulfil customer orders, potential disruption of its internalcontrol structure, substantial capital expenditures, additional administration and operating expenses,acquisition and retention of sufficiently skilled personnel to implement and operate the new systems,demands on management time, the introduction of errors or vulnerabilities and other risks and costs ofdelays or difficulties in transitioning to or integrating new systems into its current systems. Theseimplementations, modifications and upgrades may not result in productivity improvements at a level thatoutweighs the costs of implementation, or at all. Additionally, difficulties with implementing new technologysystems, delays in MADE’s timeline for planned improvements, significant system failures or its inability tosuccessfully modify its information systems to respond to changes in its business needs may causedisruptions in its business operations and have a material adverse effect on its business, financial condition,results of operations and prospects.
MADE’s IT systems are interdependent and a failure in one system may disrupt the efficiency and functioningof its operations.
MADE’s business model relies on the integration of its website, logistic sites and the order fulfilment anddelivery operations. It is, therefore, reliant on numerous systems to manage the entire process from the pointat which the customers place their order to the delivery of these goods to customers. The different ITsystems are interdependent, and a failure of any of the core IT systems may result in failures of other ITsystems, which in turn could prevent MADE from capturing customer orders on the Made.com website orprocessing customer orders.
MADE relies to a significant degree on the efficient and uninterrupted operation of its computer, mobileapplication and communications systems and those of third parties, including the internet generally, whichhave a direct impact on customer engagement and experience with the use of MADE’s website and mobileapplication and consequently, customer satisfaction. For disaster recovery purposes, the IT services areprovided from three data centres. Any internet failure generally, or any failure of existing or future computeror communication systems or software systems, could impair the value of orders, the processing and storageof data and the day-to-day management of MADE’s business.
While MADE has disaster recovery and business continuity contingency plans, it has not conducted a full-scale disaster recovery test, and if a serious disaster occurred that affected its business, systems oroperations, such plans might not be sufficient to enable it to continue or recommence trading without loss ofbusiness. Furthermore, MADE has, from time to time, experienced operational “bugs” in its systems andtechnologies, which have resulted in order errors, such as incorrect items and delays in deliveries. MADEexpects operational “bugs” to continue to occur from time to time due to a combination of one or more ofthe following: electro-mechanical equipment failures, computer server or system failures, network outages,software performance problems, human error and power failures.
MADE is subject to payment-related risks.
MADE accepts payments using a variety of methods, including credit and debit cards, PayPal, Apple Payand Klarna, which subjects it to certain regulations and the risk of fraud, and it may in the future offer newpayment options to customers that would be subject to additional regulations and risks. MADE paysinterchange and other fees in connection with credit card payments, which may increase over time andadversely affect its operating results. MADE’s third party payment arrangements are predominantly based onthe standard terms and conditions of the service provider and contain provisions which are generallyfavourable to the service provider. MADE currently relies on a single payment processor provider for asignificant portion of its payments. If this third party payment processor were to experience an interruption,delay or service unavailability, MADE may not be able to process payments on a timely basis. AlthoughMADE uses third parties to process payments, its processes must comply with payment card associationoperating rules and certification requirements, including the Payment Card Industry Data Security Standard(“PCI-DSS”) and rules governing electronic funds transfers, the EU regulation on regulatory technicalstandards for strong customer authentication and common and secure open standards of communication and
13

the EU directive on payment services in the internal market. If MADE fails to comply with applicable rulesand regulations of any payment provider, if the volume of fraud in its transactions triggers limits orterminates its rights to use any existing payment methods, or if a data breach occurs relating to its paymentsystems, it may be subject to fines or higher transaction fees and may lose its ability to accept onlinepayments.
Further, if services of MADE’s payment providers are interrupted, harmed or such payment providers aresubject to fraud or cyber security attacks, this may result in the data of its customers being compromisedand loss or theft of their personal information, as well as an inability to process their payments. In addition,MADE has in the past incurred and may in the future incur losses from various types of fraud, includingstolen credit card details, claims that a customer did not authorise a purchase, merchant fraud and customerswho have closed bank accounts or have insufficient funds in bank accounts to satisfy payments. AlthoughMADE has measures in place to detect and reduce the occurrence of fraudulent activity on its website, thosemeasures may not always be effective. In addition to the direct costs of such losses, if the fraud is relatedto credit card transactions and becomes excessive, it could potentially result in MADE paying higher fees orlosing the right to accept credit cards for payment. MADE’s failure to adequately prevent fraudulenttransactions could damage its reputation, result in litigation or regulatory action and lead to expenses thatcould substantially impact its results of operations.
The occurrence of any of these events could have a material adverse effect on MADE’s business, financialcondition, results of operations and prospects.
MADE may suffer data loss or other security breaches.
MADE is subject to a number of laws relating to privacy and data protection, including the General DataProtection Regulation (Regulation (EU) 2016/679) (“GDPR”), the United Kingdom’s Data ProtectionAct 2018 and other applicable data protection and privacy laws across its various markets. Such lawsgovern MADE’s ability to collect, use and transfer personal data, including relating to customers, employeesand others. For example, MADE collects, transmits and stores personal information provided by itscustomers, such as names, email addresses and order information. Some of its third party service providers,such as payment processing providers, also regularly have access to customer data. In addition, MADE usesthird party technology and systems for a variety of reasons, including, without limitation, encryption andauthentication technology, employee email, content delivery to customers, back-office support and otherfunctions. MADE cannot guarantee absolute protection against unauthorised attempts to access its ITsystems, including malicious third party applications that may interfere with or exploit security flaws in itsproducts and services. Viruses, worms and other malicious software programmes could, among other things,jeopardise the security of information stored in a user’s computer or in MADE’s computer systems orattempt to change the internet experience of users by interfering with its ability to connect with its users.Hackers may also act in a coordinated manner to launch denial of service attacks or other coordinatedattacks that may cause MADE’s website or other systems to experience service outages or otherinterruptions. In addition, advances in computer capabilities, new discoveries in the field of cryptography, orother events or developments might result in a compromise or breach of the processes used by MADE toprotect customer transaction data. There is a risk that such data could become public if there were a securitybreach in respect of such data and, if one were to occur, MADE could face liability under data protectionlaws and lose the goodwill of its customers, which may have a material adverse effect on its reputation,business, financial condition, results of operations or prospects.
In 2019, MADE experienced an isolated security breach through a technical infrastructure breach of one ofits third party provider’s IT systems. While MADE’s IT systems were not breached directly, potentiallymalicious code was served by the third party provider’s platform to certain of MADE’s users in onejurisdiction via its website. If further similar or other compromises to MADE’s, or its third party providers’,IT systems were to occur, or if MADE’s website or other systems were to experience service outages orother interruptions, people may become unwilling to provide MADE the information necessary to makepurchases on its website, existing customers may decrease their purchases, MADE’s reputation may beharmed and it could also face potential liability and litigation, which may not be adequately covered byinsurance, all of which could harm its business, financial condition and results of operations.
Further, the loss or corruption (or other unauthorised access or disclosure) of personal data may constitute apersonal data breach under the GDPR. In the event of such a personal data breach, MADE could berequired to notify applicable government authorities and/or potential victims and could face continuedgovernmental investigations, fines and private claims for compensation from individuals whose personal datawas involved.
14

Restrictive covenants in MADE’s credit agreements may restrict its operations, and if it does not effectivelymanage its business to comply with these covenants, its financial condition could be adversely impacted.
The various credit facilities to which MADE is a party contain covenants that restrict or limit, among otherthings, its ability to incur additional indebtedness, acquire other companies, pay dividends, create liens andother security, change its business or restrict certain subsidiaries from being trading companies, dispose ofits assets, and merge or consolidate with other entities. It therefore may not be able to engage in any of theforegoing transactions unless it obtains the consent of the respective lenders or terminates the creditfacilities. The covenants to which MADE is subject could limit its ability to finance its future operationsand capital needs in the longer term, as well as its ability to pursue business opportunities and activities thatmay be in its interest. If MADE breaches any of these covenants with respect to the credit facilities (subjectto customary grace periods and materiality thresholds) and is unable to cure the breach (to the extent thebreach is capable of being cured) or obtain a waiver from the lenders (to the extent the covenant is capableof being waived), this could give rise to an event of default under the relevant credit facility. A defaultunder the relevant credit facility would permit the relevant lender under the relevant credit facility to cancelthe available commitments under such facility and cause the amounts owed under that facility to becomedue and payable. This may also lead to an event of default and/or acceleration under other debt instrumentsthat contain cross-default or cross-acceleration provisions. In the case of acceleration, there can be noassurance that MADE’s assets would be sufficient to repay that indebtedness in full and continue to makeother payments it is obliged to make.
RISKS ASSOCIATED WITH THE INDUSTRY IN WHICH MADE OPERATES
The online home and furniture industry in the markets where MADE operates may not sustain or improveupon current levels of demand and customer acceptance in line with its expectations.
The online purchase of furniture and homewares is rapidly evolving in the geographical markets whereMADE operates. MADE relies solely on sales through its website, where customers only have access toonline product descriptions, dimensions, images and videos. Accordingly, its success will depend to asubstantial extent on the willingness of consumers in MADE’s markets to continue, and increase, their useof online services as a method of buying furniture and homewares rather than purchasing them at a bricksand mortar retailer. MADE’s success will also depend on its ability to adapt effectively to changes inconsumer behaviour or preferences in connection with online retailing; for example, developments inconnection with mobile commerce on smartphones and tablets. There is no guarantee that the markets inwhich MADE operates will continue to grow at rates experienced in the recent past, including as a result ofthe acceleration of online penetration in connection with the COVID-19 pandemic, or at all. Slower growth,stagnation or contraction in the online retail markets in which MADE operates could significantly adverselyaffect its revenue and could have a material adverse effect on its business, financial condition, results ofoperations and prospects.
MADE may fail to compete effectively with traditional bricks and mortar retailers and other online retailers offurniture and homeware products, including new entrants in the market, all of whom may become moreprevalent in the post-COVID-19 environment.
The retail market for furniture and homeware is highly competitive and fragmented. MADE competes withboth traditional bricks and mortar retailers such as John Lewis, Maison du Monde and IKEA as well asonline resellers such as Westwing and Wayfair. Some of these competitors have greater resources thanMADE, larger product base, longer operating histories and wider customer recognition. Traditional bricksand mortar retailers may gain in popularity as COVID-19 related restrictions are relaxed. If MADE fails tocompete effectively with bricks and mortar retailers and other online retailers, it may lose existing customersand fail to attract new ones. In addition, it may be materially adversely affected by the entrance of newcompetitors in the online furniture and homewares market. As a result of the COVID-19 pandemic, retailersand brands that have not typically participated in e-commerce may establish an online presence on their ownor with MADE’s competitors, which may create new or strengthen existing competitors. Competitivepressure from one or more of MADE’s competitors or its inability to adapt effectively and quickly to achanging, competitive landscape could affect MADE’s prices, its margins and demands for its products,which could have a material adverse effect on its business, financial condition, results of operations andprospects.
15

RISKS ASSOCIATED WITH MACROECONOMIC CONDITIONS AND EVENTS
Any current or future health epidemic or other adverse public health development, such as the COVID-19pandemic, could result in business disruption, sustained economic downturn and margin pressures and have amaterial adverse effect on MADE’s business and operating results.
MADE’s business has been and could continue to be adversely affected by infectious disease outbreaks,such as the COVID-19 pandemic, which has spread rapidly across the globe, including in all majorcountries in which it operates, resulting in adverse economic conditions and business disruptions.Governments worldwide have imposed varying degrees of preventative and protective actions, such astemporary travel bans, forced business closures, and stay-at-home orders, all in an effort to reduce thespread of the virus, which has resulted in supply shortages and other business disruptions in many regions.It is impossible to predict the ultimate effect and impact of the COVID-19 pandemic as the situation keepson evolving. Accordingly, MADE cannot predict for how long and to what extent this crisis will impact itsbusiness operations or the global economy as a whole.
As a result of the COVID-19 pandemic, MADE has been experiencing longer lead times in deliveringproducts to its customers. The effects of this pandemic could continue to disrupt MADE’s supply chain anddistribution and fulfilment capabilities, including the delivery and shipments of its products to impactedregions. MADE’s offices, logistics and operations centres and employees have also been affected moregenerally. MADE has had to re-purpose a number of its employees (especially those engaged in itsshowroom premises). In addition, it temporarily placed a number of its employees on furlough during thefirst few months of the pandemic (however, as at the date of this Registration Document, none of itsemployees are currently on furlough) and a majority of its employees moved to remote working.
Further, restrictions on travel, quarantines and other measures imposed in response to the outbreak, as wellas ongoing concern regarding its potential impact, have had and will likely continue to have a negativeeffect on the economies, financial markets and business activities of the countries in which outbreaks occur.Global financial markets have experienced significant losses and volatility as a result of these conditions. Acontinued economic downturn resulting from these measures could negatively impact customer demand andspending in the impacted regions and have an adverse effect on MADE’s gross margins and results ofoperations. Should any of these factors worsen, customer demand and MADE’s results of operations couldbe negatively affected in the current or future fiscal periods.
MADE is dependent on global economic conditions and customer discretionary spending.
Adverse developments in macro-economic conditions, such as the recent global economic slowdown, couldadversely impact MADE’s business and operating results. As a result of the COVID-19 pandemic, the globaleconomy has recently been experiencing a period of significant turbulence and uncertainty. While MADEsaw increased sales as a result of customer spending on home furniture and homewares, as well ascustomers switching to online furniture purchases as bricks and mortar retailers closed during the COVID-19pandemic, there is no guarantee that the trend will sustain once the COVID-19 pandemic restrictions areeased and that it will experience similar trends in periods of other global economic uncertainties. Generally,MADE’s performance depends, to a certain extent, on a number of macro-economic factors outside of itscontrol, which have an impact on consumer spending. Some factors that may negatively influence customerspending include high levels of unemployment, higher customer debt levels, reductions in net worth,declines in asset values and related market uncertainty, home foreclosures and reductions in home values,fluctuating interest rates and credit availability, fluctuating fuel and other energy costs, fluctuating commodityprices and national and global geo-political and economic uncertainty, including in connection with tariffs ortrade laws. Economic conditions in certain regions may also be affected by natural disasters, such asearthquakes, hurricanes, tropical storms and wildfires, public health crises, political crises, such as terroristattacks, war and other political instability or other unexpected events, and such events could also disruptMADE’s operations, internet or mobile networks or the operations of one or more of its third party serviceproviders. Customer purchases of discretionary items, including the products that MADE offers, may declineduring periods of economic uncertainty, when disposable income is reduced or when there is a reduction incustomer confidence. Adverse economic changes could reduce customer confidence, and thereby couldnegatively affect MADE’s results of operations.
In addition, due to the recent economic slowdown and uncertainty, there is an increased risk that suppliers,logistics companies and other third party service providers may face financial difficulties, become insolventand/or cease trading, which may result in disruption to the provision of products or services by them toMADE. If there is any interruption in the provision of products or services provided by third parties,
16

MADE’s business may be adversely affected and it may be unable to find adequate replacement products orservices acceptable to it or its customers on a timely basis, or at all.
In challenging and uncertain economic environments, MADE cannot predict when macroeconomicuncertainty may arise, whether or when such circumstances may improve or worsen or what impact suchcircumstances could have on its business.
Fluctuations in exchange rates may adversely affect MADE’s results of operations.
MADE may be adversely affected by fluctuations in exchange rates. Unfavourable fluctuations in exchangerates used to translate foreign currencies into pounds sterling may have a significant impact on its reportedresults of operations from year to year. In particular, any depreciation of sterling in relation to the USdollar, which is the currency that the majority of MADE’s suppliers require for the purchase of merchandiseand shipping costs, will increase the sterling equivalent of the price paid to suppliers that invoice in USdollars and may have an adverse impact on MADE’s financial condition and future prospects. Anyappreciation of sterling to US dollar will reduce the sterling equivalent of Euro denominated costs, butreduce the sterling value of sale receipts from relevant Continental European markets. MADE currentlygenerates an excess of Euros since Euro denominated sales outweigh Euro denominated costs. The currenthedging structures in place may not suffice to offset a shift in the exchange rates.
The United Kingdom’s exit from the European Union may have a negative effect on global economicconditions, financial markets and MADE’s business.
On 29 March 2017, the United Kingdom formally notified the European Council of its intention to leave theEuropean Union (“Brexit”). On 24 January 2020, a withdrawal agreement was entered into between theEuropean Union, the European Atomic Energy Community and the United Kingdom, setting the terms ofthe withdrawal of the latter from the former two. On 24 December 2020, the United Kingdom and theEuropean Union agreed a trade and cooperation agreement (the “Trade and Cooperation Agreement”),which provides for, among other things, zero-rate tariffs and zero quotas on the movement of goods betweenthe United Kingdom and the European Union. Due to the size and importance of the economy of theUnited Kingdom, the uncertainty and unpredictability concerning the United Kingdom’s future laws andregulations (including financial laws and regulations, tax and free trade agreements, immigration laws andemployment laws) as well as its legal, political and economic relationships with Europe following its exitfrom the European Union may continue to be a source of instability in international markets, createsignificant currency fluctuations or otherwise adversely affect trading agreements or similar cross-bordercooperation arrangements (whether economic, tax, fiscal, legal, regulatory or otherwise) for the foreseeablefuture. The long-term effects of Brexit will depend on the practical implications of the implementation ofthe Trade and Cooperation Agreement and any future agreements (or lack thereof) between the UnitedKingdom and the European Union and, in particular, any potential changes in the arrangements for theUnited Kingdom to retain access to European Union markets. Brexit could result in adverse economiceffects across the United Kingdom and Europe, which could have a material adverse effect on MADE’sbusiness, results of operations, financial condition and prospects.
RISKS ASSOCIATED WITH COMPLIANCE AND REGULATION
Compliance with existing laws and regulations, including in relation to privacy, data protection, andinformation security, or changes in any such laws and regulations could affect MADE’s business.
MADE currently operates in eight countries, six of which are member states of the European Union. As aresult of MADE’s international footprint, it is subject to a wide range of laws and regulations and routinelyincurs costs in complying with these laws and regulations. New laws or regulations or changes in existinglaws and regulations, particularly those governing the sale of products or in other regulatory areas such asdata protection, information security, product safety, marketing, labour and employment, tax, competition,unfair trading, consumer credit, health and safety or environmental protection, may conceivably requireextensive system and operating changes that may be difficult to implement and could increase its cost ofdoing business. For example, MADE is subject to those regulations provided under the Modern SlaveryAct 2015 as well as to the risk of forced labour and modern slavery in its supply chain. While MADE canmonitor its own compliance, there can be no assurances that suppliers, or their labour practices, are fullycompliant with MADE’s policies and procedures as well as the relevant laws and regulations in which theyoperate.
In addition, European and international governmental authorities continue to evaluate the data protection andprivacy implications in the use of “cookies” and similar (tracking) technologies, in particular where these are
17

used for behavioural marketing and other tracking and analytics purposes. The use of cookies, in particularfor online tracking and marketing practices, has been subject to increasing regulation in recent years. A lossin the ability to make effective use of services that employ such technologies, as a result of such regulationor otherwise, could limit MADE’s ability to track trends, optimise its product offering or acquire newcustomers on cost-effective terms and consequently adversely affect its business, financial condition andresults of operations.
Changes in laws and regulations, more stringent enforcement or alternative interpretation of existing lawsand regulations in jurisdictions in which MADE currently operates can change the legal and regulatoryenvironment, making compliance with all applicable laws and regulations more challenging. Changes in lawsand regulations in the future could have an adverse economic impact on MADE by tightening restrictions,reducing its freedom to do business, increasing its costs of doing business, or reducing its profitability. Inaddition, the compliance costs associated with such evolving laws and regulations may be significant. Failureto comply with applicable laws or regulations can lead to civil, administrative or criminal penalties,including but not limited to fines or the revocation of permits and licences that may be necessary for itsbusiness activities. MADE could also be required to pay damages or be subject to civil judgements inrespect of third party claims.
Any of these developments, alone or in combination, could have a material adverse effect on its business,financial condition, results of operations and prospects.
MADE is subject to customs and international trade laws that could require it to modify its current businesspractices and incur increased costs or could result in delay or failure in getting products through customs andport operations.
MADE imports and exports a large number of products as part of its day-to-day business and such importsand exports may be subject to customs and foreign trade regulations (including, for example, EUTR) andthere is no guarantee that it will be able to comply with all of these regulations. In addition, MADE relieson third parties, in particular its suppliers, to make certain import and export customs declarations andtherefore only has limited control over such declarations. Any non-compliance with customs or foreign traderegulations could lead to the imposition of fines or result in MADE’s products being seized, in which casedelivery of its products may be delayed or fail entirely. MADE has recently experienced a temporary delayin the release of certain of its containers in relation to an EUTR audit underpinned by an EU-wide initiativeand has had to comply with further diligence requests from Belgian regulators, with respect to its foreignsuppliers of timber products, leading to a delay in the delivery of its products. While MADE’s containershave been released, MADE is still awaiting an administrative finding in relation to certain alleged technicalissues relating to the audit that could result in a potential fine (the level of the potential fine (if any) hasnot yet been confirmed), and there is no guarantee that similar audits and inspections might not result infuture delays or fines. Further, customs and international trade laws and regulations may changeunpredictably, and have done so recently in connection with the COVID-19 pandemic, economic pressures,potential trade wars and Brexit. For example, Brexit has increased regulatory compliance (including withrespect to EUTR), with MADE being required to comply with both EU and UK standards, which maydiverge and cause MADE to incur additional costs in ensuring its compliance with all the regulationsapplicable to it.
As legal requirements are frequently changed and subject to interpretation, MADE is unable to predict theultimate cost of compliance with these requirements or their effects on its operations. It may be required tomake significant expenditures or modify its business practices to comply with existing or future laws andregulations, which may increase its costs and materially limit its ability to operate its business.
MADE’s business is subject to the general tax environment in the jurisdictions in which it operates and anychanges to this tax environment may increase its tax burden.
MADE’s business is subject to the general tax environment in the jurisdictions in which it operates. Variousgovernments and intergovernmental organisations could introduce proposals for tax legislation, or adopt taxlaws (including introduction of new e-commerce related taxes), that may have an adverse effect on MADE’sworldwide effective tax rate, limit its ability to use carry-forward losses or make use of other favourable taxprovisions. Changes in tax legislation, administrative practices or case law could increase MADE’s taxburden and such changes might even occur retroactively. Further, tax laws may be interpreted differently bythe competent tax authorities and courts, and their interpretation may change at any time, which could leadto an increase in MADE’s tax burden. In addition, court decisions are sometimes ignored by competent taxauthorities or overruled by higher courts, which could lead to higher legal and tax advisory costs and createsignificant uncertainty.
18

Climate change, environmental sustainability and related regulatory responses may adversely impact MADE’sbusiness.
There is an increasing concern that a gradual increase in global average temperatures due to increasedconcentration of carbon dioxide and other greenhouse gases in the atmosphere will cause significant changesin weather patterns around the globe and an increase in the frequency and severity of natural disasters.Changes in weather patterns and an increased frequency, intensity and duration of extreme weatherconditions could disrupt MADE’s supply chain operations, increase the cost of manufacturing of productsand impact the types of products that customers purchase. As a result, the effects of climate change couldhave an adverse effect on its business, financial condition, results of operations and prospects.
Governments, regulators and other interested or influential bodies are becoming increasingly interested inenvironmental sustainability and in enacting legislation and regulations in response to the potential impactsof climate change. Changes to existing legislation or regulation could adversely affect MADE’s operationsand the conduct of its business, in relation to both the use of raw materials used to fabricate furniture andhomeware products as well as the packaging of those products and the disposal of such packaging. MADEis subject to all EU regulations regarding sustainability, including the EUTR, which was adopted in 2013 toprohibit the circulation of illegally logged wood in the European Union. Since 1 January 2021, MADE hasalso been subject to the UK Timber Regulation (“UKTR”), which currently substantially replicates theEUTR, but may diverge from the EUTR in future. If there is a change to the EUTR, the UKTR or anyother environmental legislation, there may be an increase in MADE’s costs.
Further, all of these laws and regulations, which may be mandatory, have the potential to impact MADE’soperations indirectly as a result of required compliance by MADE’s third party suppliers. In addition, whileMADE focuses on designing and sourcing goods using environmentally-friendly materials and engagingsuppliers with sustainable packaging, it is active in an industry that is generally not considered to beenvironmentally sustainable and it depends on shipping logistics, which lead to a high output of carbondioxide. While MADE has adopted, and intends to continue to improve and develop, various sustainabilitystrategies, there is no guarantee that it will be successful in implementing such strategies. Further,inconsistency of legislation and regulations among jurisdictions may also affect the costs of compliance withsuch laws and regulations. Any assessment of the potential impact of future climate change legislation,regulations or industry standards, as well as any international treaties and accords, is uncertain given thewide scope of potential regulatory change in the countries in which MADE operates or conducts business.
Failure to comply with the UK Bribery Act 2010 (the “UK Bribery Act”) and other anti-corruption, anti-bribery,anti-money laundering, sanctions and competition laws could subject MADE to penalties and other adverseconsequences.
MADE is subject to a wide range of anti-corruption, anti-bribery and anti-money laundering laws, such asthe UK Bribery Act and similar laws in other countries, as well as sanctions and competition laws, acrossthe markets in which it operates. The increasingly broad and stringent legal and regulatory frameworkcreates pressure on both business performance and market sentiment, requiring continual improvements inhow it operates as a business to maintain compliance. Actual or alleged violations of applicable laws,regulations, or anti-corruption compliance contractual requirements could result in fines, litigation, disruptionor cessation of business activity, and also damage MADE’s reputation or cause a loss of businessopportunity in the markets in which it operates. Any non-compliance could also result in criminalprosecution for MADE or its employees.
MADE’s policies and procedures designed to prevent compliance breaches may prove to be ineffective. If itsemployees or agents violate regulatory requirements or its policies, or fail to maintain adequate record-keeping and internal accounting practices to accurately record transactions, MADE may be subject toregulatory sanctions, including monetary fines and criminal penalties, any of which could materiallyadversely affect its business, financial condition, results of operations and prospects.
MADE may be subject to general litigation, regulatory disputes and government inquiries.
MADE has in the past, and may in the future, become involved in claims, litigation, investigations andvarious other legal proceedings by customers, designers, employees, third party suppliers, competitors,government agencies or others in relation to a range of matters, including, product quality, delays ofpayments or deliveries, competition law, intellectual property disputes, labour disputes and tax matters. Theresults of any such claims, litigation, investigations and other legal proceedings are inherently unpredictableand expensive. Any claims against MADE, whether meritorious or not, could be time-consuming, result incostly litigation, damage its reputation, require significant amounts of management time and divert significant
19

resources. If any of these legal proceedings were to be determined adversely to MADE, or it was to enterinto a settlement arrangement, it could be exposed to monetary damage or limits on its ability to operate itsbusiness (for example, being restricted in marketing certain of its products), which could have an adverseeffect on its business, financial condition, results of operations and prospects.
MADE might be subject to fines and follow-on claims for damages in relation to alleged or actual anti-competitive behaviour.
MADE might become the subject of investigations by competition authorities and might be exposed to finesimposed by such authorities and follow-on claims for damages raised against it by third parties. The amountof any such fines and follow-on claims for damages could be substantial. Future investigations could revealactual or potential non-compliance with competition laws. In addition, alleged or actual anti-competitivebehaviour might seriously disrupt business relationships with business partners. The realisation of any ofthese risks relating to MADE’s alleged or actual anticompetitive behaviour, alone or in combination, couldhave a material adverse effect on its business, financial condition and results of operations.
20
PART II
PRESENTATION OF FINANCIAL AND OTHER INFORMATION
Presentation of financial information
Historical financial information
The historical financial information presented in section B of Part IX: “Group Historical FinancialInformation” of this Registration Document consists of financial information for each of the years ended31 December 2020, 31 December 2019 and 31 December 2018 (together, the “Group Historical FinancialInformation”).
The unaudited interim financial information for the three months ended 31 March 2021 and 31 March 2020in section C of Part IX: “Group Historical Financial Information” of this Registration Document has beenprepared in accordance with the relevant IFRS interim reporting standards (IAS 34 Interim FinancialReporting).
The financial information in this Registration Document has been prepared in accordance with therequirements of the UK Prospectus Regulation, the Listing Rules, and International Financial ReportingStandards as adopted in the EU (“IFRS”) and the IFRS Interpretation Committee interpretations as describedin the basis of preparation of the Group Historical Financial Information. The basis of preparation of theGroup Historical Financial Information and the significant accounting policies applied are further explainedin Part IX: “Group Historical Financial Information” of this Registration Document.
Non-IFRS measures
This Registration Document contains certain financial measures that are not defined or recognised underIFRS, including Adjusted EBITDA, Adjusted EBITDA margin and free cash flow. The Directors believe thatthese measures provide readers with useful information regarding the Group’s financial performance andfacilitate an understanding of the underlying performance of the Group. There are no generally acceptedprinciples governing the calculation of these measures and the evaluations upon which these measures arebased vary from company to company. Other companies may use similarly titled non-IFRS financialmeasures that are calculated differently from the way the Group calculates such measures and, accordingly,the Group’s non-IFRS financial measures may not be comparable with similar measures used by othercompanies. In addition, the Group’s non-IFRS financial measures should not be considered as alternatives tothe audited consolidated financial statements for the Group (the “Audited Consolidated FinancialStatements”) based on IFRS. Further information regarding these non-IFRS financial measures, togetherwith a reconciliation of these measures to the most comparable IFRS measure, is provided inPart VIII: “Operating and Financial Review – Non-IFRS Financial Measures”.
Key performance indicators
To assist recipients of this Registration Document in comparing the Group’s historical financial performancefrom period to period, certain key performance indicators and other operating measures have been presentedin this Registration Document. Save where indicated, these measures have been extracted from the Group’smanagement reporting systems but have not been audited or reviewed by external auditors, consultants,independent experts or other third parties. Set out below is a description of the key performance indicatorsused by the Group, other than the non-IFRS measures referred to above:
* Gross sales: Sales at the point of transaction excluding applicable VAT.
* Last twelve-months (LTM) Active customers: Number of customers who have placed at least one orderduring the preceding twelve months.
* Orders: Total number of orders received during the period, inclusive of orders that may eventually bereturned or cancelled.
* Repeat orders mix: Number of total orders excluding first time customer orders divided by total orders.
* Average order value (AOV): Value of gross sales divided by the number of orders.
* Homeware sales mix: Homeware gross sales divided by total gross sales.
21

Presentation of other information
Market, economic and industry data
Unless the source is otherwise stated, the information contained in this Registration Document related tomarkets, market size, market shares, market positions, economic and industry data in this RegistrationDocument constitute the Directors’ estimates, using underlying data from independent third parties. TheCompany obtained market data and certain industry forecasts used in this Registration Document frominternal surveys, reports and studies, where appropriate, as well as market research, publicly availableinformation and industry publications, including publications and data compiled by Euromonitor andNational Association of Realtors.
The information set out in this Registration Document that has been sourced from third party reports andindustry publications has been accurately reproduced and, so far as the Company is aware and has beenable to ascertain from that published information, no facts have been omitted which would render thereproduced information inaccurate or misleading. While the Directors believe the third party informationincluded herein to be reliable, the Company has not independently verified such third party information, andthe Company makes no representation or warranty as to the accuracy or completeness of such informationas set forth in this Registration Document.
Where third party information has been used in this Registration Document, the source of such informationhas been identified.
Rounding
Percentages and certain amounts included in this Registration Document have been rounded for ease ofpreparation and presentation. Accordingly, numerical figures shown as totals in certain tables may not be theexact arithmetic aggregations of the figures that precede them. In addition, certain percentages and amountscontained in this Registration Document reflect calculations based on the underlying information prior torounding and, accordingly, may not conform exactly to the percentages or amounts that would be derived ifthe relevant calculations were based upon the rounded numbers.
Currencies
Unless otherwise indicated, all references in this Registration Document to “sterling”, “pounds sterling”,“UK sterling”, “GBP”, “£”, or “pence” are to the lawful currency of the United Kingdom. All references tothe “euro” or “€” are to the currency introduced at the start of the third stage of the European economicand monetary union pursuant to the Treaty establishing the European Community, as amended. Allreferences to “US dollars”, “USD”, “US$” or “$” are to the lawful currency of the United States ofAmerica.
Constant currency basis
With respect to period-on-period and year-on-year comparisons, MADE presents gross sales, net revenue andgross margin on a constant currency basis, which excludes the effects of changes in currency variation fromMADE’s reported results under IFRS. Constant exchange rates for the years ended 31 December 2019 and2018 are determined by applying the effective exchange rate during 2020 and constant effective exchangerates for the three months ended 31 March 2021 and 2020. Effective exchange rates are the average raterelating to the most recent period which includes any gains or losses related to currency hedging activitieswhich are realised in the period. The Group believes that this measure facilitates an understanding of theunderlying economic performance of MADE’s operations.
Exchange rates
Certain industry-related information included in this Registration Document is shown translated fromUS dollars and euros into pounds sterling at specified rates solely for the convenience of the reader. Theaverage exchange rates of US dollars and euros are shown relative to pounds sterling below. The inclusionof these exchange rates is for illustrative purposes only and does not mean that the sterling amounts actuallyrepresent such US dollar or euro amounts or that such sterling amounts could have been converted into USdollars or euro at any particular rate, if at all.
22

Average rate against pounds sterling
US dollars per £1.00
Year Period End Average High Low
2018 ........................................................................... 0.784 0.750 0.801 0.6972019 ........................................................................... 0.754 0.784 0.831 0.7502020 ........................................................................... 0.732 0.780 0.871 0.7322021 (through to 20 May 2021) ............................... 0.705 0.723 0.743 0.703
Average rate against pounds sterling
Euros per £1.00
Year Period End Average High Low
2018 ........................................................................... 0.899 0.885 0.908 0.8632019 ........................................................................... 0.846 0.877 0.931 0.8342020 ........................................................................... 0.894 0.889 0.940 0.8302021 (through to 20 May 2021) ............................... 0.862 0.870 0.909 0.847
—————Source: Bloomberg
Times
All times referred to in this Registration Document are, unless otherwise stated, references to the time inLondon, United Kingdom.
Forward-looking statements
Certain information contained in this Registration Document, including any information as to the Group’sstrategy, plans or future financial or operating performance constitutes “forward-looking statements”. Theseforward-looking statements can be identified by the use of terminology such as, “aims”, “anticipates”,“assumes”, “believes”, “budgets”, “could”, “contemplates”, “continues”, “estimates”, “expects”, “intends”,“may”, “plans”, “predicts”, “projects”, “schedules”, “seeks”, “shall”, “should”, “targets”, “would”, “will” or,in each case, their negative or other variations or comparable terminology. Forward-looking statementsappear in a number of places throughout this Registration Document and include, but are not limited to,express or implied statements relating to:
* the Group’s business strategy and outlook;
* the Group’s future results of operations;
* the Group’s future financial and market positions;
* the Group’s margins, profitability and prospects;
* expectations as to future growth;
* general economic trends and other trends in the industry in which the Group operates;
* the impact of regulations on the Group and its operations; and
* the competitive environment in which the Group operates.
By their nature, forward-looking statements are based upon a number of estimates and assumptions that,whilst considered reasonable by the Directors, the Company or the Group, are inherently subject tosignificant business, economic and competitive uncertainties and contingencies. Known and unknown factorscould cause actual results to differ materially from those indicated, expressed or implied in such forward-looking statements.
Readers are cautioned that forward-looking statements are not guarantees of future performance. Anyforward-looking statements in this Registration Document reflect the Directors’, the Company’s or theGroup’s current view with respect to future events and are subject to certain risks relating to future events
23

and other risks, uncertainties and assumptions including, but not limited to the risks and uncertaintiespresented under the headings Part I: “Risk Factors” and Part IX: “Group Historical Financial Information”.
The forward-looking statements contained in this Registration Document speak only as at the date of thisRegistration Document. Subject to the requirements of the Prospectus Regulation Rules or applicable law,the Directors, the Company and the Group explicitly disclaim any intention or obligation or undertaking topublicly release the result of any revisions to any forward-looking statements made in this RegistrationDocument that may occur due to any change in the Directors’, the Company’s or the Group’s expectationsor to reflect events or circumstances after the date of this Registration Document.
No profit forecast
No statement in this Registration Document or incorporated by reference into this Registration Document isintended to constitute a profit forecast or profit estimate for any period, nor should any statement beinterpreted to mean that earnings or earnings per Ordinary Share after the date of this RegistrationDocument will necessarily be greater or less than the historical published earnings or earnings per OrdinaryShare for the Company.
Information not contained in this Registration Document
The delivery of this Registration Document shall not, under any circumstances, create any implication thatthere has been no change in the business or affairs of the Company or the Group since the date hereof orthat the information contained herein is correct as of any time subsequent to the date of this RegistrationDocument.
No incorporation of website information
Save for the copies of the documents listed in Part X: “Additional Information – Documents Available forInspection” that are extracts from this Registration Document and will be available for inspection on theGroup’s website at https://www.corporate.made.com/, information contained on the Group’s website, thecontents of any website accessible from hyperlinks on the Group’s website, and any other websites referredto in this Registration Document, do not form part of this Registration Document. The information on suchwebsites has not been scrutinised or approved by the FCA. No person has been authorised to give anyinformation or make any representations other than those contained in this Registration Document and, ifgiven or made, such information or representations must not be relied upon as having been so authorised.
Definitions
Certain terms used in this Registration Document, including all capitalised terms, are defined inPart XI: “Definitions”.
24

PART III
DIRECTORS, SECRETARY, REGISTERED OFFICE,LEGAL ADVISER AND AUDITORS
Directors Susanne Given (Chair)Ning Li (Founder, Vice Chair)Philippe Chainieux (Chief Executive Officer)Adrian Evans (Chief Financial Officer)Bruno Crémel (Non-Executive Director)George McCulloch (Non-Executive Director)Gwyn Burr (Independent Non-Executive Director and Senior Independent Director)Matthew Price (Independent Non-Executive Director)
Senior Managers Philippe Chainieux (Chief Executive Officer)Adrian Evans (Chief Financial Officer)Nicola Thompson (Chief Operating Officer)
Company Secretaryand General Counsel
Lisa Tomlins
Registered Office 28 Irish TownGibraltarGX11 1AA
Legal Adviser to theCompany as to Englishand US law
Davis Polk & Wardwell London LLP5 Aldermanbury SquareLondon EC2V 7HRUnited Kingdom
Auditors to theCompany
EY LimitedRegal House, QueenswayGibraltarGX11 1AA
Reporting Accountantsto the Company
Ernst & Young LLP1 More London PlaceLondon SE1 2AFUnited Kingdom
25

PART IV
INDUSTRY OVERVIEW
The following information relating to the Group’s industry has been provided for background purposes only.The information has been extracted from a variety of sources released by public organisations. Theinformation has been accurately reproduced and, as far as the Company is aware and is able to ascertainfrom information published by such sources, no facts have been omitted which would render the reproducedinformation inaccurate or misleading. This Part IV (Industry Overview) should be read in conjunction withthe more detailed information contained elsewhere in this Registration Document.
THE INDUSTRY
The global furniture and homeware market is large and growing. Growth has been resilient historically andfurther forecasted to grow considerably, driven by strong structural tailwinds supporting long-term growth inthe category. The market stands at an inflection point of e-commerce adoption, with significant furtherupside potential given the secular shift to online faster than most other industries. The market is furtherbolstered by a number of consumer trends re-shaping the space: shifting demographics, increased focus onproduct sustainability, rise in remote working, and growing brand awareness driven by high social mediaengagement, among others.
The sector is comprised of a broad variety of firms operating within a highly fragmented landscape. Playersrange from high-end furniture and homeware brands to omnichannel DIY retailers, including multi-categoryand pure play online marketplaces. Most competitors in MADE’s current markets hold average marketshares of just approximately 0.5% and the Company estimates that over 50% of competitors areindependent, local firms that will need to adapt to the new digital environment1.
MADE is the leading digitally native lifestyle brand in home, operating in a large and highly attractivemarket that stands to benefit from multiple favourable structural tailwinds.
Total addressable market
MADE’s market is large, global, and growing. According to own estimates from Euromonitor data2, theglobal furniture and homeware market for both online and offline is currently estimated at £504 billion, ofwhich £151 billion is attributable to Europe and £94 billion attributable to MADE’s current markets whichinclude the United Kingdom, France, Germany, Austria, Belgium, Spain, the Netherlands and Switzerland.
As shown in the graph below, Euromonitor forecasts MADE’s existing markets to grow by a 5% CAGRfrom 2020 to 2025, reaching £118 billion by 2025. Similarly, the total European market is forecasted togrow by a 5% CAGR from 2020 to 2025, reaching £194 billion by 2025. Online sales still represent asmall portion of the market but are expected to make a meaningful impact as penetration rates rise,representing substantial runway for growth in both current and peripheral geographies.
1 Company own estimate.2 Company own estimate from Euromonitor International Limited, Retailing 2021 edition, accessed 08/03/2021. Retail value RSP incl. sales
tax, fixed exchange rates, current prices. Furniture and homeware market defined as aggregation of homewares and home furnishing stores,direct selling, e-commerce and homeshopping.
26
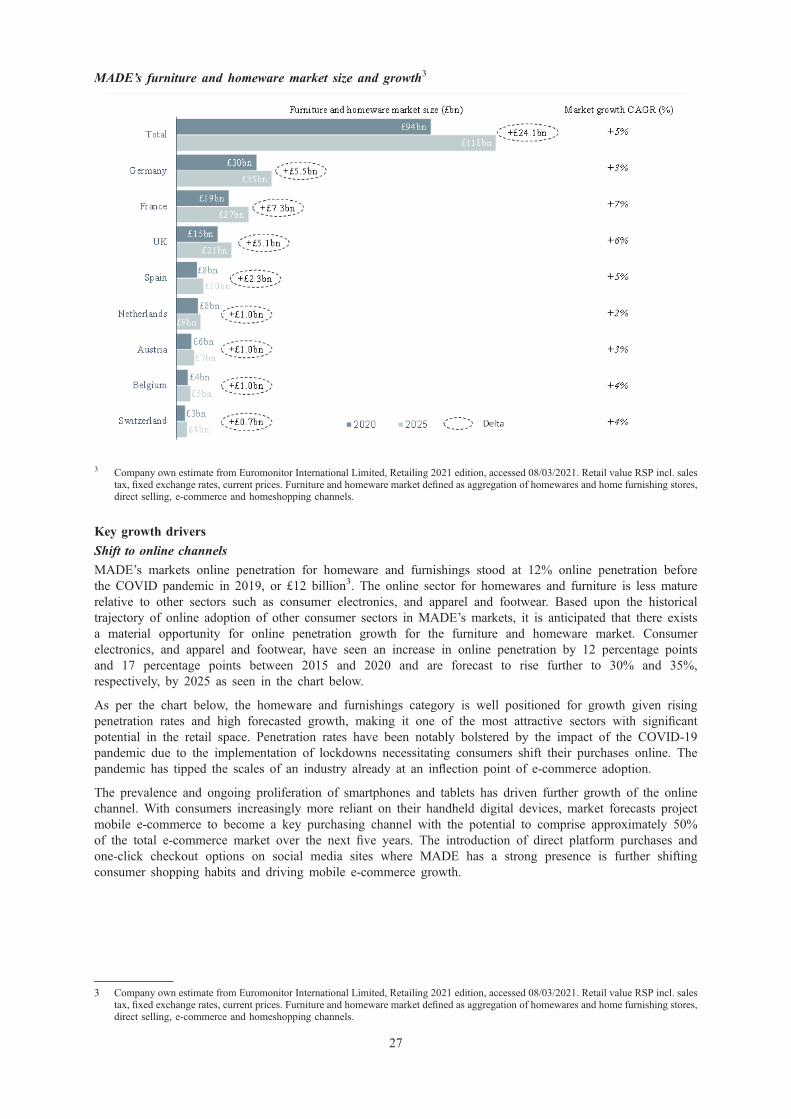
MADE’s furniture and homeware market size and growth3
3 Company own estimate from Euromonitor International Limited, Retailing 2021 edition, accessed 08/03/2021. Retail value RSP incl. salestax, fixed exchange rates, current prices. Furniture and homeware market defined as aggregation of homewares and home furnishing stores,direct selling, e-commerce and homeshopping channels.
Key growth drivers
Shift to online channels
MADE’s markets online penetration for homeware and furnishings stood at 12% online penetration beforethe COVID pandemic in 2019, or £12 billion3. The online sector for homewares and furniture is less maturerelative to other sectors such as consumer electronics, and apparel and footwear. Based upon the historicaltrajectory of online adoption of other consumer sectors in MADE’s markets, it is anticipated that there existsa material opportunity for online penetration growth for the furniture and homeware market. Consumerelectronics, and apparel and footwear, have seen an increase in online penetration by 12 percentage pointsand 17 percentage points between 2015 and 2020 and are forecast to rise further to 30% and 35%,respectively, by 2025 as seen in the chart below.
As per the chart below, the homeware and furnishings category is well positioned for growth given risingpenetration rates and high forecasted growth, making it one of the most attractive sectors with significantpotential in the retail space. Penetration rates have been notably bolstered by the impact of the COVID-19pandemic due to the implementation of lockdowns necessitating consumers shift their purchases online. Thepandemic has tipped the scales of an industry already at an inflection point of e-commerce adoption.
The prevalence and ongoing proliferation of smartphones and tablets has driven further growth of the onlinechannel. With consumers increasingly more reliant on their handheld digital devices, market forecasts projectmobile e-commerce to become a key purchasing channel with the potential to comprise approximately 50%of the total e-commerce market over the next five years. The introduction of direct platform purchases andone-click checkout options on social media sites where MADE has a strong presence is further shiftingconsumer shopping habits and driving mobile e-commerce growth.
3 Company own estimate from Euromonitor International Limited, Retailing 2021 edition, accessed 08/03/2021. Retail value RSP incl. salestax, fixed exchange rates, current prices. Furniture and homeware market defined as aggregation of homewares and home furnishing stores,direct selling, e-commerce and homeshopping channels.
27

Significant category upside with higher online growth4
4 Company own estimate from Euromonitor International Limited.
Online penetration rates by industry in MADE’s markets5
5 Company own estimate from Euromonitor International Limited.
Demographic trends
MADE believes that its curated, value driven business model resonates with the younger generations, whoform the core of MADE’s customer base, with approximately 50% of MADE’s customers being under35 years old. Young, digitally native, affluent consumers are the core pillar of MADE’s customer base.MADE stands well positioned to take advantage of demographic trends and behaviours specific to thiscohort: their comfort and preference for digital platform brands, and their high brand loyalty as they movethrough homes and stages of life.
28
As MADE’s core cohorts such as millennials age, start families, and mature into the home market, MADEexpects online sales of home goods to increase. MADE anticipates the current millennial generation will bea key driver of growth in the furniture and homeware market as they enter their prime home formation agesover the next five years, when they are forecast to comprise 38% of the overall home buying population6.
In addition to Millennials and Generation Z buyers, who comprise over 45% of MADE’s total customerbase, MADE’s key customer demographics also extend to affluent Generation X buyers, who are expected toincreasingly gain comfort with online channels, albeit at a slower pace.
Sustainability
MADE’s core consumers’ expectations and preferences for goods and products made by sustainable, ESG-focused and value-led organisations are aligned with its core mission and business model. Companyestimates indicate that approximately 80% of consumers today base their purchases on sustainability factors.Consumer awareness of these issues is high, as is their commitment to purchasing from organisations thathave the strategy and infrastructure MADE currently possess in order to produce and consume in asustainable fashion. MADE believes that it will acquire and retain an increasing number of customers due toits stated commitments to sustainability and its circular product lifecycle strategy. The COVID-19 pandemichas accelerated consumer awareness of the link between consumption patterns and environmental issues,further driving traffic towards companies, like MADE, that have embedded sustainability into their coremission and business model.
Brand awareness driven by social media engagement
As consumers shift to buying online, social media has graduated to a key platform to drive brand awarenessand influence buying decisions. According to the Company’s own estimates, over 80% of consumers’purchasing choices are influenced by their friends’ social media posts.
Social influencers with loyal audiences are becoming key to driving customer choices. Research indicatesGeneration Z and Millennials are more likely to be influenced by social media, with approximately over80% of Millennials stating that user-generated content has at least some influence on how they spend.MADE has a bespoke social-first brand marketing platform utilising influencers and tastemakers acrossEurope.
Remote working
According to Euromonitor7, 68% of global professionals expect a permanent shift towards working fromhome. As remote learning similarly becomes ubiquitous, MADE expects homes to become a nexus ofmultiple activities driving demand via the frequency and variety of furniture and homeware purchases.Increased use of home goods is expected to drive more frequent purchases of both large furniture itemssuch as sofas, as well as homeware accessories to match and style, as expected wear & tear reduces evenhigh-quality furniture lifespans. As focus and time spent in the home increases, MADE also expects a largerpercentage of household discretionary spend to be allocated to furniture and homeware.
6 According to Copyright # “2020 Home Buyers and Sellers Generational Trends Report.” National Association of RealtorsÒ All rightsreserved. Reprinted with permission, https://www.nar.realtor/sites/default/files/documents/2020-generational-trends-report-03-05-202March 2020.
7 Based on Euromonitor International Voice of the Industry: COVID-19 Surveys, October 2020. Question, “How do you think customerswill change their social and community-related behavior as a result of the COVID-19 pandemic? Work from home more” (n=2,778). Doesnot add to 100% as 2% responded ” Not sure” (not pictured).
29
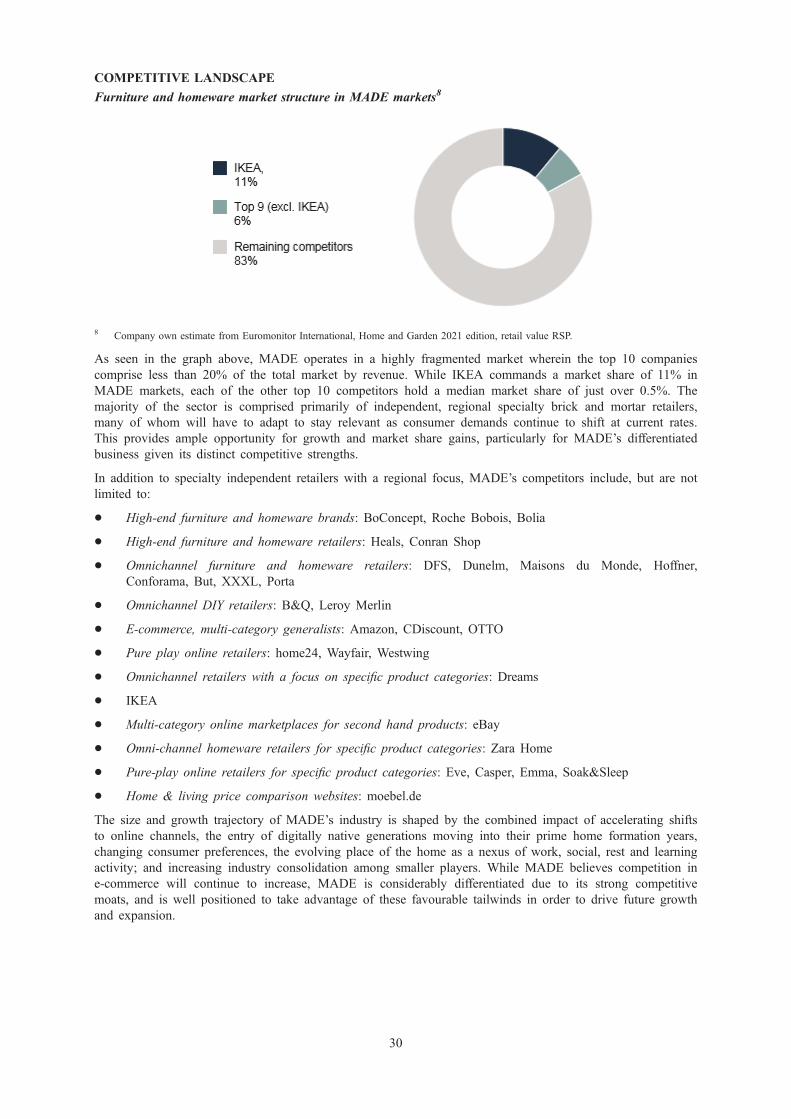
COMPETITIVE LANDSCAPE
Furniture and homeware market structure in MADE markets8
8 Company own estimate from Euromonitor International, Home and Garden 2021 edition, retail value RSP.
As seen in the graph above, MADE operates in a highly fragmented market wherein the top 10 companiescomprise less than 20% of the total market by revenue. While IKEA commands a market share of 11% inMADE markets, each of the other top 10 competitors hold a median market share of just over 0.5%. Themajority of the sector is comprised primarily of independent, regional specialty brick and mortar retailers,many of whom will have to adapt to stay relevant as consumer demands continue to shift at current rates.This provides ample opportunity for growth and market share gains, particularly for MADE’s differentiatedbusiness given its distinct competitive strengths.
In addition to specialty independent retailers with a regional focus, MADE’s competitors include, but are notlimited to:
* High-end furniture and homeware brands: BoConcept, Roche Bobois, Bolia
* High-end furniture and homeware retailers: Heals, Conran Shop
* Omnichannel furniture and homeware retailers: DFS, Dunelm, Maisons du Monde, Hoffner,Conforama, But, XXXL, Porta
* Omnichannel DIY retailers: B&Q, Leroy Merlin
* E-commerce, multi-category generalists: Amazon, CDiscount, OTTO
* Pure play online retailers: home24, Wayfair, Westwing
* Omnichannel retailers with a focus on specific product categories: Dreams
* IKEA
* Multi-category online marketplaces for second hand products: eBay
* Omni-channel homeware retailers for specific product categories: Zara Home
* Pure-play online retailers for specific product categories: Eve, Casper, Emma, Soak&Sleep
* Home & living price comparison websites: moebel.de
The size and growth trajectory of MADE’s industry is shaped by the combined impact of accelerating shiftsto online channels, the entry of digitally native generations moving into their prime home formation years,changing consumer preferences, the evolving place of the home as a nexus of work, social, rest and learningactivity; and increasing industry consolidation among smaller players. While MADE believes competition ine-commerce will continue to increase, MADE is considerably differentiated due to its strong competitivemoats, and is well positioned to take advantage of these favourable tailwinds in order to drive future growthand expansion.
30
PART V
BUSINESS OVERVIEW
This Part V (Business Overview) should be read in conjunction with the more detailed informationcontained in this Registration Document. Where stated, financial information in this Part V (BusinessOverview) has been extracted from Part IX (Group Historical Financial Information).
Overview
MADE is the leading digitally native lifestyle brand in home. MADE’s mission is to make high-enddesigner furniture and homeware products accessible to everyone. MADE sells its products across the UnitedKingdom, Germany, Switzerland, Austria, France, Belgium, Spain and the Netherlands via its e-commerceplatform, which provides an inspiring and seamless customer experience, while its asset light verticallyintegrated model allows for scalability.
MADE was founded in 2010 and launched its first website in the United Kingdom that year. After launchin the United Kingdom, MADE has gradually expanded its product offering, starting with upholstery, thenfurniture and more recently homewares and lifestyle categories. In parallel to its product offering expansion,MADE commenced its international expansion by launching its French website in January 2013, followedby websites for a number of other European markets from 2013 to 2018, with Spain being the latest marketthat it entered in 2018. MADE is headquartered in the United Kingdom, with local offices in its key tradingmarkets, in France, Germany and the Netherlands, as well as sourcing offices.
MADE believes it provides its customers with high-quality, responsibly made, affordable products,underpinned by exclusive designs, that enable customers to curate their life at home. MADE’s fresh andever-changing range, with nine new collections9 launched on average every week and around 40% of itsrange renewed each year, consists of over 6,000 curated furniture and homeware products. To create itsproduct range, MADE partners with over 150 established and up-and-coming designers, artists andcollaborators. Its customer proposition has enabled MADE to develop a large, active and loyal customerbase, with approximately 1.1 million active customers in 2020 and approximately 1.2 million activecustomers in the last 12 months to the end of the first quarter of 2021. Of total customer orders in the threemonths ended 31 March 2021, approximately 48% of gross sales were generated from customers inContinental Europe and 52% from the United Kingdom. For the same period, repeat orders in the UnitedKingdom (as MADE’s most mature market) constituted approximately 50% of MADE’s total UK customerorders. MADE is the most popular home and living brand for UK millennials, the most reviewed homebrand on UK Trustpilot, has an “Excellent” Trustpilot rating in the United Kingdom and core ContinentalEuropean markets and has more than 3.1 million10 followers across its social media accounts.
MADE’s business model is centered around a flexible asset-light supply chain, vertically integrated across allfunctions and processes, covering the entire product lifecycle from product development and sourcing(including concept design, development, production and ordering) through to global shipping, warehousingand home delivery. Sustainability is embedded into MADE’s operations with growing visibility andtransparency given to its customers. MADE designs products with their longevity in mind and is committedto its sustainability initiatives.
The Group’s gross sales, net revenue and Adjusted EBITDA (as defined below) were £109.5 million,£82.4 million and £1.8 million, respectively, for the three months ended 31 March 2021 and £315 million,£247 million and (£5.1 million), respectively, for the year ended 31 December 2020. MADE’s business isalso highly cash generative, due to its strong margins, an attractive negative working capital profile andrelatively low capital expenditure requirements. Due to the partnerships that MADE has built, it has thebenefits of a vertically integrated business, without the need to make all of the related infrastructureinvestments itself.
MADE proposes to effect a group reorganisation to insert a new UK-incorporated holding company of theGroup, Made.com Group Plc (“Listco” and together with the Group, the “New Group”), as furtherdescribed in Part X: “Additional Information – Proposed Pre-IPO Reorganisation”, and to pursue an IPOand London listing of Listco. If MADE decides to pursue the IPO and London listing of Listco, anapplication will be made to the FCA for the admission (the “Admission”) of Listco’s ordinary shares to the
9 Refers to a 2021 figure for homeware and furniture. Collection is defined as capsule range of more than one SKU.10 Figure includes 1.3 million followers on Instagram and 1.8 million followers on Facebook as at 8 April 2020.
31

premium listing segment of the Official List and to trading on the main market for listed securities of theLondon Stock Exchange plc (the “London Stock Exchange”).
Key Strengths
The Directors believe that MADE has a number of competitive strengths and attributes that differentiate itfrom its peers and position it to continue delivering a rapid growth trajectory.
Unique pureplay digitally native lifestyle brand with an exclusive and differentiated product offering
MADE is the only pureplay digitally native lifestyle brand in the furniture and homeware category operatingat scale. As an online home lifestyle destination, MADE offers an exclusive, well-designed, ever-changingproduct assortment at affordable prices.
MADE offers a curated range of unique and exclusive products, with approximately 6,000 active SKUs11 inthe catalogue as of 202012, sourced from a network of more than 150 in-house and external independentdesigners, artists and collaborators. MADE’s design credentials have established a premium position in themarket which attracts designer talent, bringing international experience and new design inspiration toMADE’s platform. These designers, artists and collaborators generally share MADE’s success through aroyalty model which incentivises new design inspiration to elevate the brand.
MADE also partners with out-of-industry tastemakers, brands and influencers across various industriesincluding fashion, jewellery and outdoor clothing to bring their unique perspective in the creation of boldstatement collections and enable MADE to create designs that become iconic.
Each design is a standalone piece, typically uniquely designed for MADE and allows for its customers toshape and curate their home lifestyle choices. MADE’s business model enables it to define a new pricepoint for designer furniture which is significantly lower than high-end designer brands while maintaininghigh quality. MADE believes it offers an ever-changing range that is at the forefront of design, shaping andcapturing consumer tastes with, on average, nine new collections launched every week.
Strong appeal to a digitally native affluent customer base
MADE’s curated product assortment resonates strongly with the younger, affluent, digitally savvy and designand sustainability-conscious population, including the important millennial customer base. MADE believesthis generation is expected to be the key driver of continued growth in furniture and homeware, as theyenter the prime home shopping age in the coming years, with 38% of home buyers across MADE’sgeographic markets being millennials (the largest cohort), and fuelled by increased spending power as theyrise through the workforce. MADE believes that its digital pureplay nature puts it in a strong position tobenefit from the combination of the accelerated shift to online and digitally native generations entering theirprime home formation years and as a result, increasing their spending on furniture and homeware.Furthermore, MADE appeals to the younger generation transitioning into new life commitments as well asto a more mature, affluent audience with appreciation for curated ranges.
MADE’s compelling customer value proposition is evidenced by its strong customer growth (activecustomers grew from 0.6 million in 2018 to 1.1 million in 2020), and customer satisfaction demonstrated inits “Excellent” UK Trustpilot rating, which is based on more than 89,000 reviews, with “Excellent” ratingsalso in MADE’s core Continental European markets..
MADE believes it is well positioned to take advantage of the structural tailwinds driving the online furnitureand homeware market including sector consolidation, increasing focus on sustainability, working from home,and millennials entering their core home formation years.
Disruptive, vertically integrated business model with strong competitive moats
MADE believes it operates a disruptive, asset-light, vertically integrated business model with strongcompetitive moats. MADE has significant control of every aspect of the value chain, from productdevelopment and design, to sourcing, manufacturing and distribution, enabling it to prioritise and implementan end-to-end sustainable approach throughout its operations. Having been optimised over the course ofmore than a decade, the vertically integrated model maximises the customer value proposition in terms ofdifferentiated product offering, quality and value for money, while simultaneously providing scalability,attractive margins and capital efficiency for MADE.
11 Over a third of SKUs is designed by MADE’s in-house designers.12 MADE anticipates that its vertically integrated model will allow it to grow its range to approximately 10,000 SKUs in 2025.
32

MADE directly sources approximately 95% of its products, which means it has significant control over thequality of its products and can promote the sourcing of sustainable raw materials and deliver strong grossmargins. As part of its asset-light business model, MADE outsources the manufacturing process to over 200factories globally, including 69-factories in China, 41 in India, 35 in Vietnam and 44 in the UnitedKingdom and Continental Europe. However, in order to maintain strong alignment over the process andbuild strong relationships with the factories, MADE employs more than 150 people who are dedicated toproduct and range development, quality and product-related ESG as well as overseeing the contractmanufacturing in local offices in China and Vietnam. MADE’s scalable supplier base is geographicallydiversified with no supplier contributing more than 6% of its gross sales, reducing supplier concentrationrisk and ensuring maximum agility.
Recent investments in expansion capacity in warehouses to open up additional facilities in the UnitedKingdom and Continental Europe have positioned the business to scale sustainably with limited additionalcapex requirements.
Just-in-time supply chain
MADE’s innovative, data-led “just in time” supply chain utilises a predictive model that improves withscale, minimising inventory requirements and de-risking the frequent launch of new collections. MADE’soperations are based on a short batch production model with frequent re-ordering. The predictive modelcontinually adapts the supply chain to demand evolution and allows MADE to implement a “test and learn”process. When launching new products, the model allows MADE to decide prior to intake whether todiscontinue or reorder products following the first test batch, thus eliminating the need to commit to largebulk orders and reducing the risks associated with launching new collections. MADE’s “test and learn”process has a success rate of approximately 60%.13
For products in the core range, MADE can automatically repeat orders in small batches to minimise leadtimes for customers and reduce inventory. In 2020, on average, 59% of containers were presold at arrival,and 56% of stock was in transit.
Sustainability
MADE’s ability to control all aspects of its supply chain enables it to embed sustainability throughout itsoperations from design, sourcing and production, to sales and aftersales. MADE designs products with theirlongevity in mind and is committed to numerous responsible sourcing targets over the next five years (fromits current targets in 2021), including: (i) reaching 100% recycled or recyclable packaging by 2025, from25% reduction in plastic and 20% reduction in total packaging in 2021, (ii) reaching 100% sustainablysourced key materials (including velvet, cotton and polyester) by 2025, from 100% recycled polyestervelvet, 25% recycled or organic cotton and 15% recycled other polyester in 2021, and (iii) reaching 100%sustainably sourced, fully traceable timber in 2025, from 60% responsibly sourced, fully traceable timber in2021. While production sustainability is primarily achieved through careful factory collaborations and controlteams on the ground, MADE has put in place, and is developing, certain initiatives focused on reusing,refurbishing and re-cycling of its products. Through a give-away platform, which MADE has launched inpartnership with Geev, a third party donation platform, MADE seeks to encourage customers, whenpurchasing a new item from MADE, to list the furniture they are replacing on the third party platform, witha proportion of the customer’s original order value converted into a charitable donation. It is intended that atake-back programme, which MADE plans to launch in the coming years, will allow customers to returntheir old MADE furniture items directly to MADE to be reconditioned for a second life. MADE is alsofocused on avoiding overproduction and waste and generally has no stock write-offs.
MADE believes its approach aligns strongly with the core values of its millennial customer base, who areincreasingly focused on transparency, sustainability and integrity to inform their brand choice and purchasingdecisions. Furthermore, MADE’s prioritisation of sustainability and control of its supply chain distinguishesit from its competitors and positions it well to handle expected future changes in regulations andenvironmental standards around sustainability. MADE is also enabled to take advantage of future growthopportunities and expand into new geographies on the front foot while competitors are forced to react toadapt their business models.
Highly attractive financial profile reflecting superior business model
MADE’s financial model has enabled a proven track record of rapid growth, profitability and cash efficiency.In the period from 2015 to 2020, MADE grew its active customer base at a CAGR of 38% to 1.1 million
13 Reflecting the percentage of products that are not discontinued after one year.
33
(of which active customers in the UK and Continental Europe grew at CAGRs of 32% and 47%,respectively), driving gross sales CAGR of 36% to £315 million (of which gross sales in homewares andfurniture increased by CAGRs of 53% and 32%, respectively). MADE’s net revenue growth rate wastemporarily impacted by disruption from the COVID-19 pandemic which resulted in revenue recognitionrelating to customer sales made in 2020 being deferred to 2021.
The Group has achieved growth across all its geographies – in the United Kingdom, gross sales grew at aCAGR of 28% from £48 million in 2015 to £165 million in 2020, while gross sales in Continental Europegrew at a CAGR of 49% over the same period from £21 million to £150 million. MADE has achieved asimilar gross sales growth profile to the United Kingdom across its Continental European markets.14
Repeat orders have increased as a percentage of total orders to 48% in the United Kingdom in 2020 from35% in 2015 and to 34% in Continental Europe in 2020 from 22% in 2015, driven by growing andpredictable retention and increased orders per customer related to range extension resulting in 100% grosssales retention beyond the second year of a customer cohort. The high and increasing repeat order rate hasdriven an increasing ability to forecast supply requirements and improve marketing efficiency. Order volumesfor the same period in the United Kingdom increased by 34% to 727,000 in 2020 from 170,000 in 2015and in Continental Europe by 48% to 649,000 in 2020 from 91,000 in 2015.
MADE is typically profitable on first order in both the United Kingdom and Continental Europe, withcustomer acquisition costs (“CAC”) expected to improve further as the business matures. In 2020, averageorder value (“AOV”) and net contribution on first order after fulfilment and marketing costs was £235 and14%, respectively in the United Kingdom and £236 and 3%, respectively in Continental Europe. On arepeat order basis in 2020, AOV and net contribution after fulfilment and marketing costs was £219 and25%, respectively in the United Kingdom and £220 and 25%, respectively in Continental Europe.
In 2020, the United Kingdom delivered 13% Adjusted EBITDA contribution margin, and other core marketsincluding DACH (Germany, Austria and Switzerland) and France were also profitable in 2020. Over2018-2020, the Group made a one-off strategic investment in its team, platform and infrastructure to supportgrowth at scale, which impacted the Group’s Adjusted EBITDA margin, but has positioned the business forfurther growth. The Group also made a one-off investment into its logistics platform in 2019, updating mostof its warehousing and splitting out the supply chain between the United Kingdom and the EU inanticipation of Brexit.
MADE’s asset-light business model drives structurally attractive margins, with relatively low capexrequirements and negative working capital ensuring high cash conversion. Capex investments in 2020represented 2.3% of net revenue, following investments in scalable infrastructure through 2018 and 2019which saw capex at 4.1% and 4.2% of net revenue respectively. Net working capital as a percentage of netrevenue in 2020 was (24%), higher than (12%) delivered in 2018 and (11%) delivered in 2019 as aconsequence of a temporarily extended lead time offering to customers due to COVID-19 related supplychain disruptions.
Experienced management team
MADE has a highly experienced and digitally native management team with a proven track record andextensive experience working with leading global brands. The Group is led by Philippe Chainieux, CEO,who joined MADE in 2013, with more than 20 years of experience leading e-commerce businessesincluding Match.com and Meetic. Adrian Evans, CFO, joined MADE in 2017, with previous experience inonline fashion group YOOX NET-A-PORTER, where he held various senior finance and commercial rolesover 10 years. Nicola Thompson, COO, joined MADE in 2019, with previous experience as a GlobalCustomer Development Director at an online fashion and cosmetic retailer, ASOS Plc. Susanne Given servesas Chair, with more than 25 years of experience in leading brands including SuperGroup PLC. Amongothers, Susanne also currently sits on the boards of Morrisons, Hush Homewear, Tritax Big Box REIT PLC,Trent Holdings Ltd and Al-Tayer Insignia. Additional hires have been made to build MADE’s organisationalcapabilities and further promote entrepreneurship, creativity and sustainability.
Strategy
MADE aims to scale in existing markets by continued investments in operational excellence and brandawareness, scale its curated homewares platform and expand internationally.
14 The level of growth in MADE’s Continental European markets being dependent on MADE’s maturity within the particular market.
34

Scale in existing markets
Invest in operational excellence
MADE continues to invest in technology, infrastructure and supply chain to unlock further value and enablegrowth. One of MADE’s key focus areas is the continued reduction of lead times to customers, a metricwhich is strongly correlated to traffic conversion and topline performance. As the business scales anddisruption from the COVID-19 pandemic normalises, MADE expects to continue to shorten lead times,further invest in working capital and utilise supplier relationships. MADE expects to achieve this by takingadvantage of its just-in-time predictive model. MADE will also continue to invest in a variety of softwareand hardware functions, data analytics and modeling, supply chain operations, manufacturing processes, andadvanced quality and service assurance, and optimise stock positioning to ensure a positive customerexperience. Improvements in lead times should in turn improve conversion rates, frequency of purchases andunits per order, and minimise cancellations to support topline growth.
MADE is also focused on increasing retention by providing excellent customer support, leveraging itscustomer relationship management (“CRM”) platform and proprietary data on customer behaviour to engagewith customers in a more tailored way. A particular emphasis has been placed on monitoring customersatisfaction, by measuring customer feedback, monitoring reviews, contact per order ratios and trackingrepeat usage. These tools, combined with the wider range of products offered, particularly in homewares, areexpected to allow MADE to capture a greater share of wallet over the customer’s lifetime as they matureand invest more in their homes.
Invest in brand awareness
MADE is currently active in eight countries in Europe (including the United Kingdom), with its ContinentalEurope market comprising 48% of the Group’s gross sales in 2020. In Continental Europe, gross sales areconcentrated in France and Germany, with the rest primarily attributable to Benelux and to a lesser extent tothe other markets. Germany and France have demonstrated impressive growth trajectories, with Germanysurpassing the United Kingdom’s gross sales over the same respective period (relative to the year of marketentry). The brand has resonated well with a similar customer demographic across the United Kingdom,Germany and France, and MADE believes is perceived as being modern, stylish, innovative and high-quality.
Given its successful track record in scaling operations, MADE remains focused on further efforts to promotebrand recognition and leverage its successful marketing playbook. Historically, MADE has placed a lowerlevel of brand awareness investment into the major European markets of France and Germany compared tothe United Kingdom. Consequently, brand awareness in these regions lags behind the levels of MADE brandawareness in the United Kingdom. An indicator of awareness within MADE’s markets is awareness amongstthe ABC1 female demographic, as MADE’s core target base. In 2020, brand awareness for the ABC1female demographic in the UK stood at 43%, compared to 28% in France and 10% in Germany. MADEtherefore recognises a material opportunity to invest in enhancing brand awareness through France andGermany via one off tactical marketing investments. This is expected to be achieved in the context ofcheaper media costs than historical norms due to the COVID-19 pandemic.
Scale curated homewares platform
In order to deliver its longer term vision of making MADE the go-to destination for design-led homelifestyle products, MADE plans to accelerate the expansion of its homeware selection by developing acurated homewares platform (which will include, amongst others, an extension of ceramics, home fragrancesand home improvement categories). MADE plans to sell like-minded and curated third party homewarebrands on its platform, with products selected to complement MADE’s overall aesthetic, customerproposition and values regarding quality, affordability and sustainability. The initiative extends MADE’sexisting business model of building relationships with third party designers to one which also offers brandsand designers that have production capabilities, with access to MADE’s European wide digital customer baseand infrastructure. Due to the COVID-19 pandemic and store closures, routes to market via independentlocal stores for design brands have become more limited. Additionally, due to brand and customeralignment, targeted brands are more inclined to work with MADE rather than digital marketplaces. Theaccelerated expansion into homewares is expected to improve order frequency, retention and the lifetimevalue of each customer, with added benefits of improving MADE’s overall brand awareness and traffic,promoting sales of its other product offerings and reducing customer acquisition costs over time.
MADE already has 30 external artisan and independent brands (including, for example, SWARF and datcha)selling products on its curated platform, with plans to accelerate onboarding of further brands. MADE only
35

integrates, and expects to continue to only integrate, brands that have the same level of quality standards asMADE, which is assessed through onboarding and ongoing assessment. While products on the marketplaceare not, and will not necessarily be, exclusive to MADE, the curated platform offers, and is expected tocontinue to offer, an unrivaled access online to a large, design savvy customer base across Europe. MADEexpects that the curated homewares platform will enable it to build an additional range of between 5,000 to10,000 SKUs in the homeware category by 2025. Supported by investment in the platform, MADE plans toleverage its well invested infrastructure and tried and tested marketing playbook to support the expansion ofits homewares proposition.
There are a number of changes from both a technology and supply chain perspective that MADE intends tomake to support the scalability of its curated homewares marketplace expansion. With respect to supplychain for example, updates are largely expected to be around making sure that MADE systematises inboundprocesses to deal with smaller and more frequent deliveries from more suppliers and that MADE’swarehouse storage and technology processes are suitable.
Further international and RoW expansion
With plans to roll-out its curated homewares offering in Europe already under way, MADE plans to furtherexpand its homewares platform internationally beyond Europe by 2023. The global homewares and furnituremarket opportunity is £504 billion with a very low global penetration of 15% (see Part IV: “IndustryOverview – Total Addressable Market”) and MADE believes it is well positioned to exploit the significantupside potential by expanding to other geographies. MADE plans to emulate the same international journeyof digitally native fashion players by beginning to ship homewares parcels to international regions outside ofMADE’s existing footprint, utilising partnerships with international shipping providers and leveragingexisting European logistics infrastructure. MADE’s international expansion is based upon replicability of itscurrent model and use of existing platform, stock base and infrastructure.
Medium-Term Ambitions
In accordance with MADE’s business plan, MADE is targeting gross sales of greater than £1.2 billion peryear by the end of 2025. Additionally, MADE aspires to deliver medium term Adjusted EBITDA in the lowteens as a percentage of net revenue. These ambitions are based upon a number of key assumptions(including growth in online penetration and market conditions), which are discussed underPart VIII: “Operating and Financial Review – Recent Developments, Current Trading and Prospects”. Theseambitions and related assumptions constitute forward-looking statements, which are not guarantees of futurefinancial performance and the Group’s actual and future results could differ materially from those expressedor implied by these forward-looking statements as a result of many factors, including but not limited tothose described under Part II: “Presentation of Financial and Other Information – Forward-LookingStatements” and Part I: “Risk Factors”, including “MADE’s future results may differ materially from what isexpressed or implied by the medium-term ambitions included in this Registration Document and investorsshould not place undue reliance on this information.”
History
MADE was founded in 2010 by Ning Li, Brent Hoberman, Chloe Macintosh and Julien Callède, andlaunched its first website in the United Kingdom that year. After the launch of the UK website, MADE hasgradually expanded its product offering, starting with upholstery, then furniture and more recentlyhomewares (including home and kitchen accessories) and lifestyle categories (offering products in relation tocycling, travel and pets). In parallel to its product offering expansion, MADE commenced its internationalexpansion by launching its French website in January 2013, followed by websites for a number of otherEuropean markets from 2013 to 2018, with Spain being the latest market that it entered in 2018. MADEalso entered Italy in 2013 via a partnership with a multi-media publishing group, in order to test the marketand partnership model. The organic option was successful, however, in this case, the partnership model didnot prove to be as efficient a route to market as entering the market directly and MADE therefore decidedto terminate the partnership in 2016. In 2019, MADE ‘soft launched’ its position in Sweden and Denmark,with an English language site. Initial indications within the market were positive, however, in early 2020,following the COVID-19 pandemic impacting Europe, MADE decided to focus on other core markets andso, given the early stage of the launch, halted sales to Sweden and Denmark.
MADE is headquartered in the United Kingdom, with local offices in its key trading markets, in France,Germany and the Netherlands, as well as sourcing offices.
36

MADE has built a large global sourcing network to support its product offering expansion. Alongside thesourcing initiated in the United Kingdom and in Europe, the Group opened a first sourcing office in 2011 inShanghai and a second sourcing office in 2016 in Ho Chi Minh City. The sourcing offices are dedicated tofinding new factories, managing existing factories, product development and quality control in Asia.
MADE has also opened showrooms across Europe, with the objective to provide a physical brandexperience to customers. MADE’s showrooms are localised in top European cities, where it has the mostconcentrated customer base. The first showroom was opened in London in 2012 and is now based in Soho,central London. MADE now additionally operates (directly and through a third party concession showroom)in six other showrooms, in Paris, Lyon, Berlin, Hamburg, Amsterdam and Redbrick (near Leeds, UK).
Products
MADE’s product offering consists of furniture and homeware products including sofas, chairs, tables, beds,storage (including wardrobes, cabinets, bookcases, TV stands, storage benches and other storage and utilityitems), lighting (including floor lamps, table lamps, bedside lamps and lamp shades), home furnishings(including cushions, curtains, wallpapers, rugs and bedding sets) and garden furniture and accessories.
MADE designs and curates an ever-changing design range, with on average nine new product collections15
launched per week and around 40%16 of the range being renewed every year, with 1,790 SKUs17 indevelopment at any one time and 3,000 SKUs released in a year.18 MADE’s typical product life cycleaverages at around 3.5 years. In contrast to the industry norm of 12-18 months, MADE’s concept-to-productprocess (starting with the concept idea from the designer/trend, followed by detailed concept design sketchesand technical drawings that are delivered to MADE’s on-the-ground teams for sample development, toproduction, packaging development, testing and inspection, leading up to an on-site launch when the producthas shipped) is based on a typical timeline of four to six months. This timeline is achieved as a result ofnot working with the traditional seasonal collections (typically two per year) but rather MADE’s capsulecollections, launched weekly, through MADE’s test and learn process, which is an agile process notrequiring MADE to stock collections in advance of sales. This allows MADE to refresh its product offeringcontinuously and address evolving customer tastes and needs, as well as to diversify its catalogue into newcategories such as home accessories (which includes, for example, wall art, mirrors and dinner sets). Theresulting variety and designer quality of MADE’s products, combined with affordable prices, results in astrong customer value proposition. The business model also ensures that average markdown levels are low,with average markdown being in the range of a single digit percentage.
MADE has a holistic single vision for an inspiring, well segmented, eclectic collection. Each design is astandalone piece, uniquely created for MADE by world-class designers, enabling MADE’s customers tocurate their life at home, with products such as the following:
Sofas Rugs
15 Refers to a 2021 figure for homeware and furniture. Collection is defined as a capsule range of more than one SKU. The concentration of anew collection and SKU release is always spread across a range of designers to cover the breadth of categories and styles in line withMADE’s renewal approach.
16 Figure refers to new SKUs as a percentage of live SKUs (excluding clearance) throughout a year (current figure based on 2020 data).17 Figure reflects the average over a three-year period from 2018 to 2020.18 Refers to new SKUs launched in 2020.
37

Dinnerware Tables
Chairs Cushions
Beds Bedding
Storage Lighting
38

Outdoor Furniture Outdoor Accessories
Desks Wall Art
For product images and videos, MADE maintains its own photographers, videographers and studio facilitiesacross London, China and Vietnam in order to maintain image consistency and to create a point ofdifference from other brands. While some of the product images and videos are taken in the local offices inChina and Vietnam, the final images are retouched and produced in London, where MADE is in the processof moving its studio location to increase its capacity.
Relationships with Designers
MADE works with over 150 established and up-and-coming designers, artists and collaborators bothin-house and externally, typically on the basis of license agreements or freelance agreements. UnderMADE’s standard designer license agreements, the designers receive royalty payments (as a percentage ofnet delivered revenue, which varies based on product category) and grant MADE an exclusive global licensefor the indefinite use of the intellectual property relating to the design. Some designers work under MADE’sdesigner freelance agreements, pursuant to which the designers are generally paid a fixed fee for theproducts they design, with the intellectual property relating to the design transferred to MADE uponpayment of the fee to the freelance designer. The designers operating under MADE’s license agreements aswell as freelance designers are generally named by MADE on its website as collaborators. MADE’sin-house designers are salaried employees who also receive a bonus based on certain KPIs. The majority ofMADE’s designers work on other furniture, homewares and interior design projects, typically for high-endhome brands, and MADE welcomes the external experience, customer insight and industry intelligence thatthe designers bring to its brand. Many of MADE’s designers return to work with MADE on diverse projectsover a period of time. MADE believes that designers and artists are incentivised to work with MADE,beyond just the royalty payments they receive, as they are attracted to MADE’s platform and infrastructure(which enables their designs to be transformed into products quickly), as well as a wide market audience.MADE is committed to fostering a network and environment in which artists and designers feel inspired andshare similar values, including with their customers, who they have the chance to meet through showroomsand other digital experiences. MADE’s average relationship with designers is over three years.
39

MADE’s interaction with its in-house and external designers is throughout the design and productionprocess. The interaction begins with MADE creating a brief in conjunction with the designer, with MADEthen receiving the initial concept from the designer and providing feedback to the designer, based on fit tobrief and aspirations. Adjustments are made until both parties are satisfied with the design and finaldrawings are submitted to the MADE team. During the product sampling process, sample reports are sharedby MADE’s development team with the designer and MADE’s design team, with final samples signed offby both parties.
In addition to partnering with leading designers for curated, unique designs, MADE also partners without-of-industry tastemakers, brands and influencers across various industries including fashion and jewelleryand outdoor clothing.
Customers
Approximately 49% of MADE’s customers are under 35 years old. Young, digitally native, affluentconsumers are the core pillar of MADE’s customer base. In addition to Millennials and Generation Zbuyers, who comprise approximately 45% of MADE’s total customer base, MADE’s key customerdemographics also extend to affluent Generation X buyers, who form approximately 33% of MADE’s totalcustomer base. In addition, approximately 53% of MADE’s customer base is formed of affluent homeownersin the United Kingdom. As MADE’s core customer cohorts start to age, form families, and mature into thehome market, MADE expects online sales of home goods to increase. MADE anticipates that the currentmillennial generation will be a key driver of growth in the furniture and homeware market as they entertheir prime home formation ages over the next five years, when they are forecasted to comprise 38% of theoverall home buying population.
MADE has a large, active and loyal customer base, with approximately 1.1 million active customers in 2020and approximately 1.2 million active customers in the last 12 months to the end of the first quarter of 2021.MADE has a high percentage of repeat purchases across the various markets in which it operates, withrepeat purchases constituting approximately 48% of orders in the United Kingdom in 2020.
MADE generally contracts with its customers on standard sale terms and conditions, which are notnegotiated with customers. Customers are entitled to cancel orders free of charge at any time prior todispatch, and can generally return products up to 30 days after delivery. MADE has historically had low,single digit cancellation and return rates.
MADE’s customer service is focused on after sales service including handling customer enquiries andmanaging returns and order cancellations. It has established dedicated, multilingual in-house customer serviceteams across its local markets, which are supported by flexible third party resources and operations,engaging with customers via a variety of methods including through web live chat, email, WhatsApp andcalls.
MADE values customer feedback and regularly uses Trustpilot data to create tactical and strategicimprovements. MADE’s customer satisfaction is demonstrated in its “Excellent” UK Trustpilot rating, whichis based on more than 89,000 reviews. MADE has received similar ratings across its other core geographies.
Supply Chain
MADE’s flexible, streamlined, vertically integrated supply chain lies at the core of its business model andallows it to deliver high-end design at accessible prices. The supply chain consists of: (i) productdevelopment and sourcing and (ii) logistics, last mile delivery and reverse logistics.
40

Product Development and Sourcing
MADE’s design, product development, quality and sourcing team is the largest team in the organisation. Theteam is located across London, China and Vietnam and works as one global, vertically integrated teamacross all functions and processes. The team is led by directors and heads of department across the threelocations and is overseen by MADE’s global product director. The team covers the entire product lifecycle,from concept design to development through to production, ordering and quality control. MADE’s on theground teams ensure that all materials and processes the products go through, and working conditionsthrough its supply chain, are up to its high standards.
Supplier base
MADE has a geographically diversified, scalable supplier base, consisting of a network of over 200 factoriesglobally across, amongst other, China, India, Vietnam, the United Kingdom and Continental Europe. MADEaims to de-risk its supply chain by engaging a broad range of major and minor suppliers, eliminating thedependency on a limited group of suppliers. No supply partner contributed more than 6% of MADE’s grosssales for 2020. This operational model has enabled MADE to consistently expand intake margins (which,pre-freight costs, royalties and agent commissions, increased from 54.4% in 2015 to 63.0% in 2020 atconstant currency) by increasing scale, continuing spread and efficiency in its supply base and directsourcing of raw materials with deeper integration.
MADE has adopted a set of standards that it applies across its supplier base, including with respect tosupplier on-boarding, manufacturing processes and raw materials traceability, to ensure that quality isembedded in its products. It has robust processes in place to ensure that production standards are maintainedand that international quality standards are applied in its supplier selection process.
In addition, MADE strives to ensure the traceability of raw materials used in its products and followsapplicable regulations in relation to products, packaging and due diligence. See this Part V: “BusinessOverview — Regulatory Environment” below. Most of MADE’s quality management is performed by its in-house teams, with the exception of MADE’s newer supply regions, where inspections are currentlyperformed by external agencies, with a plan to perform these functions in-house in the future, when theappropriate scale is reached. MADE’s quality procedures include, amongst others, product brief and technicalspecification checks, setting of acceptable performance standards, review of samples and final inspectionchecks of products.
Focus on sustainability
MADE’s products are created with a business-wide focus on sustainability, which is managed by itssustainability team who are dedicated to creating and improving MADE’s sustainability strategy. Thesupplier focus of the sustainability strategy is on using 100% sustainably sourced materials, such as recycledvelvet, upcycled/sustainable cotton, responsibly sourced timber and other new innovative materials for themanufacture of MADE’s products by 2025. In addition, MADE seeks to partner with suppliers who usesustainable, environmentally-friendly materials and packaging, and who share its commitment to ensure ameaningful reduction in plastic waste and its sustainability strategy which sets forth a commitment to using100% recycled or recyclable packaging by 2025. While production sustainability is primarily achievedthrough careful factory collaborations and control teams on the ground, MADE has put in place, and isdeveloping, certain initiatives focused on reusing, refurbishing and re-cycling of its products. Through agive-away platform, which MADE has launched in partnership with Geev, a third party donation platform,MADE seeks to encourage customers, when purchasing a new item from MADE, to list the furniture theyare replacing on the third party platform, with a proportion of the customer’s original order value convertedinto a charitable donation. It is intended that a take-back programme, which MADE plans to launch in thecoming years, will allow customers to return their old MADE furniture items directly to MADE to bereconditioned for a second life. MADE is also focused on avoiding overproduction and waste and generallyhas no stock write-offs. For further detail on MADE’s sustainability targets see this Part V: “BusinessOverview – Key Strengths – Disruptive, vertically integrated business model with strong competitive moats –Sustainability” above.
Small batch production and stock efficiency
MADE’s strategy with respect to development of its products rests on two key pillars, small batchproduction and stock efficiency. Its supply base, sourcing relationships and partnership approach enablesunique “little and often” (i.e., “test and learn”) small batch production, which differs from the industry normof high volume seasonal buys. MADE’s “just in time” supply chain model, the core of which is small batchproduction, enables it to achieve competitive lead times without increasing warehouse stock cover above a
41

general level of 30 days. This model allows MADE to launch and test new products constantly with theflexibility to reorder or discontinue most product lines at short notice, resulting in less risk and relativelylimited financial impact if a particular product does not sell well. By way of an example of MADE’s “justin time” supply chain model efficiency, 59% of its products are presold at arrival in ports and around 56%of its stock is usually in transit. With this strategy in place, MADE’s average rate of sale per SKU hasincreased by 53% over the past five years and as volume grows across all product types, small batchproduction has increased MADE’s stock commitment efficiency. MADE has limited sales seasonality, withincreases in demand focused on industry-wide winter and summer discounting periods and cyber week. Dueto MADE’s “just in time” supply model and competitive initial pricing, a requirement for discounting toclear unsold stock is relatively limited.
As part of its asset-light business model, MADE outsources the manufacturing process to more than 200factories globally, including 69 factories in China, 41 in India, 35 in Vietnam and 44 in the UnitedKingdom and Continental Europe as of the date of this Registration Document. With its on-the-groundpresence, MADE is able to monitor and input significantly into the manufacturing process despite the factthat this is outsourced to contract manufacturers.
Logistics
MADE has made significant investments in infrastructure and staff across its logistics platform which isresponsible for global shipping, warehouse operations, home delivery and reverse logistics.
Global shipping
MADE’s global shipping is managed via a number of freight forwarders, enabling MADE to contribute tothe creation of a competitive freight marketplace. The Group carries out a competitive tender process eachyear with respect to its shipping partner base. The majority of MADE’s shipping derives from China,Vietnam and India.
Warehouse operations
United Kingdom. MADE’s United Kingdom warehouse logistics operations are principally managed via twosites, one in-house and the other through a third party logistics provider.
* Furniture. MADE’s furniture warehouse logistics are operated in-house from a site located on DPWorld Logistics Park at the port of London Gateway (with an 11-year lease agreement). Thewarehouse measures 225,000 square feet in space, handles approximately 750,000 units per year, hasan average SKU range of 2,300 and is operated by an in-house workforce consisting of approximately40 employees. The facility has a potential to scale, with the development of an additional 350,000square feet leased site having been secured and to be delivered in 2021 and 2022.
* Homewares. MADE’s homeware logistics are principally operated by iForce, a third party logisticsprovider (with a flexible contract, providing the ability to increase space, that expires in 2024) from awarehouse located in Redditch. The warehouse measures 70,000 square feet in space, handlesapproximately 1.6 million units per year, has an average SKU range of 2,100 and is operated by athird party workforce consisting of approximately 25 people. The facility has a potential to scale, withan additional 30,000 square feet space secured and to be delivered in 2021.
Continental Europe. MADE’s logistics operations in Continental Europe are managed via two sites inAntwerp, operated by Katoen Natie, a third party logistics provider (with a contract that expires in 2022,which is expected to be extended). The Antwerp hub distributes across seven countries in ContinentalEurope, in which MADE operates. The sites collectively measure 380,000 square feet in space, handleapproximately 2 million units per year, have an average SKU range of 5,800 and are operated by a thirdparty workforce consisting of approximately 70 people. The facilities have a potential to scale, with anadditional 140,000 square feet space secured and to be delivered in 2021.
Home delivery
MADE’s last-mile delivery strategy is underpinned by an experienced, dedicated team that manages anddevelops its home delivery relationships with third party carriers, which can be broadly divided into parcelcarriers and two-man carriers. With respect to both parcel and two-man carriers, MADE partners withleading third party carrier specialists in each country, who provide local services that meet the needs of itscustomers. The continual review of delivery logistics contracts and processes allows MADE to optimisecosts to serve opportunities and to operate efficiently. MADE dispatched approximately 2.2 million itemsacross the United Kingdom and Continental Europe in 2020.
42

Reverse logistics
MADE also operates its own UK returns hub, which is located in Ipswich, where it has built the capacity tore-box, replace, repair and restitch returned products to a high quality condition. This allows approximately60% of returned products to be turned into back-to-good stock and ensures a 0% landfill, with remainingproducts either sent to auctions or gifted to charities in a high quality condition. The returns hub is acritical source of knowledge as it provides a feedback loop, by enabling the in-house assessment of thereasons for returns, that are tracked in MADE’s system, highlighting quality control issues or handlingproblems during transit and enabling MADE to facilitate its long term commitment to manage the end-of-life of its products. The same operations are outsourced for the returns of its customers located inContinental Europe.
In addition to the return of any damaged products, which MADE has the ability to replace or repair in itsreturns hub (which constitutes a smaller number of returns), the main reasons for returns generally relate toissues such as wrong product size for a particular space as well as a small amount of returns relating todelivery problems. MADE is constantly looking for ways to reduce any returns. For example, MADE hasput in place a ‘sofa sizer’, which helps customers understand whether a sofa will fit in their space, and alsoan augmented reality feature, which enables visualisation within the space.
Marketing
MADE has an established marketing approach that has enabled it to acquire customers in a highly costeffective way. MADE’s customer acquisition and retention activity is aimed at attracting lifelong customersrather than acquiring traffic to convert to a one-time customer transaction. MADE continuously builds andimproves its marketing models and strategy using valuable feedback from data analytics. Over time, MADEhas continued to improve marketing efficiencies as it continues to develop its product range, increase brandawareness in local markets and improve repeat order rates. Increasing brand awareness and repeat order rateshave resulted in an increased mix of direct traffic. During 2020 and in the first quarter of 2021 a reductionin retailer demand for marketing due to the COVID-19 pandemic and increased customer demand hasresulted in enhanced marketing efficiency. This has been at least, partly offset by a longer lead-time offeringto customers as supply chains have been disrupted due to the COVID-19 pandemic.
MADE’s marketing strategy can be divided into the following three categories:
Brand marketing
Brand marketing includes outdoor advertising, TV advertising and other brand activation activities. Theobjective of brand marketing is to increase brand awareness and customer engagement across the Group’score markets by building a connection with the customer that goes beyond the transaction. MADE’s brandmarketing involves a mix of traditional above-the-line media, social, content and advocacy-based marketing,which is predominantly targeted at a digitally native, millennial audience that forms the majority of MADE’scustomer base. MADE actively engages with its communities on social media, including Instagram (where ithas approximately 1.3 million followers and received 24,200 mentions of aMADEdesign and 41,600mentions of aMADEdotcom), Facebook (where it has approximately 1.8 million followers) and Pinterest(with over 10 million monthly views)19 and has a growing network of influencers (engaging with around800 influencers per month and with just over 3,000 influencers in total in 2020).
Performance marketing
Performance marketing consists of digital variable marketing channels and is based on a data-drivenapproach to target high potential customers through the use of propensity models and personalised customer-relationship-marketing tools. MADE seeks to leverage its marketing efforts to acquire new customers andultimately convert its new customers into long-term, high-value customers that will return to MADE fortheir furniture and homeware products. Through data analytics, which uses a combination of new andhistorical data and data models and predictive algorithms that generate accurate customer forecasts andpredictions, MADE has visibility into future expected revenues from customers visiting its website.
Other marketing
Other marketing principally consists of (i) social influencer activities (including in-house team and activationactivities through the Group’s social platform), (ii) showrooms in the Group’s core markets that are used toshowcase product and increase brand awareness including via organisational events and (iii) non-workingmedia, including designing and producing marketing assets and photo shoots.
19 Figures obtained from Instagram, Facebook and Pinterest on 8 April 2020.
43

As of 31 March 2021, MADE had seven showroom locations to engage with customers and showcase itscurated collections and designs.
Technology
MADE’s technology platform provides a seamless front-end online customer experience and an efficientback-end platform. The customer facing e-commerce platform includes eight local websites in languagesincluding English, French, German, Dutch and Spanish. The customer-facing system is designed toaccommodate increases in customer traffic and to allow MADE to roll out into new countries and categoriesquickly.
MADE has a dedicated in-house technology team (which formed approximately 50% of the entiretechnology team as of 31 March 2021), which is supplemented by outsourced technology personnel fromthird parties (43% of personnel being from a near-shore partner, with remaining 7% consisting of otherfreelancers as of 31 March 2021), who perform a variety of front office, back office and other technologyoperations and related functions across seven countries.
Highly scalable technical architecture
MADE’s technology platform is a flexible ecosystem of third party and bespoke software components.Best-in-class third party services such as a CRM (“Customer Relationship Management”) system, a CMSsystem (“Content Management System”) and a PIM (“Product Information Management”) system areencapsulated to avoid vendor lock-in. Other parts of the platform such as the bespoke customer-facingcatalogue experience and SEO tooling are developed in-house. The overall architecture is one of 40independent “micro-services” which collaborate through “event sourcing” as a highly available and highlyscalable communications backbone.
Cloud based infrastructure
The third party services used by MADE are predominantly software as a service (“SaaS”) platforms that aredesigned to allow for scalability. MADE’s own infrastructure is 100% cloud native, and operates acrossmultiple availability zones to ensure resilience. MADE’s website and back office operational systems arehosted by Amazon Web Services (“AWS”) where they scale on demand. All content is delivered toconsumers through efficient global content delivery networks.
Data warehousing and analytics are hosted in the Google Cloud Platform (“GCP”). The data lake includesoperational data, customer data, marketing data and logistics data. This data is processed through GoogleBigQuery into a data warehouse where it powers business intelligence reporting. It is also mined andactivated to optimise marketing activities, supply chain, website and merchandising. A dedicated team ofdata scientists use it for ad-hoc analysis and predictive modelling, which in turn feeds back into the datawarehouse.
Security and customer data
When expanding and operating its technology platform, MADE constantly focuses on security and reliability.To this end, MADE undertakes administrative and technical measures to protect its systems and theconsumer data that those systems process and store (for example, cloud storage, data encryption, virtualprivate networks). MADE has developed policies and procedures designed to manage data security risks(including disaster recovery planning, penetration and security testing), and implemented various securitymeasures, including password security, firewalls, automated backup systems and high-quality antivirussoftware.
MADE seeks to use customer data responsibly and has established clear guidelines in connection with datacollection, storage and processing. Data is stored securely in line with the legal frameworks of the relevantjurisdiction, with appropriate controls and regular audits. MADE is transparent about its use of data in itsprivacy policy and other notifications that it provides to customers as necessary. It has established processesin place to ensure that any collection of new data, or the use of data for a new purpose, is doneappropriately. MADE engages in a yearly penetration test, performed by a third party, which covers thewebsite (front-end, network and application programming interfaces) as well as the mobile iOS applicationand the internals of the cardholder data environment. MADE also has incident management procedures withrespect to cyber-attacks and other information technology related incidents.
44
Technology Investments
MADE has made significant investments over the last three years including:
* Re-platformed front office. Investments include the development of a catalogue built on top of ascalable search engine back-end, the adoption of modern Facebook inspired technology stack (Reactand GraphQL), and a unified technology stack for client apps for web, mobile and showroom;
* Enhanced control and integration in the back-office. Investments include four warehouse migrations,enhanced logistics chain insights (tracking last mile delivery, visibility into freight forwarding, reverselogistics), business process automation, and improved internal tooling; and
* Data platform. Investments include completion of data pipeline supporting re-platformed front- andback-office, ability to ingest and mine data at scale, and an ability to activate that data to optimisebusiness areas. As discussed in this Part V: “Business Overview — Marketing” above, MADE usesdata analytics to tailor its marketing strategy and adapt its business.
MADE’s single platform provides a uniform view of every key stage of the product journey from the initialpurchase order to a supplier, to arrival at the warehouse, to dispatch for final delivery – and is synchronisedwith the customer-facing site, continually updating product availability and lead times in real time. Theplatform also provides analytics, forecasting and optimisation capabilities for MADE.
MADE intends to continue to invest in its technology platform in order to support future business growth.
Intellectual Property
MADE owns, licenses or has the right to use various trademarks, design rights and other proprietary rightsthat are important to its business, including registered and unregistered trademarks, design rights, copyrights,domain names and other intellectual property.
MADE has a portfolio of registered trademarks which currently consists of 36 registered trademarks in theUnited Kingdom, the EU (through EUTMs which offer protection throughout all of the EU member states),China, South Africa, WIPO and various other jurisdictions, and a pending trademark application in each ofChina and the EU. MADE’s primary marks which are the subject of registered trademark protection and/orapplications are shown below:
MADE MADE.COM
MADE’s intellectual property portfolio includes numerous domain names for websites that it uses in itsbusiness. In addition, MADE has copyrights, technology, know-how processes and other intellectual propertyrights that are not registered. MADE relies on a combination of trademark law, copyright law, non-disclosure and confidentiality agreements and provisions in agreements and other measures to establish andprotect its proprietary rights to its products, packaging, processes and intellectual property.
MADE owns or licenses and in certain cases registers intellectual property rights in designs and copyrightarising as a result of its in-house and external designer collaborators. MADE registers a portion of its newdesigns every six months as part of its robust portfolio management and expansion and strives to keep itsintellectual property protection up to date. It selects its most valuable and/or unique designs to register andsuch registered design portfolio forms a subset of the total number of designs owned by MADE. There mayalso be unregistered design rights subsisting in those designs arising in certain jurisdictions such as the EUand the United Kingdom.
45
Property
The following table lists MADE’s material properties as at the date of this Registration Document:
Name and Location Tenure Lease expiry
OfficesLondon Office, Singer Street. ....................................................................... Leasehold December 2027Ipswich Customer Services Office, Claydon Business Park ........................ Leasehold January 2023Amsterdam Office, Keizersgracht ................................................................. Leasehold December 2029Berlin Office, Rosenthaler Strasse.. .............................................................. Leasehold September 2026Paris Customer Services and Logistics Office, Notre Dame de Victoires.. . Leasehold May 2026Paris Marketing Office, Etienne Marcel. ...................................................... Leasehold March 2028Shanghai Office, Zhaohua Road. .................................................................. Leasehold December 2022Ho Chi Minh City Office, Xuan Thuy ......................................................... Leasehold August 2022ShowroomsLondon Showroom, Charing Cross Road..................................................... Leasehold December 2027Redbrick Showroom, Bradford Road. .......................................................... Concession N/AAmsterdam Showroom, Raadhuisstraat.. ...................................................... Leasehold June 2029Berlin Showroom, Rosenthaler Strasse......................................................... Leasehold August 2026Hamburg Showroom, ABC Strasse .............................................................. Leasehold January 2024Paris Showroom, Etienne Marcel ................................................................. Leasehold March 2026Lyon Showroom, Jarente .............................................................................. Leasehold March 2028Logistics CentreDP World Logistic Centre, London Gateway............................................... Leasehold February 2024(1)
—————Notes:(1) The facility has a potential to scale, with the development of an additional 350,000 square feet leased site having been secured and to be
delivered in 2021 and 2022.
Insurance
MADE maintains insurance policies across its countries of operation covering a range of risks related to itsbusiness, including, but not limited to, public and product liability, employer’s liability, carriage of goods,property damage, business interruption, cyber risk, director and officer cover and certain other customaryinsurance policies as required by local laws, subject to customary limitations and exclusions. MADEengages an insurance broker to assist in securing appropriate insurance coverage and reviews its coveragewith its broker periodically. The Directors believe that MADE’s insurance coverage, including the excess set,maximum coverage amounts and terms and conditions of the policies, are consistent with customary industrypractices in the countries in which MADE operates.
Regulatory Environment
MADE is subject to laws and regulations in the jurisdictions in which it operates that affect companiesconducting business online, including regulations related to consumer protection, advertising, distance selling,privacy, data protection, intellectual property, product liability, health and safety, competition, taxation, andeconomic and other trade prohibitions or sanctions. By way of an example, MADE’s online sales toconsumers in the United Kingdom are subject to the UK Consumer Contracts (Information, Cancellation andAdditional Charges) Regulations 2013. In general, this gives consumers the right to return products for anyreason within a period of 14 days after the date on which goods are delivered. MADE currently offerscustomers an extended returns period of 30 days in relation to most of its products.
MADE’s activities involving the use of customer data are subject to data protection laws and regulationsand, in many of the jurisdictions in which it operates, such data protection laws and regulations haveincreased in recent years. For example, the GDPR and the UK Data Protection Act 2018 significantlychanged the data protection landscape in the EU and the United Kingdom, strengthening the rights ofindividuals, imposing stricter controls over the processing of personal data by both controllers andprocessors of personal data, increasing the notification obligations that apply in the event of a data breachand increasing the sanctions for failure to comply with the relevant regulations.
In addition, MADE is also subject to all EU regulations regarding sustainability, including the EUTR, whichwas adopted in 2013 to prohibit the circulation of illegally logged wood in the EU.
46

MADE’s set of standards in relation to its supply chain reflects the requirements of the various UK and EUregulations that apply to it and covers the following areas: (i) product standards (including mechanical,assembly, labelling and marking and labelling standards), (ii) packaging standards, (iii) transit standards,(iv) shipping standards, and (v) due diligence standards. In applying and observing these standards to ensurecompliance with all applicable regulations, MADE engages in testing and assessments, including, by way ofan example, testing of all products (including leather, fabric, glass and ceramic materials) that come intocontact with food or skin, testing and assessments of lighting products (including with respect to voltage),product durability and safety assessments, fire hazard assessment, assessment of labelling and markingstandards and product drop testing and container inspections.
Modern Slavery
MADE operates a number of policies and practices to ensure that it minimises the risk of harm associatedwith modern slavery and human trafficking, as well as related matters such as unsatisfactory workingconditions and discrimination. These policies are also designed, more generally, to ensure that MADE isconducting business in an ethical and transparent manner.
In relation to its own workforce, these policies include MADE’s (i) recruitment policy (MADE conductseligibility to work checks for all employees globally to safeguard against human trafficking or individualsbeing forced to work against their will), and (ii) employee policies (MADE’s employee handbook includespolicies on diversity, health and safety and grievance procedures).
In relation to its supply chain, MADE conducts due diligence checks on its suppliers, both before it startsworking with them and during the relationship. In addition, MADE generally requires its suppliers to makea number of contractual commitments to MADE pursuant to the supplier terms and conditions that theysign, including in relation to compliance with applicable laws relating to child working and bonded labor,workplace health, safety and welfare conditions. MADE’s suppliers also agree to assist and cooperate withMADE on any due diligence checks, audits and inspections that MADE undertakes to verify theircompliance with these commitments. Inspections of most suppliers are carried out periodically by MADE’sbuying and quality teams, based in the United Kingdom, China and Vietnam.
MADE recognises that its commitment to a zero-tolerance approach to modern slavery is a continualjourney which requires it to review, and where necessary, modify its processes on a regular basis. As such,MADE periodically reviews the effectiveness of the steps it has taken throughout the previous financialyears to ensure that there is no slavery or human trafficking taking place in any part of its business orsupply chains.
Employees
The average monthly number of employees (including directors), during each of the three years ended31 December 2020, 31 December 2019 and 31 December 2018 was 629, 527 and 429, respectively.
The following table sets out details of MADE’s employees by function as of 31 March 2021:
Employees by function (full and part time)31 March
2021
Casual Workers.................................................................................................................................... 13Customer Services and Experience ..................................................................................................... 203Executive, Finance, Legal, HR and Analytics.................................................................................... 65Global Marketing................................................................................................................................. 109Logistics............................................................................................................................................... 73Product and Merchandising................................................................................................................. 146Technology........................................................................................................................................... 57
Total..................................................................................................................................................... 666
47

The following table sets out details of MADE’s employees by location as of 31 March 2021:
Employees by location (full and part time)31 March
2021
China.................................................................................................................................................... 60France................................................................................................................................................... 48Germany............................................................................................................................................... 29Netherlands .......................................................................................................................................... 31United Kingdom .................................................................................................................................. 488Vietnam................................................................................................................................................ 10
Total..................................................................................................................................................... 666
MADE has a collective bargaining agreement in place in France, which sets out minimum practices coveringemployment-related areas such as remuneration and notice periods. It also has a works council in France,being a body regulated by applicable laws and regulations, comprising employee representatives, whosemembers have been elected by the employees, which has the right to be consulted on various employee-related matters.
Corporate Social Responsibility
MADE considers its approach to corporate responsibility through three stakeholder perspectives: people,communities and the environment. The overarching respect for customers, focus on the wellbeing of societyand the service/products MADE provides are embedded through its approach.
People
MADE’s employees are the vital connection between its products and customers. MADE has a global,dynamic and entrepreneurial team. Employee engagement is high, with Glassdoor, Inc. reviews, as at11 May 2021, reporting that 85% of employees would recommend MADE to a friend and 97% ofemployees approve of the CEO. MADE also regularly engages with its employees through a licensedemployee engagement platform and its own in-house developed surveys to secure feedback and enhance itsworking environment.
MADE is a global, diverse and supportive organisation comprised of an international team, and iscommitted to providing a diverse and inclusive workplace in each of its offices across the globe. MADE hasestablished a diversity and inclusion council dedicated to raising awareness and developing initiatives andcommitments across all areas of MADE’s business, building MADE’s talent pipeline and recruiting futureemployees, educating existing teams and embedding diversity into MADE’s designer pool. MADE is alsokeen on ensuring and promoting gender equality, with 40% female representation at C-suite level, 50%representation at the director level (below C-suite level), gender pay gap of 17.1%20 in the United Kingdomand negligible gender pay gap in Continental Europe. MADE also has its own in-house ‘Culture Club’which organises a variety of social events and activities, to further engage with its employees, enhance itscollaborative and supportive culture and deepen a sense of belonging within MADE.
MADE provides its employees with a variety of incentives and benefits including private healthcare,pension, life insurance, season ticket loans, free and unlimited access to development courses, 25 days ofholiday per year (in addition to public and bank holidays) as well as a paid day off each year to getinvolved in any community or charity volunteering, Everyday Flex policy (allowing employees to determinetheir start and finish times and discuss other flexible working arrangements) and employee and friends &family discounts for use on MADE’s website. In addition, employees who were employed by the Group asat 1 December 2020, were given the opportunity to participate in its MADE x Everyone Company ShareOption Plan, with equal share options offered to every employee across all levels in the organisation andacross all offices globally, with vesting periods over three years, commencing on 1 January 2021.
During the COVID-19 pandemic, MADE supported its employees in COVID-safe environments or withremote working.
20 Being the difference in mean (average) hourly pay between all men and women. This has decreased from 21.9% in 2019.
48

Communities
It is through collaboration with, and contribution to, its communities that MADE is able to deliver its goals.Its communities consist of third party partners and suppliers, local charities, and local communityorganisations. In response to the COVID-19 pandemic, MADE has donated over 2,500 items, includingsofa-beds, to NHS staff, at over 150 hospitals in the United Kingdom to help provide a resting place andrelief for keyworkers.
Environment
MADE has a four-stage sustainability strategy in place, consisting of (i) developing responsible sourcing,(ii) using fully recyclable packaging, (iii) putting in place give-away and take-back initiatives to refurbishand recycle old products, and (iv) customer transparency with respect to its sourcing and manufacturingprocesses.
MADE is committed to producing high-quality products that are made from sustainable, environmentally-friendly materials, and to that end, has developed a ‘responsible sourcing for key raw materials’ strategywith goals through to 2025, as further described in this Part V: “Business Overview – Supply Chain – Focuson sustainability” and this Part V: “Business Overview – Key Strengths – Disruptive, vertically integratedbusiness model with strong competitive moats – Sustainability” above.
In addition, MADE has put in place, and is developing, certain initiatives focused on reusing, refurbishingand re-cycling of its products. Through a give-away platform, which MADE has launched in partnershipwith Geev, a third party donation platform, MADE seeks to encourage customers, when purchasing a newitem from MADE, to list the furniture they are replacing on the third party platform, with a proportion ofthe customer’s original order value converted into a charitable donation. It is intended that a take-backprogramme, which MADE plans to launch in the coming years, will allow customers to return their oldMADE furniture items directly to MADE to be reconditioned for a second life. MADE is also focused onavoiding overproduction and waste and generally has no stock write-offs.
The final stage of MADE’s sustainability strategy consists of transparency to its customers, informingcustomers that its products are: (i) sourced responsibly, (ii) made from organic materials, (iii) packaged inrecyclable packaging materials, and (iv) that the factories in which the products are manufactured apply andobserve globally-accepted working standards and are subject to regular factory inspections.
The sustainability targets are part of the key performance indicators underlying the senior managementteam’s bonus calculations.
49

PART VI
DIRECTORS, SENIOR MANAGERS AND CORPORATE GOVERNANCE
DIRECTORS AND SENIOR MANAGERS OF THE COMPANY
Board of Directors
The Directors of the Company as at the date of this Registration Document, their age, principal functionswithin the Company and a brief description of their business experience and principal business activitiesoutside of the Company, are set out below.
Name Age Position
Susanne Given .......................................... 56 ChairNing Li ..................................................... 39 Founder, Vice ChairPhilippe Chainieux.… .............................. 48 Chief Executive OfficerAdrian Evans. ........................................... 43 Chief Financial OfficerBruno Crémel.… ...................................... 55 Non-Executive DirectorGeorge McCulloch ................................... 44 Non-Executive DirectorGwyn Burr ................................................ 58 Independent Non-Executive Director and Senior
Independent DirectorMatthew Price…....................................... 51 Independent Non-Executive Director
The business address of each of the members of the board of directors of the Company from time to time,including any duly constituted committee thereof (the “Board”) is 28 Irish Town, Gibraltar, GX11 1AA.
The management expertise and experience of each of the Directors is set out below:
Susanne Given (Chair)
Susanne is the Chair of the Group and a Non-Executive Director, having held the role of Chair since1 April 2016 and of Non-Executive Director since 29 June 2015. Susanne has extensive experience in topmanagement positions, having worked in the consumer-facing sector for 25 years. During her executivecareer, Susanne managed leading brands such as SuperGroup PLC, where she served as the Chief OperatingOfficer. In addition to Susanne’s experience with respect to leading executive positions, Susanne also has anextensive non-executive portfolio of companies where she served as a director, and currently sits on theboards of Morrisons Plc, Hush Homewear Ltd, Tritax Big Box REIT PLC, Trent Holdings Ltd, Al-TayerInsignia and Forward Partners.
Susanne graduated from Studenter Eksamen, Brønderslev Gymnasium.
Ning Li (Founder, Vice Chair)
Ning is the Vice Chair of the Group and a Non-Executive Director, having held the role of Vice Chair since1 January 2017 and of Non-Executive Director since 29 May 2015. As well as founding the Group andbeing its Chief Executive Officer until 31 December 2016, Ning founded Typology, a Paris based skincarebrand providing highly natural, vegan products and co-founded MYFAB, a Paris based décor and gadgetcategory business, where he served as the Chief Executive Officer until 2009. Ning has over a decade ofexperience as an e-commerce entrepreneur and has extensive experience in executive roles within thismarket.
Ning holds a Master of Science degree from HEC Paris.
Philippe Chainieux (Chief Executive Officer)
Philippe is the Chief Executive Officer of the Group. He joined MADE in 2013 as Managing Director,having held the role until his promotion to Chief Executive Officer on 1 January 2017. Philippe hasextensive experience in executive roles in public companies, having served as the Chief Operating Officerand later Chief Executive Officer of Meetic. During his time at Meetic, the company underwent an IPO andPhilippe helped to drive the company’s international expansion, leading to a merger of Meetic withMatch.com. Philippe also has a wealth of experience with digital businesses, having held senior executiveroles at ifrance.com, SFR (part of Vivendi Universal) and Fnac.com.
Philippe holds a degree from the École Centrale Paris.
50

Adrian Evans (Chief Financial Officer)
Adrian is the Chief Financial Officer of the Group, having held the role since 17 July 2017. Adrian hasspent most of his career scaling fast growing digital companies. Before joining MADE, Adrian held varioussenior finance leadership roles at THE NET-A-PORTER GROUP, including Group Financial Controller,Director of Strategy and Chief Financial Officer. He played a key role in the sale of the Group to YOOX tobecome YOOX NET-A-PORTER GROUP. Following the transaction, Adrian served on the Executive Teamas Commercial Director for two years before joining MADE.
Adrian holds a Bachelor of Science in Physics from the University of Sheffield and is an Associate of TheChartered Institute of Management Accountants.
Bruno Crémel (Non-Executive Director)
Bruno is a Non-Executive Director of the Group, having held the role since 29 June 2015. Bruno started hiscareer as a senior civil servant in the French Ministry of Economy, managing the privatisation of variousbanks and public insurance companies before being appointed Chief of Staff of the Minister of Economyand Finance for two years.
In addition to his considerable public sector experience, Bruno has 20 years of experience in seniorexecutive positions in the private sector. He was the CEO of Darty France, leading electricals retailer, ageneral partner and executive board member at LBO France and also held different senior executivepositions at worldwide retail leader Kering (CEO of PPR Interactive and Managing Director at Fnac). Brunocurrently serves as an independent director on the board of EDF. Bruno is also a general partner at Partech,specialising in growing digital companies and a board member at Rouje SAS, Evaneos, Exporo, M-Files Oyand SendinBlue SAS.
Bruno holds a Master of Science from the École Centrale Paris, graduated from the Institut d’EtudesPolitiques Paris and is an alumnus of the École Nationale d’Administration (Inspection Générale desFinances).
George McCulloch (Non-Executive Director)
George is a Non-Executive Director of the Group, having held the role since 15 December 2011. Georgehas extensive experience as a director of, and investor in, private and public growth technology companiesand funds. He is a founder, partner and co-CEO at Level Equity Management, LLC, a private investmentfirm that invests in growth-stage software and internet businesses. George was previously a managingdirector at Insight Partners and a member of the technology investment team at Summit Partners. He ispresently a director of various privately-held technology businesses and served as a director atpublicly-traded Medidata Solutions from 2004 until 2019.
George holds a Bachelor of Arts degree from Stanford University.
Gwyn Burr (Independent Non-Executive Director and Senior Independent Director)
Gwyn is an Independent Non-Executive Director and Senior Independent Director of the Group, having heldthe role since 7 May 2021. Gwyn has expertise in marketing, customer services, human resources,sustainability and strategy, which she obtained while working in senior roles at major retail brands,including Asda and Sainsbury’s. Gwyn has served on the boards of a diverse range of companies and hasexperience as both member and chair of remuneration committees. Gwyn’s extensive board experience andunderstanding of different points of view and business circumstances underpin her role as the SeniorIndependent Director.
Gwyn holds a BSc (Hons) in Economics and History from the University of Bradford and has completedbusiness programs at both Stanford and Harvard Business School.
Matthew Price (Independent Non-Executive Director)
Matthew is an Independent Non-Executive Director of the Group, having held the role since 14 May 2021.Matthew has experience in finance and in consumer facing business. Matthew currently serves as chieffinancial officer of the Global Fashion Group and previously served as chief financial officer ofMoneySuperMarket.com from 2014 to 2018. He also served as finance director of Costa Coffee from 2009to 2014 and managing director of its business in China. Matthew previously held senior finance andcommercial roles at Sodexo and J Sainsbury, including retail finance director and property director.
51

Matthew holds a Bachelor of Arts in History from the University of Southampton. He also completed anadvanced management programme at INSEAD and is a qualified chartered accountant, having trained andqualified with Deloitte in its corporate finance practice.
Senior Managers
The Group’s Senior Managers, as at the date of this Registration Document, are as follows:
Name Age Position
Philippe Chainieux ................................... 48 Chief Executive OfficerAdrian Evans ............................................ 43 Chief Financial OfficerNicola Thompson ..................................... 43 Chief Operating Officer
Philippe Chainieux (Chief Executive Officer)
See “– Board of Directors” above for Philippe’s biography.
Adrian Evans (Chief Financial Officer)
See “– Board of Directors” above for Adrian’s biography.
Nicola Thompson (Chief Operating Officer)
Nicola is the Chief Operating Officer of the Group, having held the role since 30 September 2019. Nicolahas over 20 years of retail experience, with over 10 years in senior leadership positions within high growthe-commerce businesses in fashion. Prior to joining MADE, Nicola was part of the Executive Board atASOS Plc where she was responsible for Global Customer Development, covering international growth andexpansion strategy and overseeing customer services. Prior to taking on the Global Customer role at ASOS,Nicola held a number of senior commercial and merchandising roles.
Nicola holds a Bachelor of Science in Geography from the University of Manchester.
Leadership Team
The Group has established a leadership team (comprising of the Corporate Leadership Team and theOperations Leadership Team) which is responsible for, amongst other, the Group’s operations, long-termgrowth and strategic and financial planning. An overview of the functions and members of the leadershipteam is provided below.
Corporate Leadership Team
The Corporate Leadership Team, overseen by the CEO, primarily focuses on the long-term growth plans ofthe business, strategic and financial planning, governance and policy, as well as areas such as new businessdevelopment, platform development, and evolving the Group’s customer proposition. The CorporateLeadership Team includes the CEO (Philippe Chainieux), CFO (Adrian Evans) and COO (NicolaThompson).
Operations Leadership Team
The Operations Leadership Team, overseen by the COO, is responsible for the operation of the Group’s corebusiness. The Operations Leadership Team works to ensure that the Group is executing its strategy in themost effective and efficient way, moving resources to support the biggest opportunities, and working acrossdepartments to break down silos and create focus and momentum on delivering the best possible experiencefor the Group’s customers.
52

REMUNERATION AND OTHER MATTERS
In the year ended 31 December 2020, the total remuneration paid (including contingent or deferredcompensation) and benefits in kind granted (under any description whatsoever) to each of the Directors andSenior Managers who served during 2020, was approximately £1,070,644 as set out in the table below:
Name TitleBase Salary
(£)
OtherBenefits
(£)21
Susanne Given ..................................... Chair 92,500 —Ning Li................................................. Vice Chair 50,000 —Philippe Chainieux............................... Chief Executive Officer 254,375 85,632Adrian Evans ....................................... Chief Financial Officer 212,750 67,137Nicola Thompson................................. Chief Operating Officer 231,250 77,000Bruno Crémel....................................... Non-Executive Director — —George McCulloch............................... Non-Executive Director — —
There is no arrangement under which any Director or Senior Manager has waived or agreed to waive futureemoluments.
DIRECTORS’ TERMS OF APPOINTMENT
Executive Directors
Philippe Chainieux (Chief Executive Officer)
Philippe was appointed as Managing Director of the Group pursuant to a service contract dated 5 June2013. His employment began on 2 September 2013. On 23 November 2016, Philippe was promoted to theposition of Chief Executive Officer of the Group with effect from 1 January 2017.
Philippe is entitled to receive a salary of £310,000 per annum under his service contract and is eligible foran annual discretionary bonus of £90,000. He is entitled to employer pension contributions of up to 4% andparticipates in the Group’s private medical cover, and life assurance, schemes. He is entitled to 25 days ofpaid holiday per year (increasing by one additional day for each year of employment up to a maximum of30 days) plus bank and public holidays in England and Wales. In addition, he is entitled to be reimbursedfor reasonable expenses necessarily incurred arising from the performance of his duties.
Philippe’s service contract is terminable by either party on six months’ notice and he is subject to certainpost-termination restrictions, including confidentiality, non-compete and non-solicit undertakings that applyfor a period of 24 months following the termination of his employment. The Group has the ability toterminate Philippe’s service contract with immediate effect by making a payment in lieu of notice, whichshall consist of base salary only.
The Group is also entitled to put Philippe on garden leave during any period of notice. During such periodof garden leave, Philippe will be entitled to receive his salary and all contractual benefits.
Further, Philippe accepted his appointment as Director of the Group on 31 December 2016. The acceptanceletter does not set out the terms and conditions of his appointment.
Adrian Evans (Chief Financial Officer)
Adrian was appointed as Chief Financial Officer of the Group pursuant to a service contract dated 25 May2017. His employment began on 17 July 2017.
Adrian is entitled to receive a salary of £240,000 per annum under his service contract and is eligible for anannual discretionary bonus of £80,000. He is entitled to employer pension contributions of up to 4% andparticipates in the Group’s private medical cover, and life assurance, schemes. He is entitled to 25 days ofpaid holiday per year (increasing by one additional day for each year of employment up to a maximum of30 days) plus bank and public holidays in England and Wales. In addition, he is entitled to be reimbursedfor reasonable expenses necessarily incurred arising from the performance of his duties.
Adrian’s service contract is terminable by either party on six months’ notice and he is subject to certainpost-termination restrictions, including confidentiality, non-compete and non-solicit undertakings that applyfor a period of 24 months following the termination of his employment. The Group has the ability to
21 Executive bonuses are tied to financial performance, NPS and sustainability targets.
53

terminate Adrian’s service contract with immediate effect by making a payment in lieu of notice, whichshall consist of base salary only.
The Group is also entitled to put Adrian on garden leave during any period of notice. During such periodof garden leave, Adrian will be entitled to receive his salary and all contractual benefits.
Further, Adrian accepted his appointment as Director of the Group on 7 May 2021. The acceptance letterdoes not set out the terms and conditions of his appointment.
Non-Executive Directors
Susanne Given (Chair)
Susanne accepted her appointment as Director of the Group on 29 June 2015. She currently serves as Chairof the Group.
Pursuant to Susanne’s latest letter of appointment dated 29 May 2019, her appointment is for an initialperiod of three years with effect from 1 April 2019, unless otherwise terminated earlier by and at thediscretion of either party upon one month’s written notice. Susanne’s appointment is subject to the Articles(as defined below), as amended from time to time, pursuant to which the Directors or shareholders maydecide to terminate Susanne’s appointment as Chair or Director with immediate effect and without anyentitlement to notice or compensation.
Susanne is entitled to receive an annual fee of £100,000. In addition, she is entitled to be reimbursed forreasonable expenses necessarily incurred arising from the performance of her duties.
Susanne is subject to confidentiality undertakings without limitation in time. She is not subject tonon-compete restrictive covenants.
The Group has a directors’ and officers’ liability insurance in place and intends to maintain such cover forthe full term of Susanne’s appointment and for at least six years thereafter.
Ning Li (Founder, Vice Chair)
Ning accepted his appointment as Director of the Group on 29 May 2015 (prior to this date, in addition tofounding the business, Ning was the CEO and executive director of the Group, until the appointment ofPhilippe Chainieux as CEO). He currently serves as Vice Chair of the Group.
Pursuant to Ning’s latest letter of appointment dated 20 June 2020, his appointment is for an initial term ofthree years with effect from 1 January 2020, unless otherwise terminated earlier by and at the discretion ofeither party upon one month’s written notice. Ning’s appointment is subject to the Shareholders’ Agreement(as defined below) and the Articles (as defined below), as amended from time to time, pursuant to whichthe Directors or shareholders may decide to terminate Ning’s appointment as Vice Chair with immediateeffect and without any entitlement to notice or to compensation.
Ning is entitled to receive an annual fee of £50,000. In addition, he is entitled to be reimbursed forreasonable expenses necessarily incurred arising from the performance of his duties.
Ning is subject to confidentiality undertakings without limitation in time. He is not subject to non-competerestrictive covenants.
The Group has a directors’ and officers’ liability insurance in place and intends to maintain such cover forthe full term of Ning’s appointment and for at least six years thereafter.
Bruno Crémel (Non-Executive Director)
Bruno accepted his appointment as Director of the Group on 29 June 2015. Bruno is not entitled to receivea fee for his role. The appointment letter does not set out any terms and conditions of his appointment.
George McCulloch (Non-Executive Director)
George accepted his appointment as Director of the Group on 29 June 2015 (prior to this date, George wasa non-executive director of Made.com Design Ltd (“MDL”), the Group’s prior holding company). George isnot entitled to receive a fee for his role. The appointment letter does not set out any terms and conditionsof his appointment.
54
Gwyn Burr (Independent Non-Executive Director and Senior Independent Director)
Gwyn accepted her appointment as Independent Non-Executive Director and Senior Independent Director ofthe Group from 7 May 2021, in connection with the Group’s Admission as outlined in Part V: “BusinessOverview – Overview” and Part X: “Additional Information – Proposed Pre-IPO Reorganisation”. UponAdmission, Gwyn will also serve as chair of the remuneration committee of the Group.
Gwyn’s appointment took effect on 7 May 2021 and shall last until Listco’s first annual general meeting, atwhich point Gwyn will seek re-election by Listco’s shareholders. Gwyn’s appointment is subject to Listco’sarticles of association as amended from time to time. Gwyn’s appointment is terminable by either party onthree month’s prior written notice.
Gwyn is entitled to receive an annual fee of (i) £60,000 for her role as Non-Executive Director, (ii) £10,000for her role as Senior Independent Director, and (iii) £10,000 for her role as remuneration committee chair.In addition, she is entitled to be reimbursed for reasonable expenses necessarily incurred arising from theperformance of her duties.
Gwyn is subject to confidentiality undertakings without limitation in time. She is not subject to non-competerestrictive covenants.
The Group has a directors’ and officers’ liability insurance in place and intends to maintain such cover forthe full term of Gwyn’s appointment.
Matthew Price (Independent Non-Executive Director)
Matthew accepted his appointment as Independent Non-Executive Director of the Group from 14 May 2021,in connection with the Group’s Admission as outlined in Part V: “Business Overview – Overview” andPart X: “Additional Information – Proposed Pre-IPO Reorganisation”. Upon Admission, Matthew will alsoserve as chair of the audit committee of the Group.
Matthew’s appointment took effect on 14 May 2021 and shall last until Listco’s first annual general meeting,at which point Matthew will seek re-election by Listco’s shareholders. Matthew’s appointment is subject toListco’s articles of association as amended from time to time. Matthew’s appointment is terminable by eitherparty on three month’s prior written notice.
Matthew is entitled to receive an annual fee of (i) £60,000 for his role as Non-Executive Director, and(ii) £10,000 for his role as audit committee chair. In addition, he is entitled to be reimbursed for reasonableexpenses necessarily incurred arising from the performance of his duties.
Matthew is subject to confidentiality undertakings without limitation in time. He is not subject tonon-compete restrictive covenants.
The Group has a directors’ and officers’ liability insurance in place and intends to maintain such cover forthe full term of Matthew’s appointment.
The Directors are not entitled to any benefits upon termination of their employment or appointment (asapplicable).
55
OTHER DIRECTORSHIPS AND PARTNERSHIPS
The Directors and Senior Managers listed in the table below are, or were within the past five years, amember of the administrative, management or supervisory bodies or partner of the following companies orpartnerships (in addition to, where applicable, their directorships of the Company and any members of theGroup and subsidiaries of the companies listed below):
Name Current directorships / partnerships Former directorships / partnerships
Susanne Given ............. Tritax Bigbox REIT PlcHush Homeware LtdWM Morrison Supermarkets PlcAl Tayer Insignia LLCTrent Holdings LtdForward Partners
Deloitte NSE LLPOutfittery GmbHEurostar International LtdPush Doctor Ltd
Ning Li......................... Good Brands SASHaka Investments LimitedBeyond Borders Acquisition Corp.
—
Philippe Chainieux....... FEVAD —
Adrian Evans ............... Windermere Court Limited YNAP Middle East Holding Limited
Nicola Thompson......... — ASOS Plc
Bruno Crémel............... Partech Partners SASPartech Growth GP SASRouje SASEvaneosM-Files OyExporoSendinblue SASAtaris SASEDF
—
George McCulloch....... Level Equity Management, LLCLevel Equity Growth Partners I, L.P.LEGP I AIV (B), L.P.LEGP I AIV (NB), L.P.Level Equity Partners (GP), LLCLevel Equity Associates, LLCLevel Equity Professionals, L.P.Level Equity Growth Partners II, L.P.LEGP II AIV (B), L.P.LEGP II AIV (NB), L.P.Level Equity Partners II (GP), L.P.Level Equity Associates II, LLCLevel Equity Growth Partners III, L.P.LEGP III AIV (B), L.P.LEGP III AIV (NB), L.P.Level Equity Partners III (GP), L.P.Level Equity Associates III, LLCLevel Equity Growth Partners IV, L.P.Level Equity Partners IV (GP), L.P.Level Equity Associates IV, LLCLevel Equity Opportunities Fund 2015,L.P.Level Equity Opportunities Fund 2018,L.P.Level Structured Capital I, L.P.Level Structured Capital I (GP), L.P.Level Structured Capital Associates I,
Apogy LLCEST Holdings, Inc. (Ensenta)Riskonnect, Inc.Vendini, Inc.Medidata Solutions, Inc.
56

Name Current directorships / partnerships Former directorships / partnerships
LLCLevel Equity-CloudCheckr Investors,LLCLevel Equity-IMN Investors, LLCLevel Equity-Made Investors, LLCLevel Equity-VCS Investors, LLCAccelo Inc.Dash Hudson Inc.Evaneos S.A.FormAssembly, Inc.Groove Labs, Inc.Inbenta Holdings, Inc.Financiere Powell (Powell Software)StarTex Software, LLCVivoAquatics, Inc.
Gwyn Burr ................... Hammerson PlcJust Eat Takeaway.com N.V.Metro AGIngleby Farms and Forests ApSTaylor Wimpey plc
Sainsbury’s Bank plcDFS Furniture plcJust Eat Limited
Matthew Price .............. Global Fashion Group UK ServicesLimitedGlobal Fashion Group UK FinanceLimitedGFG UK 1 Limited, London UKGlobal Fashion Group TRM LimitedGlobal Fashion Group SABigfoot GmbHJade 1076. GmbHGFG Deutschland 1 GmbHBambino 49. VV UG(haftungsbeschränkt)GFG eCommerce Technologies GmbHGFG Deutschland Holdings GmbHBGN Brillant Services GmbHNew BGN Zalora GmbHZalora Group GmbHBrillant 1257. GmbHJade 1249. GmbHJade 1250. GmbHNew Middle East eCommerce II GmbHNew Middle East eCommerce I GmbHMiddle East eCommerce Holding GmbHJade 1218. GmbHJade 1411. GmbHJade 1159. GmbHJade 1410. GmbH
Mortgage 2000 LimitedMoneysavingexpert.com LimitedMoneysupermarket.com Financial GroupLimitedMoneysupermarket.com Financial GroupHoldings LimitedMoneysupermarket LimitedMoneysupermarket.com Group PLCMaking millionaires LimitedInsuresupermarket.com LimitedFinancial Services Net LimitedTravelsupermarket.com LimitedMoneysupermarket.com LtdDecision Technologies LimitedSellmymobile.com LimitedTownside LimitedPodium Solutions Limited
Save as set out above, none of the Directors or Senior Managers has any business interest, or performs anyactivities, outside of the Group, which are significant with respect to the Group.
57

INTERESTS OF THE DIRECTORS AND SENIOR MANAGERS
Each of the interests in the share capital of the Company of the Directors and Senior Managers (all ofwhich, unless otherwise stated, are beneficial or are interests of a person connected with a Director or aSenior Manager) on the date of this Registration Document are as follows:
OrdinaryShares
Series B-1Preferred
Shares
Series B-2Preferred
Shares
Series C-1Preferred
Shares
Series C-2Preferred
Shares
Series C-3Preferred
Shares
Series C-4Preferred
SharesGrowthShares(4)
% ofVotingRights
ShareOptions
George McCulloch(1) ........ — 3,345,424 748,502 991,531 1,426,551 374,251 523,981 — 24.1% —Bruno Crémel(2) ................ — — — 2,874,448 2,891,631 — 490,928 — 20.4% —Ning Li(3) ......................... 3,258,734 — — — — — — 750,000 10.6%(4) —Philippe Chainieux............ — — 52,218 — — 49,900 — — 0.3% 1,456,323Susanne Given .................. — — — — — — — — — 300,000Adrian Evans .................... — — — — — — — — — 250,000Nicola Thompson.............. — — — — — — — — — 200,000
—————Notes:(1) Holding through a connected entity, Level Equity Growth Funds.(2) Holding through a connected entity, Partech Growth FCPI.(3) Ning Li holds one ordinary share in his own name and the remaining shares through a connected entity, Haka Investments Limited.(4) Growth shares do not carry any voting rights and as such have not been included in the percentage of voting rights.
In addition, no Director or Senior Manager has or has had any interest in any transaction which is or wasunusual in its nature or conditions or is or was significant to the business of the Group and which waseffected by the Company in the current or immediately preceding financial year or which was effectedduring an earlier financial year and remains in any respect outstanding or unperformed.
CONFLICTS OF INTEREST
Save for their capacities as persons legally and beneficially interested in Shares as set out above – “Interestsof the Directors and Senior Managers”, and save for:
* the appointment of Ning Li as a representative of Haka Investments Limited;22
* the appointment of Bruno Crémel as a representative of Partech;23 and
* the appointment of George McCulloch as representative of Level Equity,24
in each case pursuant to the terms of the Articles (see Part X: “Additional Information – Articles ofAssociation”), there are (i) no potential conflicts of interest between the duties of the Directors or SeniorManagers to the Company and their private interests and/or other duties that they may also have, and (ii) noarrangements or understandings with any other Major Shareholders, customers, suppliers or others pursuantto which any Director or Senior Manager was selected to be a Director or Senior Manager.
DIRECTORS’ AND SENIOR MANAGERS’ CONFIRMATIONS
As at the date of this Registration Document, no Director or Senior Manager has at any time within the lastfive years:
* been convicted in relation to fraudulent offences;
* been associated with any bankruptcies, receiverships or liquidations or companies put intoadministration in respect of which they were acting in the capacity of a member of the administrative,management or supervisory bodies or a partner;
* been subject to any official public incrimination and/or sanctions by any statutory or regulatoryauthorities (including designated professional bodies); or
* been disqualified by a court from acting as a member of the administrative, management orsupervisory body of a company or from acting in the management or conduct of the affairs of anycompany.
22 Haka Investments Limited is a personal investment company, wholly-owned by Ning Li, which holds 10.6% of the voting rights in theCompany.
23 Bruno Crémel is a general partner at Partech, which manages Partech Growth FCPI, which holds 20.4% of the voting rights in theCompany.
24 George McCulloch is a partner at Level Equity Management, LLC, which manages the Level Equity Growth Funds that hold 24.1% of thevoting rights in the Company.
58
There are no family relationships between any Directors or Senior Managers.
CORPORATE GOVERNANCE
As a private limited company incorporated in Gibraltar, the Company is not required to comply with theprovisions of the UK Corporate Governance Code. Notwithstanding this, the Board has established aRemuneration Committee and a Transaction Committee, each with formally delegated duties andresponsibilities with written terms of reference. From time to time, separate committees may be set up bythe Board to consider specific issues when the need arises.
The Remuneration Committee assists the Board in determining its responsibilities in relation to remuneration,including, amongst other matters, making recommendations to the Board on the Company’s policy onexecutive remuneration, determining the individual remuneration and benefits package of each of theexecutive directors. The Remuneration Committee is composed of Susanne Given, Bruno Crémel andGeorge McCulloch and meets no less than once per year and otherwise as required.
The Transaction Committee assists the Board with the potential initial public offering of the Company. TheTransaction Committee is composed of Susanne Given, Bruno Crémel and George McCulloch and meets asrequired.
59

PART VII
SELECTED FINANCIAL INFORMATION
The tables below set out the Group’s selected financial information for the periods indicated, as reported inaccordance with IFRS, which has been extracted without material adjustment from the historical financialinformation set out in Part IX (Group Historical Financial Information).
Consolidated Income Statement
Three months ended31 March Year ended 31 December
2021 2020 2020 2019 2018
£m(unaudited)
£m(audited)
Revenue ............................................... 82.4 58.1 247.3 211.8 173.4Cost of sales......................................... (40.9) (28.0) (115.7) (96.6) (80.4)
Gross profit ......................................... 41.5 30.1 131.6 115.2 93.0Distribution expenses........................... (16.4) (14.5) (56.6) (51.5) (33.0)Administrative expenses ...................... (26.5) (22.2) (87.8) (82.6) (64.6)Operating loss..................................... (1.4) (6.6) (12.8) (18.9) (4.6)
Finance costs........................................ (0.4) (0.2) (1.4) (0.7) (0.5)Finance income.................................... — — — 0.1 0.1
Loss before tax ................................... (1.8) (6.8) (14.2) (19.5) (5.0)Income tax (expense)/credit................. — — 6.6 (0.1) 1.0
Loss for the year ................................ (1.8) (6.8) (7.6) (19.6) (4.0)
Loss for the year attributed toequity holders of the Company ........ (1.8) (6.8) (7.6) (19.6) (4.0)
60

Consolidated Statement of Financial Position
As of31 March As of 31 December
2021 2020 2019 2018
£m(unaudited)
£m(audited)
Non-current assetsProperty, plant and equipment..................................... 3.0 3.4 5.1 3.4Intangible assets........................................................... 9.3 8.9 7.9 5.4Right of Use Assets..................................................... 11.0 12.3 15.0 —Deferred tax asset ........................................................ 11.6 12.2 5.1 4.13Rent deposits................................................................ 0.5 0.5 0.5 0.5
35.4 37.3 33.6 13.4
Current assetsInventories.................................................................... 24.2 21.5 25.6 17.9Trade and other receivables......................................... 8.8 13.2 8.7 8.7Derivative asset............................................................ 2.9 1.2 3.2 5.7Cash. ............................................................................ 74.5 50.4 17.5 35.6
110.4 86.3 55.0 67.9
Total assets.................................................................. 145.8 123.6 88.6 81.3
Current liabilities .......................................................Lease liabilities ............................................................ (3.4) (4.5) (4.1) —Trade and other payables............................................. (49.7) (39.6) (36.9) (31.5)Deferred liability. ......................................................... (4.3) (6.0) (5.4) (1.5)Deferred revenue.......................................................... (66.3) (52.8) (19.6) (14.9)Provisions..................................................................... — — (0.1) —
(123.7) (102.9) (66.1) (47.9)
Non-current liabilitiesLease liabilities ............................................................ (9.7) (9.7) (12.7) —Provisions..................................................................... (1.3) (1.3) (1.1) (0.6)Interest bearing loans and borrowings… .................... (9.7) (9.7) — —
(20.7) (20.7) (13.8) (0.6)
Total liabilities ............................................................ (144.4) (123.6) (79.9) (48.5)
Net assets..................................................................... 1.4 0.0 8.7 32.8
Capital reservesShare capital................................................................. 0.0 0.0 0.0 0.0Share premium............................................................. 62.2 62.2 61.6 61.5Foreign currency translation reserve ........................... 0.0 0.0 0.0 0.1Hedging reserve. .......................................................... (0.7) (3.4) (1.3) 3.3Other reserves. ............................................................. (20.2) (20.2) (20.2) (20.2)Accumulated deficit ..................................................... (39.9) (38.6) (31.4) (11.9)
1.4 0.0 8.7 32.8
61

Consolidated Statement of Cash Flows
Three months ended31 March Year ended 31 December
2021 2020 2020 2019 2018
£m(unaudited)
£m(audited)
Net cash flows from operatingactivities ............................................... 26.8 (0.4) 32.2 (6.6) 2.4Net cash flows used in investingactivities ............................................... (1.7) (1.9) (5.7) (8.5) (6.0)Net cash flow from financing activities (1.0) 8.9 6.4 (3.0) 25.4
Cash and cash equivalents at31 December ....................................... 74.5 24.1 50.4 17.5 35.6
Key performance indicators
The Group monitors several key metrics to track the financial and operating performance of its business.These measures are derived from the Group’s internal financial and analytics systems. The Directors believethat these measures provide readers with useful information regarding the Group’s financial and operatingperformance and facilitate an understanding of the underlying performance of the Group. As some of thesemeasures are not determined in accordance with IFRS, and are thus susceptible to varying calculations, theymay not be comparable with other similarly titled measures of performance of other companies. For moreinformation on the definition and calculation of these metrics, including a reconciliation to the Group’sreported historical financial information prepared on an IFRS basis, where relevant, please seePart VIII: “Operating and Financial Review — Non-IFRS Financial Measures”.
For the three monthsended 31 March For the years ended 31 December
2021 2020 2020 2019 2018
Non-financial KPIsLTM Active customers (‘000)(2).......... 1,165 829 1,055 786 599
United Kingdom............................... 586 415 532 399 331Continental Europe .......................... 579 414 523 386 268
Gross Sales per active customer (£).... * * 298 308 323United Kingdom............................... * * 310 325 338Continental Europe .......................... * * 286 291 304
Orders (£’000)(3) .................................. 465 310 1,377 1,025 775United Kingdom............................... 242 157 727 544 446Continental Europe .......................... 223 153 650 481 328
Repeat order mix (%)(4)....................... 43% 42% 41% 40% 37%United Kingdom............................... 50% 49% 48% 46% 44%Continental Europe .......................... 34% 34% 34% 32% 29%
Orders per active customer.................. * * 1.31 1.30 1.29United Kingdom............................... * * 1.37 1.36 1.35Continental Europe .......................... * * 1.24 1.25 1.22
AOV (£)(5)............................................ 235 217 229 236 250United Kingdom............................... 235 220 227 239 251Continental Europe .......................... 236 214 231 233 248
Homeware sales mix (% of total grosssales)(6) ................................................. 28% 25% 27% 23% 20%Financial KPIsGross Sales (£m)(1) .............................. 110 67 315 242 194
United Kingdom............................... 57 34 165 130 112Continental Europe .......................... 53 33 150 112 82
Deferred income (£m) ......................... 66 21 53 20 15
62
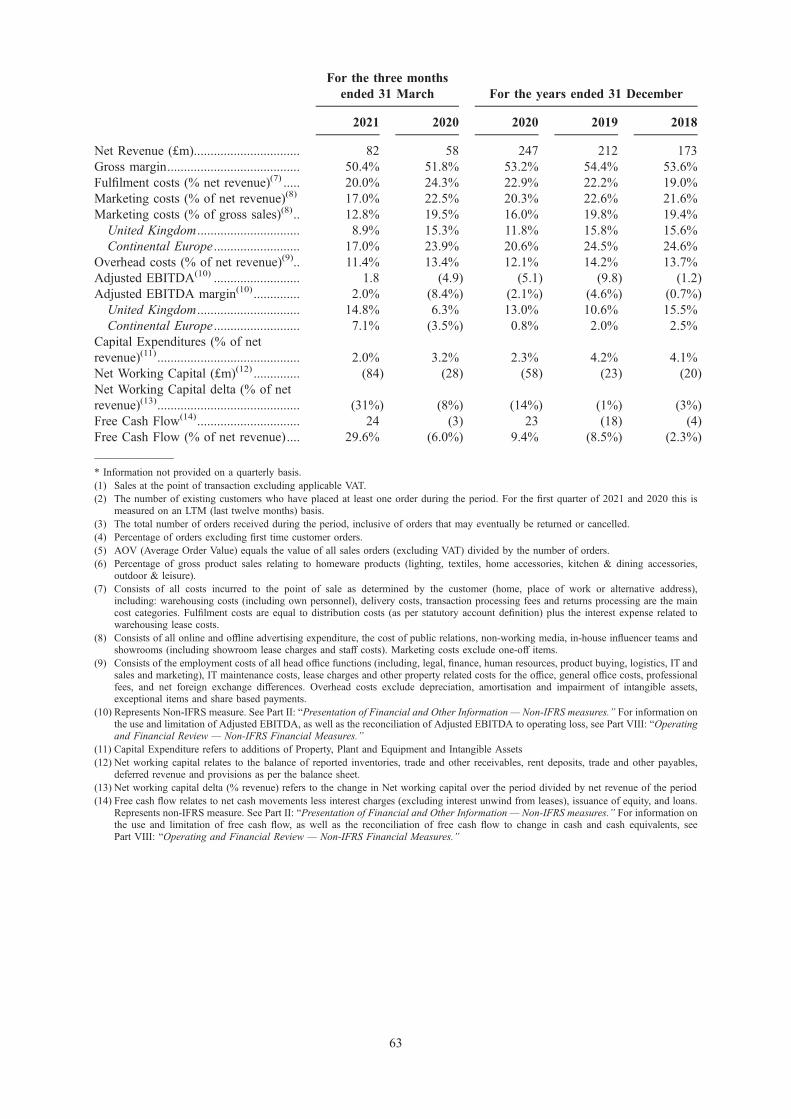
For the three monthsended 31 March For the years ended 31 December
2021 2020 2020 2019 2018
Net Revenue (£m)................................ 82 58 247 212 173Gross margin........................................ 50.4% 51.8% 53.2% 54.4% 53.6%Fulfilment costs (% net revenue)(7) ..... 20.0% 24.3% 22.9% 22.2% 19.0%Marketing costs (% of net revenue)(8) 17.0% 22.5% 20.3% 22.6% 21.6%Marketing costs (% of gross sales)(8).. 12.8% 19.5% 16.0% 19.8% 19.4%
United Kingdom............................... 8.9% 15.3% 11.8% 15.8% 15.6%Continental Europe .......................... 17.0% 23.9% 20.6% 24.5% 24.6%
Overhead costs (% of net revenue)(9).. 11.4% 13.4% 12.1% 14.2% 13.7%Adjusted EBITDA(10) .......................... 1.8 (4.9) (5.1) (9.8) (1.2)Adjusted EBITDA margin(10) .............. 2.0% (8.4%) (2.1%) (4.6%) (0.7%)
United Kingdom............................... 14.8% 6.3% 13.0% 10.6% 15.5%Continental Europe .......................... 7.1% (3.5%) 0.8% 2.0% 2.5%
Capital Expenditures (% of netrevenue)(11)........................................... 2.0% 3.2% 2.3% 4.2% 4.1%Net Working Capital (£m)(12) .............. (84) (28) (58) (23) (20)Net Working Capital delta (% of netrevenue)(13)........................................... (31%) (8%) (14%) (1%) (3%)Free Cash Flow(14)............................... 24 (3) 23 (18) (4)Free Cash Flow (% of net revenue).... 29.6% (6.0%) 9.4% (8.5%) (2.3%)
—————* Information not provided on a quarterly basis.(1) Sales at the point of transaction excluding applicable VAT.(2) The number of existing customers who have placed at least one order during the period. For the first quarter of 2021 and 2020 this is
measured on an LTM (last twelve months) basis.(3) The total number of orders received during the period, inclusive of orders that may eventually be returned or cancelled.(4) Percentage of orders excluding first time customer orders.(5) AOV (Average Order Value) equals the value of all sales orders (excluding VAT) divided by the number of orders.(6) Percentage of gross product sales relating to homeware products (lighting, textiles, home accessories, kitchen & dining accessories,
outdoor & leisure).(7) Consists of all costs incurred to the point of sale as determined by the customer (home, place of work or alternative address),
including: warehousing costs (including own personnel), delivery costs, transaction processing fees and returns processing are the maincost categories. Fulfilment costs are equal to distribution costs (as per statutory account definition) plus the interest expense related towarehousing lease costs.
(8) Consists of all online and offline advertising expenditure, the cost of public relations, non-working media, in-house influencer teams andshowrooms (including showroom lease charges and staff costs). Marketing costs exclude one-off items.
(9) Consists of the employment costs of all head office functions (including, legal, finance, human resources, product buying, logistics, IT andsales and marketing), IT maintenance costs, lease charges and other property related costs for the office, general office costs, professionalfees, and net foreign exchange differences. Overhead costs exclude depreciation, amortisation and impairment of intangible assets,exceptional items and share based payments.
(10) Represents Non-IFRS measure. See Part II: “Presentation of Financial and Other Information— Non-IFRS measures.” For information onthe use and limitation of Adjusted EBITDA, as well as the reconciliation of Adjusted EBITDA to operating loss, see Part VIII: “Operatingand Financial Review — Non-IFRS Financial Measures.”
(11) Capital Expenditure refers to additions of Property, Plant and Equipment and Intangible Assets(12) Net working capital relates to the balance of reported inventories, trade and other receivables, rent deposits, trade and other payables,
deferred revenue and provisions as per the balance sheet.(13) Net working capital delta (% revenue) refers to the change in Net working capital over the period divided by net revenue of the period(14) Free cash flow relates to net cash movements less interest charges (excluding interest unwind from leases), issuance of equity, and loans.
Represents non-IFRS measure. See Part II: “Presentation of Financial and Other Information — Non-IFRS measures.” For information onthe use and limitation of free cash flow, as well as the reconciliation of free cash flow to change in cash and cash equivalents, seePart VIII: “Operating and Financial Review — Non-IFRS Financial Measures.”
63

PART VIII
OPERATING AND FINANCIAL REVIEW
The following is a discussion and analysis of the Group’s financial condition and results of operations andshould be read in conjunction with the combined and consolidated historical financial information, theaccompanying notes, as well as the accountant’s report, included within Part IX (Group Historical FinancialInformation), as well as the description of the Group’s business included elsewhere in this RegistrationDocument.
This discussion of the Group’s financial condition and results of operations contains forward-lookingstatements which, although based on assumptions that the Group considers reasonable, are subject to risksand uncertainties which could cause actual events or conditions to differ materially from those expressed orimplied by the forward-looking statements. For a discussion of risks and uncertainties facing the Group asa result of various factors, see Part II (Presentation of Financial and Other Information) and Part I (RiskFactors). In addition, certain industry issues also impact the Group’s financial condition and results ofoperations, as described in Part IV (Industry Overview).
Overview
MADE is the leading digitally native lifestyle brand in home. MADE’s mission is to make high-enddesigner furniture and homeware products accessible to everyone. MADE sells its products across the UnitedKingdom, Germany, Switzerland, Austria, France, Belgium, Spain and the Netherlands via its e-commerceplatform, which provides an inspiring and seamless customer experience, while its asset light verticallyintegrated model allows for scalability.
MADE was founded in 2010 and launched its first website in the United Kingdom that year. After launchin the United Kingdom, MADE has gradually expanded its product offering, starting with upholstery, thenfurniture and more recently homewares and lifestyle categories. In parallel to its product offering expansion,MADE commenced its international expansion by launching its French website in January 2013, followedby websites for a number of other European markets from 2013 to 2018, with Spain being the latest marketthat it entered in 2018. MADE is headquartered in the United Kingdom, with local offices in its key tradingmarkets, in France, Germany and the Netherlands, as well as sourcing offices.
MADE believes it provides its customers with high-quality, responsibly made, affordable products,underpinned by exclusive designs, that enable customers to curate their life at home. MADE’s fresh andever-changing range, with nine new collections25 launched on average every week and around 40% of itsrange renewed each year, consists of over 6,000 curated furniture and homeware products. To create itsproduct range, MADE partners with over 150 established and up-and-coming designers, artists andcollaborators. Its customer proposition has enabled MADE to develop a large, active and loyal customerbase, with approximately 1.1 million active customers in 2020 and approximately 1.2 million activecustomers in the last 12 months to the end of the first quarter of 2021. Of total customer orders in the threemonths ended 31 March 2021, approximately 48% of gross sales were generated from customers inContinental Europe and 52% from the United Kingdom. For the same period, repeat orders in the UnitedKingdom (as MADE’s most mature market) constituted approximately 50% of MADE’s total UK customerorders. MADE is the most popular home and living brand for UK millennials, the most reviewed homebrand on UK Trustpilot, has an “Excellent” Trustpilot rating in the United Kingdom and core ContinentalEuropean markets and has more than 3.1 million26 followers across its social media accounts.
MADE’s business model is centered around a flexible asset-light supply chain, vertically integrated across allfunctions and processes, covering the entire product lifecycle from product development and sourcing(including concept design, development, production and ordering) through to global shipping, warehousingand home delivery. Sustainability is embedded into MADE’s operations with growing visibility andtransparency given to its customers. MADE designs products with their longevity in mind and is committedto its sustainability initiatives.
The Group’s gross sales, net revenue and Adjusted EBITDA (as defined below) were £109.5 million,£82.4 million and £1.8 million, respectively, for the three months ended 31 March 2021 and £315 million,£247 million and (£5.1 million), respectively, for the year ended 31 December 2020. MADE’s business isalso highly cash generative, due to its strong margins, an attractive negative working capital profile and
25 Refers to a 2021 figure for homeware and furniture. Collection is defined as capsule range of more than one SKU.26 Figure includes 1.3 million followers on Instagram and 1.8 million followers on Facebook as at 8 April 2020.
64

relatively low capital expenditure requirements. Due to the partnerships that MADE has built, it has thebenefits of a vertically integrated business, without the need to make all of the related infrastructureinvestments itself.
Principal Factors Affecting the Group’s Results of Operations
The Group’s business, financial condition and results of operations have been affected in the years underreview, and are expected to continue to be affected, by certain principal factors and developments relating toits business described below.
Prospective investors should also read the sections entitled Part I: “Risk Factors”, Part IV: “IndustryOverview” and Part V: “Business Overview” for further information relating to factors that could materiallyaffect, directly or indirectly, the Group’s business, financial condition and results of operations in the future.
Growth of online penetration
The Group operates within the European furniture and homeware e-commerce market. In 2020, the retailmarket for furniture and homeware was worth £94 billion in the United Kingdom, France, Austria, theNetherlands, Belgium, Germany, Switzerland and Spain, the Group’s addressable geographical markets.Online penetration in the homeware and home furnishings market is relatively low compared to otherconsumer goods, measuring at 12% in 2019 for the United Kingdom, France, Germany, Austria, Belgium,Spain, the Netherlands and Switzerland. The COVID-19 pandemic accelerated customers’ shift towardsonline channels and led to an increased wallet share towards their home environments See thisPart VIII: “Operating and Financial Review — Principal Factors Affecting the Group’s Results ofOperations — COVID-19” below. In MADE’s addressable geographical markets, online sales of homefurnishings and homewares in 2020 accounted for 37%, 19%, 10%, 11%, 14%, 5%, 11% and 18% of totalretail home furnishings and homeware sales in the United Kingdom, Belgium, Germany, France, theNetherlands, Austria, Switzerland and Spain, respectively. Euromonitor estimates that the value of thefurnishings and homeware retail market in the Group’s core geographies is expected to grow from£94 billion to £118 billion in 2025 with online representing approximately 20% of total retail sales value.
The Directors believe that the home furnishings and homeware online market has reached an inflexion point,similar to that historically experienced in the shift to online in other consumer categories, and will continueto grow materially above the total expected market growth over the next five years. For more informationabout the expected growth of the online home furnishings and homeware market see Part IV: “IndustryOverview”.
Consumer acquisition and retention
The Group has experienced significant revenue growth as it has developed its unique curated range,expanded geographically and invested in marketing, its technology platform and customer service propositionin order to grow its active customer base.
The increase in the number of orders from 2018 to 2020 and from the first quarter of 2020 to the firstquarter of 2021 is principally attributable to an increase in the number of new customers (primarily as aresult of investments in marketing, range development and platform enhancements) supported by improvingcustomer acquisition costs, increased customer retention and geographic expansion (including, the expansioninto Spain in 2018). MADE delivers positive post marketing contribution on first order in its coregeographies, with profitable repeat orders that are becoming an increasing part of the order mix. Of theincrease in gross sales between 2019 and 2020, over 50% came from the Continental European markets.From 2018 to 2020, and through the first quarter of 2021, the Group also expanded its product range.Additional product categories and more collections have been introduced within each category, increasing thenumber of SKUs from approximately 4,200 in 2018 to approximately 6,000 in 2020. Average order value,or AOV, over the period has generally reduced primarily due to the introduction of a larger homewarerange. The introduction of homeware product tends to reduce AOV, but it enhances marketing efficiency andfrequency, thereby increasing life time value per customer. Also, as a consequence of the COVID-19pandemic, the AOV was further impacted in 2020 due to an increase in lead times offered to customersstemming from supply chain disruptions. See this Part VIII: “Operating and Financial Review — PrincipalFactors Affecting the Group’s Results of Operations — COVID-19” below.
65

IT capital expenditure and investments in platform
Over the last three years, the Group has made IT capital investments totaling £13.5 million on systemsdevelopment to support growth to date and ambitions to further scale trading. The Group continued to growits investment in technology with an increase in development expenditure of 8.0% for the first quarter of2021, and of 38.1% and 52.0% for the years ended 31 December 2019 and 2018, respectively. IT capitalexpenditure remained broadly consistent year on year in 2020 since investments in infrastructure for scalewere made in 2018 and 2019. Development expenditure was focused principally on enhancing the customerexperience whilst strengthening the operating infrastructure to support future growth and continuing toenhance analytical insight. See Part V: “Business Overview — Technology”. The front-end system has beenfurther enhanced to improve the customer experience, and modifications have been made to the back-endsystem to improve the functionality in managing the supply chain and to ensure scalability. The Grouplaunched local language websites in Switzerland and Spain in 2017 and 2018, respectively. In the last threeyears, the Group’s website content has seen continuous improvement with new features, more relevantproduct information, improved imagery and customer-derived content, such as shoppable onsite customergenerated content. The capital costs of the intangible assets created by the IT development work, includingresearch and development costs, are amortised over three years and included within administrative expenses.
Marketing investment
During the periods under review, the Group invested significantly in marketing, a key component of theGroup’s strategy to bring more traffic to its websites, acquire new customers and increase brand awareness.The Group’s marketing strategy can be divided into the following categories: (1) brand marketing,(2) performance marketing and (3) other marketing (including seven showrooms in key markets). SeePart V: “Business Overview — Marketing” for further details on the Group’s marketing strategy.
Marketing costs are included within administrative expenses. The following table sets forth marketing costs,marketing expenditure as a percentage of gross sales and net revenue, and Consumer Acquisition Cost foreach of the periods indicated.
For the three monthsended 31 March For the years ended 31 December
2021 2020 2020 2019 2018
(£m)Marketing costs(1) ................................ 14.0 13.1 50.2 47.9 37.5Percentage of gross sales..................... 12.8% 19.5% 16.0% 19.8% 19.4%
United Kingdom............................... 8.9% 15.3% 11.8% 15.8% 15.6%Continental Europe .......................... 17.0% 23.9% 20.6% 24.5% 24.6%
Percentage of net revenue ................... 17.0% 22.5% 20.3% 22.6% 21.6%Consumer Acquisition Cost (CAC)(2) . * * 46 60 62
United Kingdom............................... * * 34 49 51Continental Europe .......................... * * 57 70 74
—————(1) Consists of all online and offline advertising expenditure, the cost of public relations, non-working media, in-house influencer teams and
showrooms (including showroom lease charges and staff costs). Marketing costs exclude one-off items.(2) Total brand and performance marketing costs (excludes showroom and non-working media costs) less costs related to customer retention
divided by the number of new customers.* CAC information is not provided on a quarterly basis.
Over time the Group has continued to improve marketing efficiencies as it continues to develop its productrange, increase brand awareness in local markets and build repeat order rates. Increasing brand awarenessand repeat order rates has resulted in an increased mix of direct traffic, consequently reducing marketingcosts as a percentage of gross sales (which for Continental Europe were 29.4%, 28.1%, 24.6%, 24.5% and20.6% for 2016, 2017, 2018, 2019 and 2020, respectively and for the United Kingdom were 17.9%, 15.0%,15.6%, 15.8% and 11.8% for 2016, 2017, 2018, 2019 and 2020, respectively). During 2020 and in the firstquarter of 2021 a reduction in retailer demand for marketing due to COVID-19 and increased customerdemand has resulted in further enhanced marketing efficiency.
Typically, newly launched regions require a greater level of marketing investment in early years post launchto develop brand awareness and to grow the initial customer base. Following initial investments, marketinginvestment as a percentage of revenue typically reduces in line with the trend experienced in the Group’soriginal UK market.
66
Customer acquisition costs have decreased significantly from 2016 (when CAC was £82 for ContinentalEurope and £59 for the United Kingdom) to 2020 (when CAC was £57 for Continental Europe and £34 forthe UK).
The Group expects to decrease investments in marketing in 2021 as a percentage of both gross sales andrevenue. This is due to the growing maturity of MADE’s key geographies, ongoing development in productrange, an improving lead-time proposition and the ongoing effects of the COVID-19 pandemic. Through2022 and 2023, the Group intends to make one-off marketing investments in brand awareness to accelerategrowth in Continental Europe (primarily in Germany and France) in an amount initially estimated at£20 million but subject to continued monitoring by the Group. See Part V: “Business Overview —Strategy”. As a result, and also due to the unwind of the COVID-19 effects on marketing prices, marketingcosts as a percentage of revenue and gross sales are expected to increase in 2022 and 2023. Following theperiod of one-off brand awareness investment, the Group expects to continue to deliver ongoing marketingefficiencies in line with historical trends.
Product mix
In order to deliver its longer term vision to become a home-lifestyle destination, the Group plans toaccelerate the expansion of its homeware selection by developing a curated homewares platform. SeePart V: “Business Overview — Strategy”. As a percentage of total gross sales in the three months ended31 March 2021 and the years ended 31 December 2020, 2019 and 2018, sales of homeware products were28%, 27%, 23% and 20%, respectively. From 2015 to 2020, the Group’s homeware sales mix, based ongross sales, increased by 12 percentage points. The increase in homeware sales was attributable to theGroup’s strategic initiative to grow the homeware range, pursuant to which homewares SKUs increased from500 in 2015 to 2,300 in 2020. In addition, increasing homeware sales have contributed to the developmentof order frequency which increased from 1.24 orders per customer in 2015 to 1.31 orders per customer in2020. The shift in product mix from primarily furniture to increasingly homeware has translated into areduction in AOV (from £263 in 2015 to £229 in 2020) but also a reduction in the average cost ofacquiring customers. In the UK the cost of acquiring customers for the homeware segment was £16 in 2020while the cost of acquiring furniture customers amounted to £47 for the same period. Homewares acquiredcustomers have a very similar annual repeat gross sales profile as furniture acquired customers after the firstyear following acquisition. Consequently, homewares customer life time value to CAC ratio is higher thanthat experienced for furniture acquired customers.
COVID-19
The COVID-19 pandemic and related counter-measures and restrictions imposed by governments (across allgeographies the Group operates in), including, without limitation, business closures, restrictions onnon-essential business activities, travel restrictions, quarantines and cancellations of gatherings and eventshave materially impacted how the Group conducts its business and have affected its results of operationsand financial condition. In particular, COVID-19 has impacted the Group in the following ways:
* Acceleration of growth of online penetration. Prior to COVID-19, traffic to the Group’s websites hadbeen growing as a result of targeted investment, expansion into new geographic markets, and a marketproclivity to increased online shopping. See this Part VIII: “Operating and Financial Review —Growth of online penetration” above. COVID-19 accelerated the pre-existing customer shift fromtraditional bricks and mortar retailers to online channels and led to an increased wallet share towardstheir home environments. The Company believes the recent trend towards purchasing for the homeonline to be an inflexion point for the sector and consequently anticipates online penetration to beaccelerated compared to pre COVID-19 forecasts.
* Supply chain disruptions. The Group experienced temporary supply chain disruptions, resulting inmaterial extensions to the typical lead times offered to customers. Extended lead times negativelyimpacted conversion rates and resulted in an increased interval between timing of a sale to recognitionof revenue. Temporary supply chain disruptions were characterised by three key periods:
○ In the first six months of 2020, COVID-19 outbreaks in Asia affected the Group’s suppliers inthe region and consequently impacted production cycles, leading to product production delays.
67

○ As COVID-19 spread to Western Europe and governments began introducing restrictions andother mitigating actions, visibility on future demand for the Group’s products became less clear.Consequently, to contain costs and to mitigate risks to the business stemming from uncertaindemand, the Group decided to reduce stock commitments. By May 2020, as increased demandlevels began to become clear, management increased product ordering accordingly.
○ Beginning in November 2020, global freight disruptions resulting from, among other things, theCOVID-19 pandemic have resulted in market wide reduced freight capacity, delays in freightshipping, higher freight costs. The impact of such disruptions have been more acute in the firstquarter of 2021. Although at a lower level than experienced in the first quarter of 2021, MADEanticipates that freight costs higher than those experienced before the COVID-19 pandemic willpersist throughout 2021.
* Increased lead times. The Group’s products are sold on a lead time or express delivery, meaning thatwhen a customer makes a purchase, they are provided with an estimate of how long it will take forthe product to be delivered to them. Furniture products generally have higher lead times relative tohomeware products. Through its use of data analytics, the Group has determined that longer lead timessystematically result in reduced conversion rates. As a result of the COVID-19 pandemic supply chaindisruptions described above, lead times for furniture increased by up to eight weeks compared totarget levels. Such longer lead times negatively impacted the Group’s customer conversion rate. Inaddition, longer lead times resulted in a reduction in units per order and AOV as customers tend to beless inclined to add additional products to their basket when time to delivery is extended. The Group’sgrowth in gross sales for the first three quarters of 2020 varied significantly from 12% in first quarterto 38% in the second quarter and 16% in the third quarter. As lead times started to normalise in thefourth quarter of 2020 and the first quarter of 2021 gross sales growth accelerated to 55% and 63%,respectively. Gross sales growth for 2020 was approximately 30%. Prior to 2020, the Group hadsuccessfully reduced the average lead-time proposition offered to customers through better alignment ofsupply and demand by both consistently building sales volume per SKU and continual development ofpredictive analytics. One of the Group’s key strategic priorities is to reduce its lead times below thelevel delivered prior to the COVID-19 pandemic, with the aim of increasing its conversion rates. SeePart V: “Business Overview — Strategy”. In particular, MADE intends to invest in reducing lead timefor furniture, moving from four to six weeks lead times to one to two weeks over the next two years.
* Under the Group’s revenue recognition policy, revenue is only recognised when the product isdelivered to customers. Consequently, due to unusually long lead times, revenue recognition wasdelayed for much of 2020 and the increase in gross sales in 2020 was therefore reflected withindeferred income rather than revenue to a greater extent than would normally be the case, as shown inthe table below. As a result, net revenue year-on-year growth was below gross sales growth. This alsoaffected EBITDA (by approximately £8 million).
For the three monthsended 31 March For the years ended 31 December
2021 2020 2020 2019 2018
(£m, unless otherwise indicated)Gross sales.................................. 110 67 315 242 194Net revenue ................................ 82 58 247 212 173Deferred income......................... (66) (21) (53) (20) (15)Deferred income days(1) ............. 59 30 65 31 29
—————(1) Refers to (deferred income / (gross sales less cancellations))*days in the period
* As increased levels of stock are delivered, the Group expects to recognise higher revenue to the thirdquarter of 2021 as deferred income normalises (absent further sustained disruptions). In addition, theGroup also expects deferred income to trend downwards as the Group invests and achieves a reductionin its lead times.
* Furlough arrangements and voluntary payment reduction. In accordance with government schemes,during the period when demand levels were unclear, in the United Kingdom, Germany and France, theGroup furloughed (or utilised similar government schemes in relation to) a maximum of 137employees from April until June 2020. As an increased demand profile became clear, the Group
68

ceased furlough arrangements, repurposing or absorbing costs of staff who were unable to work due togovernment guidance. 30% of the Group’s employees agreed to a voluntary temporary reduction inpay in exchange for a corresponding reduction in working hours between April and June of 2020.Senior members of the leadership team agreed to reduced pay for the three month period without acorresponding reduction in working hours. In addition to the Group’s participation in governmentfurlough schemes, the Group has received only limited additional governmental support, mainly in theform of VAT deferrals and limited rates relief restricted to the Group’s London showroom.
* Lease concessions. The Group negotiated certain lease concessions from its landlords, principally byagreeing to defer the payments of monthly rent to the end of the lease period, and in two cases,simultaneously extending the lease term by six months. The Group estimates cashflow savings ofapproximately £2 million in 2020 as a result of these concessions.
* Reduced marketing costs. Marketing costs decreased as a result of COVID-19 related reductions indemand from retailers for advertisement, resulting in decreases in prices for marketing. Such reductionin advertising costs combined with an increase in online traffic and demand led to a general decreasein marketing costs per visitor. See this Part VIII: “Operating and Financial Review —PrincipalFactors Affecting the Group’s Results of Operations — Marketing investment” above.
Centralised infrastructure
During the period under review, the Group has handled the increase in scale and activity of its business bycentralising management infrastructure in its head office location in London. This has enabled the Group touse its infrastructure effectively across different geographical markets. The Group’s central teams based inLondon include: central services, technology, product and merchandising leadership, creative and marketingteams. Technology development and technology licence arrangement decisions are centralised in London,delivering increased efficiency and consistency of technology platform across all regions. Through itscentralised marketing team, the Group generates marketing content and images for use across all of itswebsites. At 31 March 2021, there were 322 full-time employees in the London head office. The Group canaddress the increase in markets served and products sold by increasing the size of the London-based teams,and by more efficiently utilising the capacity of existing teams and facilities of central functional areas, suchas IT, logistics, finance and human resources. The Group also maintains a UK customer service office inIpswich delivering customer service support for the UK market and providing services across Europeanmarkets. Such centralisation has resulted in increased cost efficiency, as resources and know-how are moreeffectively leveraged across jurisdictions.
Supplier base
The Group operates a vertically integrated model working directly with designers and buying directly frommanufacturers in Asia and Europe. As of 31 March 2021, the Group had 205 factories, approximately 94%of which were located in China, India, Vietnam, the United Kingdom and Continental Europe. Currently, nosupply partner of the Group contributes more than 6% of gross sales. In the year ended 31 December 2020,the top 10 suppliers accounted for 36.1% of gross sales, indicating a good degree of diversification. Thissourcing strategy reduces the cost of sales and enables the Group to maintain good value price points for itscustomers while achieving gross margins in excess of 53% in 2020. Because the Group controls andmanages the supply chain by using their systems to monitor and control the flow of products, it is able todetermine the lead times and stock availability for customers. The Group principally fulfils orders in theUnited Kingdom directly from a leased warehouse at London Gateway port (staffed with its ownemployees), and from a third party warehouse in Redditch. Demand in Europe is fulfilled from third partywarehouses in the port of Antwerp, Belgium. Products are also sold online while in manufacture or intransit from the manufacturer to the warehouses. As a consequence, the deferred income (sales orders made,but not yet fulfilled, for which cash has been received in full) significantly increases the total currentliabilities which in turn exceed current assets, leading to negative working capital. This allows the Group torun a constant negative working capital position, which has increased annually with revenue benefiting freecash flow. This trend has been pronounced in 2020 due to the disruption in supply chain caused by theCOVID-19 pandemic, as further discussed above.
Operational and logistical infrastructure
Prior to 2018, the Group operated three warehouses with third party providers. As two of these third partyagreements came to an end, the decision was taken to invest in a proprietary warehouse in the UnitedKingdom and more scalable third party warehousing in Europe. This transition was effected over the course
69

of 2019, and completed in the first quarter of 2020. The transition had originally been planned to beundertaken between 2019 to 2021, but the threat of a hard Brexit and industrial action in France (where theprevious European warehousing activities were located) led the Group to accelerate the process and completethe transition in 2019. Thus, in 2019, the Group decided to cease operations at two of its existing thirdparty operated warehouses in the United Kingdom and France and to open a proprietary warehouse in theUnited Kingdom (London Gateway) and two third party outsourced facilities in Antwerp, Belgium with anindustrial third-party provider.
These changes to the Group’s warehouses resulted in a substantially larger footprint, with flexibility forfurther expansion, in order to support future growth. In addition, the Group incurred a number of one-offcosts (reflected as exceptional items in the Group’s results for the year ended 31 December 2019),including: warehouse start-up costs, costs incurred in connection with the running of dual warehouses,warehouse closing costs and costs related to inefficiencies during the transition period (such as additionalcharges from carriers and one-off layoff costs). During the period of transition, customer services costs(incurred to a third party based on volumes) increased due to higher staffing and external support requiredto handle a higher rate of calls and queries from customers, attributed to disruption to orders and deliveries.However, following the transition, the level of costs has reduced, supporting the view that the higher levelsincurred were only exceptional in nature and not recurring items. The Group’s investments in warehousesallow for future substantial growth as well as an expectation of higher service levels and ongoingefficiencies in future years. In addition to the one-off costs reflected as exceptional items, the warehousingtransition also impacted the Group’s financial profile due to an accommodation in trading dynamics requiredto ensure successful transition without adversely impacting customer experience. This included extendinglead-time buffers, promoting products that were not economically viable to move between warehouses andreducing sales initiatives during critical periods of transition, thereby impacting top and certain cost linedevelopment. The warehouse transition programme was completed in the first quarter of 2020.
Foreign currency fluctuations
The Group is subject to transaction and translation foreign currency fluctuations. The Group uses forwardforeign exchange contracts to manage a material portion of its transaction exposures incurred in US dollarsand Euros. The foreign exchange contracts are designated as cash flow hedges and are entered into forperiods consistent with foreign currency exposure of the underlying transactions, generally from one totwelve months. The Group’s revenue is denominated in the currency of the country where the relatedproduct is sold – pounds sterling for the Group’s UK sales, Swiss Francs for Switzerland and Euro for otherEuropean regions. The Group seeks to match the currency of its revenue and expenses for its operations ineach jurisdiction to reduce its exposure to currency fluctuations. The Group incurs distribution expenses andmarketing expenses primarily in pounds sterling and euro. Other administrative expenses are primarilyincurred in pounds sterling. Most of the Group’s cost of sales is denominated in US dollars, as most itemsare purchased from Asia, so the Group’s revenue and costs of sales are in different currencies, exposing theGroup to currency fluctuations. In the year ended 31 December 2020, none of the Group’s revenue was inUS dollars; 52.1% of the Group’s revenue was in pounds sterling, 46.3% in euro, and 1.6% in othercurrencies. In the year ended 31 December 2020, 82% of cost of sales was in US dollars, 9% in poundssterling and 9% in euro. Accordingly, fluctuations in the value of these currencies can affect the Group’sresults of operations. When the US dollar appreciates against the pound sterling, the Group’s gross profitmargins tend to decrease, whereas, when the US dollar depreciates against the pound sterling, the Group’sprofit margins tend to increase. Conversely, as the Group receives more euros in revenue than expensesincurred, appreciation of the euro against the pound sterling increases the operating profit, whereas,depreciation of the euro against the pound sterling reduces the operating profit. A five cent change in theGBP/USD exchange rate (based on 2021 forecast exchange rates and assuming no hedges are in place)would have an impact on EBITDA margin of approximately 1.4 percentage points and a five cent change inGBP/EUR exchange rate (based on 2021 forecast exchange rates and assuming no hedges are in place)would have an impact on EBITDA margin of approximately 0.8 percentage points. The Group aims tomaintain gross profit margins to targeted levels through the use of forward contracts to purchase currency upto 12 months in advance. 75-80% of 2021 foreign exchange requirements are covered by existing hedgesplaced in 2020.
The Group reports its consolidated financial statements in pounds sterling and, consequently, the presentationof the financial statements may also be affected by movements in foreign exchange rates. Income andexpenses related to transactions in foreign currencies are recorded by the Group’s entities at the averageexchange rate for the month. At the end of each month, items denominated in foreign currencies areretranslated at the rates prevailing at the end of the month.
70

For the purpose of presenting consolidated financial information, the assets and liabilities of the Group’ssubsidiaries are expressed in pounds sterling, using exchange rates prevailing at the end of the month.Exchange differences arising on translation of month-end balances of the subsidiary companies arerecognised in other comprehensive income and are transferred to the foreign currency translation reserve. Noexchange differences were recorded (£nil) in the three months ended 31 March 2021 or in the three monthsended 31 March 2020. In the year ended 31 December 2020, no exchange differences were recorded (£nil),and in the year ended 31 December 2019, a loss of £0.1 million was recorded (£nil in year ended31 December 2018). Full details regarding the foreign currency accounting policy are set out in note 2 tothe Audited Consolidated Financial Statements.
Brexit
The impact of Brexit on the Group’s operations has been limited as a consequence of the Group’s decisionto accelerate its investment in a proprietary warehouse in the United Kingdom (London Gateway) and morescalable third party warehousing in Europe (with two facilities in Antwerp) in 2019 in anticipation of Brexit.By restructuring its warehouses, the Group successfully separated the United Kingdom and ContinentalEuropean logistic operations, thus significantly reducing the potential impact from any regulatory andcustoms changes introduced as a result of Brexit.
Notwithstanding the above, the Group decided to focus on its core business and suspend trading in Irelanddue to increased shipping costs and regulatory complexities of shipping from the United Kingdom to Irelandas a consequence of Brexit. In addition, the Group’s operations were affected to a limited extent by portdisruptions that occurred in December 2020 and January 2021 which disrupted the transport of goods. Asthese port disruptions were against the backdrop of ongoing global freight disruptions, they did not have asignificant additional impact on the Group’s results of operations.
Recent Developments, Current Trading and Prospects
In accordance with MADE’s business plan, MADE is targeting gross sales of greater than £1.2 billion peryear by the end of 2025, representing a CAGR from 2020 to 2025 of 31%. Additionally, MADE is aspiringto deliver medium term Adjusted EBITDA in the low teens as a percentage of net revenue. MADE expectscontinued negative working capital in the medium term, in the mid-to-high single digits as a percentage ofnet revenue. MADE is also targeting capital expenditures in the range of 3% to 4% of net revenue in themedium term at the higher end of that range in the short term. Overall MADE aims to deliver medium termfree cash flow at around 10% of net revenue. Working towards these ambitions, for the year ending31 December 2021, MADE estimates that gross sales will increase by approximately 40% and then continuegrowing at ~30%+ over the medium term as MADE approaches its medium term gross sales target ofgreater than £1.2 billion per year by the end of 2025. MADE anticipates deferred income as a percentage ofgross sales in the year ending 31 December 2021 to be below the 2019 level as the Group invests to reducethe lead-time offer to customers. For the same period, MADE expects to see some deterioration in grossmargin due to freight costs to ship products from suppliers to MADE’s warehouses being inflated through2021 due to global cost increases resulting from capacity issues affecting all suppliers; this impact may beoffset in operating leverage from other costs, such as distribution, sales and marketing and overhead costs.In 2020 deferred income was higher than historic trends due to supply chain disruptions resulting in atemporarily extended lead-time offer to customers. Due to the unwinding of the high 2020 deferred incomebalance through 2021, net revenue is expected to grow ahead of sales growth at approximately 65% (55%in the United Kingdom and 75% in Continental Europe) in 2021. In the short term, gross margin andfulfilment costs, marketing costs and overheads (as a percentage of net revenue) are expected to decline.
In the determination of these targets, MADE has generally assumed that there will be no changes in existingpolitical, legal, fiscal, market or economic conditions or in applicable legislation, regulations or rules(including, but not limited to, accounting policies and accounting treatments), which, individually or in theaggregate, would be material to the Group’s results of operations. In addition, MADE has assumed thatonline penetration grows at the expected CAGR as set out in Part IV: “Industry Overview”, and that MADEis able to maintain and develop its existing customer proposition supported by the medium-term growthdrivers as disclosed in Part V: “Business Overview — Strategy”, including, among others, continuousimprovement of MADE’s range and lead time (which increases sales per SKU), investment in brandrecognition in Continental Europe and scaling of the homeware range (which is expected to result in anincrease in total homeware mix to approximately 40-50%). One of the key drivers of homewares gross salesmix expansion is expected to be MADE’s new curated marketplace, introducing likeminded artisan brands toMADE’s product range, which is expected to deliver approximately 10% of MADE’s total gross sales by2025. Increased overall mix of gross sales delivered from homewares is expected to result in a slight decline
71

in AOV over the medium to long term of approximately 3-4% per annum due to the lower selling price ofhomewares product. However, increased homewares mix is expected to improve the overall customereconomics of the business.
Certain statements in this Part VIII, including in particular the financial targets described immediately above,constitute forward-looking statements. These forward-looking statements are not guarantees of future financialperformance and the Group’s actual and future results could differ materially from those expressed orimplied by these forward-looking statements as a result of many factors, including but not limited to thosedescribed under Part II: “Presentation of Financial and Other Information—Forward-Looking Statements”and Part I: “Risk Factors”, including “MADE’s future results may differ materially from what is expressedor implied by the medium-term ambitions included in this Registration Document and investors should notplace undue reliance on this information”.
Description of Revenue Model
The Group begins to actively market and sell its products to customers when they are in the manufacturingand shipping phase. This can be up to 16 weeks prior to delivery to the customer. Customers are generallyentitled to cancel orders free of charge prior to delivery, and to return them up to 30 days after delivery.Both cancellation rate and return rate are in the mid-single digit percentage.
The Group uses a combination of performance and brand marketing to drive new customer acquisition, andthen uses targeted customer relationship management marketing to drive repeat orders.
AOV averaged £235 in the first quarter of 2021 and £229 in 2020, having reduced from £236 in 2019(compared to £250 in 2018) relating to an increased mix of homeware products, which was offset by apropensity for customers to “trade up” and lower mark down levels through the first quarter of 2021. Thetrend reflects the ongoing expansion of the homewares product range, where units typically sell for loweraverage prices compared to furniture items.
The Group has limited sales seasonality, with increases in demand focused on industry-wide cyber, winterand summer discounting periods. Due to the Group’s just-in-time supply model and competitive initialpricing, a requirement for discounting to clear unsold stock is limited. Consequently, average discount levelsfor the Group are relatively low. The Group tends to use discount periods to grow new customer volumesand to increase repeat order frequency.
Description of Key Income Statement Line Items
The following section presents the key income statement line items set out in the Group’s ConsolidatedFinancial Statements and in the Interim Consolidated Financial Statements.
Revenue (Net)
Revenue consists of online sales of products (net of returns and relevant vouchers and promotionaldiscounts) at point of delivery to customers, charges for delivery and revenue for disposal obsolete stockand trade orders, but excluding value added tax. Net revenue also includes research and developmentexpenditure credit (“RDEC”).
Cost of Sales
Cost of sales consists of the cost of products the Group sells, designer royalties that are linked to thevolume of sales of specific products or product groups, freight charges for transportation of goods fromsuppliers to the warehouses, cost of replacement stock for damaged products or those not successfullydelivered, import duties, commissions, product related environmental taxes and charges and product testingcosts.
Distribution expenses
Distribution expenses include all costs incurred to the point of sale as determined by the customer (home,place of work or alternative address). Warehousing costs (including own personnel), delivery costs,transaction processing fees and returns processing are the main cost categories.
Administrative expenses
Administrative expenses consist of marketing costs and all other general and administration costs. Marketingcosts consist of all online and offline advertising and marketing expenditure, the cost of public relations,
72

non-working media, in-house influencer teams and showrooms (including showroom lease charges and staffcosts).
General and administration costs consist of the employment costs of all head office functions (includinglegal, finance, human resources, product buying, logistics, IT and sales and marketing), share basedpayments, IT maintenance costs, lease charges and other property-related costs for the office, general officecosts, professional fees, depreciation, amortisation and impairment of intangible assets and net foreignexchange differences. General and administration costs include these costs for Group offices in the UnitedKingdom, Continental Europe, China and Vietnam.
Finance costs and finance income
Finance costs consist of bank interest payable, loan arrangement fees and the impact of any discountunwinding on long-term liabilities. Finance income consists of bank interest receivable, being interest fromcash deposits.
Income tax credit
Income tax credits include movements in deferred tax assets (“DTA”) and small and medium sizedenterprise research and development tax credits.
Non-IFRS Financial Measures
Adjusted EBITDA and Adjusted EBITDA margin
Adjusted EBITDA is a non-IFRS measure. It is used to evaluate the Group’s operating performance,generate future operating plans and make strategic decisions regarding the allocation of capital. Theexclusion of certain expenses in calculating Adjusted EBITDA facilitates operating performance comparisonson period-to-period bases. Accordingly, Adjusted EBITDA is presented in the historical financial informationto provide additional information to understand and evaluate the Group’s operating performance.
The Group defines Adjusted EBITDA as EBITDA adjusted to include the unwinding of the discount onlease liabilities and depreciation of right-of-use assets (from the date of adoption of IFRS 16) to reflect thefact that lease related costs are key underlying business operating expenses; exclude the impact of any sharebased payment expenses to reflect the fact that this item is not directly correlated to underlying businessperformance; and exclude the impact of any items deemed to be exceptional in nature.
Exceptional items are defined as transactions that, in the opinion of the Directors, should be adjusted inorder to provide a consistent and comparable view of the underlying business. Generally this will includethose items that are largely one-off or material in nature and which have been incurred outside of thenormal business operations, including but not limited to restructuring and business transformationprogrammes and fund-raising activities.
73

The following table sets out the reconciliation of Adjusted EBITDA to operating loss. As a result of usingthe modified retrospective approach to adopt IFRS 16 ‘Leases’, the results for the year ended 31 December2018 have not been restated which means that they are not directly comparable to the results presented forthe year ended 31 December 2019. The impact of applying IFRS 16 on the reported loss before tax for theyear ended 31 December 2019 was not material. The Group continues to present the cost of leases inAdjusted EBITDA consistent with the presentation of rent expense in 2018:
For the three monthsended 31 March For the years ended 31 December
2021 2020 2020 2019 2018
(£m)Loss before tax .................................... (1.8) (6.8) (14.2) (19.5) (5.0)Adjustments for
Depreciation of property, plant andequipment......................................... 0.6 0.6 2.4 1.9 1.0Amortisation of intangible assets .... 1.1 0.9 4.0 2.8 2.1Depreciation of right of use assets .. 1.0 1.0 3.9 3.2 —Net finance expense......................... 0.4 0.2 1.4 0.6 0.4
EBITDA............................................... 1.3 (4.1) (2.5) (11.0) (1.5)Adjustments for
Depreciation of right of use assets .. (1.0) (1.0) (3.9) (3.2) —Interest expense on lease liabilities . (0.1) (0.1) (0.5) (0.4) —Share based payments expense ....... 0.6 0.1 0.2 0.2 0.2Exceptional items: — — — — —
Restructuring ................................ — — 0.9 — —Fundraising................................... 1.0 — 0.5 — —Supply chain transformation........ — 0.2 0.2 4.6 0.1
Adjusted EBITDA ............................... 1.8 (4.9) (5.1) (9.8) (1.2)
Adjusted EBITDA margin................... 2.0% (8.4%) (2.1%) (4.6%) (0.7%)
The Group presents regional Adjusted EBITDA on a pre-central cost basis. This excludes head office andshared service related costs:
For the three monthsended 31 March For the years ended 31 December
2021 2020 2020 2019 2018
(£m)Adjusted EBITDA ............................... 1.8 (4.9) (5.1) (9.8) (1.2)Central administration costs ................ 7.4 5.8 22.8 23.8 18.6Adjusted EBITDA pre-central costs.... 9.2 0.9 17.7 14.0 17.4
United Kingdom............................... 6.2 1.9 16.7 12.1 15.6Continental Europe .......................... 3.0 (1.0) 1.0 1.9 1.8
Free Cash Flow
Free cash flow is defined as the change in cash and cash equivalents less cash received or utilised relatingto financing or share equity issues.
MADE considers free cash flow to be a useful measure as it represents the cash MADE generated afteraccounting for cash outflows to support operations and maintain its capital assets.
74

Reconciliation to Free Cash Flow
The following table sets out the reconciliation of free cash flow to change in cash and cash equivalents:
For the three monthsended 31 March For the three years ended 31 December
2021 2020 2020 2019 2018
Change in cash and cash equivalents.. 24.1 6.6 32.9 (18.1) 21.8
Less interest expenses (excludinginterest unwind from leases)............ 0.3 (0.1) 0.9 0.2 0.5Less issuance of share equity .......... (0.0) (0.0) (0.6) (0.1) (30.3)Less proceeds of borrowings........... (0.0) (10.0) (9.9) — 4.0
Free Cash Flow.................................... 24.4 (3.5) 23.3 (18.0) (4.0)
Comparison of Results for the Group for the Three Months Ended 31 March 2021 and 31 March 2020
The following table presents the Group’s results for the three months ended 31 March 2021 and 2020.
For the three monthsended 31 March
2021£m
2020£m
Revenue ....................................................................................................................... 82.4 58.1Cost of sales ................................................................................................................ (40.9) (28.0)
Gross profit.................................................................................................................. 41.5 30.1Distribution expenses................................................................................................... (16.4) (14.5)Administrative expenses .............................................................................................. (26.5) (22.2)
Operating loss ............................................................................................................. (1.4) (6.6)
Finance costs................................................................................................................ (0.4) (0.2)Loss before tax............................................................................................................ (1.8) (6.8)Income tax expense ..................................................................................................... — —
Loss for the period...................................................................................................... (1.8) (6.8)
Loss for the period attributed to equity holders of the Company.............................. (1.8) (6.8)
Revenue
Gross sales increased by £42 million, or 62.5%, to £109.5 million or the three months ended 31 March2021 from £67.2 million for the three months ended 31 March 2020. Supply chain disruptions related to theCOVID-19 pandemic persisted through the period, particularly in relation to global freight disruptions. Stockbegan to arrive and was dispatched to customers at a greater level towards the end of the quarter. Thisresulted in an ongoing high deferred revenue, meaning that revenue growth continued to lag gross salesgrowth (see this Part VIII: “Operating and Financial Review – Principal Factors Affecting the Group’sResults of Operations – COVID-19”).
Despite ongoing delays to revenue recognition, revenue increased by £24.3 million, or 41.6%, to£82.4 million for the three months ended 31 March 2021 from £58.1 million for the three months ended31 March 2020. The increase was primarily driven by an increase in both in the UK operations andContinental European operations which was largely attributable to an increase in the number of newcustomers (primarily as a result of investments in marketing, product range development and platformenhancements) and an overall growth in online penetration.
75
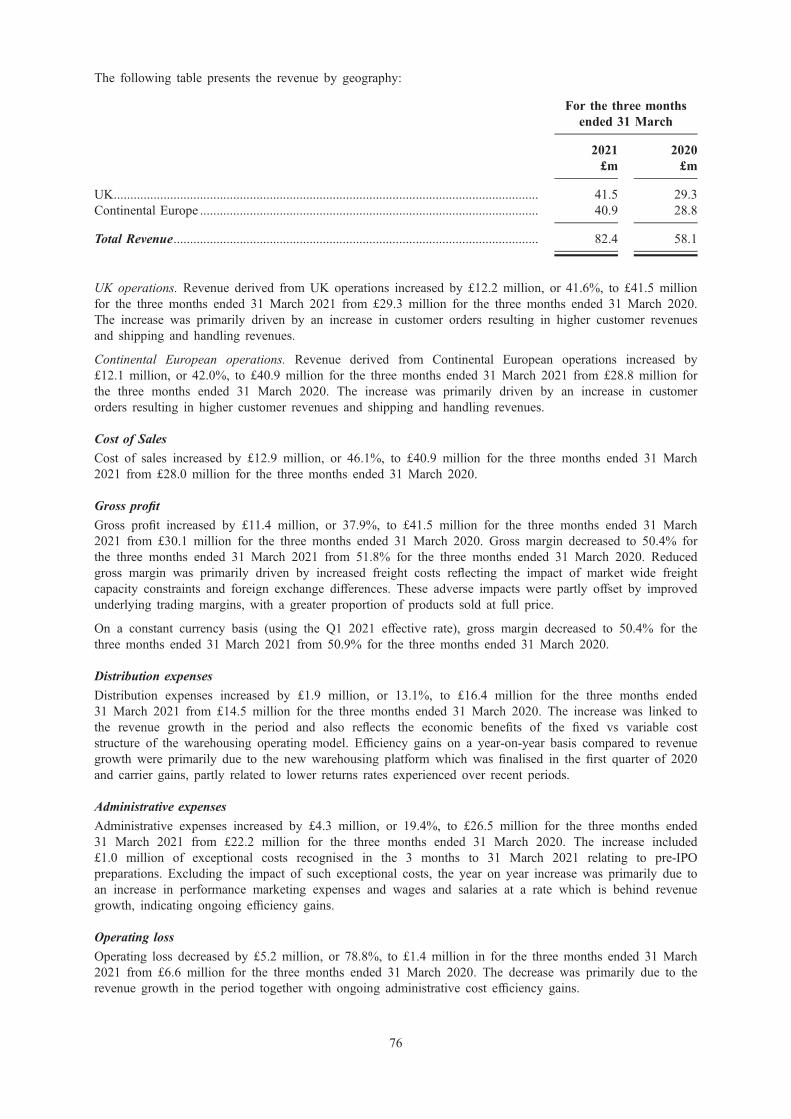
The following table presents the revenue by geography:
For the three monthsended 31 March
2021£m
2020£m
UK................................................................................................................................ 41.5 29.3Continental Europe ...................................................................................................... 40.9 28.8
Total Revenue.............................................................................................................. 82.4 58.1
UK operations. Revenue derived from UK operations increased by £12.2 million, or 41.6%, to £41.5 millionfor the three months ended 31 March 2021 from £29.3 million for the three months ended 31 March 2020.The increase was primarily driven by an increase in customer orders resulting in higher customer revenuesand shipping and handling revenues.
Continental European operations. Revenue derived from Continental European operations increased by£12.1 million, or 42.0%, to £40.9 million for the three months ended 31 March 2021 from £28.8 million forthe three months ended 31 March 2020. The increase was primarily driven by an increase in customerorders resulting in higher customer revenues and shipping and handling revenues.
Cost of Sales
Cost of sales increased by £12.9 million, or 46.1%, to £40.9 million for the three months ended 31 March2021 from £28.0 million for the three months ended 31 March 2020.
Gross profit
Gross profit increased by £11.4 million, or 37.9%, to £41.5 million for the three months ended 31 March2021 from £30.1 million for the three months ended 31 March 2020. Gross margin decreased to 50.4% forthe three months ended 31 March 2021 from 51.8% for the three months ended 31 March 2020. Reducedgross margin was primarily driven by increased freight costs reflecting the impact of market wide freightcapacity constraints and foreign exchange differences. These adverse impacts were partly offset by improvedunderlying trading margins, with a greater proportion of products sold at full price.
On a constant currency basis (using the Q1 2021 effective rate), gross margin decreased to 50.4% for thethree months ended 31 March 2021 from 50.9% for the three months ended 31 March 2020.
Distribution expenses
Distribution expenses increased by £1.9 million, or 13.1%, to £16.4 million for the three months ended31 March 2021 from £14.5 million for the three months ended 31 March 2020. The increase was linked tothe revenue growth in the period and also reflects the economic benefits of the fixed vs variable coststructure of the warehousing operating model. Efficiency gains on a year-on-year basis compared to revenuegrowth were primarily due to the new warehousing platform which was finalised in the first quarter of 2020and carrier gains, partly related to lower returns rates experienced over recent periods.
Administrative expenses
Administrative expenses increased by £4.3 million, or 19.4%, to £26.5 million for the three months ended31 March 2021 from £22.2 million for the three months ended 31 March 2020. The increase included£1.0 million of exceptional costs recognised in the 3 months to 31 March 2021 relating to pre-IPOpreparations. Excluding the impact of such exceptional costs, the year on year increase was primarily due toan increase in performance marketing expenses and wages and salaries at a rate which is behind revenuegrowth, indicating ongoing efficiency gains.
Operating loss
Operating loss decreased by £5.2 million, or 78.8%, to £1.4 million in for the three months ended 31 March2021 from £6.6 million for the three months ended 31 March 2020. The decrease was primarily due to therevenue growth in the period together with ongoing administrative cost efficiency gains.
76

Finance costs
Finance costs increased by £0.2 million, or 100%, to £0.4 million for the three months ended 31 March2021 from £0.2 million for the three months ended 31 March 2020. The increase was due to interestexpense on a term loan which was entered into in May 2020.
Loss before tax
Loss before tax decreased by £5.0 million, or 73.5%, to £1.8 million for the three months ended 31 March2021 from £6.8 million for the three months ended 31 March 2020. The decrease was primarily due to therevenue growth in the period together with ongoing administrative cost efficiency gains.
Income tax expense (credit)
No income tax expense (credit) was reported for the three months ended 31 March 2021 or for the threemonths ended 31 March 2020.
Loss for the period
Loss for the period decreased by £5.0 million, or 73.5%, to £1.8 million for the three months ended31 March 2021 from £6.8 million for the three months ended 31 March 2020.
Comparison of Results for the Group for the Years Ended 31 December 2020 and 31 December 2019
The following table presents the Group’s results for the years ended 31 December 2020 and 2019.
For the years ended31 December
2020£m
2019£m
Revenue ....................................................................................................................... 247.3 211.8Cost of sales ................................................................................................................ (115.7) (96.6)
Gross profit.................................................................................................................. 131.6 115.2Distribution expenses................................................................................................... (56.6) (51.5)Administrative expenses .............................................................................................. (87.8) (82.6)
Operating loss ............................................................................................................. (12.8) (18.9)
Finance costs................................................................................................................ (1.4) (0.7)Finance income............................................................................................................ — 0.1
Loss before tax............................................................................................................ (14.2) (19.5)Income tax expense ..................................................................................................... 6.6 (0.1)
Loss for the year ......................................................................................................... (7.6) (19.6)
Loss for the year attributed to equity holders of the Company................................. (7.6) (19.6)
Revenue
Revenue increased by £35.5 million, or 16.8%, to £247.3 million in 2020 from £211.8 million in 2019. Theincrease was primarily driven by an increase in orders both in the UK operations and Continental Europeanoperations which was largely attributable to an increase in the number of new customers (primarily as aresult of investments in marketing, range development and platform enhancements) and on an overallincrease in online penetration (further accelerated as a consequence of the COVID-19) pandemic.Accordingly, gross sales increased more than 30% during 2020 compared to 2019. During 2020, COVID-19related supply chain disruptions extended customer lead-times in all regions, resulting in deferred incomeincreasing more than 169% (due to the timing of revenue recognition). Such deferred income will berecognised as revenue when products are delivered to customers in future periods.
77

The following table presents the revenue by geography:
For the years ended31 December
2020£m
2019£m
UK................................................................................................................................ 128.8 114.3Continental Europe ...................................................................................................... 118.5 97.5
Total Revenue(1) .......................................................................................................... 247.3 211.8
—————(1) During the year ended 31 December 2020 the Group recognised £0.8 million of other revenue relating to amounts receivable under the
Research and Development Expenditure Credit (RDEC) scheme (2019: £nil; 2018: £nil).
UK operations. Revenue derived from UK operations increased by £14.5 million, or 12.7%, to £128.8 in2020 from £114.3 million in 2019. The increase was primarily driven by an increase in customer ordersresulting in higher customer revenues and shipping and handling revenues.
Continental European operations. Revenue derived from Continental European operations increased by£21.0 million, or 21.5%, to £118.5 million in 2020 from £97.5 million in 2019. The increase in revenueswas primarily driven by an increase in customer orders resulting in higher customer revenues (primarily inFrance, Germany and the Netherlands).
Cost of Sales
Cost of sales increased by £19.1 million, or 19.8%, to £115.7 million in 2020 from £96.6 million in 2019.The increase was primarily driven by an increase in the volume of orders dispatched and the impact ofadverse currency exchange rates.
Gross profit
Gross profit increased by £16.4 million, or 14.2%, to £131.6 million in 2020 from £115.2 million in 2019.Gross margin decreased to 53.2% in 2020 from 54.4% in 2019. The reduction in reported gross marginlargely reflects the impact of foreign currency pressures. On a constant currency basis, the Group improvedgross margin 2.2 percentage points from 2019 to 2020.
Distribution expenses
Distribution expenses increased by £5.1 million, or 9.9%, to £56.6 million in 2020 from £51.5 million in2019. The increase was behind revenue growth due to moving from a third party logistics warehouse modelfor large goods warehousing to a leased warehouse with MADE’s own staff for the large goods warehousein the UK during 2019. An increase in number of orders delivered resulted in higher delivery costs,warehouse costs, credit card processing fees and other distribution costs.
Administrative expenses
Administrative expenses increased by £5.2 million, or 6.3%, to £87.8 million in 2020 from £82.6 million in2019. The increase included £1.6 million of exceptional costs recognised in 2020, mainly relating to arestructuring programme. Excluding the impact of such exceptional costs, the year on year increase wasprimarily due to an increase in performance marketing expenses and wages and salaries, partially offset by adecrease in brand and showroom marketing costs.
Operating loss
Operating loss decreased by £6.1 million, or 32.3%, to £12.8 million in 2020 from £18.9 million in 2019.The decrease was primarily due to growth in revenues together with marketing and overhead costefficiencies. In addition, the 2019 operating loss included £4.6 million of one-off cost investment in thesupply chain operations that was not repeated in 2020.
Finance income/costs
Finance costs increased by £0.7 million, or 100%, to £1.4 million in 2020 from £0.7 million in 2019. Theincrease is due to additional interest costs arising from a term loan entered into in May 2020.
78

Loss before tax
Loss before tax decreased by £5.3 million, or 27.2%, to £14.2 million in 2020 from £19.5 million in 2019.The decrease was a function of revenue growth and cost efficiencies, partly offset by foreign currencyheadwinds.
Income tax expense
Income tax credit increased by £6.7 million to £6.6 million in 2020 from a £0.1 million tax expense in2019. The increase was due to the recognition of deferred tax assets relating to cumulative tax allowablelosses to date which the Group anticipates to be utilised in future years.
Loss for the year
Loss for the year decreased by £12.0 million, or 61.2%, to £7.6 million in 2020 from £19.6 million in2019.
Comparison of Results for the Group for the Years Ended 31 December 2019 and 31 December 2018
The following table presents the Group’s results for the years ended 31 December 2019 and 2018:
For the years ended31 December
2019£m
2018£m
Revenue ....................................................................................................................... 211.8 173.4Cost of sales ................................................................................................................ (96.6) (80.4)
Gross profit.................................................................................................................. 115.2 93.0Distribution expenses................................................................................................... (51.5) (33.0)Administrative expenses .............................................................................................. (82.6) (64.6)
Operating loss ............................................................................................................. (18.9) (4.6)
Finance costs................................................................................................................ (0.7) (0.5)Finance income............................................................................................................ 0.1 0.1
Loss before tax............................................................................................................ (19.5) (5.0)Income tax (expense)/credit......................................................................................... (0.1) 1.0
Loss for the year ......................................................................................................... (19.6) (4.0)
Loss for the year attributed to equity holders of the Company................................. (19.6) (4.0)
Revenue
Revenue increased by £38.4 million, or 22.1%, to £211.8 million in 2019 from £173.4 million in 2018. Theincrease was primarily driven by an increase in orders both in the UK operations and Continental Europeanoperations which was largely attributable to an increase in the number of new customers (primarily as aresult of investments in marketing, product range development and platform enhancements) and an overallgrowth in online penetration.
79

The following table presents the revenue by geography:
For the years ended31 December
2019£m
2018£m
UK................................................................................................................................ 114.3 100.4Continental Europe ...................................................................................................... 97.5 73.0
Total Revenue.............................................................................................................. 211.8 173.4
UK operations. Revenue derived from UK operations increased by £13.9 million, or 13.8%, to £114.3 million in2019 from £100.4 million in 2018. The increase was primarily driven by an increase in customer orders resultingin higher customer revenues and shipping and handling revenues.
Continental European operations. Revenue derived from Continental European operations increased by£24.5 million, or 33.6%, to £97.5 million in 2019 from £73.0 million in 2018. The increase was primarilydriven by an increase in customer orders resulting in higher customer revenues and shipping and handlingrevenues.
Cost of Sales
Cost of sales increased by £16.2 million, or 20.1%, to £96.6 million in 2019 from £80.4 million in 2018.The increase was primarily driven by an increase in the volume of orders dispatched, partly offset by theimpact of favourable currency exchange rates.
Gross profit
Gross profit increased by £22.2 million, or 23.8%, to £115.2 million in 2019 from £93.0 million in 2018.Gross margin increased to 54.4% in 2019 from 53.6% in 2018. The improvement in reported gross marginwas due to ongoing reduction in cost of product with scale and a favourable foreign currency position in2019. However, gross margin was impacted by disruption from warehouse moves during 2019. On aconstant currency basis the Group gross margin reduced by 1.2 percentage points from 2018 to 2019.
Distribution expenses
Distribution expenses increased by £18.5 million, or 56.1%, to £51.5 million in 2019 from £33.0 million in2018. This included £4.6 million of exceptional costs relating to a supply chain transformation programmeimplemented in 2019. Excluding the impact of this, the year on year increase was primarily due to anincrease in volume of orders with an increase in delivery costs and warehouse costs as a higher quality andmore scalable logistics platform was implemented. To a lesser extent, the increase was due to an increase incredit card processing fees related to new payment methods and other distribution costs.
Administrative expenses
Administrative expenses increased by £18.0 million, or 27.9%, to £82.6 million in 2019 from £64.6 millionin 2018. The increase was primarily due to an increase in marketing expenses, wages and salaries,technology and IT maintenance costs, China office costs, professional service fees, depreciation, amortisationand foreign exchange differences, partially offset by a decrease in UK office costs. During 2019, the Groupinvested in its team and overhead base for future growth.
Operating profit (loss)
Operating loss increased by £14.3 million, or 310.9%, to £18.9 million in 2019 from £4.6 million in 2018.The increase was primarily due to the impact of the supply chain transformation program implemented in2019, which required a one-off cost investment and also resulted in some short term cost inefficiencies andimpacted growth.
Finance income/costs
Finance costs increased by £0.2 million, or 40.0%, to £0.7 million in 2019 from £0.5 million in 2018. Theincrease was primarily due to the adoption of IFRS 16 in 2019, with the cost of discount unwinding onlease liabilities being reported against finance costs.
80

Loss before tax
Loss before tax increased by £14.5 million, or 290.0%, to £19.5 million in 2019 from £5.0 million in 2018.The increase was primarily due to the impact of the supply chain transformation program implemented in2019, which required a one-off cost investment and also resulted in some short term cost inefficiencies.
Income tax expense (credit)
Income tax expense increased by £1.1 million, to £0.1 million in 2019 from a tax credit of £1.0 million in2018. The increase was primarily due to the fact that the Company moved out of the small and mediumsized enterprises R&D tax credit regime and into the R&D expenditure credit regime in 2019.
Loss for the year
Loss for the year increased by £15.6 million, or 390.0%, to £19.6 million in 2019 from £4.0 million in2018. The increase was primarily due to the impact of the supply chain transformation programimplemented in 2019, which required a one-off cost investment and also resulted in some short term costinefficiencies.
Liquidity and Capital Resources
Overview
The Group’s liquidity requirements, including both its short and long-term requirements, are primarilyfinanced by the Group’s cash flow from operating activities, liquid funds and credit facilities. The primaryuse of this liquidity is to fund the Group’s operations and growth plan. When cash flow permits, the Groupwill consider other uses of capital.
Working capital
The Group’s free cash flow is supported by a negative net working capital position impacted by stock,debtors, creditors, and deferred income. For the year ended 31 December 2020 the working capital(expressed as a percentage of revenue) was (24)% (compared to (11%) for the year ended 31 December2019). The increased level of negative working capital in 2020 related to long lead times due to supplychain disruptions resulting from the COVID-19 pandemic in 2020. The effect was to increase deferredincome levels from (9%) of net revenue in 2019 to (21%) of net revenue in 2020 and decreased stocklevels from 12% of net revenue in 2019 to 9% of net revenue in 2020. Additionally, a greater portion ofstock in 2020 comprised goods-in-transit compared to 2019.
81

Cash flow analysis
The following table presents the primary components of the Group’s cash flow for the years ended31 December 2020, 2019 and 2018 and for the three months ended 31 March 2021 and 2020, respectively.
For the three monthsended 31 March For the years ended 31 December
2021 2020 2020 2019 2018
(in £m)Net cash (outflow)/inflow fromoperating activities ............................... 26.8 (0.4) 32.2 (6.6) 2.4Net cash outflow used in investingactivities ............................................... (1.7) (1.9) (5.7) (8.5) (6.0)Net cash (outflow)/inflow fromfinancing activities ............................... (1.0) 8.9 6.4 (3.0) 25.4Foreign exchange differences on cashand cash equivalents ............................ — — — — —
Change in cash and cash equivalents 24.1 6.6 32.9 (18.1) 21.8
Cash and cash equivalents at thebeginning of the period ....................... 50.4 17.5 17.5 35.6 13.8
Cash and cash equivalents at the endof the period ....................................... 74.5 24.1 50.4 17.5 35.6
Cash flow from operating activities
Cash inflow from operating activities increased by £27.2 million, to an inflow of £26.8 million for the threemonths ended 31 March 2021, from an outflow of £0.4 million for the three months ended 31 March 2020.Increased cash inflow was principally due to increased negative working capital as the Group continued tosell product on extended lead times and improved trading profitability.
Cash outflow from operating activities increased by £38.8 million, to an inflow of £32.2 million in 2020,from an outflow of £6.6 million in 2019, principally reflecting an increase in deferred revenue as a result oflead time disruptions.
Cash outflow from operating activities increased by £9.0 million, to £6.6 million in 2019 from an inflow of£2.4 million in 2018, principally due to one off expenditure on supply chain infrastructure and investmentsto prepare the Group for growth over the coming years.
Cash flow from investing activities
Cash outflow used in investing activities decreased by £0.2 million, to £1.7 million for the three monthsended 31 March 2021 from £1.9 million for the three months ended 31 March 2020, principally due toreduced levels of capital expenditure as the Group invested in infrastructure for growth through priorperiods.
Cash outflow used in investing activities decreased by £2.8 million, to £5.7 million in 2020 from£8.5 million in 2019, principally due to a reduction in capital expenditure on tangible fixed assets.
Cash outflow used in investing activities increased by £2.5 million, to £8.5 million in 2019 from£6.0 million in 2018, principally due to increased capital expenditure on leasehold improvements.
Cash flow from financing activities
Cash outflow from financing activities increased by £9.9 million, to £1.0 million for the three months ended31 March 2021 from an inflow of £8.9 million for the three months ended 31 March 2020, principally dueto draw down of a revolving credit financing facility in 2020.
Cash inflow from financing activities increased by £9.4 million, to an inflow of £6.4 million in 2020 froman outflow of £3 million in 2019, principally due to the £10 million term loan entered into in May 2020,partially offset by interest arising from financing facilities.
82

Cash outflow from financing activities increased by £28.4 million, to an outflow of £3.0 million in 2019from an inflow of £25.4 million in 2018, principally reflecting the £30.3 million capital injection received in2018 as well as the inclusion of lease payments in financing activities in 2019 upon the adoption ofIFRS 16. Operating lease rental payments were previously presented within cash flows from operations.
Cash
The Group had cash in the amount of £74.5 million at 31 March 2021, £50.4 million at 31 December 2020,£17.5 million at 31 December 2019 and £35.6 million at 31 December 2018.
Capital expenditure
The Group’s net capital expenditure, being the net cash outflow used in investing activities was £5.7 millionfor the year ended 31 December 2020, £5.0 million of which corresponded to IT and R&D, and£0.7 million to other expenditures.
The Group’s net capital expenditure for the year ended 31 December 2019 was £8.5 million, of which£5.5 million corresponded to IT and R&D, £1.0 million to warehouse restructuring expenditures,£1.5 million to showroom expenditures and £0.4 million to other expenditures.
The Group’s net capital expenditure for the year ended 31 December 2018 was £6.0 million, of which£3.9 million corresponded to IT and R&D, £0.4 million to warehouse restructuring expenditures,£0.6 million to showroom expenditures and £1.2 million to other expenditures.
As of 31 December 2020, the Group had no commitments for the acquisition of property, plant andequipment. The Group has planned capital expenditures for its 2021 financial year primarily for ongoingtechnology investments and logistics capacity expansion within existing sites. The Group expects to fundthese capital expenditures from existing cash reserves and free cash flow generated from operations.
Directors believe that the Group’s ongoing capital expenditure requirements in the medium term will bebroadly in line with revenue growth, pending further investments in new initiatives following the Offering.See Part V: “Business Overview — Strategy.”
Financing Arrangements and Commitments
Description of material financing arrangements and commitments
The table below presents the terms and maturity of the Group’s interest-bearing loans, facilities andborrowings as at 31 March 2021:
Group
Nominalinterest rate
Averageeffective
interest rate CurrencyYear of
maturityNominal
value
Carryingamount as of
31 March2020
Term loan................................................. 9.75% 10.75% GBP 2023 10.0 million 9.7 million
Contractual commitments and contingent liabilities
The Group had the following contractual commitments as at 31 March 2021:
Payment Due by Period
Contractual Obligations TotalLess than
1 year 1-2 years 3-5 yearsMore than
5 years
(in £m)Property lease....................................... 13.5 4.8 4.3 4.4 —Repayment of bank loan...................... 12.1 0.7 1.0 10.4 —
Total..................................................... 25.6 5.5 5.3 14.8 —
As at 31 March 2021, the Group has capital commitments for expenditure on property, plant and equipmentcontracted, but not provided for, of £3.0 million.
83

Off-Balance Sheet Arrangements
As at 31 December 2020, the Group did not have any off-balance sheet arrangements.
Disclosures About Financial Risks
The Group’s activities expose it to a number of financial risks, which are described in more detail inNote 23 to the Audited Consolidated Financial Statements.
The Group manages its foreign currency risk with respect to the US dollar through the use of forwardcontracts to purchase currency up to 12 months in advance. The fair value of forward foreign exchangecontracts recognised in the Statement of Financial Position for the year ended 31 December 2020 included acurrent financial asset of £1.2 million and a current financial liability of £6.0 million. Cash flows relating tothese contracts will occur during the year ending 31 December 2021, and the gains or losses will berecognised in the period that they realised. More information about the Group’s foreign currency optioncontracts are detailed in Note 15 to the Audited Consolidated Financial Statements.
Key Accounting Policies
For a description of the Group’s critical accounting judgements and key sources of estimation uncertainty,see Note 2 to the Audited Consolidated Financial Statements.
For a description of new standards, interpretations and amendments, see Note 3 to the Audited ConsolidatedFinancial Statements.
84

PART IX
GROUP HISTORICAL FINANCIAL INFORMATION
SECTION A: ACCOUNTANT’S REPORT ON THE GROUP HISTORICAL FINANCIALINFORMATION
The DirectorsMade.com Limited28 Irish TownGibraltarGX11 1AA
25 May 2021
Dear Ladies and Gentlemen
Made.com Limited
We report on the financial information set out in section B of Part IX: “Group Historical FinancialInformation” for the three years ended 31 December 2018, 31 December 2019 and 31 December 2020 (the“Financial Information”).
This report is required by item 18.3.1 of Annex 1 of the UK version of Commission Delegated Regulation(EU) 2019/980 and is given for the purpose of complying with that item and for no other purpose.
Save for any responsibility that may arise under Prospectus Regulation Rule 5.3.2R (2)(f) to any person asand to the extent there provided, to the fullest extent permitted by law we do not assume any responsibilityand will not accept any liability to any other person for any loss suffered by any such other person as aresult of, arising out of, or in connection with this report or our statement, required by and given solely forthe purposes of complying with item 1.3 of Annex 1 to the UK version of Commission DelegatedRegulation (EU) 2019/980, consenting to its inclusion in the registration document dated 25 May 2021 (the“Registration Document”).
Opinion on the Financial Information
In our opinion, the financial information gives, for the purposes of the Registration Document, a true andfair view of the state of affairs of the Made.com Limited as at the dates stated and of its profits, cash flowsand changes in equity for the periods then ended in accordance with International Financial ReportingStandards as adopted by the European Union.
Responsibilities
The Directors of Made.com Limited are responsible for preparing the Financial Information in accordancewith International Financial Reporting Standards as adopted by the European Union.
It is our responsibility to form an opinion on the Financial Information and to report our opinion to you.
Basis of Preparation
The Financial Information has been prepared for inclusion in the Registration Document dated 25 May 2021of Made.com Limited on the basis of the accounting policies set out in Note 1.
Basis of opinion
We conducted our work in accordance with Standards for Investment Reporting issued by the FinancialReporting Council in the United Kingdom. We are independent in accordance with the FRC’s EthicalStandard as applied to Investment Circular Reporting Engagements, and we have fulfilled our other ethicalresponsibilities in accordance with these requirements.
Our work included an assessment of evidence relevant to the amounts and disclosures in the FinancialInformation. It also included an assessment of significant estimates and judgments made by those responsiblefor the preparation of the Financial Information and whether the accounting policies are appropriate to theentity’s circumstances, consistently applied and adequately disclosed.
85

We planned and performed our work so as to obtain all the information and explanations which weconsidered necessary in order to provide us with sufficient evidence to give reasonable assurance that theFinancial Information is free from material misstatement whether caused by fraud or other irregularity orerror.
Our work has not been carried out in accordance with auditing or other standards and practices generallyaccepted in other jurisdictions and accordingly should not be relied upon as if it had been carried out inaccordance with those standards and practices.
Conclusions Relating to Going Concern
We have not identified a material uncertainty related to events or conditions that, individually or collectively,may cast significant doubt on Made.com Limited’s ability to continue as a going concern for a period of atleast 12 months from the date of the Registration Document. We conclude that the Directors’ use of thegoing concern basis of accounting in the preparation of the Financial Information is appropriate.
Declaration
For the purposes of item 1.2 of Annex 1 the UK version of Commission Delegated Regulation (EU)2019/980 we are responsible for this report as part of the Registration Document and declare that, to thebest of our knowledge, the information contained in this report is in accordance with the facts and that thereport contains no omission likely to affect its import. This declaration is included in the RegistrationDocument in compliance with item 1.2 of Annex 1 of the UK version of Commission Delegated Regulation(EU) 2019/980.
Yours faithfully
Ernst & Young LLP
86
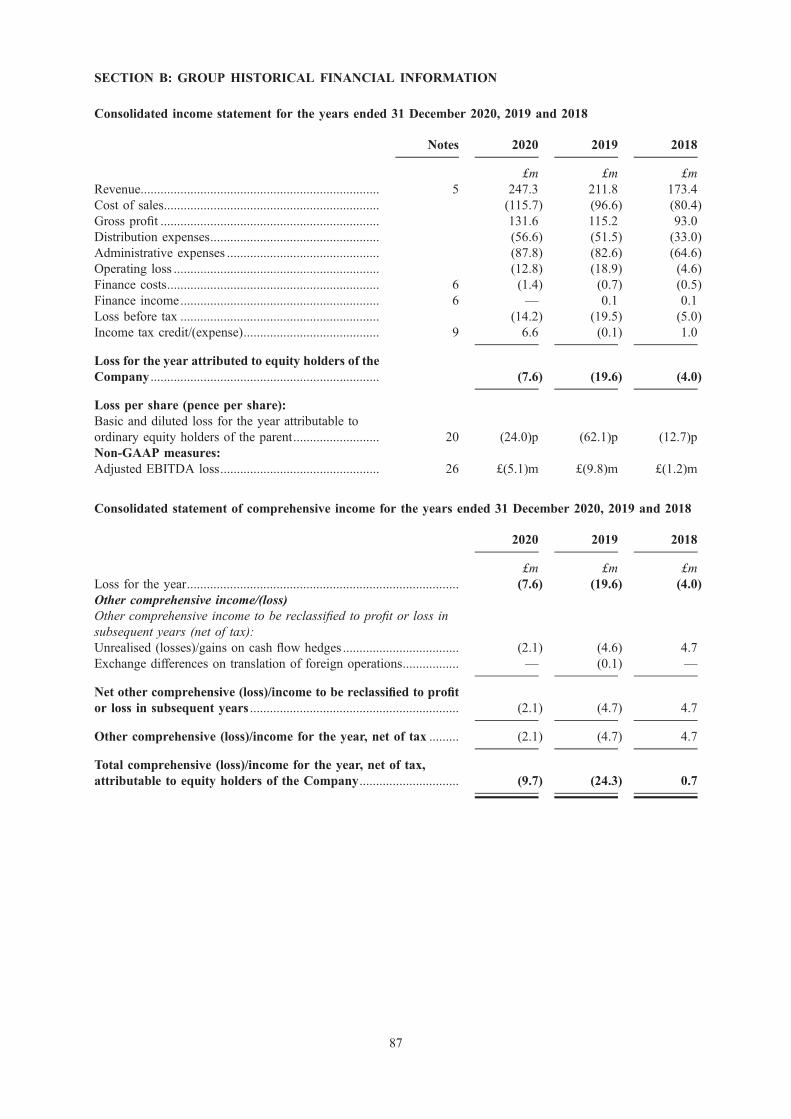
SECTION B: GROUP HISTORICAL FINANCIAL INFORMATION
Consolidated income statement for the years ended 31 December 2020, 2019 and 2018
Notes 2020 2019 2018
£m £m £mRevenue........................................................................ 5 247.3 211.8 173.4Cost of sales................................................................. (115.7) (96.6) (80.4)Gross profit .................................................................. 131.6 115.2 93.0Distribution expenses................................................... (56.6) (51.5) (33.0)Administrative expenses .............................................. (87.8) (82.6) (64.6)Operating loss .............................................................. (12.8) (18.9) (4.6)Finance costs................................................................ 6 (1.4) (0.7) (0.5)Finance income............................................................ 6 — 0.1 0.1Loss before tax ............................................................ (14.2) (19.5) (5.0)Income tax credit/(expense)......................................... 9 6.6 (0.1) 1.0
Loss for the year attributed to equity holders of theCompany ..................................................................... (7.6) (19.6) (4.0)
Loss per share (pence per share):Basic and diluted loss for the year attributable toordinary equity holders of the parent.......................... 20 (24.0)p (62.1)p (12.7)pNon-GAAP measures:Adjusted EBITDA loss................................................ 26 £(5.1)m £(9.8)m £(1.2)m
Consolidated statement of comprehensive income for the years ended 31 December 2020, 2019 and 2018
2020 2019 2018
£m £m £mLoss for the year.................................................................................. (7.6) (19.6) (4.0)Other comprehensive income/(loss)Other comprehensive income to be reclassified to profit or loss insubsequent years (net of tax):Unrealised (losses)/gains on cash flow hedges ................................... (2.1) (4.6) 4.7Exchange differences on translation of foreign operations................. — (0.1) —
Net other comprehensive (loss)/income to be reclassified to profitor loss in subsequent years ............................................................... (2.1) (4.7) 4.7
Other comprehensive (loss)/income for the year, net of tax ......... (2.1) (4.7) 4.7
Total comprehensive (loss)/income for the year, net of tax,attributable to equity holders of the Company.............................. (9.7) (24.3) 0.7
87

Consolidated balance sheets at 31 December 2020, 2019 and 2018
Notes 2020 2019 2018
£m £m £mNon-current assetsProperty, plant and equipment..................................... 10 3.4 5.1 3.4Intangible assets........................................................... 11 8.9 7.9 5.4Right of Use Assets..................................................... 19 12.3 15.0 —Deferred tax asset ........................................................ 9 12.2 5.1 4.1Rent deposits................................................................ 0.5 0.5 0.5
37.3 33.6 13.4
Current assetsInventories.................................................................... 12 21.5 25.6 17.9Trade and other receivables......................................... 13 13.2 8.7 8.7Derivative asset............................................................ 15 1.2 3.2 5.7Cash ............................................................................. 14 50.4 17.5 35.6
86.3 55.0 67.9
Total assets.................................................................. 123.6 88.6 81.3
Current liabilitiesLease liabilities ............................................................ 19 (4.5) (4.1) —Trade and other payables............................................. 16 (39.6) (36.9) (31.5)Derivative liability ....................................................... 15 (6.0) (5.4) (1.5)Deferred revenue.......................................................... 18 (52.8) (19.6) (14.9)Provisions..................................................................... 17 — (0.1) —
(102.9) (66.1) (47.9)
Non-current liabilitiesLease liabilities ............................................................ 19 (9.7) (12.7) —Provisions..................................................................... 17 (1.3) (1.1) (0.6)Interest bearing loans and borrowings ........................ 15 (9.7) — —
(20.7) (13.8) (0.6)
Total liabilities ............................................................ (123.6) (79.9) (48.5)
Net assets..................................................................... 0.0 8.7 32.8
Capital and reservesShare capital................................................................. 21 0.0 0.0 0.0Share premium............................................................. 21 62.2 61.6 61.5Foreign currency translation reserve ........................... 21 0.0 0.0 0.1Hedging reserve ........................................................... 21 (3.4) (1.3) 3.3Other reserves .............................................................. 21 (20.2) (20.2) (20.2)Accumulated deficit ................................................... (38.6) (31.4) (11.9)
0.0 8.7 32.8
88

Consolidated statement of changes in equity for the years ended 31 December 2020, 2019 and 2018
Sharecapital
Sharepremium
Foreigncurrency
translationreserve
Hedgingreserve
Otherreserves
Accumulateddeficit Total
£m £m £m £m £m £m £mAt 1 January 2018 ..................................... 0.0 32.1 0.1 (1.4) (20.2) (8.1) 2.5
Loss for the year .......................................... — — — — — (4.0) (4.0)Other comprehensive income:Cash flow hedges – gains deferred in equity — — — 4.1 — — 4.1Cash flow hedges – losses transferred out ofequity............................................................ — — — 1.6 — — 1.6Translation differences ................................. — — — — — — —Tax on other comprehensive income........... — — — (1.0) — — (1.0)
Total comprehensive income/(loss) for theyear .............................................................. — — — 4.7 (4.0) 0.7
Share based payments.................................. — — — — — 0.2 0.2Share capital issued...................................... — 29.4 — — — — 29.4At 31 December 2018................................. 0.0 61.5 0.1 3.3 (20.2) (11.9) 32.8
Adoption of IFRS 16 ................................... — — — — — (0.1) (0.1)
Restated at 1 January 2019 ...................... 0.0 61.5 0.1 3.3 (20.2) (12.0) 32.7Loss for the year .......................................... — — — — — (19.6) (19.6)Other comprehensive income:Cash flow hedges – losses deferred in equity — — — (2.2) — — (2.2)Cash flow hedges – gains transferred out ofequity............................................................ — — — (3.5) — — (3.5)Translation differences ................................. — — (0.1) — — — (0.1)Tax on other comprehensive income........... — — — 1.1 — — 1.1
Total comprehensive loss for the year......... — — (0.1) (4.6) — (19.6) (24.3)
Share based payments.................................. — — — — — 0.2 0.2Share options exercised................................ — 0.1 — — — — 0.1At 31 December 2019................................. 0.0 61.6 0.0 (1.3) (20.2) (31.4) 8.7
Sharecapital
Sharepremium
Foreigncurrency
translationreserve
Hedgingreserve
Otherreserves
Accumulateddeficit Total
£m £m £m £m £m £m £mAt 1 January 2020 0.0 61.6 0.0 (1.3) (20.2) (31.4) 8.7
Loss for the year .......................................... — — — — — (7.6) (7.6)Other comprehensive income:Cash flow hedges – losses deferred in equity — — — (4.8) — — (4.8)Cash flow hedges – losses transferred out ofequity............................................................ — — — 2.3 — — 2.3Translation differences ................................. — — — — — — —Tax on other comprehensive income........... — — — 0.4 — — 0.4
Total comprehensive loss for the year......... — — — (2.1) — (7.6) (9.7)Share based payments.................................. — — — — — 0.2 0.2Share options exercised................................ — 0.6 — — — — 0.6Warrants issued ............................................ — — — — — 0.2 0.2
At 31 December 2020................................. 0.0 62.2 0.0 (3.4) (20.2) (38.6) 0.0
All equity disclosed above is attributable to the owners of the parent.
89
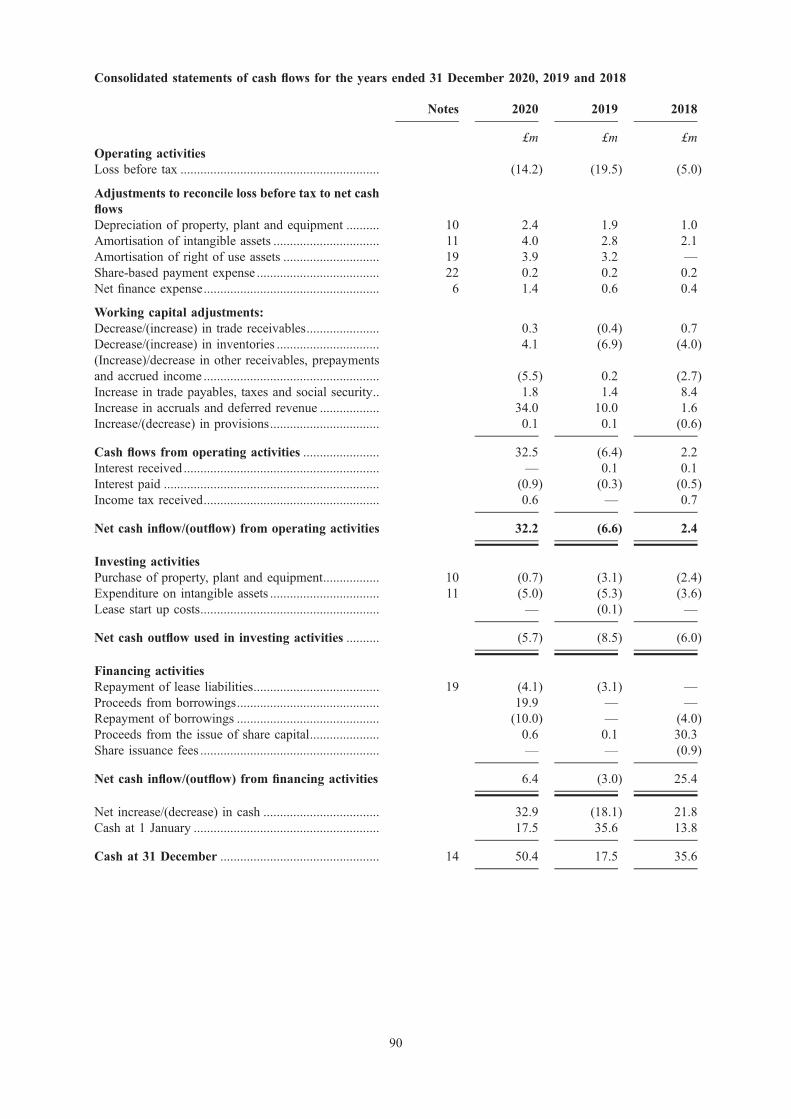
Consolidated statements of cash flows for the years ended 31 December 2020, 2019 and 2018
Notes 2020 2019 2018
£m £m £mOperating activitiesLoss before tax ............................................................ (14.2) (19.5) (5.0)
Adjustments to reconcile loss before tax to net cashflowsDepreciation of property, plant and equipment .......... 10 2.4 1.9 1.0Amortisation of intangible assets ................................ 11 4.0 2.8 2.1Amortisation of right of use assets ............................. 19 3.9 3.2 —Share-based payment expense ..................................... 22 0.2 0.2 0.2Net finance expense..................................................... 6 1.4 0.6 0.4
Working capital adjustments:Decrease/(increase) in trade receivables...................... 0.3 (0.4) 0.7Decrease/(increase) in inventories ............................... 4.1 (6.9) (4.0)(Increase)/decrease in other receivables, prepaymentsand accrued income ..................................................... (5.5) 0.2 (2.7)Increase in trade payables, taxes and social security.. 1.8 1.4 8.4Increase in accruals and deferred revenue .................. 34.0 10.0 1.6Increase/(decrease) in provisions................................. 0.1 0.1 (0.6)
Cash flows from operating activities ....................... 32.5 (6.4) 2.2Interest received ........................................................... — 0.1 0.1Interest paid ................................................................. (0.9) (0.3) (0.5)Income tax received..................................................... 0.6 — 0.7
Net cash inflow/(outflow) from operating activities 32.2 (6.6) 2.4
Investing activitiesPurchase of property, plant and equipment................. 10 (0.7) (3.1) (2.4)Expenditure on intangible assets ................................. 11 (5.0) (5.3) (3.6)Lease start up costs...................................................... — (0.1) —
Net cash outflow used in investing activities .......... (5.7) (8.5) (6.0)
Financing activitiesRepayment of lease liabilities...................................... 19 (4.1) (3.1) —Proceeds from borrowings........................................... 19.9 — —Repayment of borrowings ........................................... (10.0) — (4.0)Proceeds from the issue of share capital..................... 0.6 0.1 30.3Share issuance fees ...................................................... — — (0.9)
Net cash inflow/(outflow) from financing activities 6.4 (3.0) 25.4
Net increase/(decrease) in cash ................................... 32.9 (18.1) 21.8Cash at 1 January ........................................................ 17.5 35.6 13.8
Cash at 31 December ................................................ 14 50.4 17.5 35.6
90

Notes to the Group historical financial information for the years ended 31 December 2020, 2019 and 2018
1. Principal accounting policies
Made.com Limited (the ‘Company’) and its subsidiaries (together the ‘Group’) are engaged in the onlineretail of furnishings and homeware.
The Company is limited by shares, incorporated and domiciled in Gibraltar, and was incorporated on 27thMay 2015. The address of its registered office is 28 Irish Town, Gibraltar, GX11 1AA.
The basis of preparation and accounting policies used in preparing the historical financial information inrespect of the Group for the 3 years ended 31 December 2020 is set out below. These accounting policieshave been consistently applied in all material respects to all the years presented unless otherwise stated.
Basis of preparation
The consolidated historical financial information of the Group for the years ended 31 December 2020,31 December 2019 and 31 December 2018 (the Historical Financial Information) has been preparedspecifically for the purpose of this Registration Document and in accordance with International FinancialReporting Standards (IFRS) and Interpretations as issued by the International Accounting Standards Board(IASB) adopted pursuant to Regulation (EC) no. 1606/2002 as it applies to the European Union and inaccordance with the Prospectus Regulation (EU) 2017/1129 as supplemented by Commission DelegatedRegulation (EU) 2019/980 as it forms part of the retained EU law as defined by the EU (Withdrawal)Act 2018.
The Historical Financial Information has been prepared on a historical cost basis except for derivativefinancial instruments which are held at fair value. The financial information is presented in PoundsSterling (£) and all values are rounded to the nearest million (£m), except when otherwise indicated.
The Historical Financial Information does not constitute statutory accounts within the meaning ofsection 434(3) of the UK Companies Act 2006.
The principal accounting policies adopted in the preparation of this financial information are set out below.These policies have been consistently applied for all years presented, apart from any changes in accountingpolicies arising as a result of the adoption of new accounting standards as disclosed in Note 3.
Basis of consolidation
The Historical Financial Information consolidates the results of Made.com Limited and its subsidiaryundertakings for the years ended 31 December 2020, 31 December 2019 and 31 December 2018.
Control is achieved when the Group is exposed, or has rights, to variable returns from its involvement withthe investee and can affect those returns through its power over the investee. Specifically, the Group controlsan investee if and only if the Group has:
* Power over the investee (i.e. existing rights that give it the current ability to direct the relevantactivities of the investee),
* Exposure, or rights, to variable returns from its involvement with the investee, and
* The ability to use its power over the investee to affect its returns.
The financial statements of subsidiaries are prepared for the same reporting years using consistent accountingpolicies. All intercompany transactions and balances, including unrealised profits arising from intra-grouptransactions, have been eliminated on consolidation.
Going concern
The financial information has been prepared on a going concern basis. The Group has reported a loss of£7.6m (2019: loss of £19.6m) for the year ended 31 December 2020 and is in a net asset position of £0.0mas at 31 December 2020 (2019: net asset position £8.7m), with a net current liability position of £(16.6)marising from higher than usual deferred revenues outstanding at the year-end (2019: net current liabilityposition of £11.1m).
At the time of preparing the financial information the Group has a strong cash position, with a cash balanceof £74.5m and a reduction in the net current liability position to £(13.3)m as at 31 March 2021. Since early2020, the Group has been exposed to extraordinary market conditions due to the COVID-19 pandemic.During this period, despite temporary disruptions to its supply chain, the Group has delivered ongoingstrong sales growth, broadly aligned to levels delivered through previous years. Temporary supply chain
91

disruptions have meant that the Group sold product on extended lead-times for much of 2020. Thisimpacted customer conversion which in turn has impacted gross sales growth. The supply chain disruptionsalso impacted revenue recognition timing, resulting in a high level of deferred income at31st December 2020. As stock levels normalise through 2021, the Group expects to continue deliveringstrong growth in all of its markets.
The Directors have reviewed the Group’s forecast and projections for the period to December 2022 (the‘Forecast Period’), including their assessment of trading and associated cash flow forecasts, includingforecast liquidity and loan covenant compliance, and have a reasonable expectation that the Group hasadequate financial resources to continue its operations for the foreseeable future. The Group has continued totrade throughout the COVID-19 pandemic which continues to create significant market uncertainty. TheDirectors have run various scenarios and stress tests over the period to December 2022 that considereconomic growth and demand. The Directors have also considered mitigations at their disposal to enhanceliquidity if required. Following various plausible scenarios and stress tests, the Group would still continue tohave sufficient cash headroom throughout the Forecast Period and still have the necessary liquidity tocontinue trading.
To date, performance has continued to be strong and with the measures that management have put in placethe Directors judge that the Group will continue to operate as a going concern and it is well positioned todo so given the online ‘pure-play’ nature of its business model and the flexibility it possesses in its costbase.
Summary of significant accounting policies
a) Revenue recognition
The Group derives revenue from contracts with customers relating to online sales of furnishings andhomewares. The primary performance obligation is the delivery of furniture and homewares products to thelocation specified in the online sales contract. This is the point at which control is considered to havepassed to the customer, and revenue from both the sale of the goods and the associated delivery service isrecognised.
Revenue is measured net of discount vouchers used and VAT. At the point revenue is recognised, aprovision is also taken up for any future returns that may occur under the rights of return in the originalcontract, which is up to 30 days from receipt of goods. The provision for returns is calculated based onestimated return rates and then subsequently adjusted as returns are incurred. An associated right of returnasset is recognised in inventory, representing the value of the products that are expected to be returned fromthe customer.
The difference in timing between the receipt of cash from customers and the satisfaction of the performanceobligation gives rise to a contract liability recognised as deferred revenue on the balance sheet. Deferredrevenue represents cash collected for goods, net of discount vouchers used and VAT, for which delivery tothe customer has not yet been made.
b) Foreign currencies
The Group’s historical financial information is presented in Pounds Sterling (£), which is also the parentcompany’s functional currency. For each entity, the Group determines the functional currency and itemsincluded in the financial statements of each entity are measured using that functional currency.
(i) Transactions and Balances
Transactions in foreign currencies are initially recorded by the Group’s entities at the respectivefunctional currency rates at the date the transaction first qualifies for recognition. At the end of eachreporting period, monetary items denominated in foreign currencies are retranslated at the ratesprevailing at the end of the reporting period.
(ii) Group
For presenting consolidated financial information, the assets and liabilities of the Group’s foreignoperations are expressed in Pounds Sterling (£) using exchange rates prevailing at the end of thereporting period. Income and expenses are translated at the average exchange rate for the period.Exchange differences arising are recognised in other comprehensive income (OCI) and are transferredto the foreign currency translation reserve.
92

c) Current income tax
Current income tax assets and liabilities are measured at the amount expected to be recovered from, orpayable to, the taxation authorities. The tax rates and tax laws used to compute the amount are those thatare enacted or substantively enacted at the reporting date. Current income tax relating to items recogniseddirectly in equity is recognised in equity and not in the income statement. Management periodicallyevaluates positions taken in the tax returns with respect to situations in which applicable tax regulations aresubject to interpretation and establishes provisions where applicable.
Deferred tax
Deferred tax is provided using the liability method on all temporary differences arising between the taxbases of assets and liabilities and their carrying amounts in the historical financial information with thefollowing exceptions:
* Where the temporary differences arise from the initial recognition of goodwill or of an asset orliability in a transaction that is not a business combination and, at the time of the transaction, affectsneither the accounting profit nor taxable profit or loss;
* In respect of taxable temporary differences associated with investments in subsidiaries when the timingof the reversal of the temporary differences can be controlled and it is probable that the temporarydifferences will not reverse in the foreseeable future.
Deferred tax assets are recognised only to the extent that the directors consider it is probable that there willbe taxable profits against which the deductible temporary differences, and the carry forward of unused taxcredits or unused tax losses can be utilised.
Deferred tax assets and liabilities are measured on an undiscounted basis at tax rates that are expected toapply in the period when the related asset is realised or liability is settled, based on tax rates enacted orsubstantively enacted by the reporting date.
The carrying amount of deferred tax assets is reviewed at each reporting date and reduced to the extent thatit is no longer probable that sufficient taxable profits will be available to allow all or part of the deferredtax asset to be utilised. Unrecognised deferred tax assets are reassessed at each reporting date and arerecognised to the extent that it has become probable that future taxable profits will allow the deferred taxasset to be recovered. Deferred tax assets and liabilities are offset, only if a legally enforceable right existsto set off deferred tax assets against tax liabilities, the deferred taxes relate to the same taxation authorityand that authority permits the Group to make a single net payment.
Deferred tax is charged or credited to OCI if it relates to items that are charged or credited to OCI.Similarly, deferred tax is charged or credited directly to equity if it relates to items that are credited orcharged directly to equity.
d) Property, plant and equipment
Property, plant and equipment is stated at cost, net of accumulated depreciation and accumulated impairmentlosses, if any. All repair and maintenance costs are recognised in profit or loss as incurred.
Depreciation is charged to write off the cost of assets, over their estimated useful lives, using the straight-line method. Residual values and useful lives are reviewed at each period end, with the effect of anychanges in estimate accounted for on a prospective basis.
The following useful lives are used in the calculation of depreciation:
Fixtures & fittings – 3 years or the life of the lease (if less than 3 years)Computer equipment – 3 yearsOffice equipment – 3 years
The gain or loss arising on the disposal or retirement of an item of property, plant and equipment isdetermined as the difference between the disposal proceeds and the carrying amount of the asset and isrecognised in the income statement.
Assets in the course of construction are held at cost less recognised impairment loss. Depreciation is notprovided on these assets.
93
e) Intangible assets
Intangible assets acquired separately are measured on initial recognition at cost. Following initial recognition,intangible assets are carried at cost less any accumulated amortisation and accumulated impairment losses.Internally generated intangibles, excluding capitalised development costs, are not capitalised and the relatedexpenditure is reflected in profit or loss in the period in which the expenditure is incurred.
Intangible assets are amortised over the useful economic life and assessed for impairment whenever there isan indication that the intangible asset may be impaired. The amortisation period and the amortisation methodfor an intangible asset with a finite useful life are reviewed at least at the end of each reporting period.Amoritisation of intangible assets is recognised in Administrative expenses in the income statement.
Research and development costs
Research costs are expensed as incurred. Development expenditure on an individual project is recognised asan intangible asset when the Group can demonstrate the technical feasibility of completing the intangibleasset so that it will be available for use or sale, its intention to complete and its ability to use or sell theasset, how the asset will generate future economic benefits, the availability of resources to complete theasset and the ability to reliably measure the expenditure during development.
Subsequent measurement of intangible assets
Intangible assets with a finite life are amortised on a straight-line basis over their estimated useful lives asfollows:
Domain name – 10 yearsWebsite development costs – 3 yearsTrademarks and IP – 3 years
f) Impairment of non-current financial assets
At each reporting date, the Group assesses the carrying amounts of its non-financial assets (includingproperty, plant and equipment, intangible assets and right-of-use assets) to determine whether there is anyindication that those assets have suffered an impairment loss. If any such indication exists, the recoverableamount of the asset is estimated to determine the extent of the impairment loss (if any). Where it is notpossible to estimate the recoverable amount of an individual asset, the Group estimates the recoverableamount of the cash-generating unit to which the asset belongs. Where a reasonable and consistent basis ofallocation can be identified, corporate assets are also allocated to individual cash-generating units, orotherwise they are allocated to the smallest group of cash-generating units for which a reasonable andconsistent allocation basis can be identified. The lowest level of cash-generating unit will be a country-specific website.
The recoverable amount is the higher of fair value less costs of disposal and value in use. In assessingvalue in use, the estimated future cash flows are discounted to their present value using a pre-tax discountrate that reflects current market assessments of the time value of money and the risks specific to the assetfor which the estimates of future cash flows have not been adjusted.
If the recoverable amount of an asset (or cash-generating unit) is estimated to be less than its carryingamount, the carrying amount of the asset (or cash-generating unit) is reduced to its recoverable amount.Impairment losses are immediately recognised in the income statement.
g) Inventories
Inventories are valued at the lower of cost and net realisable value.
Net realisable value represents the estimated selling price for inventories less all estimated costs ofcompletion and costs necessary to make the sale. Where necessary, provision is made to reduce the carryingvalue to no less than net realisable value, having regard to the nature and condition of the inventory.
h) Provisions
Provisions are recognised when the Group has a present obligation (legal or constructive) as a result of apast event, it is probable that an outflow of resources embodying economic benefits will be required tosettle the obligation and a reliable estimate can be made.
The amount recognised as a provision is the best estimate of the consideration required to settle the presentobligation considering the risks and uncertainties surrounding the obligation.
94

The timing of cash outflows are by their nature uncertain and are therefore best estimates. Provisions arediscounted if the time value of money is material to the provisions recognised.
i) Adjusted EBITDA
Adjusted EBITDA is a non-GAAP measure. It is used by the Directors and senior management to evaluatethe Group’s operating performance, generate future operating plans and make strategic decisions regardingthe allocation of capital. The exclusion of certain expenses in calculating Adjusted EBITDA facilitatesoperating performance comparisons on period-to-period bases. Accordingly, adjusted EBITDA is presented inthe historical financial information to provide additional information to understand and evaluate the Group’soperating performance.
EBITDA is defined as profit or loss before tax, interest, depreciation and amortisation. The Group definesadjusted EBITDA as EBITDA adjusted to include the unwinding of the discount on lease liabilities anddepreciation of right-of-use assets (from the date of adoption of IFRS 16) to reflect the fact that leaserelated costs are key underlying business operating expenses; exclude the impact of any share basedpayment expenses to reflect the fact that this item is not directly correlated to underlying businessperformance; and exclude the impact of any items deemed to be exceptional in nature.
Exceptional items
Exceptional items are defined as transactions that, in the opinion of the Directors, should be disclosed andadjusted from EBITDA in order to provide a consistent and comparable view of the underlying business.This will include those items that are one-off and material in nature and which have been incurred outsideof the normal business operations, including but not limited to restructuring and business transformationprogrammes and fund-raising activities.
j) Financial instruments
A financial instrument is any contract that gives rise to a financial asset of one entity and a financialliability or equity instrument of another entity.
Trade and other receivables
Trade and other receivables are classified as financial assets measured at amortised cost under IFRS 9Financial Instruments and recognised when it is probable that a future economic benefit will flow to theGroup. Trade and other receivables are carried at original invoice amount (deemed as the fair value bymanagement) less any provisions for impairment. Provisions for expected credit losses are made using thesimplified approach in line with IFRS 9. Provisions are recognised based on lifetime expected credit lossesat each reporting date, with reference to factors including previous historical credit loss experience and aswell as forward looking factors specific to the debtors and general economic conditions.
Trade and other payables and interest-bearing loans
Trade and other payables and interest-bearing loans are classified as ‘loans and payables’ under IFRS 9Financial Instruments and are recognised initially at fair value. Subsequent to initial recognition they aremeasured at amortised cost using the effective interest method.
Cash
Cash in the statement of financial position comprises cash at banks and on hand.
Warrant instruments
Warrant instruments granted over shares as part of financing arrangements are classified as equityinstruments where the terms are on a fixed-for-fixed basis where a derivative that will be settled by theissuer exchanging a fixed amount of cash or another financial asset for a fixed number of its own equityinstruments. These instruments are recognised at fair value on the date of issue and are not subsequentlyremeasured. The initial carrying value of the associated interest-bearing loan is adjusted for the fair value ofthe warrant instruments issued.
Financial assets and liabilities at fair value through profit or loss
These categories include derivative financial instruments entered into by the Group that are not designatedas hedging instruments in hedge relationships. Refer to note (q) for further details.
95
k) Derecognition of financial instruments
A financial liability is derecognised when the obligation under the liability is discharged, cancelled, orexpires.
A financial asset is derecognised when the rights to receive cash flows from the asset have expired.
l) Fair value measurement
The fair values of financial instruments measured at amortised cost and derivative instruments recognised atfair value are disclosed in Note 15.
Fair value is the price that would be received to sell an asset or paid to transfer a liability in an orderlytransaction between market participants at the measurement date. The fair value measurement is based onthe presumption that the transaction to sell the asset or transfer the liability takes place either:
* In the principal market for the asset or liability, or
* In the absence of a principal market, in the most advantageous market for the asset or liability.
The principal or the most advantageous market must be accessible by the Group.
The fair value of an asset or a liability is measured using the assumptions that market participants woulduse when pricing the asset or liability, assuming that market participants act in their economic best interest.
The Group uses valuation techniques that are appropriate in the circumstances and for which sufficient datais available to measure fair value, maximising the use of relevant observable inputs and minimising the useof unobservable inputs.
All assets and liabilities for which fair value is disclosed in the historical financial information arecategorised within the fair value hierarchy, described as follows, based on the lowest level input that issignificant to the fair value measurement as a whole:
* Level 1 – Quoted (unadjusted) market prices in active markets for identical assets or liabilities
* Level 2 – Valuation techniques for which the lowest level input that is significant to the fair valuemeasurement is directly or indirectly observable
* Level 3 – Valuation techniques for which the lowest level input that is significant to the fair valuemeasurement is unobservable
m) Leases
The Group assesses at contract inception whether a contract is, or contains, a lease. That is, if the contractconveys the right to control the use of an identified asset for a period of time in exchange for consideration.The Group applies a single recognition and measurement approach for all leases, except for short-termleases or leases of low-value assets. The Group recognises lease liabilities representing the future value ofcontractual lease payments and right-of-use assets representing the right to use the underlying assets.
(i) Right-of-use assets
The Group recognises a right-of-use asset at the commencement date of the lease, which is defined asthe date that the underlying asset is available for use. A right-of-use asset is measured at cost, lessany accumulated depreciation and impairment losses, and adjusted for any remeasurement of theassociated lease liability. The cost of a right-of-use asset includes the value of the lease liabilityinitially recognised; any lease payments made on or before the commencement date; any initial directcosts incurred; less any lease incentives received. Right-of-use assets are depreciated on a straight-linebasis over the lease term. The right-of use asset is also subject to impairment. Refer to accountingpolicy 2(f).
(ii) Lease liabilities
At the commencement date of the lease, the Group recognises a lease liability measured at the presentvalue of contractual payments to be made over the lease term. The lease payments include fixedpayments less any lease incentives receivable and variable lease payments that depend on an index ora rate. Variable lease payments that do not depend on an index or a rate are recognised as expenses inthe period in which the event or condition that triggers the payment occurs.
96

In calculating the present value of lease payments, the Group uses its incremental borrowing rate atthe lease commencement date because the interest rate implicit in the lease is not readily determinable.After the commencement date, the discount is unwound over the life of the lease, recognised asinterest expense in the income statement. As lease payments are made, the lease liability is reduced. Inaddition, the carrying amount of lease liabilities is remeasured if there is a modification, a change inthe lease term, a change in the lease payments (e.g., changes to future payments resulting from achange in an index or rate used to determine such lease payments) or a change in the assessment ofan option to purchase the underlying asset.
(iii) Short-term leases and leases of low-value assets
The Group applies the short-term lease recognition exemption to any of its short-term leases forproperty (i.e., those leases that have a lease term of 12 months or less from the commencement date).It also applies the lease of low-value assets recognition exemption to leases of office equipment thatare considered to be low value. Lease payments on short-term leases and leases of low value assetsare recognised as an expense on a straight-line basis over the lease term.
Lease accounting policy for the 12 months ended 31 December 2018
The determination of whether an arrangement is (or contains) a lease is based on the substance of thearrangement at the inception date. The arrangement is assessed for whether fulfilment of thearrangement is dependent on the use of a specific asset or assets or the arrangement conveys a right touse the asset or assets, even if that right is not explicitly specified in an arrangement.
Operating lease payments are recognised as an operating expense in the income statement on astraight-line basis over the lease term.
n) Government grants
Government grants are recognised when there is a reasonable assurance that the grant will be received andall attached conditions will be complied with. When the grant relates to an expense item, it is recognised asa deduction to the amount reported through that expense line.
o) Current versus non-current classification
The Group presents assets and liabilities in the statement of financial position based on current/non-currentclassification. An asset is current when it is:
* Expected to be realised or intended to be sold or consumed in the normal operating cycle,
* Held primarily for the purpose of trading,
* Expected to be realised within 12 months after the reporting period, or
* Cash or cash equivalent unless restricted from being exchanged or used to settle a liability for at least12 months after the reporting period.
All other assets are classified as non-current.
A liability is current when:
* It is expected to be settled in the normal operating cycle,
* It is held primarily for the purpose of trading,
* It is due to be settled within 12 months after the reporting period, or
* There is no unconditional right to defer the settlement of the liability for at least 12 months after thereporting period.
The Group classifies all other liabilities as non-current.
Deferred tax assets and liabilities are classified as non-current assets and liabilities unless they are expectedto be realised within 12 months.
p) Share based payments
Employees (including Directors) of the Group receive remuneration in the form of share-based paymentswhereby employees render services as consideration for equity instruments (equity-settled transactions).
97

The cost of equity-settled transactions is determined by the fair value at the date when the grant is madeusing the Black-Scholes valuation model.
That cost is recognised, together with a corresponding increase in equity, over the period in which theperformance and/or service conditions are fulfilled in employee benefits expense. The cumulative expenserecognised for equity-settled transactions at each reporting date until the vesting date reflects the extent towhich the vesting period has expired and the Group’s best estimate of the number of equity instruments thatwill ultimately vest. The income statement expense or credit for a period represents the movement incumulative expense recognised as at the beginning and end of that period and is recognised in employeebenefits expense.
No expense is recognised for awards that do not ultimately vest, except for equity-settled transactions, forwhich vesting is conditional upon a market or non-vesting condition. These are treated as vestingirrespective of whether or not the market or non-vesting condition is satisfied, provided that all otherperformance and/or service conditions are satisfied.
q) Derivative financial instruments and hedge accounting
Initial recognition and subsequent measurement
The Group uses derivative financial instruments, such as forward currency contracts to hedge its foreigncurrency risks. Such derivative financial instruments are initially recognised at fair value on the date onwhich a derivative contract is entered into and are subsequently remeasured at fair value. Derivatives arecarried as financial assets when the fair value is positive and as financial liabilities when the fair value isnegative.
For the purposes of hedge accounting, hedges are classified as:
* fair value hedges when hedging the exposure to changes in the fair value of a recognised asset orliability or an unrecognised firm commitment;
* cash flow hedges when hedging the exposure to variability in cash flows that is either attributable to aparticular risk associated with an unrecognised asset or liability or a highly probable forecasttransaction or the foreign currency risk in an unrecognised firm commitment; or
* hedges of a net investment in a foreign operation.
Any gains or losses arising from changes in the fair value of derivatives are taken directly to profit or loss,except for the effective portion of cash flow hedges, which is recognised in OCI and later reclassified toprofit or loss when the hedge item affects profit or loss.
At the inception of a hedge relationship, the Group formally designates and documents the hedgerelationship to which it wishes to apply hedge accounting and the risk management objective and strategyfor undertaking the hedge. The documentation includes identification of the hedging instrument, the hedgeditem or transaction, the nature of the risk being hedged and how the Group will assess the effectiveness ofthe hedging instrument’s fair value in offsetting the exposure to changes in the hedged item’s fair value orcash flows attributable to the hedged risk. Such hedges are expected to be highly effective in achievingoffsetting changes in fair value or cash flows and are assessed on an ongoing basis to determine that theyactually have been highly effective throughout the financial reporting periods for which they weredesignated.
Hedge accounting is applied to hedges that meet this strict criteria. Currently, the Group only has hedgesthat meet the classification of cash flow hedges (refer to (r) Cash flow hedges for further details).
r) Cash flow hedges
The Group uses forward currency contracts as hedges of its exposure to foreign currency risk in forecasttransactions and firm commitments. The effective portion of the gain or loss on the foreign currency contractis recognised in OCI in the cash flow hedge reserve, while any ineffective portion is recognised immediatelyin the income statement.
Amounts recognised in OCI are accounted for in line with the underlying hedged transaction. Realised gainsor losses on cash flow hedges linked to purchases of stock items are initially reclassed to inventory andthen recognised in the profit or loss at the point that the inventory is sold. Realised gains or losses on cashflow hedges linked to sales in foreign currency are reclassed to the income statement when the revenue isrecognised.
98
If the hedging instrument expires or is sold, terminated or exercised without replacement or rollover (as partof the hedging strategy), or if its designation as a hedge is revoked, or when the hedge no longer meets thecriteria for hedge accounting, any cumulative gain or loss previously recognised in OCI remains separatelyin equity until the forecast transaction occurs or the foreign currency firm commitment is met.
2. Critical accounting judgements and key sources of estimation uncertainty
In the application of the Group’s accounting policies, management is required to make judgements, estimatesand assumptions about the carrying amounts of assets and liabilities that are not readily apparent from othersources.
The estimates and underlying assumptions are reviewed on an ongoing basis. Revisions to accountingestimates are recognised in the period in which the estimate is revised if the revision affects only that periodor in the period of the revision and future periods if the revision affects both current and future periods.
Estimates and assumptions
The key assumptions concerning the future and other key sources of estimation uncertainty at the reportingdate, that have a significant risk of causing a material adjustment to the carrying amounts of the assets andliabilities within the next financial period, are described below. The Group based its assumptions andestimates on parameters available when this historical financial information was prepared. Existingcircumstances and assumptions about future developments, however, may change due to market changes orcircumstances arising beyond the control of the Group. Such changes are reflected in the assumptions whenthey occur.
Revenue recognition
Revenue on the sale of products to customers is recognised at the point of delivery to the customer. Anelement of estimation is applied at the point of dispatch from the warehouse based on average delivery daysto calculate the value of dispatched but undelivered revenue at the reporting date which is then recognisedin deferred revenue.
Refund accruals
Accruals for sales returns are estimated based on historical returns and are recorded in order to allocatethem to the same period in which the original revenue is recorded. These accruals are reviewed regularlyand updated to reflect management’s latest best estimates. Actual returns could vary from these estimates.
Share option valuation
Critical estimates and assumptions are applied in determining the value of certain inputs to include in theBlack-Scholes valuation model to the calculation of fair value of employee share options that wouldnormally be determined with reference to active market data, including share price value which is derivedusing a discounted cashflow model to determine company valuation and volatility rates which are estimatedwith reference to comparable companies.
Deferred tax assets
Deferred tax assets are recognised for tax losses carried forward to the extent that the realisation of therelated benefit through future taxable profits is probable. The assessment of the carrying value of thedeferred tax asset is based on management’s best estimate of the timing and amount of future taxableprofits. Refer to note 9 for further details of unused tax losses and deferred tax assets.
Impairment of non-financial assets
Impairment exists when the carrying value of an asset or cash generating unit exceeds its recoverableamount, which is the higher of its fair value less costs of disposal and its value in use. The fair value lesscosts of disposal calculation is based on available data from binding sales transactions, conducted at arm’slength, for similar assets or observable market prices less incremental costs of disposing of the asset. Thevalue in use calculation is based on a discounted cash flow model.
Key judgements
In the process of applying the Group’s accounting policies, management has made the following judgementswhich have had the most significant effect on the amounts recognised in the consolidated historical financialinformation:
99

Capitalisation criteria for intangible assets
The Group capitalises costs relating to ongoing website and technology development and improvementprojects that underpin the business operations. Management apply judgments as to the nature of the futureeconomic benefits of the projects when assessing whether the costs incurred meet the criteria forcapitalisation.
Determination of lease term of contracts with renewal and termination options
When the Group is a lessee, judgement is applied in determining the lease term where extension ortermination options exist. Management considers factors including, but not limited to, the period included inthe initial investment case; any costs associated with termination or extension options; and any other factsthat may create an economic incentive for either the Group or the landlord to exercise an option.
3. New standards, interpretations and amendments
New standard,interpretation andamendment Date of adoption Impact
Amendment to IFRS 16Covid-19 Related RentConcessions
1 January 2020 During the financial year commencing 1 January 2020 the Groupearly adopted the Amendment to IFRS 16 Covid-19 Related RentConcessions, which was issued on 28 May 2020. The amendmentprovides relief to lessees from applying IFRS 16 guidance onlease modification accounting for rent concessions arising as adirect consequence of the Covid-19 pandemic. As a practicalexpedient, a lessee may elect not to assess whether a Covid-19related rent concession from a lessor is a lease modification. Alessee that makes this election accounts for any change in leasepayments resulting from the Covid-19 related rent concession thesame way it would account for the change under IFRS 16, if thechange were not a lease modification. The impact of adopting theamendment was a reduction in costs recognised in the incomestatement relating to leases (depreciation and discount unwind) of£0.1m.
IFRS 16 Leases 1 January 2019 During the financial year commencing 1 January 2019 the Groupadopted a new standard which had become effective during theperiod, IFRS 16 Leases. IFRS 16 supersedes IAS 17 Leases,IFRIC 4 Determining whether an Arrangement contains a Lease,SIC-15 Operating Leases-Incentives and SIC-27 Evaluating theSubstance of Transactions Involving the Legal Form of a Lease.The standard sets out the principles for the recognition,measurement, presentation and disclosure of leases and requireslessees to recognise most leases on the balance sheet.
The Group elected to use the modified retrospective approach foradoption of the new standard. Under this method, comparativefigures have not been restated and the cumulative effect of initiallyapplying the standard is an additional £0.1m expense recognisedas an adjustment to the opening balance of retained earnings at1 January 2019. The group also applied a number of practicalexpedients available under the modified retrospective approach ontransition date, including relying on the previous identification ofa lease (as provided by IAS 17) for all contracts that existed on thedate of initial application and accounting for operating leases witha remaining lease term of less than 12 months as at 1 January 2019as short-term leases.
Adopting this new standard resulted in the Group recognising£6.7m of right-to-use assets and £8.2m of accompanying leaseliabilities for the Group’s showrooms and offices, whilederecognising £1.4m of straight-line rent accruals on the balance
100

New standard,interpretation andamendment Date of adoption Impact
sheet at 1 January 2019. The weighted average incrementalborrowing rate applied to the Group’s lease portfolio on 1 January2019 was 3%. Following adoption, the Group no longerrecognises rent expense and instead incurs a depreciation chargearising from the right-to-use assets and interest charges arisingfrom lease financing. Refer to note 2 Accounting Policies for theupdated accounting policy on lease accounting.
IFRS 15 Revenue fromContracts withcustomers
1 January 2018 There was no material impact on the historical financialinformation as a result of the adoption this standard.
IFRS 9 FinancialInstruments
1 January 2018 There was no material impact on the historical financialinformation as a result of the adoption this standard.
As at 31 December 2020, no other new and revised standards, amendments and interpretations have beenissued that would have a material or relevant impact on the Group’s results.
4. Capital management
For the purpose of the Group’s capital management, capital includes issued capital, share premium and allother equity reserves attributable to the equity holders of the parent. The primary objective of the Group’scapital management is to maximise the shareholder value and to ensure that it has the capital required tooperate and grow the business at a reasonable cost of capital without incurring undue financial risks.
The Group manages its capital structure and makes adjustments in light of changes in economic conditions.To maintain or adjust the capital structure, the Group may seek to raise funds by issue issuing new sharesto reduce debt. The management of debt is considered to be an important element in controlling the capitalstructure. The Group has arranged debt facilities to allow for fluctuations in working capital requirements.There have been no changes to the capital management policy in the period.
5. Segmental analysis
The Group’s operating segments are reported based on the financial information provided to the Board ofDirectors. The Board is identified as the Chief Operating Decision Maker for the business and areresponsible for making strategic decisions. For strategic management decision making and reportingpurposes, the Group is organised into business units based on location of customers. The Group isconsidered to have two reportable segments: UK operations and Continental Europe operations.
Revenues for both segments are generated from the online sale of furniture and homewares products. Eachmarket is served by separate websites, and there are no inter-segment transactions. The Group operates adirect-to-consumer model and as such there is no reliance on a single customer or group of majorcustomers.
The Board assesses segment performance based on a regional measure of adjusted EBITDA (before theallocation of central costs), which excludes the impact of exceptional costs but includes an allocation oflease related expenses (depreciation and interest). Total assets and liabilities, as well as other specificdisclosures in relation to segment assets and liabilities, are not disclosed as this information is not providedby segment to the Chief Operating Decision Maker on a regular basis.
101

The total of non-current assets other than financial instruments and deferred tax assets located in the UK is£17.9m (2019: £20.6m; 2018: £8.6m). The remaining £6.6m of non-current assets are located in othercountries (2019: £7.4m; 2018: £0.2m), with £3.7m located in Germany (2019: £4.3m; 2018: £nil).
UK Continental Europe Total
2020 2019 2018 2020 2019 2018 2020 2019 2018
£m £m £m £m £m £m £m £m £mRevenue from customers in UK 128.0 114.3 100.4 — — — 128.0 114.3 100.4Revenue from customers inEurope ........................................ — — — 118.5 97.5 73.0 118.5 97.5 73.0
Total Segment Revenue ............. 128.0 114.3 100.4 118.5 97.5 73.0 246.5 211.8 173.4
Other revenue1 ........................... 0.8 — —Total Revenue ............................ 247.3 211.8 173.4
Regional adjusted EBITDA2...... 16.7 12.1 15.6 1.0 1.9 1.8 17.7 14.0 17.4Central administration costs....... (22.8) (23.8) (18.6)Adjusted EBITDA...................... (5.1) (9.8) (1.2)
Share based payment expense ... (0.2) (0.2) (0.2)Depreciation of property plantand equipment ............................ (2.4) (1.9) (1.0)Amortisation of intangible assets (4.0) (2.8) (2.1)Net interest (expense)/revenue... (0.9) (0.2) (0.4)Exceptional Items....................... (1.6) (4.6) (0.1)
Loss before tax........................... (14.2) (19.5) (5.0)
—————1 During the year ended 31 December 2020 the Group recognised £0.8m of other revenue relating to amounts receivable under the Research
and Development Expenditure Credit (RDEC) scheme (2019: £nil; 2018: £nil).2 Included within regional adjusted EBIDTA is £2.5m (2019: £2.2m; 2018: N/A) of lease depreciation allocated to UK operations and £1.4m
(2019: £1.0m; 2018: N/A) of lease depreciation allocated to Continental Europe operations, as well as £0.3m (2019: £0.3m: 2018: N/A) oflease interest expense allocated to UK operations and £0.2m (2019: £0.1m: 2018: N/A) of lease interest expense allocated to ContinentalEurope operations.
6. Net financing costs
2020 2019 2018
£m £m £mFinance costs:Bank interest on interest-bearing loans and borrowings .................... (0.9) (0.3) (0.5)Interest expense on lease liabilities ..................................................... (0.5) (0.4) —Total finance costs.............................................................................. (1.4) (0.7) (0.5)Finance income:Bank interest ........................................................................................ — 0.1 0.1
Total finance income .......................................................................... — 0.1 0.1
Net finance expense ........................................................................... (1.4) (0.6) (0.4)
102

7. Employee benefits expense
2020 2019 2018
£m £m £mWages and salaries............................................................................... 20.8 18.1 14.0Social security costs ............................................................................ 2.6 2.4 1.7Pension contributions........................................................................... 0.5 0.5 0.5Share based payment expense............................................................. 0.2 0.2 0.2
Total employee benefits expense....................................................... 24.1 21.2 16.4
Included with wages and salaries in the year ended 31 December 2020 is an amount of £0.4m (2019: £nil;2018: £nil) relating to government grants received through Covid-19 specific local government assistanceschemes including the Coronavirus Job Retention Scheme in the UK. There are no unfulfilled conditions orcontingencies attached to these grants.
Average monthly number of employees during the year was as follows:
2020 2019 2018
Administration ..................................................................................... 262 194 177Marketing and products....................................................................... 306 266 203Technical .............................................................................................. 61 67 49
629 527 429
Compensation of key management personnel of the Group:
2020 2019 2018
Salaries, fees and other short-term employee benefits........................ 1.0 0.7 0.6Pension contributions........................................................................... — — —Share based payment expense............................................................. 0.1 — —
Total costs of key management personnel ...................................... 1.1 0.7 0.6
The amounts disclosed in the table are amounts recognised as an expense during the reporting period relatedto key management personnel.
Key management personnel comprise of directors and heads of the executive and finance departments.
The aggregate emoluments paid to the highest paid Director during the year were £0.3m (2019: £0.3m;2018 £0.3m). A 2.5% pension contribution was also paid during the year (2019: 2.7%; 2018: 2.0%). ThisDirector exercised nil share options in the Company in the year (2019: nil; 2018: 67,369).
103

8. Operating loss
Operating loss includes the following items, classified within distribution and administrative expenses:
Notes 2020 2019 2018
£m £m £mDepreciation of property, plant and equipment .......... 10 2.4 1.9 1.0Amortisation of intangible assets ................................ 11 4.0 2.8 2.1Depreciation of right of use assets(1) .......................... 19 3.9 3.2 —Minimum lease payments recognised as an operatinglease expense ............................................................... 0.1 — 2.3Net foreign exchange loss ........................................... 0.5 1.2 0.8
—————(1) £1.3m of depreciation of right of use assets on warehouse leases is classified within distribution expenses (2019: £1.0m). The remaining
£2.6m of depreciation of right of use assets is classified within administrative expenses (2019: £2.2m).
9. Income taxes
(a) Income tax recognised in the income statement:
2020 2019 2018
£m £m £mCurrent income tax:Current income tax credit .................................................................... — — (0.7)Foreign tax paid................................................................................... 0.1 — —Total current tax................................................................................... 0.1 — (0.7)Deferred tax:Relating to:
Origination and reversal of temporary differences ......................... (6.1) 0.1 (0.3)Effect of changes in the tax rate ..................................................... (0.6) — —
Total deferred tax .............................................................................. (6.7) 0.1 (0.3)
Total income tax (credit)/expense reported in the incomestatement ............................................................................................. (6.6) 0.1 (1.0)
2020 2019 2018
£m £m £mDeferred tax (credit)/expense .............................................................. (0.4) (1.1) 1.0Total income tax (credited)/charged to other comprehensive income (0.4) (1.1) 1.0
104
(b) Reconciliation of total tax expense
A reconciliation between tax expense and the accounting profit using the UK’s domestic tax rate has beenpresented for the years ended 31 December 2020, 2019 and 2018 as follows:
2020 2019 2018
£m £m £mLoss before tax .................................................................................... (14.2) (19.5) (5.0)Loss before tax multiplied by the standard rate of corporation tax inthe UK of 19.0% (2019: 19%; 2018 19.0%)...................................... (2.7) (3.7) (1.0)Permanent differences.......................................................................... 0.2 — —Non-deductible expenses ..................................................................... — 0.3 0.5Share options exercised ....................................................................... (0.2) — —Foreign tax credit................................................................................. 0.1 — —R&D tax credit .................................................................................... 0.1 — (0.7)Tax losses not utilised ......................................................................... — 3.1 0.1Recognition of deferred tax on tax losses previously unrecognised.. (3.1) — —Tax rate changes .................................................................................. (1.0) 0.4 0.1
Total tax (credit)/charge reported in the consolidated incomestatement ............................................................................................. (6.6) 0.1 (1.0)
(c) Reconciliation of deferred tax assets
2020 2019 2018
£m £m £mAs at 1 January.................................................................................. (5.1) (4.3) (4.8)Deferred tax (credited)/charged to the income statement ................... (6.7) 0.3 (0.3)Deferred tax (credited)/charged to other comprehensive income....... (0.4) (1.1) 1.0
As at 31 December............................................................................. (12.2) (5.1) (4.1)
The deferred tax (asset)/liability balance relates to the following:
2020 2019 2018
£m £m £mCapital allowances ............................................................................... 0.8 0.6 0.6Derivative instruments ......................................................................... (1.0) (0.4) 0.6Unused tax losses ................................................................................ (12.0) (5.3) (5.3)
(12.2) (5.1) (4.1)
Deferred tax assets are recognised for tax losses carried forward to the extent that the realisation of therelated benefit through future taxable profits is probable. The Group has recognised a deferred tax asset of£12.2m at 31 December 2020 (2019: £5.1m; 2018: £4.1m) relating to unused tax losses, supported by thelatest board approved 5 year plan that forecasts future taxable profits against which the deferred tax assetwill be utilised over the next 3 years. The Group has elected not to recognise any deferred tax assetsrelating to employee share options. The estimated value of unrecognised deferred tax assets on vested butunexercised options at 31 December 2020 is £3.9m.
(d) Factors that may affect future tax changes
On 16 March 2016, a further reduction in the UK corporation tax rate to 17% from 1 April 2020 wasannounced in the Chancellor’s Budget. As at 31 December 2018, this reduction had been substantivelyenacted. Therefore, a tax rate of 17% has been used to measure the deferred tax assets and liabilities as at31 December 2018 and 2019.
105

The 2020 Finance Bill announced that the planned reduction in the main rate of corporation tax from 19%to 17% from 1 April 2020 would not occur and that the corporation tax rate would remain at 19% from1 April 2020 and that this rate will be maintained from 1 April 2021. Deferred tax assets and liabilities thathad previously been measured at 17% have been remeasured at 19% at 31 December 2020 as that is therate expected to be in effect when the asset or liability reverses.
Following the Chancellor’s budget announcement on 3 March 2021, the UK headline corporation tax rate isexpected to increase on 1 April 2023 from 19% to 25%. This has not yet been substantively enacted,however to the extent the rate does increase we would expect the effective tax rate to increase accordingly.Any carried forwarded losses still unused at the point that the rate change becomes substantively enactedwill be remeasured at 25%. The impact of remeasuring the deferred tax asset recognised at 31 December2020 at 25% would be an increase of £3.9m.
10. Property, plant and equipment
Assetsunder
constructionFixtures &
FittingsComputerequipment
Officeequipment Total
£m £m £m £m £mCost:At 1 January 2018 ................... 0.1 1.8 0.7 0.2 2.8Additions.................................. 1.8 1.0 0.4 0.2 3.4Reclassifications ....................... (0.6) 0.6 — — —
At 31 December 2018 ............. 1.3 3.4 1.1 0.4 6.2Additions.................................. 1.1 1.9 0.5 0.1 3.6Reclassifications ....................... (2.4) 2.4 — — 0.0
At 31 December 2019 ............. — 7.7 1.6 0.5 9.8
Additions.................................. — 0.5 0.2 — 0.7At 31 December 2020 ............. — 8.2 1.8 0.5 10.5
Depreciation:At 1 January 2018 ................... — 1.3 0.4 0.1 1.8Charge for the year .................. — 0.6 0.3 0.1 1.0
At 31 December 2018 ............. — 1.9 0.7 0.2 2.8Charge for the year .................. — 1.5 0.3 0.1 1.9
At 31 December 2019 ............. — 3.4 1.0 0.3 4.7Charge for the year .................. — 2.0 0.3 0.1 2.4At 31 December 2020 ............. — 5.4 1.3 0.4 7.1
Net book value:At 31 December 2020 ............. — 2.8 0.5 0.1 3.4
At 31 December 2019 ............. — 4.3 0.6 0.2 5.1
At 31 December 2018 ............. 1.3 1.5 0.4 0.2 3.4
In the year ended 31 December 2019, £2.4m of assets relating to the refurbishment of the Londonshowroom were reclassed from assets under construction to fixtures and fittings.
106

11. Intangible assets
Domainname
Websitedevelopment
costsTrademarksand IP assets Total
£m £m £m £mCost:At 1 January 2018 .................................... 0.1 8.3 — 8.4Additions................................................... — 3.6 0.1 3.7
At 31 December 2018 .............................. 0.1 11.9 0.1 12.1Additions................................................... — 5.0 0.3 5.3
At 31 December 2019 .............................. 0.1 16.9 0.4 17.4Additions................................................... — 4.9 0.1 5.0At 31 December 2020 .............................. 0.1 21.8 0.5 22.4
Amortisation:At 1 January 2018 .................................... 0.1 4.5 — 4.6Charge for the year................................... — 2.1 — 2.1
At 31 December 2018 .............................. 0.1 6.6 — 6.7Charge for the year................................... — 2.7 0.1 2.8
At 31 December 2019 .............................. 0.1 9.3 0.1 9.5Charge for the year................................... — 3.9 0.1 4.0
At 31 December 2020 .............................. 0.1 13.2 0.2 13.5
Net Book Value:At 31 December 2020 .............................. — 8.6 0.3 8.9
At 31 December 2019 .............................. — 7.6 0.3 7.9
At 31 December 2018 .............................. — 5.3 0.1 5.4
On 14 May 2020 the Group entered into a loan agreement with Silicon Valley Bank. The terms of thisagreement include a pledge on the Group’s IP and Trademark assets (note 15).
12. Inventories
2020 2019 2018
£m £m £mFinished goods..................................................................................... 21.5 25.6 17.9
21.5 25.6 17.9
On 14 May 2020 the Group entered into a loan agreement with Silicon Valley Bank. The terms of thisagreement include a pledge on the Group’s inventory on hand (note 15).
The cost of inventories recognised as an expense are £111.7m (2019: £93.2m; 2018: £77.8m). There hasbeen no material stock write offs in the period (2019: £nil; 2018: £nil). Included within the inventorybalance reported at 31 December 2020 is a ‘right to return’ asset of £0.7m (2019: £ 0.6m; 2018: £0.4m)associated with the provision for future returns recognised within deferred revenue (note 18).
107

13. Trade and other receivables
2020 2019 2018
£m £m £mTrade receivables ................................................................................. 0.2 0.4 —Other receivables ................................................................................. 10.6 6.1 5.6Prepayments and accrued income ....................................................... 1.7 1.6 2.4Tax debtor........................................................................................... 0.7 0.6 0.7
13.2 8.7 8.7
Included within Other Receivables is £6.2m of amounts due from payment providers which are expected tobe settled within 5 working days (2019: £4.5m; 2018: £4.5m) and an amount of £4m due from SiliconValley Bank which is expected to be settled in 15 days of year end (2019: £nil; 2018: £nil). At31 December 2019, an amount of £1.3 million has been recognised in Other Receivables for agreed supplierrebates (2018: £1.0m). Trade and other receivables are non-interest bearing and are generally on terms of 7to 30 days. As at 31 December 2020, £nil of trade receivables were impaired and fully provided for(2019: £nil; 2018: £0.7m).
Gross trade receivables are denominated in the following currencies:
2020 2019 2018
£m £m £mPound Sterling ..................................................................................... 0.1 — —Euro...................................................................................................... 0.1 0.4 —
0.2 0.4 —
The aging analysis of trade receivables is as follows:
2020 2019 2018
£m £m £mNeither past due nor impaired — — —Past due but not impaired:0-30 days ............................................................................................. 0.1 0.2 —30-60 days ........................................................................................... — — —Greater than 60 days ........................................................................... 0.1 0.2 —
0.2 0.4 —
The Group continually assesses the recoverability of trade receivables and the level of provisioning required.
108

14. Cash
For the purposes of the statement of cash flows, cash includes cash on hand and in banks. Cash at banksearns interest at floating rates based on daily deposit rates. Cash at the end of the financial year as shownin the statement of cash flows is equal to the related items in the statement of financial position as follows:
2020 2019 2018
£m £m £mCash at banks and on hand ................................................................. 50.4 17.5 35.6
Cash is denominated in the following currencies:
2020 2019 2018
£m £m £mGBP...................................................................................................... 37.3 13.8 32.9EUR ..................................................................................................... 10.3 3.3 1.5CHF...................................................................................................... 2.5 0.3 0.4DKK..................................................................................................... 0.2 0.1 —SEK...................................................................................................... 0.0 0.0 —USD ..................................................................................................... 0.0 0.0 0.8RMB..................................................................................................... 0.1 — —
Total..................................................................................................... 50.4 17.5 35.6
15. Financial assets and financial liabilities
Group and Company
Interest-bearing loans and borrowings
Term loan
On 14 May 2020, the Group entered into a loan agreement with Silicon Valley Bank for a term loan of£10m. The term loan had a floating rate of interest and is secured by a fixed and floating charge over theGroup’s assets, including available inventory (refer to note 12) and IP and Trademark assets (refer tonote 11). This security interest in the Group’s assets is enforceable upon a default event, including a failureto repay or failure to comply with the agreed covenants. In addition, the Group issued warrant instrumentsover 43,500 ordinary shares in the ultimate parent to the lenders. The warrants were issued with an exerciseprice of £0.001 per share and are valid for 10 years from grant date. The fair value of the warrantinstruments is £0.2m, which has been recognised in equity and offset against the initial proceeds of theloan.
The loan, classified as non-current, is repayable in full in May 2023. The Group was in compliance withthe financial and other covenants within this facility throughout the financial year, including minimumliquidity requirements and revenue growth targets.
The loan is held at amortised cost. The carrying value of the loan at 31 December 2020 is £9.7m. The fairvalue of the loan at 31 December 2020 is £10.0m.
Revolving credit facility
On 17 January 2020, the Group entered into an agreement with Silicon Valley Bank for a revolving creditfacility of up to £10m, which replaced the previous revolving credit facility with Silicon Valley Bank whichmatured on 31 December 2019. The Group drew down £10m against this facility on the 13 March 2020.This was fully repaid on 14 May 2020. The facility is available until the 17 January 2022. Interest on anydrawn amounts is charged at the higher of 5.25% or LIBOR +4.50%. Any undrawn amounts attract a fee of1% p.a. The Group was in compliance with the financial and other covenants within this facility throughoutthe financial year, including minimum liquidity requirements.
Foreign exchange contracts
The group uses forward foreign exchange contracts to manage its transaction exposures incurred onpurchases of inventory in USD and revenues earned in EUR. The foreign exchange contracts are designated
109

as cash flow hedges and are entered into for periods consistent with foreign currency exposure of theunderlying transactions, generally from one to twelve months.
The Group enters into derivative financial instruments with various counterparties, principally financialinstitutions with investment grade credit ratings. Foreign exchange contracts are valued using valuationtechniques, which employs the use of market observable inputs. The most frequently applied valuationtechniques include forward pricing and swap models, using present value calculations. The modelsincorporate various inputs including the credit quality of counterparties, foreign exchange spot and forwardrates, yield curves of the respective currencies, currency basis spreads between the respective currencies andforward rate curves of the underlying commodity. All derivative contracts are fully cash collateralised,thereby eliminating both counterparty and the Group’s own non-performance risk. As at 31 December 2020,the marked-to-market value of derivative liability position is net of a credit valuation adjustment attributableto derivative counterparty default risk. Derivative contracts are categorised as level 2 within the fair valuehierarchy.
Hedge ineffectiveness can arise from differences in the timing of the cash flows of the hedged items and thehedging instruments; the counterparties’ credit risk differently impacting the fair value movements of thehedging instruments and hedged items; and changes to the forecasted amount of cash flows of hedged itemsand hedging instruments.
During the year ended 31 December 2020, the Group recognised realised losses on cashflow hedges of£0.9m in Cost of Sales (2019: realised gains of £6.6m; 2018: realised losses of £1.5m) and recognisedrealised gains of £1.5m in revenue (2019: £nil; 2018: realised losses of £0.1m).
At 31 December 2020 unrealised losses on cashflow hedges of £4.8m have been recognised in the cashflowhedge reserve (2019: £2.2m; 2018: unrealised gains of £4.1m). At 31 December 2020 realised losses oncashflow hedges of £1.1m have been recognised in inventory (2019: £0.2m; 2018: realised gains of £0.6m)and £0.1m of realised gains on cashflow hedges have been recognised in deferred revenue (2019: £0.2m;2018: £nil).
The net fair value of forward foreign exchange contracts recognised in the statement of financial positionwas a current liability of £4.8m (2019: current liability of £2.2m; 2018: current asset of £4.2m). Cashflowsrelating to these contracts will occur during within 12 months of the reporting date, and gains or losses willbe recognised in the same period. The table below illustrates the maturity profile of the notional value ofthe outstanding foreign exchange contracts, which are to be settled gross:
Maturity
Less than1 month
1 to 3months
3 to 6months
6 to 9months
9 to 12months Total
As at 31 December 2020USD:GBP foreign exchange contracts(hedging highly probable forecastpurchases)Notional Amount (£m) – cash inflows ..... 11.9 19.6 27.3 25.9 23.2 107.9Average forward rate (GBP:USD) ............ 1.30 1.30 1.30 1.29 1.29 1.30EUR:GBP foreign exchange contracts(hedging highly probable forecast sales)Notional Amount (£m) – cash outflows ... (7.0) (6.1) (10.8) (16.6) (16.4) (56.9)Average forward rate (GBP:EUR) ............ 1.13 1.11 1.11 1.08 1.08 1.10As at 31 December 2019USD:GBP foreign exchange contracts(hedging highly probable forecastpurchases)Notional Amount (£m) – cash inflows ..... 12.6 17.0 23.1 22.9 22.9 98.5Average forward rate (GBP:USD) ............ 1.27 1.29 1.30 1.22 1.22 1.26EUR:GBP foreign exchange contracts(hedging highly probable forecast sales)Notional Amount (£m) – cash outflows ... (5.4) (4.1) (7.4) (11.1) (13.4) (41.4)Average forward rate (GBP:EUR) ............ 1.10 1.08 1.08 1.09 1.08 1.09As at 31 December 2018USD:GBP foreign exchange contracts(hedging highly probable forecastpurchases)Notional Amount (£m) – cash inflows ..... 6.4 11.4 16.3 17.1 15.3 66.5Average forward rate (GBP:USD) ............ 1.40 1.40 1.41 1.40 1.38 1.40EUR:GBP foreign exchange contracts(hedging highly probable forecast sales)Notional Amount (£m) – cash outflows ... (2.6) (5.3) (7.9) (7.9) (8.0) (31.7)Average forward rate (GBP:EUR) ............ 1.14 1.14 1.14 1.13 1.13 1.14
110
The table below reports the notional amount of the foreign currency cash flow hedges as well as the impactof the hedging instruments on the Group’s financial position:
2020 2019 2018
Notionalamount
Carryingamount
Notionalamount
Carryingamount
Notionalamount
Carryingamount
£m £m £m £m £m £mDerivative AssetsUSD:GBP foreign exchange contracts.... — — 13.4 0.2 62.3 5.7EUR:GBP foreign exchange contracts.... 42.9 1.2 41.4 3.0 — —
Total ......................................................... 1.2 3.2 5.7
Derivative liabilitiesUSD:GBP foreign exchange contracts.... 107.9 (5.7) 85.1 (5.4) 4.2 (0.5)EUR:GBP foreign exchange contracts.... 14.0 (0.3) — — 31.7 (1.0)
Total ......................................................... (6.0) (5.4) (1.5)
16. Trade and other payables
2020 2019 2018
£m £m £mCurrentTrade payables ..................................................................................... 17.5 21.4 21.9Taxation and social security ................................................................ 10.7 5.1 3.1Accruals ............................................................................................... 11.4 10.4 6.5
39.6 36.9 31.5
Amounts included within taxation and social security represent current VAT amounts payable.
17. Provisions
Group and CompanyLegal
provisionsDilapidationprovisions Total
£m £m £mAt 1 January 2018 ............................................................................... 0.5 0.1 0.6Created during the year ....................................................................... — 0.5 0.5Utilised/released during the year ......................................................... (0.5) — (0.5)At 31 December 2018 ......................................................................... — 0.6 0.6
Addition during the year ..................................................................... 0.1 0.5 0.6Utilised/released during the year ......................................................... — — —At 31 December 2019 ......................................................................... 0.1 1.1 1.2
Addition during the year ..................................................................... — 0.2 0.2Utilised/released during the year ......................................................... (0.1) — (0.1)At 31 December 2020 ......................................................................... — 1.3 1.3
Analysis of provisions:2020 2019 2018
£m £m £mCurrent ................................................................................................. — 0.1 —Non-current .......................................................................................... 1.3 1.1 0.6
111

Dilapidations provision
Additional dilapidation provisions have been taken up in 2020 to recognise future obligations under thelease contracts for the Group’s office, warehouse and showroom premises in the UK and Europe. Theprovisions are expected to be utilised within 2 to 8 years (2019: 4 to 9 years; 2018: 7 to 10 years).
18. Deferred revenue
The Group begins to actively market and sell its products to customers when they are in the manufacturingand shipping phase. This can typically be up to 12 weeks prior to delivery to the customer, although recentshort-term supply chain pressures have meant that this can be up to 18 weeks. Customers are entitled tocancel orders free of charge prior to delivery, and can return them up to 30 days after delivery. Revenue isrecognised at the point that the products are delivered to the customer. The lead time between the customerplacing the sale order and the delivery of the order creates a deferred revenue contractual liability. Revenuesof £19.6m were recognised in the year ended 31 December 2020 that were reported as deferred revenue atthe beginning of the year (2019: £14.9m; 2018: £14.3m). The carrying balance of customer orders not yetfulfilled at 31 December 2020 is £52.8m (2019: £19.6m; 2018: £14.9m) which is expected to be recognisedwithin 1 to 6 months of the year end (2019: 1 to 3 months; 2018: 1 to 3 months), in line with prevailinglead times. Included within this balance is an amount of £1.4m relating to a provision for future returns(2019: £1.3m; 2018: £0.9m).
19. Leases
The Group has entered into a number of lease contracts, as a lessee for properties including offices,showrooms and warehouses. These lease contracts generally have terms between 3 to 10 years. Leasecontracts with terms of less than 12 months are classified as short term. The value of short term leasesrecognised as an expense in the income statement in the year ended 31 December 2020 was £0.1m(2019: £0.5m).
Set out below are the carrying amounts of the right-of-use assets relating to these lease contracts that havebeen recognised in the historical financial information for the years ended 31 December 2020 and31 December 2019, including the movements during the year. Note that the balances reported as at1 January 2019 represent the carrying values of the right of use assets recognised upon transition toIFRS 16:
Group and Company Warehouses Offices Showrooms Total
£m £m £m £mAt 1 January 2019.............................................. — 3.3 3.4 6.7Additions ............................................................ 6.4 1.1 4.0 11.5Amortisation expense......................................... (1.1) (0.9) (1.2) (3.2)
At 1 January 2020.............................................. 5.3 3.5 6.2 15.0Additions ............................................................ 0.2 0.6 — 0.8Amortisation expense......................................... (1.3) (1.1) (1.5) (3.9)Foreign exchange ............................................... — 0.1 0.3 0.4At 31 December 2020........................................ 4.2 3.1 5.0 12.3
112

Set out below are the carrying amounts of the lease liabilities relating to these lease contracts that have beenrecognised in the historical financial information for the years ended 31 December 2020 and 31 December2019, including the movements during the year. Note that the balances reported as at 1 January 2019represent the carrying values of the lease liabilities recognised upon transition to IFRS 16:
Group and Company Warehouses Offices Showrooms Total
£m £m £m £mAt 1 January 2019.............................................. — 4.3 3.9 8.2Additions ............................................................ 6.3 1.0 4.0 11.3Lease payment.................................................... (0.7) (1.2) (1.2) (3.1)Interest Expense ................................................. 0.1 0.1 0.2 0.4At 1 January 2020.............................................. 5.7 4.2 6.9 16.8Additions ............................................................ 0.1 0.6 — 0.7
Lease payment.................................................... (1.1) (1.2) (1.8) (4.1)Interest Expense ................................................. 0.1 0.1 0.3 0.5Foreign exchange ............................................... — 0.1 0.2 0.3At 31 December 2020........................................ 4.8 3.8 5.6 14.2
Current................................................................ 1.3 1.2 1.6 4.1Non-Current........................................................ 4.4 3.0 5.3 12.7
At 31 December 2019........................................ 5.7 4.2 6.9 16.8
Current................................................................ 1.8 1.1 1.6 4.5Non-Current........................................................ 3.0 2.7 4.0 9.7
At 31 December 2020........................................ 4.8 3.8 5.6 14.2
The total amount paid for leases (including short term leases) in the year ended 31 December 2020 was£4.2m (2019: £3.6m).
Several of the leases in the Group’s portfolio include extension or termination options. Management appliesjudgement in assessing the likelihood of exercising any such options on a lease-by-lease basis. At31 December 2020, the undiscounted potential future payments relating to periods beyond any break optionsthat have been assumed is £12.8m (2019: £12.4m).
The carrying value of lease liabilities recognised at 1 January 2019, on adoption of IFRS 16, is reconciledto the future minimum rental payments under non-cancellable operating leases as at 31 December 2018 asfollows:
£m
Future minimum rental payments at 31 December 2018................................................................. 8.6Impact of discounting ....................................................................................................................... (0.6)Short term leases ............................................................................................................................... (0.5)Lease commencing on 1 January 2019 ............................................................................................ 0.7
8.2
113

As at 31 December 2018, the Group had entered into a number of leases for properties. The futureminimum rentals payable under non-cancellable operating leases are as follows:
£m
Within one year................................................................................................................................. 2.5After one year but not more than five years .................................................................................... 6.1
8.6
20. Earnings per share
Basic earnings per share is calculated by dividing the net loss for the period attributable to ordinary equityholders of the parent by the weighted average number of shares outstanding during the period. Theweighted average number of shares represents the weighted average number of ordinary, preference andgrowth shares in issue during the reporting period. All classes of shares have equal voting and dividendrights and as such are treated as one single class of shares for the purposes of calculating earnings pershare.
Diluted earnings per share amounts are calculated by dividing the net profit/(loss) attributable to ordinaryequity holders of the parent by the weighted average number of shares outstanding during the period plusthe weighted average number of shares that would be issued on conversion of any dilutive potentialordinary shares into ordinary shares. The outstanding share options are non-dilutive for the periodspresented.
The following reflects the income and share data used in the basic earnings per share computations:
2020 2019 2018
Loss attributable to ordinary equity holders of the parent (£m) . (7.6) (19.6) (4.0)Weighted average number of shares ............................................ 31,718,602 31,545,594 31,478,317Weighted average dilutive potential ordinary shares ................... — — —Diluted weighted average number of shares................................ 31,718,602 31,545,594 31,478,317Basic and diluted loss per share (pence per share) ..................... (24.0)p (62.1)p (12.7)p
There have been no other transactions involving actual ordinary shares or potential ordinary shares betweenthe reporting date and the date of authorisation of this historical financial information.
114

21.
Issued
sharecapital
andreserves
Authorisedsharecapital
Ordinaryshares
SeriesA
SeriesB-1
SeriesB-2
SeriesC-1
SeriesC-2
SeriesC-3
SeriesC-4
Growth
shares
Preferred
shares
Preferred
shares
Preferred
shares
Preferred
shares
Preferred
shares
Preferred
shares
Preferred
shares
£0.001
each
£0.001
each
£0.001
each
£0.001
each
£0.001
each
£0.001
each
£0.001
each
£0.001
each
£0.001
each
Noof
shares
£mNoof
shares
£mNoof
shares
£mNoof
shares
£mNoof
shares
£mNoof
shares
£mNoof
shares
£mNoof
shares
£mNoof
shares
£m
At31
Decem
ber20
17..........
12,996
,413
—4,842,632
—4,27
4,61
5—
1,32
7,61
0—
3,86
5,97
9—
6,06
0,60
6—
673,65
1—
836,82
1—
5,72
0,09
5—
Share
capitalauthorised
.......
7,003,587
——
——
——
——
——
——
—7,16
3,17
9—
——
At31
Decem
ber20
18..........
20,000
,000
—4,842,632
—4,27
4,61
5—
1,32
7,61
0—
3,86
5,97
9—
6,06
0,60
6—
673,65
1—
8,00
0,00
0—
5,72
0,09
5—
Share
capitalauthorised
.......
——
——
——
——
——
——
——
——
——
At31
Decem
ber20
19..........
20,000
,000
—4,842,632
—4,27
4,61
5—
1,32
7,61
0—
3,86
5,97
9—
6,06
0,60
6—
673,65
1—
8,00
0,00
0—
5,72
0,09
5—
Share
capitalauthorised
.......
——
——
——
——
——
——
——
——
——
At31
Decem
ber20
19..........
20,000
,000
—4,842,632
—4,27
4,61
5—
1,32
7,61
0—
3,86
5,97
9—
6,06
0,60
6—
673,65
1—
8,00
0,00
0—
5,72
0,09
5—
At31
Decem
ber20
17..........
7,27
6,31
8—
3,87
3,116
—4,21
9,22
0—
1,30
5,95
2—
3,86
5,97
9—
6,06
0,60
6—
673,65
1—
836,82
1—
1,18
4,67
5—
Share
capitalissued
..............
114,012
——
——
——
——
——
——
—2,81
7,13
4—
——
Sharessold............................
(545,782)
—(189
,261)
—(7,891
)—
(6,232
)—
——
——
——
——
——
At31
Decem
ber20
18..........
6,84
4,54
8—
3,683,855
—4,211,32
9—
1,29
9,72
0—
3,86
5,97
9—
6,06
0,60
6—
673,65
1—
3,65
3,95
5—
1,18
4,67
5—
Share
capitalissued
..............
67,277
——
——
——
——
——
——
——
——
—Sharessold............................
——
——
——
——
——
——
——
——
——
At31
Decem
ber20
19..........
6,911,82
5—
3,683,855
—4,211,32
9—
1,29
9,72
0—
3,86
5,97
9—
6,06
0,60
6—
673,65
1—
3,65
3,95
5—
1,18
4,67
5—
Share
capitalissued
..............
346,014
——
——
——
——
——
——
——
——
—Sharessold............................
——
——
——
——
——
——
——
——
——
At31
Decem
ber20
20..........
7,25
7,83
9—
3,683,855
—4,211,32
9—
1,29
9,72
0—
3,86
5,97
9—
6,06
0,60
6—
673,65
1—
3,65
3,95
5—
1,18
4,67
5—
115
Share Capital
During the year ended 31 December 2020, the Group issued 346,014 ordinary shares related to optionsexercised under the General Employee Share Plan.
During the year ended 31 December 2019, the Group issued 67,277 ordinary shares related to optionsexercised under the General Employee Share Plan.
During the year ended 31 December 2018, the Group issued 2,817,134 Series C-4 preference shares throughboth a primary and a secondary fundraising. Under the primary fundraising, the Group received £30.0m ofcash. Under the secondary fundraising, the Group received £0.3m of cash and exchanged 749,166 ofexisting ordinary and preference shares for newly issued Series C-4 preference shares. Costs of £0.9massociated with the share issue were incurred and recognised in the share premium reserve.
Rights for the different classes of shares
Each ordinary and preference share gives the holder the right to vote at annual general meetings and toreceive dividends declared and distributed (pari passu as if all equity shares were one class of shares).Preferred shares are convertible to common shares at the holder’s discretion, on a one-to-one basis.
In the event of liquidation the assets of the Company remaining after the payment of its liabilities shall beapplied in the following order of priority:
– Series C Preferred Shares
– Series B Preferred Shares
– Series A Preferred Shares
– Ordinary Shares (including growth shares)
Nature and purpose of reserves
Foreign currency translation reserve
Exchange differences relating to the translation from the functional currencies of the Group’s foreignsubsidiaries into Pounds Sterling are accounted for by entries made directly to the foreign currencytranslation reserve. Note that is reserve arises in the consolidated Group only, not in the Company.
Hedging reserve
The hedging reserve is used to recognise the unrealised gains and losses on cash flow hedges held by theGroup that qualify for hedge accounting.
Other reserves
Other reserves relate to the investment in Made.com Design Ltd by Made.com Limited.
Share options and share based payments
Share options have been granted in respect of the ordinary shares issued by the parent. Refer to note 22 forfurther details.
Dividends
No dividends have been paid or proposed during the year ended 31 December 2020 (2019: nil; 2018: nil).
22. Share-based payments
Under the General Employee Share-option Plan (GESP), the Group, at its discretion, may grant shareoptions over ordinary shares of the parent to employees and directors. The options are granted as equity-settled. The fair value of share options granted is estimated at the date of grant using a Black-Scholessimulation model. The expense associated with issuing these options is pushed down from the ultimateparent company to the entity in which the employees are employed.
The key inputs used in the Black-Scholes pricing model to determine the fair value include the share priceat the date of grant, which is calculated with reference to the company valuation at the time of grant,adjusted for existing preference rights, and divided by the issued share capital and outstanding options at thetime of grant; the exercise price attached to the option; the vesting period of the award; an appropriate risk
116

free rate; the impact of any dividend rights attached to the grant; and an expected share price volatility,estimated with reference to published volatility rates of publicly listed comparable companies.
Share option granted during the historical financial period
2020
On 10 June 2020, the Group granted 300,000 options to employees. 200,000 options were granted with anexercise price of £10.16; 100,000 options were granted with an exercise price of £14.51. The options willvest in 3 equal tranches over a 3 year vesting period. If the Group achieves an ‘exit event’ such as an IPOwithin 18 months of the grant date, 50% of the options will automatically vest at the date of admission. Ifthe event occurs between 18 months and three years from grant date, any unvested options willautomatically vest. No performance conditions other than continued service are attached to the options.
The fair values calculated for the options and the relevant inputs into the Black-Scholes models were:
Exerciseprice £10.16
Exerciseprice £14.56
Fair value (£) .......................................................................................................... £0.97 £0.51Weighted average share price (£) ........................................................................... £6.13 £6.13Expected volatility (%) ........................................................................................... 50% 50%Risk-free interest rate (%)....................................................................................... 0.03% 0.03%Expected life of share options (periods) ................................................................ 3 3Dividend yield (%) ................................................................................................. N/A N/A
2019
On 7 February 2019, the Group granted 40,000 options to employees. 26,667 options were granted with anexercise price of £5.00; 13,333 options were granted with an exercise price of £7.24. The options will vestin 3 equal tranches over a 3 year vesting period. If the Group achieves an ‘exit event’ such as an IPOwithin 18 months of the grant date, 50% of the options will automatically vest at the date of admission. Ifthe event occurs between 18 months and three years from grant date, any unvested options willautomatically vest. No performance conditions other than continued service are attached to the options.
The fair values calculated for the options and the relevant inputs into the Black-Scholes models were:
Exerciseprice £5.00
Exerciseprice £7.24
Fair value (£) .......................................................................................................... £2.41 £1.62Weighted average share price (£) ........................................................................... £6.17 £6.17Expected volatility (%) ........................................................................................... 50% 50%Risk-free interest rate (%)....................................................................................... 0.50% 0.50%Expected life of share options (periods) ................................................................ 3 3Dividend yield (%) ................................................................................................. N/A N/A
On 4 July 2019, the Group granted 190,000 options to employees. 126,667 options were granted with anexercise price of £10.16; 63,333 options were granted with an exercise price of £14.51. The options willvest in 3 equal tranches over a 3 year vesting period. If the Group achieves an ‘exit event’ such as an IPOwithin 18 months of the grant date, 50% of the options will automatically vest at the date of admission. Ifthe event occurs between 18 months and three years from grant date, any unvested options willautomatically vest. No performance conditions other than continued service are attached to the options.
117

The fair values calculated for the options and the relevant inputs into the Black-Scholes models were:
Exerciseprice £10.16
Exerciseprice £14.51
Fair value (£) .......................................................................................................... £1.08 £0.60Weighted average share price (£) ........................................................................... £6.17 £6.17Expected volatility (%) ........................................................................................... 50% 50%Risk-free interest rate (%)....................................................................................... 0.50% 0.50%Expected life of share options (periods) ................................................................ 3 3Dividend yield (%) ................................................................................................. N/A N/A
2018
On 26 February 2018, the Group granted 185,000 options to employees. 123,333 options were granted withan exercise price of £5.00; 61,667 options were granted with an exercise price of £7.24. The options willvest in 3 equal tranches over a 3 year vesting period. If the Group achieves an ‘exit event’ such as an IPOwithin 18 months of the grant date, 50% of the options will automatically vest at the date of admission. Ifthe event occurs between 18 months and three years from grant date, any unvested options willautomatically vest. No performance conditions other than continued service are attached to the options.
The fair values calculated for the options and the relevant inputs into the Black-Scholes models were:
Exerciseprice £5.00
Exerciseprice £7.24
Fair value (£) .......................................................................................................... £2.55 £1.79Weighted average share price (£) ........................................................................... £6.16 £6.16Expected volatility (%) ........................................................................................... 50% 50%Risk-free interest rate (%)....................................................................................... 0.67% 0.67%Expected life of share options (periods) ................................................................ 3 3Dividend yield (%) ................................................................................................. N/A N/A
Movements during the historical financial period
The following table shows the movement in the number of share options outstanding and the weightedaverage exercise prices during in the years ending 31 December 2020, 2019 and 2018:
2020 2019 2018
WeightedAverage
exercise priceNumber of
options
WeightedAverage
exercise priceNumber of
options
WeightedAverage
exercise priceNumber of
options
£ £ £Outstanding at 1 January......................... 3.99 4,362,464 3.60 4,213,074 3.48 4,200,420Granted..................................................... 11.61 300,000 10.59 230,000 5.75 185,000Exercised during the year........................ 1.66 (346,014) 1.93 (67,277) 1.93 (114,013)Lapsed and forfeited during the year...... 7.88 (73,334) 5.75 (13,333) 4.83 (58,333)Outstanding at 31 December................... 4.65 4,243,116 3.99 4,362,464 3.60 4,213,074
Exercisable at 31 December.................... 4.10 3,883,116 3.38 4,051,805 3.22 3,478,907
118
The number of options outstanding at the end of 31 December 2020, 2019 and 2018 have a range ofexercise prices between £1.63 and £14.51 and have the following terms:
Term of the option 2020 2019 2018
1 June 2010 – 1 June 2020.......................................................... — 11,054 11,0548 May 2013 – 8 May 2023.......................................................... 191,507 266,507 311,50724 January 2014 – 24 January 2024............................................ — 253,960 266,23713 May 2014 – 13 May 2024...................................................... 201,274 201,274 201,27418 September 2014 – 18 September 2024 .................................. 1,050,336 1,050,336 1,050,3367 November 2014 – 7 November 2024....................................... 92,500 92,500 92,5002 December 2014 – 2 December 2024........................................ 28,500 28,500 28,50019 September 2016 – 19 September 2026 .................................. 1,260,666 1,266,666 1,276,6661 August 2017 – 1 August 2027. ................................................ 690,000 690,000 690,0004 September 2017 – 4 September 2027 ...................................... 100,000 100,000 100,00026 February 2018 – 26 February 2028........................................ 165,000 171,667 185,0007 February 2019 – 7 February 2029............................................ — 40,000 —4 July 2019 – 4 July 2029 ........................................................... 163,333 190,000 —10 June 2020 – 10 June 2030...................................................... 300,000 — —
Total .............................................................................................. 4,243,116 4,362,464 4,213,074
23. Risk management
The Group is exposed to market risk, credit risk, foreign exchange risk and liquidity risk. The Group’sprincipal financial instruments are Trade and other receivables, Trade and other payables, Cash, loans andborrowings and current financial asset/liability.
This note provides further detail on financial risk management and includes quantitative information on thespecific risks the Group is exposed to.
Market risk
Market risk is the risk that the fair value of future cash flows of a financial instrument will fluctuatebecause of changes in market prices. Market risk comprise three types of risk: interest rate risk, currencyrisk and other prices risk, such as equity price risk.
The Group’s exposure is primarily to the financial risks of changes in foreign currency exchange rates andinterest rate risk.
Sensitivity analysis
The Company recognises that movements in certain risk variables (such as interest rates or foreign exchangerates) might affect the value of its other receivables. Therefore the Company has assessed:
a) What would be reasonably possible changes in the risk variables at the end of the reporting period,and
b) The effects on profit or loss and equity if such changes in the risk variables were to occur.
Interest rate risk
Interest rate risk is the risk that the fair value or future cash flows of a financial instrument will fluctuatebecause of changes in market interest rates. The Group has low exposure to interest rate risk as, except forthe interest-bearing loan, all trade and other receivables and payables are non-interest bearing.
The Group cash balances are held in current bank accounts and earn immaterial levels of interest.Management has concluded that any changes in the LIBOR rates will have an immaterial impact on interestincome earned on the Group cash balances. No interest rate sensitivity has been included in relation to theGroup’s cash balances.
Foreign currency risk
Foreign currency risk is the risk that the fair value or future cash flows of a financial instrument willfluctuate because of changes in foreign exchange rates. The Group’s exposure to foreign exchange riskprimarily arises when revenue and expenses are denominated in a different currency from the Group’s
119

presentational currency. Foreign exchange risk also arises when the individual entities enter into transactionsthat are not denominated in their functional currency.
Foreign currency sensitivity
The Group operates internationally and is therefore exposed to a foreign currency transaction risk, primarilyon purchases and sales denominated in US dollars and Euros. The Group’s presentational currency isSterling, and therefore the Group is exposed to foreign currency translation risks due to movements inforeign exchange rates on the translation of non-sterling assets and liabilities.
The Group’s policy is to match foreign currency transaction exposures where possible. Where appropriate,the Group uses financial instruments in the form of forward exchange contracts to hedge future foreigncurrency cash flows.
At 31 December 2020 the Group has performed a sensitivity analysis to determine the impact of a +/- 3%movement in both GBP:USD and GBP:EUR cross rates on the carrying value of balance sheet itemsincluding cash, other receivables, trade creditors and the outstanding cashflow hedges. A 3% increase/decrease in GBP:USD would have resulted in a £0.3m increase/£0.3m decrease in the income statement(2019: £0.3/£0.3m; 2018: £0.1m/£0.2m) and an additional deferred loss of £2.6m/deferred gain of £2.8mrecognised in Other Comprehensive Income (2019: £2.4m/£2.5m; 2018: £1.8m/£1.9m). A 3% increase/decrease in GBP:EUR would have resulted in a £0.2m decrease/£0.3m increase in the income statement(2019: £nil/£nil; 2018: £nil/£nil) and an additional deferred gain of £1.6m/deferred loss of 1.7m recognisedin Other Comprehensive Income (2019: £1.1m/£1.2m; 2018: £1.0m/£1.0m).
Liquidity risk
Liquidity risk for the Group arises from the management of working capital commitments and meeting itsfinancial obligations as they fall due. The Group’s policy is to review cash flow forecasts / projectionsregularly as well as information regarding cash balances to ensure that it has significant cash to allow it tomeet its liabilities when they become due. The Group reviews its long-term funding requirements in parallelwith its long-term strategy, with an objective of aligning both in a timely manner.
The contractual undiscounted cash flows for current Trade and Other Payables and Deferred Revenue isequal to their carrying value. The undiscounted contractual cash flows for current lease liabilities, due withinone year, if £5.0m (2019: £4.5m).
The maturity profile of the contractual undiscounted cash flows for the Group’s non-current financialliabilities is as follows:
Maturity
1 to 2 years 2 to 3 years 3 to 4 years 4 to 5 yearsMore than
5 years Total
As at 31 December 2020Lease Liabilities....................................... 4.6 3.2 1.2 0.7 0.5 10.2Interest bearing loans and borrowings .... 1.0 10.4 — — — 11.4
Total ......................................................... 5.6 13.6 1.2 0.7 0.5 21.6
As at 31 December 2019Lease Liabilities....................................... 4.7 4.3 2.6 1.1 1.2 13.9
Total ......................................................... 4.7 4.3 2.6 1.1 1.2 13.9
The Group did not have any non-current financial liabilities at 31 December 2018.
Credit risk
Credit risk is the risk of financial loss to the group if a customer or counterparty fails to meet itscontractual obligations under a financial instrument or customer contract, leading to a financial loss. TheGroup is mainly exposed to credit risk from its operating activities (primarily for trade receivables – creditsales).
120

Trade receivables
The Group has a low retail credit risk due to transactions being principally of a high value, low volume andshort maturity. The risk of default is considered to be low, and write-offs due to bad debts are extremelylow.
Cash deposits
Credit risk from balances with banks and financial institutions is managed in accordance with the Group’spolicy. The Group deposits cash with reputable financial institutions, from which management believes thepossibilities of loss to be remote. The Group’s maximum exposure to credit risk for the components of thestatement of financial position at 31 December 2020, 2019 and 2018 is the carrying amount.
24. Related party transactions
Note 25 provides the information about the Group’s structure including the details of the subsidiaries andthe holding company.
Transactions with key management personnel
Directors’ services
During the year ended 31 December 2020, payments were made to B Hoberman, S Given and N Li, intheir capacity as directors of the parent company, for directors services totalling £0.2m (2019: £0.2m;2018: £0.2m). These amounts are included within Note 7 to the financial information.
Share options and remuneration
For details of the share options held by the directors of the company, as well as remuneration of keymanagement personnel of the Group, please refer to Note 7 Employee Benefits and Note 22 Share BasedPayments.
25. Group structure
As at 31 December 2020, 2019 and 2018, Made.com Design Ltd held directly or indirectly* 100% votingshares of the following subsidiaries, which are consolidated into this historical financial information:
Group company Country of Incorporation Nature of business
Made.com Design Ltd .................... England and Wales Online retail of furnishings and homewareMade.com Trading Limited* .......... Hong Kong Holding companyMade.com Company Limited* ....... China Sourcing agent and quality assuranceMade.com Netherlands B.V. *........ Netherlands Dormant
—————* subsidiaries indirectly held through Made.com Design Ltd
Made.com Netherlands B.V. is a wholly owned subsidiary that was incorporated on 23 December 2019. It iscurrently dormant.
121
26. Adjusted EBITDA
The following table sets out the reconciliation of Adjusted EBITDA to operating loss:
2020 2019 2018
£m £m £mLoss before tax ............................................................................. (14.2) (19.5) (5.0)
Depreciation of property, plant and equipment ....................... 2.4 1.9 1.0Amortisation of intangible assets ............................................. 4.0 2.8 2.1Depreciation of right of use assets........................................... 3.9 3.2 —Net finance expense.................................................................. 1.4 0.6 0.4
EBITDA........................................................................................ (2.5) (11.0) (1.5)Adjustments for:Depreciation of right of use assets........................................... (3.9) (3.2) —Interest expense on lease liabilities.......................................... (0.5) (0.4) —Share based payment expense.................................................. (0.2) (0.2) (0.2)Exceptional items
Restructuring......................................................................... 0.9 — —Fundraising ........................................................................... 0.5 — —Supply chain transformation ................................................ 0.2 4.6 0.1
Adjusted EBITDA1..................................................................... (5.1) (9.8) (1.2)
—————1 The definition of Adjusted EBITDA has been updated in the current year. In the year ended 31 December 2019 the Adjusted EBITDA
figure included an adjustment for translational FX of £1.2m. The impact of translational FX is now included within the measure ofunderlying operational performance.
Exceptional items
In the year ended 31 December 2020 exceptional costs of £0.9m have arisen as a result of a restructuringprogramme undertaken to centralise regional commercial marketing operations; £0.5m of costs have beenincurred relating to fundraising activities; and £0.2m of additional costs related to the 2019 supply chaintransformation activities.
In the year ended 31 December 2019 of £4.6m arose from 3 warehouse moves warehouse, including start-up costs associated with setting up the new warehouses; closure costs incurred in exiting the previouswarehouses; as well as certain one-off dual running costs arising during the transfer period. Some initialcosts relating to this programme (£0.1m) were incurred in December 2018 and have been presented asexceptional in the Adjusted EBITDA for the year ended 31 December 2018.
On 11 March 2020, the World Health Organisation declared the Covid-19 virus outbreak a global pandemic.This has resulted in significant social and economic disruption and uncertainty. The pandemic was declaredafter 31 December 2019 and is considered to be a non-adjusting post balance sheet event. The Group hasperformed an assessment of the impact that these events may have had on the carrying values of the assetsand liabilities recognised at 31 December 2019. The key factors considered were the settlement terms of theassets and liabilities as well as the Group performance during the period following the declaration of thepandemic.
Current assets and liabilities including Inventories, Deferred Revenue, Trade and Other Receivables andTrade and Other Payables all settled within the first 3 months of 2020. In addition, the Group has continuedto trade during this period and has delivered strong sales growth as consumer migration towards onlineshopping accelerated. As such, the events that have arisen subsequent to year end have not had a materialimpact on the Group’s assets and liabilities as reported at 31 December 2019.
27. Post balance sheet events
2020
On 1 January 2021, the Group granted 349,200 options to employees under a one-off company-wide grant(the “All Employee Grant’’). Under the terms of the grant, all employees were granted 600 options eachwith an exercise price of £10.56. A small number of these options (36,000) were granted as phantomoptions and will be accounted for as cash-settled. The remaining options (313,200) are accounted for asequity settled. The options will vest in 3 equal tranches over a 3 year vesting period. No performance
122

conditions other than continued service are attached to the options. In the event of an IPO occurring prior tothe second anniversary of the Vesting Commencement Date, 50% of the options automatically vest; of theremaining 50%, one-third will vest at the second anniversary of the grant date and the remainder will vestat the third anniversary of the grant date. The fair value per option has been calculated as £6.13. The grantof these options is a non-adjusting event.
On 25 March 2021 the Group filed an initial draft of a prospectus and registration document with theFinancial Conduct Authority (FCA) as part of a planned Initial Public Offering (IPO). The Group iscurrently undertaking the necessary steps required to prepare for an admission to trade on the London StockExchange’s main market. This is a non-adjusting event and the Group has not made any adjustments toshare option vesting schedules at 31 December 2020. In the event that the IPO is successful, the Group hasestimated that the impact of accelerated vesting of both the outstanding grants at 31 December 2020 plusthe All Employee Grant issued on 1 January 2021 will be an additional £0.1m of share based paymentexpense recognised in the twelve months ended 31 December 2021.
On 13 April 2021 the Board of the ultimate parent company, Made.com Limited, approved a reorganisationsteps plan involving the incorporation of a new UK entity (Made.com Group Plc) and the transfer ofownership of the Group from Made.com Limited to Made.com Group Plc via a share-for-share exchange.The execution of this steps plan is due to take place immediately prior to Admission.
2019
On 11 March 2020, the World Health Organisation declared the Covid-19 virus outbreak a global pandemic.This has resulted in significant social and economic disruption and uncertainty. The pandemic was declaredafter 31 December 2019 and is considered to be a non-adjusting post balance sheet event. The Group hasperformed an assessment of the impact that these events may have had on the carrying values of the assetsand liabilities recognised at 31 December 2019. The key factors considered were the settlement terms of theassets and liabilities as well as the Group performance during the period following the declaration of thepandemic.
Current assets and liabilities including Inventories, Deferred Revenue, Trade and Other Receivables andTrade and Other Payables all settled within the first 3 months of 2020. In addition, the Group has continuedto trade during this period and has delivered strong sales growth as consumer migration towards onlineshopping accelerated. As such, the events that have arisen subsequent to year end have not had a materialimpact on the Groups assets and liabilities as reported at 31 December 2019.
123

SECTION C: UNAUDITED INTERIM FINANCIAL INFORMATION
Interim condensed consolidated income statement for the 3 months ended 31 March 2021
Unaudited Unaudited
Notes31 March
202131 March
2020
£m £mRevenue ........................................................................................ 3 82.4 58.1Cost of sales ................................................................................. (40.9) (28.0)
Gross profit ................................................................................... 41.5 30.1Distribution expenses ................................................................... (16.4) (14.5)Administrative expenses............................................................... (26.5) (22.2)
Operating loss............................................................................... (1.4) (6.6)
Finance costs ................................................................................ (0.4) (0.2)Loss before tax ............................................................................. (1.8) (6.8)Income tax (expense)/credit ......................................................... — —
Loss for the year attributed to equity holders of theCompany...................................................................................... (1.8) (6.8)
Loss per share (pence per share):Basic and diluted loss for the year attributable to ordinary equityholders of the Company............................................................... 8 (5.6)p (21.2)pNon-GAAP measures:Adjusted EBITDA profit/(loss) .................................................... 12 1.8 (4.9)
Interim condensed consolidated statement of comprehensive income for the 3 months ended 31 March 2021
Unaudited Unaudited
31 March2021
31 March2020
£m £mLoss for the year..................................................................................................... (1.8) (6.8)Other comprehensive income/(loss)Other comprehensive income to be reclassified to profit or loss in subsequentyears (net of tax):Unrealised gains on cash flow hedges ................................................................... 2.7 2.6Net other comprehensive (loss)/income to be reclassified to profit or loss insubsequent years ................................................................................................... 2.7 2.6
Other comprehensive income for the year, net of tax ...................................... 2.7 2.6
Total comprehensive income/(loss) for the year, net of tax, attributable toequity holders of the Company ........................................................................... 0.9 (4.2)
124

Interim condensed consolidated statement of financial position as at 31 March 2021
Unaudited Audited
Notes
As at31 March
2021
As at31 December
2020
£m £mNon-current assetsProperty, plant and equipment .............................................. 5 3.0 3.4Intangible assets .................................................................... 5 9.3 8.9Right of Use assets................................................................ 5 11.0 12.3Deferred tax asset .................................................................. 11.6 12.2Rent deposits ......................................................................... 0.5 0.5
35.4 37.3
Current assetsInventories ............................................................................. 24.2 21.5Trade and other receivables .................................................. 6 8.8 13.2Derivative asset ..................................................................... 6 2.9 1.2Cash ....................................................................................... 74.5 50.4
110.4 86.3
Total assets ........................................................................... 145.8 123.6
Current liabilitiesLease liabilities...................................................................... 6 (3.4) (4.5)Trade and other payables ...................................................... 6 (49.7) (39.6)Derivative liability................................................................. 6 (4.3) (6.0)Deferred revenue ................................................................... 7 (66.3) (52.8)
(123.7) (102.9)
Non-current liabilitiesLease liabilities...................................................................... 6 (9.7) (9.7)Provisions .............................................................................. (1.3) (1.3)Interest bearing loans and borrowings.................................. 6 (9.7) (9.7)
(20.7) (20.7)
Total liabilities...................................................................... (144.4) (123.6)
Net assets .............................................................................. 1.4 0.0
Capital and reservesShare capital .......................................................................... 9 0.0 0.0Share premium ...................................................................... 9 62.2 62.2Foreign currency translation reserve..................................... 9 0.0 0.0Hedging reserve..................................................................... 9 (0.7) (3.4)Other reserves........................................................................ 9 (20.2) (20.2)Accumulated deficit ............................................................. (39.9) (38.6)
1.4 0.0
125
Interim condensed consolidated statement of changes in equity for the 3 months ended 31 March 2021
Share capitalShare
premium
Foreigncurrency
translationreserve
Hedgingreserve
Otherreserves
Accumulateddeficit Total
£m £m £m £m £m £m £mAt 1 January 2020 0.0 61.6 0.0 (1.3) (20.2) (31.4) 8.7
Loss for the year........... — — — — — (6.8) (6.8)Other comprehensiveincome:Cash flow hedges –gains deferred in equity — — — 2.2 — — 2.2Cash flow hedges –losses transferred out ofequity ............................ — — — 1.1 — — 1.1Translation differences.. — — — — —Tax on othercomprehensive income . — — — (0.7) — — (0.7)
Total comprehensiveloss for the year............ — — 2.6 — (6.8) (4.2)
Share based payments .. — — — — — 0.1 0.1At 31 March 2020(unaudited) .................. 0.0 61.6 0.0 1.3 (20.2) (38.1) 4.6
At 1 January 2021 ...... 0.0 62.2 0.0 (3.4) (20.2) (38.6) 0.0
Loss for the year........... — — — — — (1.8) (1.8)Other comprehensiveincome:Cash flow hedges –gains deferred in equity — — — 3.4 — — 3.4Cash flow hedges –gains transferred out ofequity ............................ — — — (0.1) — — (0.1)Translation differences.. — — — — — — —Tax on othercomprehensive income . — — — (0.6) — — (0.6)
Total comprehensiveincome/(loss) for theyear ............................... — — — 2.7 — (1.8) 0.9
Share based payments .. — — — — 0.5 0.5At 31 March 2021(unaudited) .................. 0.0 62.2 0.0 (0.7) (20.2) (39.9) 1.4
All equity disclosed above is attributable to the owners of the parent.
126

Interim condensed consolidated statement of cash flows for the 3 months ended 31 March 2021
Unaudited Unaudited
Notes31 March
202131 March
2020
£m £mOperating activitiesLoss before tax ............................................................................. (1.8) (6.8)Adjustments to reconcile loss before tax to net cash flowsDepreciation of property, plant and equipment ........................... 4 0.6 0.6Amortisation of intangible assets ................................................. 4 1.1 0.9Depreciation of right of use assets............................................... 4 1.0 1.0Share-based payment expense...................................................... 0.6 0.1Net finance expense...................................................................... 0.4 0.2Working capital adjustments:Decrease in trade receivables ....................................................... — 0.3(Increase)/decrease in inventories ................................................ (2.8) 5.4Decrease in other receivables, prepayments and accrued income 4.4 2.3Increase/(decrease) in trade payables, taxes and social security . 5.5 (7.9)Increase in accruals and deferred revenue ................................... 18.1 2.8Cash flows from operating activities ........................................... 27.1 (1.1)Interest received............................................................................ — —
Interest paid .................................................................................. (0.3) (0.1)Income tax received ..................................................................... — 0.8
Net cash inflow/(outflow) from operating activities ................ 26.8 (0.4)
Investing activitiesPurchase of property, plant and equipment ................................. (0.1) (0.4)Expenditure on tangible assets ..................................................... (1.6) (1.5)Net cash outflow used in investing activities ........................... (1.7) (1.9)
Financing activitiesRepayment of lease liabilities ...................................................... (1.0) (1.1)Proceeds from borrowings ........................................................... — 10.0
Net cash (outflow)/inflow from financing activities................. (1.0) 8.9
Net increase in cash and cash equivalents................................... 24.1 6.6Cash and cash equivalents at 1 January ...................................... 50.4 17.5
Cash and cash equivalents at 31 March .................................. 74.5 24.1
127

Interim condensed consolidated notes to the financial statements for the 3 months ended 31 March 2021
1. General Information
The interim condensed consolidated financial information of Made.com Ltd comprises the results ofMade.com Limited (the ‘Company’) and its subsidiaries (together the ‘Group’) for the 3 months ended31 March 2021.
2. Basis of preparation and changes to the Group’s accounting policies
Basis of preparation
The interim condensed consolidated financial information for the 3 months ended 31 March 2021 (theInterim Financial Information) has been prepared in accordance with IAS 34 Interim Financial Reporting,specifically for the purpose of this prospectus and in accordance with the Prospectus Regulation (EU) 2017/1129, as supplemented by Commission Delegated Regulation (EU) 2019/980 as it forms part of retained EUlaw as defined in the EU (Withdrawal) Act 2018. They do not include all the information and disclosuresrequired in the annual financial statements and should be read in conjunction with the Historical FinancialInformation for the 3 years ended 31 December 2020. The Interim Financial Information does not constitutestatutory accounts within the meaning of section 434(3) of the UK Companies Act 2006.
Accounting policies
The accounting policies adopted in the preparation of the interim condensed consolidated financialinformation are consistent with those followed in the preparation of the Historical Financial Information forthe year ended 31 December 2020 as set out in note 1 of those statements. The Group has not adopted anynew standards, interpretations or amendments in the 3 months ended 31 March 2021. Several amendmentsapply for the first time in 2021, but do not have an impact on the interim condensed consolidated financialinformation of the Group.
Critical accounting judgements and key sources of estimation and uncertainty
In the application of the Group’s accounting policies, management is required to make judgements, estimatesand assumptions about the carrying amounts of assets and liabilities that are not readily apparent from othersources. The key sources of estimation, uncertainty and judgement applied in the preparation of the InterimFinancial Information are consistent with those applied in the Historical Financial Information for the yearended 31 December 2020, as disclosed in note 2 to that financial information, with the exception of sharebased payments. Management has applied a judgment at 31 March 2021 that the likelihood of an IPO eventoccurring in June 2021 is highly certain and therefore the vesting assumptions have been amendedaccordingly resulting in an additional cost of £0.2m being recognised the income statement at 31 March2021.
Going concern
The financial information has been prepared on a going concern basis. The Group has reported a loss of£1.8m (2020: loss of £6.8m) for the 3 months ended 31 March 2021 and is in a net asset position of £1.4mas at 31 March 2021 (31 December 2020: net asset position £0.0m), with a net current liability position of£(13.3)m arising from higher than usual deferred revenues outstanding at the year-end (31 December2020: net current liability position of £(16.6)m). The Group has a strong cash position, with a cash balanceof £74.5m at 31 March 2021.
Since early 2020, the Group has been exposed to extraordinary market conditions due to the COVID-19pandemic. During this period, despite temporary disruptions to its supply chain, the Group has deliveredongoing strong sales growth, broadly aligned to levels delivered through previous years. Temporary supplychain disruptions have meant that the Group sold product on extended lead-times for much of 2020. Thisimpacted customer conversion which in turn impacted gross sales growth. The supply chain disruptions alsoimpacted revenue recognition timing, resulting in a high level of deferred income at 31 March 2021. Asstock levels normalise through 2021, the Group expects to continue delivering strong growth in all of itsmarkets.
The Directors have reviewed the Group’s forecast and projections for the period to December 2022 (the‘Forecast Period’), including their assessment of trading and associated cash flow forecasts, includingforecast liquidity and loan covenant compliance, and have a reasonable expectation that the Group hasadequate financial resources to continue its operations for the foreseeable future. The Group has continued totrade throughout the COVID-19 pandemic which continues to create significant market uncertainty. TheDirectors have run various scenarios and stress tests over the period to December 2022 that consider
128

economic growth and demand. The Directors have also considered mitigations at their disposal to enhanceliquidity if required. Following various plausible scenarios and stress tests, the Group would still continue tohave sufficient cash headroom throughout the Forecast Period and still have the necessary liquidity tocontinue trading.
To date, performance has continued to be strong and with the measures that management have put in placethe Directors judge that the Group will continue to operate as a going concern and it is well positioned todo so given the online ‘pure-play’ nature of its business model and the flexibility it possesses in its costbase.
3. Segmental analysis
The Group’s operating segments are reported based on the financial information provided to the Board ofDirectors. The Board is identified as the Chief Operating Decision Maker for the business and areresponsible for making strategic decisions. For strategic management decision making and reportingpurposes, the Group is organised into business units based on location of customers. The Group isconsidered to have two reportable segments: UK operations and Continental Europe operations.
Revenues for both segments are generated from the online sale of furniture and homewares products. Eachmarket is served by separate websites, and there are no inter-segment transactions. The Group operates adirect-to-consumer model and as such there is no reliance on a single customer or group of majorcustomers.
The Board assesses segment performance based on a regional measure of adjusted EBITDA (before theallocation of central costs), which excludes the impact of exceptional costs and share based payment butincludes an allocation of lease related expenses (depreciation and interest). Total assets and liabilities, aswell as other specific disclosures in relation to segment assets and liabilities, are not disclosed as thisinformation is not provided by segment to the Chief Operating Decision Maker on a regular basis.
UK Continental Europe Total
31 March2021
31 March2020
31 March2021
31 March2020
31 March2021
31 March2020
£m £m £m £m £m £mRevenue from customers in UK.............. 41.5 29.3 — — 41.5 29.3Revenue from customers in Europe........ — — 40.9 28.8 40.9 28.8
Total segment revenue............................. 41.5 29.3 40.9 28.8 82.4 58.1
Other revenue .......................................... — —Total revenue ........................................... 82.4 58.1
Regional adjusted EBITDA(1) ................. 6.2 1.9 3.0 (1.0) 9.2 0.9Central administration costs .................... (7.4) (5.8)Adjusted EBITDA(1)................................ 1.8 (4.9)
Share based payment expense.............. (0.6) (0.1)Depreciation of property plant andequipment................................................. (0.6) (0.6)Amortisation of intangible assets ............ (1.1) (0.9)Net interest (expense)/revenue ................ (0.3) (0.1)Exceptional Items (note 12) .................... (1.0) (0.2)
Loss before tax ........................................ (1.8) (6.8)
—————(1) Included within regional adjusted EBIDTA is £0.7m of lease depreciation allocated to UK operations (2020: £0.7m) and £0.3m of lease
depreciation allocated to Continental Europe operations (2020: £0.3m), as well as £0.1m of lease interest expense allocated to UKoperations (2020: £0.1m) and £nil of lease interest expense allocated to Continental Europe operations.
The nature of the Group’s business model is such that there will be some seasonality driving the salesprofile linked to promotional activity. Historically there is one key promotion in the first quarter of the yearand two in the second half of the year, falling into the third and fourth quarters. The Group’s revenue istherefore generally expected to be higher in the second half of the year.
129

4. Operating loss
Operating loss includes the following items, classified within distribution and administrative expenses:
Notes 2021 2020
£m £mDepreciation of property, plant and equipment ........................... (0.6) (0.6)Amortisation of intangible assets ................................................. (1.1) (0.9)Depreciation of right of use assets(1) ........................................... (1.0) (1.0)Net foreign exchange gain/(loss) ................................................. (0.9) (0.5)—————(1) £0.3m of depreciation of right of use assets on warehouse leases in classified within distribution expenses (2020: £0.3m). The remaining
£0.7m of depreciation of right of use assets is classified within administrative expenses (2020: £0.7m).
5. Capital expenditure and commitments
During the 3 monhts ended 31 March 2021, the Group capitalised website development costs of £1.6m(2020: £1.5m) and recorded additions to property, plant and equipment of £0.1m (2020: £0.4m).
There were no disposals of property, plant and equipment during the period (2020: £nil).
There were no new leases entered in to during the period ended 31 March 2021. In the 3 months ended31 March 2020, the Group entered into one new lease resulting in the recognition of a right of use £0.4m.
As at 31 March 2021, the Group has capital commitments for expenditure on property, plant and equipmentcontracted, but not provided for, of £3.0m (2020: nil).
6. Financial assets and financial liabilities
The carrying value of the Group’s financial assets and liabilities at the period end was:
Unaudited Audited
As at31 March
2021
As at31 December
2020
£m £mFinancial assetsAssets held at amortised costCash.................................................................................................................... 74.5 50.4Trade receivables................................................................................................ 0.2 0.1Other receivables................................................................................................ 5.4 10.1Assets held at fair valueDerivatives.......................................................................................................... 2.9 1.2Derivative liabilitiesLiabilities held at amortised costTrade payables ................................................................................................... (20.7) (22.2)Accruals.............................................................................................................. (15.9) (11.3)Lease liabilities................................................................................................... (13.1) (14.2)Term loan ........................................................................................................... (9.7) (9.7)Liabilities held at fair valueDerivatives.......................................................................................................... (4.3) (6.0)
The fair value of the Group’s financial assets and liabilities held at amortised cost approximates theircarrying value.
Derivative assets and liabilities held at fair value
The group uses forward foreign exchange contracts to manage its transaction exposures incurred in USD andEUR. The foreign exchange contracts are designated as cash flow hedges and are entered into for periodsconsistent with foreign currency exposure of the underlying transactions, generally from one to twelvemonths.
130

The Group enters into derivative financial instruments with various counterparties, principally financialinstitutions with investment grade credit ratings. Foreign exchange contracts are valued using valuationtechniques, which employs the use of market observable inputs. The most frequently applied valuationtechniques include forward pricing and swap models, using present value calculations. The modelsincorporate various inputs including the credit quality of counterparties, foreign exchange spot and forwardrates, yield curves of the respective currencies, currency basis spreads between the respective currencies andforward rate curves of the underlying commodity. All derivative contracts are fully cash collateralised,thereby eliminating both counterparty and the Group’s own non-performance risk. As at 31 March 2021, themarked-to-market value of derivative liability position is net of a credit valuation adjustment attributable toderivative counterparty default risk. Derivative contracts are categorised as level 2 within the fair valuehierarchy.
During the 3 months ended 31 March 2021, the Group recognised realised losses on cashflow hedges of£1.7m in Cost of Sales (2020: £0.2m) and recognised realised gains of £0.3m in revenue (2020: £0.7nil).
7. Deferred revenue
The Group begins to actively market and sell its products to customers when they are in the manufacturingand shipping phase. This can typically be up to 12 weeks prior to delivery to the customer, although recentshort-term supply chain pressures have meant that this can be up to 18 weeks. Customers are entitled tocancel orders free of charge prior to delivery and can return them up to 30 days after delivery. Revenue isrecognised at the point that the products are delivered to the customer. The lead time between the customerplacing the sale order and the delivery of the order creates a deferred revenue contractual liability. Revenuesof £48.5m were recognised in the 3 months ended 31 March 2021 that were reported as deferred revenue atthe beginning of the year (3 months to 31 March 2020: £16.1m). The carrying balance of customer ordersnot yet fulfilled at 31 March 2021 is £66.3m (31 Dec 2020: £52.8m) which is expected to be recognisedwithin 3 to 6 months of the period end (31 Dec 2020: 1 to 6 months), in line with prevailing lead times.Included within this balance is an amount of £1.3m relating to a provision for future returns (31 Dec2020: £1.4m).
8. Earnings per share
Basic earnings per share is calculated by dividing the net loss for the period attributable to ordinary equityholders of the parent by the weighted average number of shares outstanding during the period. Theweighted average number of shares represents the weighted average number of ordinary, preference andgrowth shares in issue during the reporting period. All classes of shares have equal voting and dividendrights and as such are treated as one single class of shares for the purposes of calculating earnings pershare.
Diluted earnings per share amounts are calculated by dividing the net profit/(loss) attributable to ordinaryequity holders of the parent by the weighted average number of shares outstanding during the period plusthe weighted average number of shares that would be issued on conversion of any dilutive potentialordinary shares into ordinary shares. The outstanding share options are non-dilutive for the periodspresented.
The following reflects the income and share data used in the basic earnings per share computations:
2021 2020
Loss attributable to ordinary equity holders of the Company (£m)...................... (1.8) (6.8)Weighted average number of shares....................................................................... 31,891,609 31,545,595Weighted average dilutive potential ordinary shares ............................................. — —Diluted weighted average number of shares .......................................................... 31,891,609 31,545,595Basic and diluted loss per share (pence per share)................................................ (5.6)p (21.6)p
There have been no other transactions involving actual ordinary shares or potential ordinary shares betweenthe reporting date and the date of authorisation of this financial information.
9. Issued share capital and reserves
Share Capital
During the 3 months ended 31 March 2021, the Group issued no ordinary shares (2020: none).
131

Rights for the different classes of shares
Each ordinary and preference share gives the holder the right to vote at annual general meetings and toreceive dividends declared and distributed (pari passu as if all equity shares were one class of shares).Preferred shares are convertible to common shares at the holder’s discretion, on a one-to-one basis.
In the event of liquidation the assets of the Company remaining after the payment of its liabilities shall beapplied in the following order of priority:
* Series C Preferred Shares
* Series B Preferred Shares
* Series A Preferred Shares
* Ordinary Shares (including growth shares)
Nature and purpose of reserves
Foreign currency translation reserve
Exchange differences relating to the translation from the functional currencies of the Group’s foreignsubsidiaries into Pounds Sterling are accounted for by entries made directly to the foreign currencytranslation reserve. Note that is reserve arises in the consolidated Group only, not in the Company.
Hedging reserve
The hedging reserve is used to recognise the unrealised gains and losses on cash flow hedges held by theGroup that qualify for hedge accounting.
Other reserves
Other reserves relate to the investment in Made.com Design Ltd by Made.com Limited.
Share options and share based payments
Share options have been granted in respect of the ordinary shares issued by the parent. Refer to note 10 forfurther details.
Dividends
No dividends have been paid or proposed during the 3 months ended 31 March 2021 (2020: nil).
10. Share-based payments
Under the General Employee Share-option Plan (GESP), the Group, at its discretion, may grant shareoptions over ordinary shares of the parent to employees and directors. The options are granted as equity-settled. The fair value of share options granted is estimated at the date of grant using a Black-Scholessimulation model. The expense associated with issuing these options is pushed down from the ultimateparent company to the entity in which the employees are employed.
The key inputs used in the Black-Scholes pricing model to determine the fair value include the share priceat the date of grant, which is calculated with reference to the company valuation at the time of grant,adjusted for existing preference rights, and divided by the issued share capital and outstanding options at thetime of grant; the exercise price attached to the option; the vesting period of the award; an appropriate riskfree rate; the impact of any dividend rights attached to the grant; and an expected share price volatility,estimated with reference to published volatility rates of publicly listed comparable companies.
Current year grants
On 1 January 2021, the Group granted 349,200 options to employees under a one-off company-wide grant(the ‘’All Employee Grant’’). A small number of these options (36,000) were granted as phantom optionsand will be accounted for as cash-settled. The remaining options (313,200) are accounted for as equitysettled. Under the terms of the grant, all employees were granted 600 options each with an exercise price of£10.56. The options will vest in 3 equal tranches over a 3 year vesting period. No performance conditionsother than continued service are attached to the options. In the event of an IPO occurring prior to thesecond anniversary of the grant date, 50% of the options automatically vest; of the remaining 50%, one-third will vest at the second anniversary of the grant date and the remainder will vest at the thirdanniversary of the grant date. At as 31 March 2021, the Group has assumed that the options will vest inthis manner in June 2021.
132

The fair values calculated for the options and the relevant inputs into the Black-Scholes models were:
Exerciseprice £10.56
Fair value (£)..................................................................................................................................... £6.31Weighted average share price (£) ..................................................................................................... £14.32Expected volatility (%) ..................................................................................................................... 50%Risk-free interest rate (%)................................................................................................................. 0.14%Expected life of share options (periods)........................................................................................... 3Dividend yield (%)............................................................................................................................ N/A
In addition to the All Employee Grant, on 1 January 2021, the Group granted 70,000 options to seniormanagement. 46,667 options were granted with an exercise price of £10.16. 23,333 options were grantedwith an exercise price of £14.51. The options will vest in 12 equal tranches over a 3 year vesting period.The options will not be subject to accelerated vesting in the event of an IPO. No performance conditionsother than continued service are attached to the options.
The fair values calculated for the options and the relevant inputs into the Black-Scholes models were:
Exerciseprice £10.16
Exerciseprice £14.51
Fair value (£) .......................................................................................................... £6.50 £4.76Weighted average share price (£) ........................................................................... £14.32 £14.32Expected volatility (%) ........................................................................................... 50% 50%Risk-free interest rate (%)....................................................................................... 0.14% 0.14%Expected life of share options (periods) ................................................................ 3 3Dividend yield (%) ................................................................................................. N/A N/A
Movements during the year
The following table shows the movement in the number of share options outstanding and the weightedaverage exercise prices during in the 3 months ended 31 March 2021 and 2020:
2021 2020
WeightedAverageexercise
priceNumber of
options
WeightedAverageexercise
priceNumber of
options
£ £Outstanding at 1 January ................................... 4.65 4,243,116 3.99 4,362,464Granted ............................................................... 10.70 383,200 — —Exercised during the year .................................. — — — —Lapsed and forfeited during the year ................ 10.56 (24,000) 5.75 (40,000)Outstanding at 31 March ................................... 5.13 4,602,316 3.97 4,322,464
Exercisable at 31 March .................................... 4.12 3,943,116 3.44 4,205,139
133

The number of options outstanding at the end of 31 March 2021 have a range of exercise prices from £1.63to £14.51 and have the following terms:
2021 2020
Term of the option1 June 2010 – 1 June 2020. ................................................................................... — 11,0548 May 2013 – 8 May 2023. ................................................................................... 191,507 191,50724 January 2014 – 24 January 2024...................................................................... — 253,96013 May 2014 – 13 May 2024. ............................................................................... 201,274 276,27418 September 2014 – 18 September 2024............................................................. 1,050,336 1,050,3367 November 2014 – 7 November 2024 ................................................................. 92,500 92,5002 December 2014 – 2 December 2024 .................................................................. 28,500 28,50019 September 2016 – 19 September 2026............................................................. 1,260,666 1,266,6661 August 2017 – 1 August 2027............................................................................ 690,000 690,0004 September 2017 – 4 September 2027................................................................. 100,000 100,00026 February 2018 – 26 February 2028 .................................................................. 165,000 171,6677 February 2019 – 7 February 2029 ...................................................................... — —4 July 2019 – 4 July 2029 ..................................................................................... 163,333 190,00010 June 2020 – 10 June 2030. ............................................................................... 300,000 —1 January 2021 – 1 January 2031.......................................................................... 359,200 —
Total ........................................................................................................................ 4,602,316 4,322,464
11. Related party transactions
The Group’s significant related parties are disclosed in the most recent audited financial statements for theyear ended 31 December 2020. There were no material changes to these related parties in the period. Otherthan compensation paid to key management personnel, no material related party transactions have takenplace in the 3 months to 31 March 2021.
12. Adjusted EBITDA
The following table sets out the reconciliation of Adjusted EBITDA to operating loss:
2021 2020
£m £mLoss before tax (1.8) (6.8)Depreciation of property, plant and equipment...................................................... 0.6 0.6Amortisation of intangible assets ........................................................................... 1.1 0.9Depreciation of right of use assets ......................................................................... 1.0 1.0Net finance expense ................................................................................................ 0.4 0.2EBITDA.................................................................................................................. 1.3 (4.1)Adjustments for:Depreciation of right of use assets ......................................................................... (1.0) (1.0)Interest expense on lease liabilities ........................................................................ (0.1) (0.1)Share based payment expense ................................................................................ 0.6 0.1Exceptional itemsFundraising.............................................................................................................. 1.0 —Supply chain transformation................................................................................... — 0.2Adjusted EBITDA .................................................................................................. 1.8 (4.9)
Exceptional items
In the 3 months ended 31 March 2021 costs of £1.0m have been incurred relating to IPO preparationactivities.
In the 3 months ended 31 March 2020 £0.2m of additional costs related to the 2019 supply chaintransformation activities have been recognised.
134

Post balance sheet events
On 13 April 2021 the Board of the ultimate parent company, Made.com Limited, approved a reorganisationsteps plan involving the incorporation of a new UK entity (Made.com Group Plc) and the transfer ofownership of the Group from Made.com Limited to Made.com Group Plc via a share-for-share exchange.The execution of this steps plan is due to take place immediately prior to Admission.
135

PART X
ADDITIONAL INFORMATION
1. RESPONSIBILITY
The Company and its Directors (whose names and functions appear on page 25 of this RegistrationDocument) accept responsibility for the information contained in this Registration Document. To the best ofthe knowledge of the Company and the Directors, the information contained in this Registration Documentis in accordance with the facts and this Registration Document makes no omission likely to affect itsimport.
2. INCORPORATION
2.1 The Company was incorporated and registered in Gibraltar on 27 May 2015 as a private companylimited by shares under the Gibraltar Companies Act 2014 (as amended) (the “2014 Act”) with thename Made.com Limited and with the registered number 113041.
2.2 The Company’s registered office is located at 28 Irish Town, Gibraltar, GX11 1AA. Its telephonenumber is +44 020 3668 2329. The Company’s LEI is 213800QZIRZFE9BTT130.
2.3 The principal laws and legislation under which the Company operates and the Ordinary Shares havebeen created are the 2014 Act and regulations made thereunder.
2.4 The business of the Company, and its principal activity, is to act as the ultimate holding company ofthe Group.
2.5 By resolution of the Company’s shareholders (the “Shareholders”) dated 30 September 2020, EYLimited, whose address is Regal House, Queensway, Gibraltar, GX11 1AA, was appointed as theauditors of the Company. EY Limited is registered to carry out audit work by the Gibraltar FinancialServices Commission.
2.6 The Group’s website is https://www.corporate.made.com/. Information contained on the Group’swebsite or the contents of any website accessible from hyperlinks on the Group’s website are notincorporated into and do not form part of this Registration Document.
3. SHARE CAPITAL
3.1 Immediately prior to the publication of this Registration Document, the share capital of the Companywas as follows:
Shares Number
Ordinary shares of £0.001 each 7,257,838Series A preferred shares of £0.001 each. 3,683,855Series B-1 preferred shares of £0.001 each 4,211,329Series B-2 preferred shares of £0.001 each 1,299,720Series C-1 preferred shares of £0.001 each 3,865,979Series C-2 preferred shares of £0.001 each 6,060,606Series C-3 preferred shares of £0.001 each 673,651Series C-4 preferred shares of £0.001 each 3,653,955Growth shares of £0.001 each 1,184,675Outstanding share options and warrants over ordinary shares of £0.001 each. 4,682,416
3.2 The Company was incorporated on 27 May 2015 as a private company limited by shares. Theauthorised issued share capital at the time of incorporation of the Company was 100 ordinary sharesof £1.00 each. At the time of incorporation of the Company, Andrew Jefferies-Mor and Kelly AnnMir, the initial subscribers to the Company’s memorandum each subscribed for one ordinary share of£1.00 each.
3.3 Since incorporation, the Company’s share capital has been issued in conformity with the laws ofGibraltar.
136

3.4 The following changes have occurred in the share capital of the Company since its incorporation (eachof which has been duly authorised and approved pursuant to the applicable articles of association ofthe Company):
a) On 29 May 2015, 98 ordinary shares of £1.00 each were issued to Ning Li.
b) On 29 May 2015, Andrew Jefferies-Mor and Kelly Ann Mir, each transferred their one ordinaryshare of £1.00 to Ning Li.
c) On 16 June 2015, the 100 ordinary shares of £1.00 each in the issued share capital of theCompany were sub-divided into 100,000 ordinary shares of £0.001 each.
d) On 29 June 2015,
(i) the Company’s authorised share capital was increased from £100.00 divided into 100,000ordinary shares of £0.001 each, to £22,386.899 divided into 10,943,051 ordinary shares,5,769,000 series A preferred shares, 4,327,546 series B-1 preferred shares and 1,347,302series B-2 preferred shares, all of £0.001 each;
(ii) the Company and certain shareholders of MDL (which served as a holding Company ofthe Group prior to the incorporation of the Company) entered into a share exchangeagreement, pursuant to which the shareholders transferred their shares in MDL, to theCompany, in exchange for the issue of the following shares of £0.001 each in the capitalof the Company: (i) 4,591,000 ordinary shares to Ning Li, (ii) 573,250 ordinary shares and231,000 series A preferred shares to Chloe Macintosh, (iii) 1,615,000 series A preferredshares, 398,994 series B-1 preferred shares and 249,500 series B-2 preferred shares toPROFounders Capital L.P., (iv) 8,000 ordinary shares to Simon Rigby, (v) 35,000 ordinaryshares to Carson Roen, (vi) 1,973 ordinary shares to Carrie Shell, (vii) 75,000 ordinaryshares to Andrew Skipper, (viii) 23,020 ordinary shares to David Vanek, (ix) 245,535series B-1 preferred shares to Wyandanch Partners, LP, (x) 1,615,000 series A preferredshares to Archimedia Investments Limited, (xi) 4,508,000 ordinary shares to By Design(UK) Limited, (xii) 730,000 ordinary shares to Julien Callède, (xiii) 13,154 ordinary sharesand 99,800 series B-2 preferred shares to Philippe Chainieux, (xiv) 46,038 ordinary sharesto John Clark, (xv) 552,453 series B-1 preferred shares to Enfield Investments HoldingCorp., (xvi) 40,700 ordinary shares to Ben Gothard, (xvii) 45,298 ordinary shares to BrentHoberman, (xviii) 2,308,000 series A preferred shares and 249,500 series B-2 preferredshares to Jaina Capital Limited, (xix) 3,289 ordinary shares to Annabel Kilner, (xx) 61,384series B-1 preferred shares to Kite Venture Partners I Limited, (xxi) 100,000 ordinaryshares to Win Kwok, and (xxii) 3,069,180 series B-1 preferred shares and 748,502 seriesB-2 preferred shares to Level Equity Growth Partners I, L.P. (“Level Equity GrowthPartners”);
(iii) the Company’s authorised share capital was increased from £22,386.899 divided into10,943,051 Ordinary Shares, 5,769,000 Series A Preferred Shares, 4,327,546 Series B-1Preferred Shares and 1,347,302 Series B-2 Preferred Shares, all of £0.001 each, to the newtotal limit of £26,926.530 divided into 8,911,740 Ordinary Shares, 4,842,632 Series APreferred Shares, 4,274,615 Series B-1 Preferred Shares, 1,327,610 Series B-2 PreferredShares, 3,865,979 Series C-1 Preferred Shares, 3,030,303 Series C-2 Preferred Shares and673,651 Series C-3 Preferred Shares, all of £0.001 each;
(iv) the following shares were transferred to Level Equity Opportunities Fund 2015, L.P.(“Level Equity Opportunities Fund”) and Partech and re-designated as series C-2preferred shares of £0.001 each: (i) 777,200 ordinary shares were transferred by By Design(UK) Limited to Level Equity Opportunities Fund, (ii) 194,600 ordinary shares weretransferred by By Design (UK) Limited to Partech, (iii) 617,078 ordinary shares weretransferred by Ning Li to Partech, (iv) 145,357 ordinary shares were transferred by JulienCallède to Partech, (v) 176,255 ordinary shares were transferred by Chloe Macintosh toPartech, (vi) 578,219 series A preferred shares were transferred by Jaina Capital Limited toPartech, (vii) 348,149 series A preferred shares were transferred by Archimedia InvestmentsLimited to Partech, (viii) 52,931 series B-1 preferred shares were transferred byWyandanch Partners, LP to Partech, (ix) 13,154 ordinary shares and 19,692 series B-2preferred shares were transferred by Philippe Chainieux to Partech, (x) 10,074 ordinaryshares were transferred by Win Kwok to Partech, (xi) 4,604 ordinary shares weretransferred by Carson Roen to Partech, (xii) 5,354 ordinary shares were transferred by Ben
137

Gothard to Partech, (xiii) 6,056 ordinary shares were transferred by John Clark to Partech,(xiv) 1,973 ordinary shares were transferred by Carrie Shell to Partech, (xv) 3,289 ordinaryshares were transferred by Annabel Kilner to Partech, (xvi) 23,020 ordinary shares weretransferred by David Vanek to Partech, (xvii) 45,298 ordinary shares were transferred byBrent Hoberman to Partech, and (xviii) 8,000 ordinary shares were transferred by SimonRigby to Partech;
(v) the following series C preferred shares of £0.001 each were issued by theCompany: (i) 2,874,448 series C-1 preferred shares to Partech, (ii) 124,750 series C-3preferred shares to PROFounders Capital L.P., (iii) 49,900 series C-3 preferred shares toPhilippe Chainieux, (iv) 124,750 series C-3 preferred shares to Jaina Capital Limited,(v) 991,531 series C-1 preferred shares to Level Equity Opportunities Fund, and(vi) 374,251 series C-3 preferred shares to Level Equity Growth Partners; and
(vi) the following shares (each of £0.001 each) were re-classified as C-2 preferred shares of£0.001 each: (i) 2,031,312 ordinary shares, (ii) 926,368 series A preferred shares,(iii) 52,931 series B-1 preferred shares, and (iv) 19,692 series B-2 preferred shares.
e) On 24 July 2015,
(i) the following shares (each of £0.001 each) were re-classified as series C-2 preferred sharesof £0.001 each: (i) 955,351 ordinary shares, (ii) 776,251 series A preferred shares and ,(iii) 10,822 series B-1 preferred shares, each of £0.001; and
(ii) the Company’s share capital was increased to £30,934.214 by additional 140,560 ordinaryshares of £0.001 each, 3,030,303 series C-2 preferred shares of £0.001 each and 836,821series C-4 preferred shares of £0.001 each.
f) On 29 July 2015,
(i) the Company allotted: (i) 478,183 series C-4 preferred shares of £0.001 each to EuropeVentures II L.P. and, (ii) 2,989 series C-4 preferred shares of £0.001 each to FabriceFraikin; and
(ii) the following shares (each of £0.001 each) were transferred to Europe Ventures IIL.P.: (i) 616,329 ordinary shares from Ning Li, (ii) 339,022 ordinary shares from ByDesign (UK) Limited, (iii) 605,151 series A preferred shares from Jaina Capital Limitedand (iv) 171,100 series A preferred shares from Archimedia Investments Limited. Further,10,822 series B-1 preferred shares of £0.001 each were transferred from WyandanchPartners, LP to Fabrice Fraikin.
g) On 4 August 2015,
(i) the Company issued the following shares (each of £0.001 each): (i) 179,319 series C-4preferred shares to Level Equity Opportunities Fund, (ii) 57,750 ordinary shares each and112,500 ordinary shares, separately, to Chloe Macintosh, (iii) 26,435 ordinary shares and18,863 ordinary shares, separately, to Brent Hoberman, (iv) 3,289 ordinary shares toAnnabel Kilner, (v) 4,500 ordinary shares to Simon Rigby, and (vi) 1,973 ordinary sharesto Carrie Shell;
(ii) the following shares (each of £0.001 each) were transferred to Level Equity OpportunitiesFund: (i) 95,007 ordinary shares transferred from Chloe Macintosh, (ii) 5,347 ordinaryshares transferred from Ben Gothard, (iii) 339,021 ordinary shares transferred from ByDesign (UK) Limited, (iv) 104,294 series A preferred shares transferred by ArchimediaInvestments Limited, (v) 44,573 series B-1 preferred shares transferred from WyandanchPartners, LP, (vi) 6,049 ordinary shares transferred from John Clark, (vii) 26,435 ordinaryshares and 18,863 ordinary shares, separately, transferred from Brent Hoberman,(viii) 3,289 ordinary shares transferred from Annabel Kilner, (ix) 1,973 ordinary sharestransferred from Carrie Shell and (x) 4,500 ordinary shares transferred from Simon Rigby;and
(iii) the following shares (each of £0.001 each) were re-classified as series C-2 preferred sharesof £0.001 each: (i) 500,484 ordinary shares, (ii) 104,294 series A preferred shares, and(iii) 44,573 series B-1 preferred shares.
138

h) On 12 August 2015, the Company issued 37,500 ordinary shares of £0.001 each to ChloeMacintosh.
i) On 28 August 2015,
(i) the following shares were transferred to Partech: (i) 339,022 ordinary shares from ByDesign (UK) Limited and, (ii) 88,971 series A preferred shares from ArchimediaInvestments Limited; and
(ii) the following shares (each of £0.001 each) were re-classified as series C-2 preferred sharesof £0.001 each: (i) 339,022 ordinary shares, and (ii) 88,971 series A preferred shares.
j) On 3 September 2015,
(i) the Company issued the following shares (each of £0.001 each): (i) 49,329 ordinary sharesto Julien Callède, (ii) 13,154 ordinary shares to Philippe Chainieux, (iii) 176,330 series C-4preferred shares to Partech and (iv) 23,020 ordinary shares to David Vanek;
(ii) the following shares (each of £0.001 each) were transferred for Partech: (i) 21,658 seriesB-2 preferred shares and 13,154 ordinary shares from Philippe Chainieux, (ii) 103,374 and49,329 ordinary shares, separately, from Julien Callède, and (iii) 23,020 ordinary sharesfrom David Vanek; and
(iii) the following shares (each of £0.001 each) were re-classified as series C-2 preferred sharesof £0.001 each: (i) 188,877 ordinary shares, and (ii) 21,658 series B-2 preferred shares.
k) On 8 December 2016, the Company’s share capital was increased to £34,432.846 by additional3,498,632 ordinary shares of £0.001 each.
l) On 16 February 2017, the following shares (each of £0.001 each) were transferred: (i) 276,244series B-1 preferred shares from Enfield Investments Holdings Corp. to Level EquityOpportunities Fund, (ii) 276,209 series B-1 preferred shares from Enfield Investments HoldingsCorp. to Europe Ventures II L.P., and (iii) 61,384 series B-1 preferred shares from Kite VenturePartners Limited to Europe Ventures II L.P.
m) On 29 June 2017, the Company’s share capital was increased to £40,598.422 by additional5,720,095 growth shares of £0.001 each and 436,481 ordinary shares of £0.001 each.
n) On 30 June 2017, the Company issued the following shares (each of £0.001 each): (i) 434,675growth shares to Julien Callède, and (ii) 750,000 growth shares to Ning Li.
o) On 31 August 2017, the following shares (each of £0.001 each) were transferred by Ning Li toHaka Investments Limited: (i) 3,457,592 ordinary shares, and (ii) 750,000 growth shares.
p) On 6 March 2018, the Company’s share capital was increased to £54,765.188 by additional7,003,587 ordinary shares of £0.001 each and 7,163,179 series C-4 preferred shares of £0.001each.
q) On 12 March 2018, the Company issued 2,067,967 series C-4 preferred shares to State StreetNominees Limited, on behalf of SMALLCAP World Fund, Inc.
r) On 14 May 2018,
(i) the Company issued the following shares (each of £0.001 each): (i) 7,500 ordinary sharesto Suzanne Beechey, (ii) 67,369 ordinary shares to Philippe Chainieux, (iii) 89,907 seriesC-4 preferred shares to Europe Ventures II L.P, (iv) 30,143 ordinary shares to JonathanHowell, (v) 5,000 ordinary shares to Win Kwok, (vi) 172,331 series C-4 preferred sharesto Level Equity Opportunities Fund, (vii) 172,331 series C-4 preferred shares to LevelEquity-Made Investors LLC (“Level Equity-Made”), (viii) 314,598 series C-4 preferredshares to Partech, (ix) 2,500 ordinary shares to Simon Rigby, and (x) 1,500 ordinary sharesto Lisa Tomlins; and
(ii) the following shares (each of £0.001 each) were transferred: (i) 12,962 series A preferredshares from Archimedia Investments Limited to Level Equity Opportunities Fund,(ii) 10,172 ordinary shares from Win Kwok to Level Equity Opportunities Fund, (iii) 4,313ordinary shares from Andrew Skipper to Level Equity Opportunities Fund, (iv) 144,884ordinary shares from By Design (UK) Limited to Level Equity Opportunities Fund,(v) 137,356 series A preferred shares from PROFounders Capital L.P. to Level
139

Equity-Made, (vi) 34,975 series A preferred shares from Archimedia Investments Limitedto Level Equity-Made, (vii) 30,516 ordinary shares from Julien Callède to Partech,(viii) 1,725 ordinary shares from Ben Gothard to Partech, (ix) 67,369 ordinary shares fromPhilippe Chainieux to Partech, (x) 198,859 ordinary shares from Haka Investments Limitedto Partech, (xi) 7,500 ordinary shares from Suzanne Beechey to Partech, (xii) 6,232 seriesB-2 preferred shares from Philippe Chainieux to Partech, (xiii) 2,397 series A preferredshares from Archimedia Investments Limited to Partech, (xiv) 1,571 series A preferredshares from Archimedia Investments Limited to Europe Ventures II L.P., (xv) 7,891 seriesB-1 preferred shares from Wyandanch Partners, LP to Europe Ventures II L.P, (xvi) 1,952ordinary shares from John Clark to Europe Ventures II L.P., (xvii) 42,602 ordinary sharesfrom Chloe Macintosh to Europe Ventures II L.P., (xviii) 1,748 ordinary shares fromCarson Roen to Europe Ventures II L.P., (xix) 2,500 ordinary shares from Simon Rigby toEurope Ventures II L.P., (xx) 30,143 ordinary shares from Jonathan Howell to EuropeVentures II L.P., (xxi) 1,500 ordinary shares from Lisa Tomlins to Europe Ventures II L.P.Prior to the transfers, the relevant shares were re-classified as series C-4 preferred shares of£0.001 each.
s) On 7 February 2019, the Company issued 10,000 ordinary shares of £0.001 each to JamesSmith.
t) On 4 July 2019, the Company issued 12,277 ordinary shares of £0.001 each to Jonathan Howell.
u) On 8 January 2020, the Company issued 45,000 ordinary shares of £0.001 each to Win Kwok.
v) On 14 May 2020,
(i) the Company executed a warrant instrument, conferring the right to subscribe for 21,750ordinary shares of £0.001 each, in favour of Silicon Valley Bank (“SVB”); and
(ii) the Company executed a warrant instrument, conferring the right to subscribe for 21,750ordinary shares of £0.001 each, in favour of SVB Innovation Credit Fund VIII, L.P. (“SVBInnovation”).
3.5 Save as otherwise disclosed in this Registration Document:
a) no share or loan capital of the Company has, within the period covered by the historical financialinformation set out in this Registration Document, been issued or been agreed to be issued, fully orpartly paid, either for cash or for a consideration other than cash to any person;
b) no commissions, discounts, brokerages or other special terms have been granted by the Company orany of its subsidiaries within the period covered by the historical financial information set out in thisRegistration Document in connection with the issue or sale of any share or loan capital of any suchcompany;
c) there are no acquisition rights in respect of the Company’s capital nor has the Company or any of theShareholders undertaken to increase the capital of the Company; and
d) no share or loan capital of the Company or any of its subsidiaries is under option or agreed,conditionally or unconditionally, to be put under option.
4. DIVIDEND POLICY
The Company generally retains any future earnings to finance the operation and expansion of its business.
140

5. MAJOR SHAREHOLDERS
5.1 In so far as is known to the Directors, the following are the interests which represent, directly orindirectly, 3% or more of the voting rights of the Company as at the date of this RegistrationDocument:
Ordinaryshares
Series Apreferred
shares
Series B-1preferred
shares
Series B-2preferred
shares
Series C-1preferred
shares
Series C-2preferred
shares
Series C-3preferred
shares
Series C-4preferred
shares Total(2)% of voting
rights
ShareholdersLevel Equity GrowthFunds(1) ........................... — — 3,345,424 748,502 991,531 1,426,551 374,251 523,981 7,410,240 24.1%Partech Growth FCPI ..... — — — — 2,874,448 2,891,631 — 490,928 6,257,007 20.4%Haka InvestmentsLimited (Founder) .......... 3,258,733 — — — — — — — 3,258,733 10.6%Europe Ventures II LP.... — — 337,593 — — 1,731,602 — 568,090 2,637,285 8.6%By Design (UK) Limited 2,374,251 — — — — — — — 2,374,251 7.7%PROFounders CapitalL.P. .................................. — 1,477,644 398,994 249,500 — — 124,750 — 2,250,888 7.3%State Street NomineesLimited(3) ........................ — — — — — — — 2,067,967 2,067,967 6.7%Jaina Capital Ltd ............ — 1,124,630 — 249,500 — — 124,750 — 1,498,880 4.9%
—————Notes:(1) Level Equity Growth Funds include: (i) Level Equity Growth Partners I L.P., (ii) Level Equity Opportunities Fund 2015 L.P., and
(iii) Level Equity-Made Investors, LLC.(2) On an as converted basis (excluding non-voting growth shares).(3) On behalf of SMALLCAP World Fund, Inc.
5.2 Pursuant to the terms of the Shareholders’ Agreement (as set out in this Part X: “AdditionalInformation – Material Contracts – Shareholders’ Agreement”), certain shareholders benefit fromcustomary contractual consent/veto rights, including over share sales, asset sales and initial publicofferings, as a result of which they can exercise negative control over the Company. Save for theserights and as disclosed above, insofar as is known to the Directors, there is no other person who (i) isor will be, directly or indirectly, interested in 3% or more of the voting rights of the Company, or(ii) can, will or could, directly or indirectly, jointly or severally, exercise control over the Company.No holder of the series A preferred shares, the series B preferred shares, the series C preferred sharesor the ordinary shares has voting rights that differ from those of any other holders of the series Apreferred shares, the series B preferred shares, the series C preferred shares or the ordinary shares. TheDirectors have no knowledge of any arrangements the operation of which may at a subsequent dateresult in a change of control of the Company.
6. ARTICLES OF ASSOCIATION
The articles of association of the Company (the “Articles”), which were adopted pursuant to a resolution ofthe Company passed on 6 March 2018 (as amended by a resolution of the Company on 21 May 2021), arearticles suitable for a company of the size and with the ownership profile of the Company (including thetreatment of assets on a liquidation or return of capital and anti-dilution protections for shareholders).
The Articles are not comparable to the customary articles for a UK public limited company. Should theCompany (or a new holding company of the Company) proceed with a public listing in the UnitedKingdom, it will adopt new articles of association, which are suitable for a company whose shares areadmitted to the premium listing segment of the Official List and to trading on the main market of theLondon Stock Exchange.
The Articles contain provisions, inter alia, to the following effect:
6.1 Objects
The Company’s objects are not restricted by the Articles. Accordingly, pursuant to the 2014 Act, theCompany’s objects are unrestricted.
6.2 Limited liability
The liability of the members is limited to the amount, if any, unpaid on the shares in the Companyrespectively held by them.
141

6.3 Share classes and rights
As at the date of this Registration Document, the Company’s capital is made up of:
(i) ordinary shares;
(ii) series A preferred shares;
(iii) series B-1 preferred shares and series B-2 preferred shares (together the “series B preferredshares”);
(iv) series C-1 preferred shares, series C-2 preferred shares, series C-3 preferred shares and series C-4 preferred shares (together the “series C preferred shares”); and
(v) growth shares,
(together, the “Shares”). There are no deferred shares in issue.
Set out in the paragraphs below is a description of the rights, preferences and restrictions attaching toeach class and series of Shares.
6.4 Voting rights
Each series A preferred share, series B preferred share, series C preferred share and ordinary sharecarries one vote per share. Such shares confer on their holders the right to receive notice of, to speakand to vote at, any general meeting of the Company, and to receive and vote on, or otherwiseconstitute the holder an eligible member for the purposes of, proposed written resolutions of theCompany.
The deferred shares (if issued) and the growth shares do not entitle the holder of such shares toreceive notice of, to speak or to vote at, any general meeting of the Company, nor to receive or voteon, or otherwise constitute the holder an eligible member for the purposes of, proposed writtenresolutions of the Company.
6.5 Dividends
The Company may, by ordinary resolution, declare dividends. The Directors may decide to pay interimdividends. A dividend must not be declared unless the Directors have made a recommendation as toits amount and lawfulness. Such a dividend must not exceed the amount recommended by theDirectors.
The balance of any profits resolved to be distributed and capable of being lawfully distributed in anyfinancial year or period with the prior written consent of the Investor Majority are to be distributedamongst the holders of the series A preferred shares, series B preferred shares, series C preferredshares and the ordinary shares (pari passu as if the same were one class of shares).
The deferred shares (if issued) and the growth shares do not carry any entitlement to receivedividends.
6.6 Conversion rights
Any individual holder of preferred shares may, at any time, convert all or any number of its preferredshares into ordinary shares by written notice to the Board.
Upon the consummation of the first firm commitment underwritten public offering, underwritten by anationally recognised underwriter satisfactory to the holders of a majority of the series C-1 preferredshares, series C-2 preferred shares and the series C-4 preferred shares (the “Investor Majority”)where:
(i) the per share price for such public offering is not less than £7.24; and
(ii) the amount of free float is at least £50,000,000 and represents at least 25% of the issued sharecapital immediately following such public offering,
all of the preferred shares shall automatically convert into ordinary shares on a 1 for 1 basis.
142

A holder of growth shares that are not Qualifying Growth Shares (as defined in the Articles) mayserve a notice on the Board specifying that all or any of its growth shares are to convert into or bere-designated as ordinary shares upon payment to the Company of the hurdle amount applicable to itsgrowth shares.
On a public offering where the subscription price per share in respect of new ordinary shares issued atthe time of such offering (“IPO Price”) is less than the hurdle amount applicable to any growth share,all of such growth shares shall automatically be converted into deferred shares on a 1 for 1 basis.
If the IPO Price is equal to or greater than the hurdle amount applicable to any growth share, theCompany will issue to each holder of such growth shares, in return for the growth shares beingbought back by the Company for par value, such number of new ordinary shares which have a totalvalue equal to the proceeds the holder of such growth shares would have received in accordance withthe Articles on a sale of shares in the Company which would result in the purchaser (whether alone oracting in concert) acquiring a controlling interest in the Company.
6.7 Variation of class rights
The consent of the holders of more than 50% of the series B preferred shares is required for approvalof the variation, modification, abrogation or cancellation of any special rights attaching to such shares,provided that where such variation, modification, abrogation or cancellation is with respect to onlyseries B-1 preferred shares or only series B-2 preferred shares, the consent in writing of the holders ofmore than 50% of the affected series of shares will be required.
The consent of an Investor Majority is required for the approval of the variation, modification,abrogation or cancellation of any special rights attaching to the series C preferred shares.
For the series A preferred shares, the growth shares and the ordinary shares, the special rights attachedto each of such class of shares may be varied or abrogated or cancelled only with the consent inwriting of the holders of greater than 50% of the issued shares of that class entitled at the time tovote at a general meeting of the Company.
6.8 Transfer of shares
The Board shall refuse to register any transfer of Shares made in contravention of the Articles butshall not otherwise be entitled to refuse to register any transfer of Shares. The Board may refuse toregister a transfer if it is a transfer to a bankrupt, a minor or a person of unsound mind or where thetransfer is to an employee, director, or prospective employee or director, who in the opinion of theBoard is subject to taxation in the United Kingdom and such person has not entered into a jointSection 431 Income Tax (Earnings and Pensions) Act 2003 election with the Company.
Holders of growth shares may transfer their growth shares only in specific circumstances set out in theArticles which include:
(i) to the Company or any person nominated by the Board (acting with the approval of the LevelEquity Director and the Partech Director); and
(ii) with Investor Majority Consent.
There are no specific restrictions in the Articles on the transfer of series C preferred shares.
The holders of the series C preferred shares (“Series C Shareholders”) have rights of first refusalover the transfer of any series A preferred share and/or ordinary share. Any such shares not acquiredby a Series C Shareholder (pursuant to its rights of first refusal) may be transferred to a third party atany time within three months after the date of the last offer by the Company to a Series CShareholder, provided that, in relation to such transfer of series A preferred shares and ordinary sharesonly, the Series C Shareholders are given the opportunity to transfer such number of their EquityShares as determined under the Articles to such third party.
Notwithstanding the above and the Articles, any shareholder may transfer its Equity Shares (subject totag along rights) with Investor Majority Consent and the approval of the Board.
The Articles also contain provisions on mandatory transfers, tag along rights and drag along rights,which supplement the above provisions.
143

6.9 Alteration of share capital
Subject to the 2014 Act and the Articles, the Company may by ordinary resolution, increase its sharecapital, consolidate and divide all or any of its share capital, re-classify all or any of its share capital,sub-divide its shares or any of them or cancel shares.
Specifically, the Articles provide that:
(i) Investor Majority Consent is required for the Company to create a new class of shares havingrights senior to or on parity with the series C preferred shares;
(ii) Series B Majority Consent is required for the Company to create a new class of shares havingrights senior to or on parity with the series B preferred shares; and
(iii) Investor Majority Consent and Series B Majority Consent are required for the Company to alter,increase, sub-divide or consolidate its share capital (other than in connection with the operationof a share option scheme or the issue of growth shares or the issue of shares which theCompany is required to make by reason of a right attached to a Share).
6.10 Reduction of capital
The Company may, by special resolution, reduce its share capital and any capital redemption reservefund in any manner save that Investor Majority Consent and Series B Majority Consent are requiredfor the Company to reduce its share capital.
6.11 Purchase of own shares
Under the Articles, the Company has the authority in accordance with sections 105 to 116 of the 2014Act to purchase its own shares in issue save that Investor Majority Consent and Series B MajorityConsent are required for the Company to enter into any contract to purchase any of the Company’sshares or to buy in any such Shares.
6.12 General meetings
As a Gibraltar private company limited by shares, the Company is required to hold a general meetingas its annual general meeting each year save that the Company may by special resolution dispensewith the holding of an annual general meeting.
6.13 Directors
(a) Number of Directors
The Articles provide that the number of directors constituting the Board shall at all times be at leastthree. There is no maximum number of directors.
(b) Appointment of Directors
Any person who is willing to act as a director, may be appointed to be a director by ordinaryresolution or a decision of the Directors.
The Articles provide that the Board shall be appointed as follows:
(i) Partech, for so long as it holds any Equity Shares, shall be entitled to appoint one director tothe Board (the “Partech Director”);
(ii) Level Equity, for so long as it holds any Equity Shares, shall be entitled to appoint one directorto the Board (the “Level Equity Director”); and
(iii) Ning Li (the “Founder”), for so long as he holds any Equity Shares, shall be entitled to appointone director to the Board (the “Founder Director”).
The Board shall appoint two independent directors (each an “INED”) to be mutually agreed byPartech, Level Equity and the Founder.
The Board shall be entitled to appoint the chief executive officer of the Company at any time.
144

(c) Vacation of Office
The Articles set out various circumstances in which a person shall cease to be a director of theCompany, for example, if:
(i) that person ceases to be a director by virtue of the 2014 Act or is prohibited by law from beinga director;
(ii) a bankruptcy order is made against that person or a composition is made with that person’screditors generally in satisfaction of that person’s debts;
(iii) a registered medical practitioner who is treating that person gives a written opinion to theCompany stating that that person has become physically or mentally incapable of acting as adirector and may remain so for more than three months;
(iv) by reason of that person’s mental health, a court makes an order which wholly or partly preventsthat person from personally exercising any powers or rights which that person would otherwisehave; or
(v) the Company received notification from that person that that person is resigning and suchresignation has taken effect in accordance with its terms.
Partech shall be entitled to remove from office any Partech Director.
Level Equity shall be entitled to remove from office any Level Equity Director.
The Founder shall be entitled to remove from office any Founder Director.
The removal of any INED shall be agreed by at least two of Partech, Level Equity and the Founder.
Subject to the above, the Company may, by ordinary resolution of which special notice has beengiven, or by special resolution, remove any Director from office.
(d) Alternate Director
Any Director may, by written notice, appoint as an alternate any person who is willing to act as thatDirector’s alternate. Any Director who has appointed an alternate may, at his or her discretion, revokesuch appointment by written notice to the Company signed by the appointor, or in any other mannerapproved by the Directors.
(e) Term of Office
Save as disclosed in paragraph (c) above (Vacation of Office), the Articles do not contain any otherprovision relating to the Directors’ term of office.
(f) Remuneration of Directors
Directors are entitled to such remuneration as the Directors determine for their services to theCompany as directors and for any other service, which they undertake for the Company. Subject to theArticles, a director’s remuneration may take any form and include any arrangements in connectionwith the payment of a pension, allowance or gratuity, or any death, sickness or disability benefits, toor in respect of that director.
In general, the Company may pay any reasonable expenses which the Directors properly incur inconnection with their attendance at meetings of directors or committees of directors, general meetingsor separate meetings of the holders of any class of shares or of debentures of the Company orotherwise in connection with the exercise of their powers and the discharge of their responsibilities inrelation to the Company. Specifically, the Partech Director, the Level Equity Director, the FounderDirector and the INEDs are entitled to be reimbursed all reasonable expenses by the Company butshall not otherwise be entitled to receive any other remuneration unless first approved by the Board.
An alternate director is not entitled to receive any remuneration from the Company except such part ofthe alternate’s appointor’s remuneration as the appointor may direct by written notice to the Companybut shall not otherwise be entitled to receive any other remuneration unless first approved by theBoard.
145

6.14 IPO Exchange Mechanism
The Board can require shareholders to transfer all of their shares in the Company to Listco for thepurposes of an IPO that has been approved by the requisite shareholders under the Shareholders’Agreement.
Each shareholder of the Company will be deemed under the IPO Exchange Mechanism to haveappointed each of the Directors to be their attorney to take such action as is necessary or desirable toeffect and consummate the IPO Reorganisation.
Following an IPO Reorganisation (as defined in the Articles), if a person becomes a shareholder of theCompany pursuant to the exercise of a pre-existing option or warrant to acquire ordinary shares in theCompany, such person shall be required to transfer its, his or her ordinary shares in the Company toListco. Such shareholder will be deemed to have appointed each of the Directors to be its, his or herattorney to take such action is necessary or desirable to effect and consummate such transfer.
7. SUBSIDIARIES
The Company is the holding company of the Group. The principal subsidiaries and subsidiary undertakingsof the Company are as follows:
Name Principal activityCountry ofincorporation
Percentage ownership(direct or indirect)
Made.com Design Ltd (1) ........... Retail sale via mailorder houses or viainternet.
England and Wales 100% direct ownership
Made.com Netherlands B.V. ...... Operational andmarketing supportservices to MDL.Currently dormant.
Netherlands 100% indirectownership
Made.com Trading Limited ....... Holding company. Hong Kong 100% indirectownership
Made.com Company Limited .... Product developmentand sourcing supportservices to MDL.
China 100% indirectownership
—————Notes:(1) In addition, MDL has a branch office in France, Germany and the Netherlands and a representative office in Vietnam.
Group structure
The following structure chart illustrates the Group structure as at the date of this Registration Document:
146

8. SHARE INCENTIVE ARRANGEMENTS
The Group has granted options, which give holders the right to acquire ordinary shares in the Company forthe relevant exercise price. Following completion of the steps described in this Part X: “AdditionalInformation – Proposed Pre-IPO Reorganisation”, options will continue to subsist over ordinary shares inListco. The Group has operated three share plans, which comprise (i) the Company Share Option Plan,(ii) the Non-Qualifying Share Option Plan, and (iii) the MADE x Everyone Company Share Option Plan. Inaddition, the Group has entered into agreements with directors and employees for the grant of options(including Enterprise Management Incentive options), which include options granted to, amongst others, theChair, Chief Executive Officer, Company Secretary and General Counsel and certain former employees ofthe Company. Further details of these options are set out below. The exercise of options under any of thesearrangements may be satisfied with the issue of new ordinary shares in the Company. The number ofordinary shares in the Company and/or the option exercise price may be adjusted on a variation of sharecapital of the Company so that the total exercise price payable in respect of an option remains unchanged.
Company Share Option Plan
Options granted as UK tax-advantaged options under the Company Share Option Plan (the “CSOPOptions”) over 1,219,999 shares in the Company are currently held by current and former employees. TheCSOP Options have exercise prices of between £3.62 and £14.51 per Company share.
CSOP Options over 955,827 shares in the Company (which, following completion of the steps described inthis Part X: “Additional Information – Proposed Pre-IPO Reorganisation”, represent 9,558,270 ordinaryshares in the capital of Listco with exercise prices of between £0.362 and £1.451 per share) are currentlyvested and exercisable. CSOP Options will vest and become exercisable in respect of an additional1,058,290 ordinary shares in Listco immediately prior to Admission, in respect of 333,330 ordinary sharesin Listco on 30 December 2021, in respect of 666,680 ordinary shares in Listco on 30 December 2022, inrespect of 583,420 ordinary shares in Listco, and in respect of 58,290 ordinary shares in Listco on aquarterly basis commencing on 1 October 2021 until fully vested on 1 January 2024. Vesting is conditionalon the participants remaining employed by the Group. Once vested, CSOP Options may be exercised at anytime before the business day immediately preceding the 10th anniversary of grant, following whichunexercised options lapse.
Non-Qualifying Share Option Plan
Options granted as non-tax advantaged options under the Non-Qualifying Share Option Plan (the “Non-Qualifying Options”) over 268,333 shares in the Company are currently held by current and formeremployees. The Non-Qualifying Options have exercise prices of between £3.62 and £14.51 per Companyshare.
Following completion of the steps described in this Part X: “Additional Information – Proposed Pre – IPOReorganisation”, Non-Qualifying Options shall remain outstanding over 2,683,330 ordinary shares in Listco,with exercise prices of between £0.362 and £1.451 per share.
Non-Qualifying Options over 168,328 shares in the Company (which, following completion of the stepsdescribed in this Part X: “Additional Information – Proposed Pre-IPO Reorganisation”, represent 1,683,280ordinary shares in Listco) are currently vested and exercisable. Non-Qualifying Options will vest in respectof the remaining 1,000,050 ordinary shares in Listco immediately prior to Admission, conditional on theparticipants remaining employed by the Group. Following vesting, Non-Qualifying Options may be exercisedat any time until the 10th anniversary of grant, following which unexercised options lapse.
MADE x Everyone Company Share Option Plan
The MADE x Everyone Company Share Option Plan provides for the grant of tax-advantaged options toemployees in the UK under Part A, non-tax advantaged options under Part B and cash-based options over anotional number of shares under Part C.
Options over 237,600 shares in the Company are currently held by employees under Part A and optionsover 51,600 shares in the Company are currently held by employees under Part B. In addition, cash-basedoptions are currently held under Part C by reference to a notional 36,000 shares in the Company byemployees based in China and Vietnam. All options under the plan have an exercise price of £10.56 pershare.
Following completion of the steps described in this Part X: “Additional Information – Proposed Pre-IPOReorganisation”, options shall remain outstanding over 2,376,000 ordinary shares in Listco under Part A,
147

over 516,000 ordinary shares in Listco under Part B and over a notional 360,000 ordinary shares in Listcounder Part C, each with an exercise price of £1.056 per share.
All options granted under the MADE x Everyone Company Share Option Plan have an exercise price of£10.56 per Company share and will, subject to the participants remaining employed by the Group, vest andbecome exercisable as to 50% upon Admission, as to a further one-sixth on 1 January 2023 and as to theremainder on 1 January 2024. Options granted under Part A and Part B of the MADE x EveryoneCompany Share Option Plan will remain exercisable until 1 January 2031, following which unexercisedoptions lapse. Options granted under Part C of the MADE x Everyone Company Share Option Plan will bedeemed immediately exercised upon vesting, provided that Listco’s share price is above the exercise price(as adjusted as a result of the proposed pre-IPO reorganisation) on each vesting date. If on any vesting dateListco’s share price is below the exercise price, options granted under Part C will not be deemed exercisedbut will continue to be capable of exercise on the next vesting date, provided that options granted underPart C will lapse to the extent not exercised if Listco’s share price is not above the exercise price on1 January 2024.
Individual option agreements with directors and employees
Individual options granted as tax-advantaged Enterprise Management Incentive options (the “EMI Options”)and non-tax advantaged options (the “Unapproved Options”) over 2,258,758 and 566,026 shares in theCompany respectively are currently held by current and former directors and employees. All EMI Optionsand all Unapproved Options are vested and may be exercised at any time until the business dayimmediately preceding the 10th anniversary of grant (following which, if unexercised, they will lapse), savethat Unapproved Options over 349,359 shares in the Company have no automatic lapse date. The EMIOptions and Unapproved Options have exercise prices of between £1.6291 and £7.24 per Company share.
Following completion of the steps described in this Part X: “Additional Information – Proposed Pre-IPOReorganisation”, EMI Options and Unapproved Options shall remain outstanding over 22,587,580 and5,660,260 ordinary shares in Listco respectively, with exercise prices of between £0.16291 and £0.724 pershare.
9. PENSIONS
An overview of the Company’s pension contributions, including the total amounts set aside or accrued bythe Company or its subsidiaries to provide pension, retirement or similar benefits are set out in Note 7 ofPart IX: “Group Historical Financial Information”. The total amount set aside or accrued by the Companyor its subsidiaries to provide pension, retirement or similar benefits was nil as at 31 December 2020.
10. MATERIAL CONTRACTS
The following are the only contracts (not being contracts entered into in the ordinary course of business)which have been entered into by members of the Group within the two years immediately preceding thedate of this Registration Document and which are, or may be, material or which have been entered into atany time by members of the Group and/or which contain any provision under which any member of theGroup has any obligation or entitlement which is, or may be, material to the Group as at the date of thisRegistration Document:
10.1 Shareholders’ Agreement
The Company and its shareholders, including the Founder, Partech, Level Equity and certain managersare party to a subscription and shareholders’ agreement relating to the Company dated 29 June 2015(as amended) (the “Shareholders’ Agreement”). The Shareholders’ Agreement regulates therelationship between the parties as indirect shareholders of the Group.
The Shareholders’ Agreement contains provisions that govern matters such as: (i) decisions requiringconsent of certain shareholders, (ii) Group governance, and (iii) exit events (including sale processesand initial public offerings). Certain shareholders also benefit from customary contractual consent/vetorights under the Shareholders’ Agreement, including over share sales, asset sales and initial publicofferings. The Shareholder’s Agreement shall terminate and cease to have effect upon an initial publicoffering approved in accordance with the Shareholders’ Agreement save that this does not release anyparty from liability for breaches of this agreement which occurred prior to its termination.
148

10.2 Mezzanine Term Loan Agreement
The Company as guarantor, MDL as borrower (the “Borrower”) and SVB are a party to a mezzanineterm loan agreement dated 14 May 2020 (as amended from time to time) (the “Mezzanine TermLoan Agreement”). Pursuant to the Mezzanine Term Loan Agreement, SVB has made available to theBorrower a term loan facility in an amount of up to £10,000,000 (the “Mezzanine Facility”).
The maturity date of the Mezzanine Term Loan Agreement is 14 May 2023. Amounts outstandingunder the Mezzanine Term Loan Agreement accrue interest at a floating rate per annum equal to thehigher of (i) the Bank of England’s Base Rate plus 9.00% per annum, and (ii) 9.75% per annum. Asat 14 May 2021, the Mezzanine Facility was fully drawn. The Mezzanine Facility is subject toscheduled amortisation in the event the T6M net revenue of the Group has grown by less than 8.0%in the six-month period prior to the end of each quarter. No such amortisation will apply if, within 10business days of the delivery of statements evidencing the net revenue of the Group having grown byless than 8.0% in the six-month period prior to the end of the relevant quarter, any shareholder in theCompany or within 5 business days of the delivery of statements evidencing the net revenue of theGroup having grown by less than 8.0% in the six-month period prior to the end of the relevantquarter, an investor approved by SVB injects an equity cure in an amount of not less that £5,000,000.
The Mezzanine Facility may be utilised to finance the Borrower’s general corporate purposes.
The Mezzanine Term Loan Agreement contains change of control provisions pursuant to which SVB’sconsent is required to permit the direct or indirect change of ownership or control of any of theCompany’s subsidiaries or permit the entry by the Company’s shareholders into a transaction or aseries of transactions which result in a new shareholder or shareholders acquiring at least 40% of thevoting shares of the Company. In addition, the Mezzanine Term Loan Agreement contains certaincustomary affirmative and negative covenants including, limitations on, subject to certain exceptions,the ability of the Company and the Borrower to, among other things, declare, make or pay dividendsor other distributions, make certain acquisitions or disposals, grant security and incur debt. TheMezzanine Term Loan Agreement is subject to purported subordination mechanics with respect to theRevolving Line Loan Agreement further described below.
The Mezzanine Facility may be prepaid in full by the Borrower on 5 business days prior notice. Suchprepayment requires the Borrower to pay a prepayment fee of 2.00% of the total principal amountstanding if the prepayment occurs on or prior to the first anniversary of the initial drawing or 1.00%of the total principal amount standing if the prepayment occurs following the first anniversary but onor prior to the second anniversary of the initial drawing. The prepayment fee shall not apply in certaincircumstances, including in the event the guarantor lists on a Stock Exchange.
Further, in connection with the Mezzanine Term Loan Agreement, the Borrower has granted an “allmonies” security interest in favour of SVB under certain all assets English law debentures and Belgianlaw floating pledges. Further, the Company has granted a guarantee and indemnity in connection withthe Borrower’s obligations under the Mezzanine Term Loan Agreement.
10.3 Revolving Line Loan Agreement
The Company as guarantor, the Borrower (as defined above) and SVB (as defined above) are a partyto a revolving line loan agreement dated 17 January 2020 (as amended from time to time) (the“Revolving Line Loan Agreement”). Pursuant to the Revolving Line Loan Agreement, SVB hasmade available a multicurrency revolving line of credit (the “Revolving Facility”) to the Borrower(i) for the period from 31 March 2021 up to and including 30 April 2021, up to a maximum amountof £6,000,000 and (ii) for the period on and from 1 May 2021, up to a maximum amount of£10,000,000.
The Revolving Facility can be drawn in minimum amounts of £1,000,000 with an option to draw ineither GBP, USD or EURO. Amounts outstanding under the Revolving Line Loan Agreement accrueinterest at a floating rate relevant to the currency drawn plus a margin with such rate to be not lessthan 5.25% per annum. The maturity date of the Revolving Line Loan Agreement is 17 January 2022.An unused revolving line fee of 1% per annum of the average unused portion of the total commitmentunder the Revolving Facility is payable quarterly in arrears. An early termination fee of 1% of thetotal commitment under the Revolving Facility is payable on the date of such early termination if theRevolving Facility is voluntarily terminated by the Company or the Borrower or involuntarilyterminated by acceleration of the Revolving Facility. Such termination fee shall be waived if theRevolving Facility is refinanced by SVB.
149
The Revolving Facility is subject to a clean down whereby all drawings are to be reduced to £0 for atleast 15 successive days twice in each 12 month period. In addition, if the aggregate of all drawingsis in excess of £5,000,000 at any time, within 120 days of that time, the Revolving Facility isrequired to be reduced below £5,000,000 for at least 15 successive days. As at 14 May 2021, theRevolving Facility was undrawn.
The Revolving Facility may be utilised solely to finance the Borrower’s general corporate and workingcapital purposes.
The Revolving Line Loan Agreement contains a change of control provision pursuant to which SVB’sconsent is required to permit the change of ownership or control of any of the Company’s subsidiariesor permit the entry by the Borrower’s shareholders into a transaction or a series of transactions whichresult in a new shareholder acquiring at least 40% of the voting shares of the Borrower. Unlike theMezzanine Term Loan Agreement, the change of control provision does not extend to indirect changesof ownership or control of the Company. However, the Revolving Line Loan Agreement contains across-default provision, which would be triggered by the occurrence of a default (including, a breachof the change of control provision) under the Mezzanine Term Loan Agreement (or any otherfinancing agreements) provided more than £100,000 of debt is accelerated. In addition, the RevolvingLine Loan Agreement contains certain customary affirmative and negative covenants including,limitations on, subject to certain exceptions, the ability of the Company and the Borrower to, amongother things, declare, make or pay dividends or other distributions, make certain acquisitions ordisposals, grant security and incur debt. The Revolving Line Loan Agreement also requires theBorrower to maintain at all times at least £20,000,000 in liquidity being the aggregate amount of theGroup’s cash in hand, cash equivalents and available commitment under the Revolving Facility plus anamount equal to 75% of the value of the Borrower’s eligible inventory up to a maximum amount of£8,000,000.
In connection with the Revolving Line Loan Agreement, the Borrower has granted an “all monies”security interest in favour of SVB under certain all assets English law debentures and Belgian lawfloating pledges. Further, the Company has granted a guarantee and indemnity in connection with theBorrower’s obligations under the Revolving Line Loan Agreement.
10.4 Warrant Instruments
In connection with the Mezzanine Term Loan Agreement, the Company executed warrant instrumentsin favour of SVB and SVB Innovation. Pursuant to the warrant instruments, on 14 May 2020, theCompany issued warrants over 43,500 ordinary shares (21,750 to each of SVB and SVB Innovation).The warrants confer the right on their holders to subscribe for ordinary shares, in cash, at an exerciseprice of £0.001 per ordinary share. The warrants are exercisable in whole or in part at any time on orprior to 14 May 2030.
Under the terms of these warrants, the Company is required to give each warrant holder at least10 days’ notice of a listing of the Company’s securities on the London Stock Exchange or thegranting of permission for any of the Company’s securities to be traded on the London StockExchange. The warrant holders may elect to exercise their rights under the warrants to subscribe forordinary shares in the Company conditionally on, but immediately prior to the completion of suchlisting.
10.5 Reorganisation Deed
In order to facilitate the Proposed Pre-IPO Reorganisation, Listco, the Company and certainshareholders of the Company entered into the Reorganisation Deed on 21 May 2021.
Pursuant to the terms of the Reorganisation Deed:
(a) immediately prior to Admission, Listco will acquire, and certain shareholders of the Companywill transfer, all of the:
(i) ordinary and preferred shares with a nominal value of £0.001 each in the Company inexchange for ordinary shares with a nominal value of £0.001 each in Listco withmaterially equivalent rights to such ordinary shares in the capital of the Company on a 1for 1 basis; and
150
(ii) growth shares with a nominal value of £0.001 each in the Company in exchange for suchnumber of ordinary shares in Listco as calculated under the Company’s current articles ofassociation as if an IPO of the Company (rather than Listco) were to take place,
(the “Share Exchange”);
(b) to ensure that immediately following the Share Exchange, each shareholder will hold the samenumber of ordinary shares that it would have held in the Company if an IPO of the Company(rather than Listco) were proposed to take place, Ning Li (the current sole shareholder of Listco)will waive his right to receive 1,000 ordinary shares in Listco under the Share Exchange, beingthe number of ordinary shares in Listco that he currently holds (and will hold) immediately priorto the Share Exchange;
(c) the Share Exchange is conditional upon the approval of the relevant Company shareholders, andthe Board and Listco resolving, to proceed with the proposed IPO. If these conditions are notsatisfied on or before 31 December 2021, the Reorganisation Deed will automatically terminate;
(d) the Shareholders’ Agreement will be terminated immediately prior to Admission and theCompany will be released from all liabilities under the Shareholders’ Agreement (includingliabilities which arose prior to such termination);
(e) each shareholder of the Company agrees not to transfer its, his or her shares in the Companyfrom the date of the Reorganisation Deed until the earlier of Admission and 31 December 2021;
(f) Ning Li (the sole shareholder of Listco) agrees not to transfer his shares in Listco or to exercisehis rights as shareholder to create, issue, buy back or redeem any securities in Listco without theprior written consent of the Company or other than as contemplated by the ReorganisationAgreement; and
(g) each shareholder of the Company appoints each of the Directors as its, his or her attorney totake such action as is necessary or desirable to effect and consummate the Proposed Pre-IPOReorganisation.
11. LITIGATION
There are no governmental, legal or arbitration proceedings (including any such proceedings which arepending or threatened of which the Company is aware) during the 12 months preceding the date of thisRegistration Document, which may have, or have had in the recent past, a significant effect on theCompany’s and/or the Group’s financial position or profitability.
12. NO SIGNIFICANT CHANGE
There has been no significant change in the financial position or financial performance of the Group since31 March 2021, the date to which the Group’s Interim Historical Financial Information was published.
13. RELATED PARTY TRANSACTIONS
Save as set out in Note 24 and 25 of Part IX: “Group Historical Financial Information”, there were norelated party transactions entered into by the Company or any other member of the Group during thefinancial years ended 31 December 2020, 2019 and 2018 and during the period up to the date of thisRegistration Document.
14. PROPERTY
For further information on the Group’s principal properties refer to Part V: “Business Overview – Property”.
15. PROPOSED PRE-IPO REORGANISATION
15.1 In connection with and immediately prior to Admission, the Group will undertake a reorganisation ofits corporate structure which will result in Listco becoming the ultimate holding company of theGroup and the Company becoming a wholly-owned direct subsidiary of Listco (“Proposed Pre-IPOReorganisation”).
15.2 The following steps relating to the Proposed Pre-IPO Reorganisation have taken place prior to thepublication of this Registration Document:
151

(a) on 20 April 2021, Oakwood Corporate Nominees 2021 Limited (an incorporation agent)incorporated Listco with 1,000 ordinary shares of £0.001 each;
(b) on 22 April 2021, Ning Li (an existing shareholder of the Company) acquired 1,000 ordinaryshares of £0.001 each in Listco from Oakwood Corporate Nominees 2021 Limited for £1.Immediately following such acquisition, Listco issued a redeemable preference share withnominal value of £49,999 (the “Redeemable Preference Share”) to Ning Li;
(c) on 21 May 2021, an extraordinary general meeting of the Company was held. At this meeting, aspecial resolution of the Company was passed to amend the Company’s articles of association tointroduce a mechanism for the Board to require shareholders to exchange their shares in theCompany for shares in a new holding company of the Company for the purposes of an IPOwhich has been approved by the relevant shareholders under the Shareholders’ Agreement (the“IPO Exchange Mechanism”); and
(d) on 21 May 2021, Listco, the Company and certain shareholders of the Company entered into areorganisation deed (the “Reorganisation Deed”). Under the terms of the Reorganisation Deed,the Company’s shareholders agreed to exchange their shares in the Company for ordinary sharesin Listco immediately prior to Admission. As a consequence of this exchange, Listco willbecome the holding company of the Company.
15.3 The following steps relating to the Proposed Pre-IPO Reorganisation will take place after thepublication of this Registration Document and immediately prior to Admission:
(a) in accordance with the terms of the Reorganisation Deed, Listco will acquire the entire issuedshare capital of the Company from the Shareholders of the Company in exchange for ordinaryshares issued by Listco to the Shareholders of the Company, thereby making Listco the newholding company of the Group;
(b) to the extent that they agree to do so, the holders of options over ordinary shares in theCompany will cancel their options in exchange for options over ordinary shares of Listco; and
(c) Listco will subdivide each of its ordinary shares of £0.001 each into 10 ordinary shares of£0.0001 each (the “Subdivision”).
15.4 It is expected that after publication of this Registration Document and prior to Admission, SVB andSVB Innovation will exercise their warrants over, in aggregate, 43,500 ordinary shares of £0.001 eachin the Company and will enter into an agreement with the Company and Listco to transfer their43,500 ordinary shares of £0.001 each in the Company to Listco in exchange for 43,500 ordinaryshares of £0.001 each in Listco immediately prior to Admission. Following such transfer, theirordinary shares in Listco will be subdivided under the Subdivision and SVB and SVB Innovation willtherefore hold 435,000 ordinary shares of £0.0001 each in Listco immediately following theSubdivision.
15.5 The effect of the steps above is to ensure that, immediately after the exchanges of shares and optionsset out above, and prior to the Subdivision:
(a) each of the existing shareholders of the Company (including SVB and SVB Innovation followingthe exercise of their warrants) holds the same number of ordinary shares in Listco that theywould have held in the Company if an IPO of the Company were proposed to take place; and
(b) each of the optionholders of the Company holds options over the same number of ordinaryshares in Listco as the number of ordinary shares in the Company that are subject to theirexisting options.
152

15.6 The diagram below sets out the New Group structure expected on the date of Admission:
15.7 On Admission, Listco will redeem the Redeemable Preference Share out of the proceeds of theprimary offering.
15.8 Following Admission:
(a) it is anticipated that Listco will undertake a court approved reduction of capital in which theshare premium of Listco will be cancelled to create a pool of distributable reserves in Listco;and
(b) if any holders of options or warrants over ordinary shares in the Company do not cancel theiroptions or warrants in exchange for options or warrants over ordinary shares of Listco prior toAdmission, as and when they exercise such options or warrants, the ordinary shares in theCompany issued to them upon such exercise will be transferred to Listco in exchange forordinary shares in Listco by way of the IPO Exchange Mechanism.
16. CONSENTS
Ernst & Young LLP (“EY”) (who is registered to carry out audit work by the Institute of CharteredAccountants in England and Wales) has given and has not withdrawn its written consent to the inclusion ofthe report in Part IX: “Group Historical Financial Information – Accountant’s Report on the GroupHistorical Financial Information”, and has authorised the contents of its report for the purposes of item 1.3of Annex 1 of the Prospectus Delegated Regulation.
17. MISCELLANEOUS
The financial information contained in this Registration Document does not amount to statutory accountswithin the meaning of section 434(3) of the UK Companies Act.
18. DOCUMENTS AVAILABLE FOR INSPECTION
Copies of the following documents are available on the Group’s website, athttps://www.corporate.made.com/, for a period of 12 months following the date of this RegistrationDocument:
(a) the Articles;
(b) the historical financial information in respect of the three financial years ended 31 December 2020,2019 and 2018, together with the related accountant’s report from EY, which is set out inPart IX: “Group Historical Financial Information – Accountant’s Report on the Group HistoricalFinancial Information”;
(c) the EY letter of consent referred to in this Part X: “Additional Information – Consents”; and
(d) this Registration Document.
153

This Registration Document will be published in electronic form and will be available on the Group’swebsite at https://www.corporate.made.com/.
154

PART XI
DEFINITIONS
The following definitions apply throughout this Registration Document unless the context requires otherwise:
“2014 Act” means the Companies Act 2014 of Gibraltar (as amended);
“Adjusted EBITDA” means EBITDA adjusted to include the unwinding of the discount onlease liabilities and depreciation of right-of-use assets (from the date ofadoption of IFRS 16) to reflect the fact that lease-related costs are keyunderlying business operating expenses; exclude the impact of anyshare based payment expenses to reflect the fact that this item is notdirectly correlated to underlying business performance; and exclude theimpact of any items deemed to be exceptional in nature;
“Admission” means the admission of Listco’s shares to the premium listing segmentof the Official List of the FCA and to trading on the London StockExchange’s main market for listed securities;
“AOV” means the value of all sales orders (excluding VAT) divided by thenumber of orders;
“Articles” means the articles of association of the Company in force as at the dateof this Registration Document;
“Audited Consolidated FinancialStatements”
means the audited consolidated financial statements of the Group;
“AWS” means Amazon Web Services;
“Board” means the board of directors of the Company from time to time,including any duly constituted committee thereof;
“Borrower” means MDL;
“Brexit” means the United Kingdom’s exit from the European Union;
“Bribery Act” means the Bribery Act 2010 (as amended);
“CAC” means customer acquisition cost;
“CEO” means Philippe Chainieux, the chief executive officer of the Group;
“CFO” means Adrian Evans, the chief financial officer of the Group;
“Chair” means Susanne Given, the chair of the Group;
“City Code” means the UK City Code on Takeovers and Mergers;
“CMS” means content management system;
“Code” means Internal Revenue Code of 1986, as amended;
“Company” means Made.com Limited;
“concert party” has the meaning given in the City Code;
“COO” means Nicola Thompson, the chief operating officer of the Group;
“CRM” means customer relationship management;
“CSOP Options” means options granted as UK tax-advantaged options under theCompany Share Option Plan;
“CTR” means click-through rate;
“Directors” means the directors of the Company (whose names appear on page 25 ofthis Registration Document);
“Disclosure and TransparencyRules”
means the disclosure guidance and transparency rules made by the FCAunder Part VI of FSMA;
155

“DTA” means deferred tax assets;
“EEA” means the European Economic Area;
“EMI Options” means individual options granted as tax-advantaged EnterpriseManagement Incentive options;
“Equity Shares” means the series A preferred shares, series B-1 preferred shares, seriesB-2 preferred shares, series C-1 preferred shares, series C-2 preferredshares, series C-3 preferred shares, series C-4 preferred shares and theordinary shares;
“ESG” means environmental, social and corporate governance;
“EU” means the European Union;
“EUTR” means EU Timber Regulations;
“EY” means Ernst & Young LLP;
“FCA” means the Financial Conduct Authority of the United Kingdom;
“Founder Director” means a director appointed to the Board by the Founder;
“Founder” means Ning Li;
“FSMA” means the Financial Services and Markets Act 2000 (as amended);
“FY 2018” means the Group’s financial year ended 31 December 2018;
“FY 2019” means the Group’s financial year ended 31 December 2019;
“FY 2020” means the Group’s financial year ended 31 December 2020;
“GAAP” means the generally accepted accounting principles;
“GCP” means Google Cloud Platform;
“GDPR” means the General Data Protection Regulation (Regulation (EU) 2016/679) (as it forms part of retained EU law and implemented through theData Protection Act 2018);
“Group Historical FinancialInformation”
means the financial information relating to the Group for each of theyears ended 31 December 2020, 2019 and 2018;
“Group” means the Group defined in Note 1 of Section B of Part IX: “GroupHistorical Financial Information”;
“HMRC” means Her Majesty’s Revenue and Customs;
“IFRS” means the International Financial Reporting Standards as adopted in theEU;
“INED” means an independent director appointed to the Board;
“Investor Director(s)” means Bruno Crémel and George McCulloch;
“Investor Majority Consent” means the consent of the Investor Majority;
“Investor Majority” means, as of the determination date, the holders of a majority of theseries C-1 preferred shares, series C-2 preferred shares and series C-4preferred shares (as if the same constituted one class) issued as of suchdate;
“IPO Exchange Mechanism” means the mechanism in the Company’s articles of association for theBoard to require shareholders to transfer their shares to a new holdingcompany of the Company for the purposes of an IPO;
“IPO Price” means the subscription price per share in respect of new ordinary sharesissued on a public offering at the time of such offering;
“Last twelve month (LTM) activecustomers”
means the number of customers who have placed at least one order inthe last 12 months during the reporting period;
156

“Level Equity Director” means a director appointed to the Board by Level Equity;
“Level Equity Growth Partners” means Level Equity Growth Partners I, L.P.;
“Level Equity Management” means Level Equity Management, LLC;
“Level Equity Opportunities Fund” means Level Equity Opportunities Fund 2015, L.P.;
“Level Equity” means Level Equity Growth Partners, Level Equity Opportunities Fundand Level Equity-Made;
“Level Equity-Made” means Level Equity-Made Investors LLC;
“Listco” means Made.com Group Plc;
“Listing Rules” means the rules relating to admission to the Official List under Part VIFSMA;
“London Stock Exchange” means London Stock Exchange plc;
“MADE” means the Group;
“MDL” means Made.com Design Ltd;
“Mezzanine Facility” means the term loan facility in an amount of up to £10,000,000 thatSVB has made available to the Borrower pursuant to the MezzanineTerm Loan Agreement;
“Mezzanine Term LoanAgreement”
means the mezzanine term loan agreement dated 14 May 2020 (asamended from time to time) to which the Company, as guarantor, MDL,as borrower and Silicon Valley Bank as lender are a party;
“New Group” means at and following completion of the Proposed Pre-IPOReorganisation, Listco and its subsidiaries and subsidiaryundertakings from time to time;
“Non-Qualifying Options” means options granted as non-tax advantaged options under theCompany’s Non-Qualifying Share Option Plan;
“NPS” means net-promoter-score;
“Official List” means the official list maintained by the FCA for the purposes of Part VIof FSMA;
“Order” means the Financial Services and Markets Act 2000 (FinancialPromotion) Order 2005;
“Ordinary Shares” means ordinary shares of £0.001 each in the capital of the Company;
“Partech Director” means a director appointed to the Board by Partech;
“Partech” means Partech Growth FCPI;
“PCI-DSS” means Payment Card Industry Data Security Standard;
“Product InformationManagement”
means product information management;
“Proposed Pre-IPOReorganisation”
means the proposed reorganisation of the Group’s corporate structureprior to Admission and as further described in Part X: “AdditionalInformation – Proposed-Pre-IPO Reorganisation”;
“Prospectus Delegated Regulation” means Delegated Regulation (EU) 2019/980 of 14 March 2019supplementing the Prospectus Regulation, as it forms part of retainedEU law;
“Prospectus Regulation Rules” means the prospectus rules published by the FCA under section 73A ofFSMA;
“RDEC” means research and development expenditure credit;
“Redeemable Preference Share” means a redeemable preference share in the capital of the Company withnominal value of GBP 49,999;
157
“Registration Document” means this document relating to and prepared by the Company inaccordance with the Prospectus Regulation Rules;
“Reorganisation Deed” means the reorganisation deed entered into by Listco, the Company andcertain shareholders of the Company connection with the Proposed Pre-IPO Reorganisation;
“Reporting Accountant” means Ernst & Young LLP;
“retained EU law” has the meaning given to it in Withdrawal Act;
“Revolving Facility” means the multicurrency revolving line of credit made available to theBorrower by SVB pursuant to the Revolving Line Loan Agreement;
“Revolving Line Loan Agreement” means the revolving line loan agreement dated 17 January 2020 (asamended from time to time) to which the Company as guarantor, itswholly-owned subsidiary, the Borrower and SVB are a party;
“SaaS” means software as a service;
“Securities Act” means the US Securities Act of 1933 (as amended);
“Senior Managers” means the persons named as Senior Managers in Part VI: “Directors,Senior Managers and Corporate Governance – Senior Managers” ofthis Registration Document;
“series B preferred shares” means, together, the series B-1 preferred shares and series B-2 preferredshares in the capital of the Company;
“series C preferred shares” means, together, the series C-1 preferred shares, series C-2 preferredshares, series C-3 preferred shares and series C-4 preferred shares in thecapital of the Company;
“Series C Shareholders” means the holders of the series C preferred shares;
“Share Exchange” means the acquisition by Listco of the entire issued share capital of theCompany from the Shareholders of the Company in exchange forordinary shares issued by Listco to the Shareholders of the Company;
“Shareholders’ Agreement” means the subscription and shareholders’ agreement dated 29 June2015, as amended on 24 July 2015, 19 September 2016, 6 March 2018and 16 December 2020;
“Shareholders” means the holders of Shares in the capital of the Company;
“Shares” means, together, the ordinary shares, series A preferred shares, series B-1 preferred shares, series B-2 preferred shares, series C-1 preferredshares, series C-2 preferred shares, series C-3 preferred shares, andseries C-4 preferred shares and growth shares in the capital of theCompany;
“SKU” means stock-keeping-unit;
“Subdivision” means the subdivision by Listco of each of its ordinary shares of £0.001each into 10 ordinary shares of £0.0001 each;
“SVB” means Silicon Valley Bank;
“SVB Innovation” means SVB Innovation Credit Fund VIII, L.P.;
“Trade and CooperationAgreement”
means the trade and cooperation agreement agreed between the UnitedKingdom and the European Union on 24 December 2020;
“Trustpilot” means Trustpilot.com;
“UK Companies Act 2006” means the Companies Act 2006 of England and Wales (as amended);
“UK Corporate Governance Code” means the UK Corporate Governance Code published by the FinancialReporting Council (as amended from time to time);
158

“UK Prospectus Regulation” means the Prospectus Regulation (EU) 2017/1129, as it forms part ofretained EU law;
“UKTR” means UK Timber Regulation;
“Unapproved Options” means individual options granted as non-tax advantaged options;
“Vice Chair” means Ning Li, the vice chair of the Company; and
“Withdrawal Act” means the European Union (Withdrawal) Act 2018 (as amended).
159