thirdavenuefunds 65,000 seacormarineholdings,inc. 4/20/18 $1,300,000 $23.38...
TRANSCRIPT

Third Avenue Funds SEMI-ANNUAL REPORT
APRIL 30, 2018
THIRD AVENUE VALUE FUND
THIRD AVENUE SMALL-CAP VALUE FUND
THIRD AVENUE REAL ESTATE VALUE FUND
Sign up for E-Delivery of Third Avenue Quarterly Shareholder Letters, Prospectuses and other Reports
www.thirdave.com/edeliveryGO GREEN. SIGN UP FOR E-DELIVERY.

THIRD AVENUE FUNDS
Privacy Policy
Third Avenue Funds (the “Funds”) respect your right to privacy. We also know that you expectus to conduct and process your business in an accurate and efficient manner. To do so, we mustcollect and maintain certain personal information about you. This is the information wecollect from you on applications or other forms and from the transactions you make with us,our affiliates, or third parties. We do not disclose any information about you or any of ourformer customers to anyone, except to our affiliates (which may include the Funds’ affiliatedmoney management entities) and service providers, or as otherwise permitted by law. Toprotect your personal information, we permit access only to authorized employees. Be assuredthat we maintain physical, electronic and procedural safeguards that comply with federalstandards to guard your personal information.
Proxy Voting Policies and Procedures
The Funds have delegated the voting of proxies relating to their voting securities to the Funds’investment adviser pursuant to the adviser’s proxy voting guidelines. A description of theseproxy voting guidelines and procedures, as well as information relating to how a Fund votedproxies relating to portfolio securities during the most recent 12-month period ended June 30,is available by August 31 each year (i) without charge, upon request, by calling (800) 443-1021, (ii) at the website of the Securities and Exchange Commission (the “SEC”) athttp://www.sec.gov, and (iii) on the Funds’ website www.thirdave.com.
Schedule of Portfolio Holdings—Form N-Q
The Funds file their complete schedule of portfolio holdings with the SEC for the first andthird quarters of each fiscal year on Form N-Q. The Funds’ Form N-Q is available on theSEC’s website at http://www.sec.gov, and may be reviewed and copied at the SEC’s PublicReference Room in Washington, DC. Information on the operation of the Public ReferenceRoom may be obtained by calling 1-800-SEC-0330.

TABLE OF CONTENTSThird Avenue Value Fund Page 2
Third Avenue Small-Cap Value Fund Page 7
Third Avenue Real Estate Value Fund Page 11
Statement of Assets and Liabilities Page 17
Statement of Operations Page 19
Statement of Changes in Net Assets Page 21
Financial Highlights Page 23
Notes to Financial Statements Page 34
Schedule of Shareholder Expenses Page 68

The summary of the Fund’s investments as of April 30, 2018 is as follows:
% of Net Assets
50 1510
Indu
stry
Oil & Gas Production & Services
U.S. Government Obligations
Diversified Holding Companies
Asset Management
Forest Products & Paper
Metals & Mining
Non-U.S. Real Estate Operating Companies
Insurance & Reinsurance
Banks
Automotive
U.S. Homebuilder
Manufactured Housing
Engineering & Construction
U.S. Real Estate Operating Companies
U.S. Real Estate Investment Trusts
Other
Other Assets less Liabilities
Third Avenue TrustThird Avenue Value FundIndustry Diversification(Unaudited)
2

PrincipalAmount($) Security†
Value(Note 1)
Corporate Notes - 0.52%Consumer Products - 0.28%
11,361,970 Home Products International, Inc., 2nd Lien,6.000%, due 12/20/22 (a)(b)(c)(d) . . . . . . . . . . . . . . . . . . . . . . . . . . . . . . . $ 3,288,136
Oil & Gas Production & Services - 0.24%2,900,000 Petroleum Geo-Services ASA, 7.375%, due 12/15/20 (Norway) (e) . . 2,849,250
Total Corporate Notes(Cost $27,821,007) . . . . . . . . . . . . . . . . . . . . . . . . . . . . . . . . . . . . . . . . . . . . . . . 6,137,386
Shares
Common Stocks - 84.15%Asset Management - 7.82%
867,523 Bank of New York Mellon Corp. (The) . . . . . . . . . . . . . . . . . . . . . . . . . . . . . . . . 47,288,6791,142,257 Brookfield Asset Management, Inc., Class A (Canada) . . . . . . . . . . . . . . 45,279,067
92,567,746
Automotive - 4.38%232,155 Bayerische Motoren Werke AG (Germany) . . . . . . . . . . . . . . . . . . . . . . . . . . . 25,811,402441,593 Toyota Industries Corp. (Japan) . . . . . . . . . . . . . . . . . . . . . . . . . . . . . . . . . . . . . 26,041,166
51,852,568
Banks - 4.70%431,720 Comerica, Inc. . . . . . . . . . . . . . . . . . . . . . . . . . . . . . . . . . . . . . . . . . . . . . . . . . . . . . . . 40,832,078744,098 KeyCorp . . . . . . . . . . . . . . . . . . . . . . . . . . . . . . . . . . . . . . . . . . . . . . . . . . . . . . . . . . . . . 14,822,432
55,654,510
Building & Construction Products/Services - 0.40%816,900 Grupo Cementos de Chihuahua S.A.B de C.V. (Mexico) . . . . . . . . . . . . . . 4,761,088
Capital Goods - 0.35%78,521 Nexans S.A. (France) . . . . . . . . . . . . . . . . . . . . . . . . . . . . . . . . . . . . . . . . . . . . . . . . 4,142,104
Consumer Products - 0.00%*526,368 Home Products International, Inc. (a)(b)(c)(d)(f) . . . . . . . . . . . . . . . . . . . . 1
Diversified Holding Companies - 12.34%4,854,458 CK Hutchison Holdings, Ltd. (Cayman Islands) . . . . . . . . . . . . . . . . . . . . . 57,403,272
878,725 Investor AB, Class B (Sweden) . . . . . . . . . . . . . . . . . . . . . . . . . . . . . . . . . . . . . . 38,254,419276,068 Pargesa Holding S.A. (Switzerland) . . . . . . . . . . . . . . . . . . . . . . . . . . . . . . . . . 25,837,125
3,309,567 Wheelock & Co., Ltd. (Hong Kong) . . . . . . . . . . . . . . . . . . . . . . . . . . . . . . . . . . . 24,554,384
146,049,200
Third Avenue TrustThird Avenue Value FundPortfolio of Investmentsat April 30, 2018 (Unaudited)
The accompanying notes are an integral part of the financial statements.
3

Shares Security†Value
(Note 1)
Common Stocks (continued)Engineering & Construction - 2.98%
1,087,930 Boskalis Westminster (Netherlands) . . . . . . . . . . . . . . . . . . . . . . . . . . . . . . . . $ 32,229,09823,856 Cie d’Entreprises CFE (Belgium) . . . . . . . . . . . . . . . . . . . . . . . . . . . . . . . . . . . . 3,007,604
35,236,702
Forest Products & Paper - 7.25%1,516,011 Interfor Corp. (Canada) (f). . . . . . . . . . . . . . . . . . . . . . . . . . . . . . . . . . . . . . . . . . . 28,349,5651,560,737 Weyerhaeuser Co., REIT . . . . . . . . . . . . . . . . . . . . . . . . . . . . . . . . . . . . . . . . . . . . . 57,403,907
85,753,472
Insurance & Reinsurance - 5.05%63,673 Alleghany Corp. . . . . . . . . . . . . . . . . . . . . . . . . . . . . . . . . . . . . . . . . . . . . . . . . . . . . . 36,590,96326,727 White Mountains Insurance Group, Ltd. (Bermuda) . . . . . . . . . . . . . . . . . 23,126,606
59,717,569
Manufactured Housing - 3.31%229,637 Cavco Industries, Inc. (f) . . . . . . . . . . . . . . . . . . . . . . . . . . . . . . . . . . . . . . . . . . . . 39,118,663
Metals & Mining - 6.72%17,756,306 Capstone Mining Corp. (Canada) (f). . . . . . . . . . . . . . . . . . . . . . . . . . . . . . . . . 15,488,970
5,635,548 Lundin Mining Corp. (Canada) . . . . . . . . . . . . . . . . . . . . . . . . . . . . . . . . . . . . . . 37,308,4291,147,004 Warrior Met Coal, Inc. . . . . . . . . . . . . . . . . . . . . . . . . . . . . . . . . . . . . . . . . . . . . . . . 26,667,843
79,465,242
Non-U.S. Real Estate Operating Companies - 5.42%855,654 Atrium European Real Estate, Ltd. (Jersey) . . . . . . . . . . . . . . . . . . . . . . . . . . 4,151,158
4,046,170 CK Asset Holdings, Ltd. (Cayman Islands) . . . . . . . . . . . . . . . . . . . . . . . . . . 34,930,4503,958,174 Henderson Land Development Co., Ltd. (Hong Kong) . . . . . . . . . . . . . . . . 25,097,014
64,178,622
Oil & Gas Production & Services - 14.11%5,401,246 Borr Drilling Ltd. (Bermuda) (f) . . . . . . . . . . . . . . . . . . . . . . . . . . . . . . . . . . . . . . 24,832,862
763,542 Ocean Rig UDW, Inc., Class A (Cayman Islands) (f) . . . . . . . . . . . . . . . . . 18,523,5294,846,358 Petroleum Geo-Services ASA (Norway) (f) . . . . . . . . . . . . . . . . . . . . . . . . . . . . 20,859,4891,497,179 Tidewater, Inc. (a)(f) . . . . . . . . . . . . . . . . . . . . . . . . . . . . . . . . . . . . . . . . . . . . . . . . . 51,293,352
817,293 Total S.A. (France) . . . . . . . . . . . . . . . . . . . . . . . . . . . . . . . . . . . . . . . . . . . . . . . . . . . 51,368,223
166,877,455
Retail & Restaurants - 0.75%971,150 Arcos Dorados Holdings, Inc., Class A (British Virgin Islands) . . . . . . 8,837,465
Transportation Infrastructure - 0.09%1,170,529 Santos Brasil Participacoes S.A. (Brazil) . . . . . . . . . . . . . . . . . . . . . . . . . . . . 1,115,999
Third Avenue TrustThird Avenue Value FundPortfolio of Investments (continued)at April 30, 2018 (Unaudited)
The accompanying notes are an integral part of the financial statements.
4

Shares Security†Value
(Note 1)
Common Stocks (continued)U.S. Homebuilder - 3.42%
589,518 Lennar Corp., Class A . . . . . . . . . . . . . . . . . . . . . . . . . . . . . . . . . . . . . . . . . . . . . . . $ 31,179,607217,844 Lennar Corp., Class B . . . . . . . . . . . . . . . . . . . . . . . . . . . . . . . . . . . . . . . . . . . . . . . 9,299,760
40,479,367
U.S. Real Estate Investment Trusts - 2.27%1,337,509 Forest City Realty Trust, Inc., Class A . . . . . . . . . . . . . . . . . . . . . . . . . . . . . . . 26,830,431
U.S. Real Estate Operating Companies - 2.79%1,354,821 Tejon Ranch Co. (a)(f) . . . . . . . . . . . . . . . . . . . . . . . . . . . . . . . . . . . . . . . . . . . . . . . 32,962,795
Total Common Stocks(Cost $778,463,579). . . . . . . . . . . . . . . . . . . . . . . . . . . . . . . . . . . . . . . . . . . . . . 995,600,999
Preferred Stocks - 0.00%*Consumer Products - 0.00%*
12,839,145 Home Products International, Inc., Series A, Convertible, 8.000%Cash or Payment-in-kind (a)(b)(c)(d)(f)(g) . . . . . . . . . . . . . . . . . . . . . . . 1
Total Preferred Stocks(Cost $0). . . . . . . . . . . . . . . . . . . . . . . . . . . . . . . . . . . . . . . . . . . . . . . . . . . . . . . . . . 1
PrincipalAmount($)
Short-Term Investments - 13.94%U.S. Government Obligations - 13.94%
165,000,000 U.S. Treasury Bills, 1.607% - 1.652%, due 5/3/18-5/24/18 (h) . . . . . 164,945,452
Total Short-Term Investments(Cost $164,945,452). . . . . . . . . . . . . . . . . . . . . . . . . . . . . . . . . . . . . . . . . . . . . . 164,945,452
Total Investment Portfolio - 98.61%(Cost $971,230,038). . . . . . . . . . . . . . . . . . . . . . . . . . . . . . . . . . . . . . . . . . . . . . 1,166,683,838
Other Assets less Liabilities - 1.39% . . . . . . . . . . . . . . . . . . . . . . . . . . . . . . 16,460,852
NET ASSETS - 100.00%. . . . . . . . . . . . . . . . . . . . . . . . . . . . . . . . . . . . . . . . . . . . . . $ 1,183,144,690
Third Avenue TrustThird Avenue Value FundPortfolio of Investments (continued)at April 30, 2018 (Unaudited)
The accompanying notes are an integral part of the financial statements.
5

Notes:(a) Affiliated issuers - An affiliated person as defined in the Investment Company Act of 1940, includes, among other things,
ownership of 5% or more of the outstanding voting securities of such person.(b) Fair-valued security.(c) Security subject to restrictions on resale.
Shares/Principal
Amount($) IssuerAcquisition
Date Cost
MarketValue
Per Unit
$11,361,970 Home Products International, Inc., 2nd Lien, 6.000%, due 12/20/22 3/16/07 - 10/2/17 $25,025,995 $28.94526,368 Home Products International, Inc. 5/30/07 54,667,471 0.001
12,839,145 Home Products International, Inc., Series A, Convertible Preferred Stock, 8.000% Cashor Payment-in-kind 3/16/07 - 10/2/17 — 0.001
1) Amount less than $0.01.At April 30, 2018, these restricted securities had a total market value of $3,288,138 or 0.28% of net assets.
(d) Security is valued using significant unobservable inputs and is classified as Level 3 in the fair value hierarchy.(e) Security is exempt from registration pursuant to Rule 144A under the Securities Act of 1933. This security may be resold
in transactions that are exempt from registration, normally to qualified institutional buyers.(f) Non-income producing security.(g) Payment-in-kind security. Income may be paid as additional securities or cash at the discretion of the issuer.(h) Annualized yield at date of purchase.† U.S. issuer unless otherwise noted.* Amount represents less than 0.01% of net assets.REIT: Real Estate Investment Trust.
Country Concentration% of
Net Assets
United States** 49.24%Canada 10.69Cayman Islands 9.37France 4.69Hong Kong 4.20Bermuda 4.06Sweden 3.23Netherlands 2.72Japan 2.20Switzerland 2.18Germany 2.18Norway 2.00British Virgin Islands 0.75Mexico 0.40Jersey 0.35Belgium 0.26Brazil 0.09
Total 98.61%
** Includes cash equivalents, classified as Short-Term Investments on the Portfolio of Investments.
Third Avenue TrustThird Avenue Value FundPortfolio of Investments (continued)at April 30, 2018 (Unaudited)
The accompanying notes are an integral part of the financial statements.
6

The summary of the Fund’s investments as of April 30, 2018 is as follows:
% of Net Assets
50 10 2015
Indu
stry
Bank & Thrifts
Industrial Services
Consulting and Information Technology Services
Oil & Gas Production & Services
Business Services
Insurance & Reinsurance
U.S. Government Obligations
Auto Parts and Services
U.S. Real Estate Operating Companies
Asset Management
Home Building
Financials
Metals Manufacturing
Healthcare
Conglomerates
Software and Services
General Building Contractors-Residential
Electronic Components
Industrial Equipment
Forest Products & Paper
Other
Other Assets less Liabilities
Third Avenue TrustThird Avenue Small-Cap Value FundIndustry Diversification(Unaudited)
7

Shares Security†Value
(Note 1)
Common Stocks - 93.76%Asset Management - 2.69%
187,411 Legg Mason, Inc. . . . . . . . . . . . . . . . . . . . . . . . . . . . . . . . . . . . . . . . . . . . . . . . . . . . . $ 7,440,217
Auto Parts and Services - 4.18%43,600 Dorman Products, Inc. (a) . . . . . . . . . . . . . . . . . . . . . . . . . . . . . . . . . . . . . . . . . . . 2,801,73646,947 Standard Motor Products, Inc. . . . . . . . . . . . . . . . . . . . . . . . . . . . . . . . . . . . . . . 2,129,04653,052 Visteon Corp. (a). . . . . . . . . . . . . . . . . . . . . . . . . . . . . . . . . . . . . . . . . . . . . . . . . . . . . 6,601,791
11,532,573
Bank & Thrifts - 16.41%344,815 Carter Bank & Trust (a) . . . . . . . . . . . . . . . . . . . . . . . . . . . . . . . . . . . . . . . . . . . . . . 6,041,159108,051 Commerce Bancshares, Inc. . . . . . . . . . . . . . . . . . . . . . . . . . . . . . . . . . . . . . . . . 6,863,39960,800 Cullen/Frost Bankers, Inc. . . . . . . . . . . . . . . . . . . . . . . . . . . . . . . . . . . . . . . . . . . . 6,958,560
103,872 Prosperity Bancshares, Inc. . . . . . . . . . . . . . . . . . . . . . . . . . . . . . . . . . . . . . . . . . 7,454,893198,385 Southside Bancshares, Inc. . . . . . . . . . . . . . . . . . . . . . . . . . . . . . . . . . . . . . . . . . 6,909,75081,391 UMB Financial Corp. . . . . . . . . . . . . . . . . . . . . . . . . . . . . . . . . . . . . . . . . . . . . . . . . 6,232,923
111,300 WesBanco, Inc. . . . . . . . . . . . . . . . . . . . . . . . . . . . . . . . . . . . . . . . . . . . . . . . . . . . . . . 4,874,940
45,335,624
Business Services - 6.54%125,500 Korn/Ferry International . . . . . . . . . . . . . . . . . . . . . . . . . . . . . . . . . . . . . . . . . . . . . 6,709,230166,523 SP Plus Corp. (a). . . . . . . . . . . . . . . . . . . . . . . . . . . . . . . . . . . . . . . . . . . . . . . . . . . . . 5,853,284108,235 Viad Corp. . . . . . . . . . . . . . . . . . . . . . . . . . . . . . . . . . . . . . . . . . . . . . . . . . . . . . . . . . . . 5,492,926
18,055,440
Conglomerates - 2.05%1,411 Seaboard Corp. . . . . . . . . . . . . . . . . . . . . . . . . . . . . . . . . . . . . . . . . . . . . . . . . . . . . . . 5,653,948
Consulting and Information Technology Services - 8.74%158,683 FTI Consulting, Inc. (a) . . . . . . . . . . . . . . . . . . . . . . . . . . . . . . . . . . . . . . . . . . . . . . 9,267,087162,066 Genpact, Ltd. (Bermuda) . . . . . . . . . . . . . . . . . . . . . . . . . . . . . . . . . . . . . . . . . . . . 5,168,285144,822 ICF International, Inc. . . . . . . . . . . . . . . . . . . . . . . . . . . . . . . . . . . . . . . . . . . . . . . . 9,717,556
24,152,928
Electronic Components - 1.90%147,700 Insight Enterprises, Inc. (a). . . . . . . . . . . . . . . . . . . . . . . . . . . . . . . . . . . . . . . . . . 5,235,965
Financials - 2.41%2,764,795 Westaim Corp. (The) (Canada) (a) . . . . . . . . . . . . . . . . . . . . . . . . . . . . . . . . . . . 6,653,854
Forest Products & Paper - 1.84%271,543 Interfor Corp. (Canada) (a) . . . . . . . . . . . . . . . . . . . . . . . . . . . . . . . . . . . . . . . . . . 5,077,883
General Building Contractors-Residential - 2.00%319,949 BMC Stock Holdings, Inc. (a) . . . . . . . . . . . . . . . . . . . . . . . . . . . . . . . . . . . . . . . . 5,519,120
Third Avenue TrustThird Avenue Small-Cap Value FundPortfolio of Investmentsat April 30, 2018 (Unaudited)
The accompanying notes are an integral part of the financial statements.
8

Shares Security†Value
(Note 1)
Common Stocks (continued)Healthcare - 2.12%
87,749 AMN Healthcare Services, Inc. (a) . . . . . . . . . . . . . . . . . . . . . . . . . . . . . . . . . . . $ 5,866,021
Home Building - 2.55%410,900 TRI Pointe Group, Inc. (a) . . . . . . . . . . . . . . . . . . . . . . . . . . . . . . . . . . . . . . . . . . . . 7,030,499
Industrial Equipment - 1.85%46,706 Alamo Group, Inc. . . . . . . . . . . . . . . . . . . . . . . . . . . . . . . . . . . . . . . . . . . . . . . . . . . . 5,112,906
Industrial Services - 16.17%134,697 Comfort Systems USA, Inc. . . . . . . . . . . . . . . . . . . . . . . . . . . . . . . . . . . . . . . . . . . 5,684,213132,204 Cubic Corp. . . . . . . . . . . . . . . . . . . . . . . . . . . . . . . . . . . . . . . . . . . . . . . . . . . . . . . . . . 8,163,597
82,107 EMCOR Group, Inc. . . . . . . . . . . . . . . . . . . . . . . . . . . . . . . . . . . . . . . . . . . . . . . . . . . 6,042,254241,920 Interface, Inc. . . . . . . . . . . . . . . . . . . . . . . . . . . . . . . . . . . . . . . . . . . . . . . . . . . . . . . . 5,322,240275,984 MYR Group, Inc. (a) . . . . . . . . . . . . . . . . . . . . . . . . . . . . . . . . . . . . . . . . . . . . . . . . . . 8,279,520131,444 Tetra Tech, Inc. . . . . . . . . . . . . . . . . . . . . . . . . . . . . . . . . . . . . . . . . . . . . . . . . . . . . . . 6,361,89029,910 UniFirst Corp. . . . . . . . . . . . . . . . . . . . . . . . . . . . . . . . . . . . . . . . . . . . . . . . . . . . . . . . 4,803,546
44,657,260
Insurance & Reinsurance - 6.05%393,969 Aspen Insurance Holdings, Ltd. (Bermuda) . . . . . . . . . . . . . . . . . . . . . . . . . 16,723,984
Metals Manufacturing - 2.24%62,678 Kaiser Aluminum Corp. . . . . . . . . . . . . . . . . . . . . . . . . . . . . . . . . . . . . . . . . . . . . . . 6,176,290
Oil & Gas Production & Services - 7.40%291,900 Seacor Marine Holdings, Inc. (a). . . . . . . . . . . . . . . . . . . . . . . . . . . . . . . . . . . . . 6,915,111
65,000 Seacor Marine Holdings, Inc. (a)(b)(c)(d) . . . . . . . . . . . . . . . . . . . . . . . . . . . . 1,519,814350,316 Tidewater, Inc. (a). . . . . . . . . . . . . . . . . . . . . . . . . . . . . . . . . . . . . . . . . . . . . . . . . . . . 12,001,826
20,436,751
Real Estate - 0.75%35,932 FRP Holdings, Inc. (a). . . . . . . . . . . . . . . . . . . . . . . . . . . . . . . . . . . . . . . . . . . . . . . . 2,066,090
Software and Services - 2.02%130,543 CSG Systems International, Inc. . . . . . . . . . . . . . . . . . . . . . . . . . . . . . . . . . . . . . 5,585,935
U.S. Real Estate Operating Companies - 3.85%140,451 Alico, Inc. . . . . . . . . . . . . . . . . . . . . . . . . . . . . . . . . . . . . . . . . . . . . . . . . . . . . . . . . . . . 4,536,567459,042 Five Point Holdings, LLC, Class A (a) . . . . . . . . . . . . . . . . . . . . . . . . . . . . . . . . 6,105,259
10,641,826
Total Common Stocks(Cost $178,516,804). . . . . . . . . . . . . . . . . . . . . . . . . . . . . . . . . . . . . . . . . . . . . . 258,955,114
Third Avenue TrustThird Avenue Small-Cap Value FundPortfolio of Investments (continued)at April 30, 2018 (Unaudited)
The accompanying notes are an integral part of the financial statements.
9

PrincipalAmount($) Security†
Value(Note 1)
Short-Term Investments - 5.43%U.S. Government Obligations - 5.43%
15,000,000 U.S. Treasury Bills, 1.607%, due 5/10/18 (e) . . . . . . . . . . . . . . . . . . . . . . . . $ 14,993,981
Total Short-Term Investments(Cost $14,993,981) . . . . . . . . . . . . . . . . . . . . . . . . . . . . . . . . . . . . . . . . . . . . . . . 14,993,981
Total Investment Portfolio - 99.19%(Cost $193,510,785). . . . . . . . . . . . . . . . . . . . . . . . . . . . . . . . . . . . . . . . . . . . . . 273,949,095
Other Assets less Liabilities - 0.81% . . . . . . . . . . . . . . . . . . . . . . . . . . . . . . 2,237,802
NET ASSETS - 100.00%. . . . . . . . . . . . . . . . . . . . . . . . . . . . . . . . . . . . . . . . . . . . . . $ 276,186,897Notes:(a) Non-income producing security.(b) Fair-valued security.(c) Security subject to restrictions on resale.
Shares IssuerAcquisition
Date Cost
MarketValue
Per Unit
65,000 Seacor Marine Holdings, Inc. 4/20/18 $1,300,000 $23.38At April 30, 2018, the restricted security had a total market value of $1,519,814 or 0.55% of net assets.
(d) Security is valued using significant unobservable inputs and is classified as Level 3 in the fair value hierarchy.(e) Annualized yield at date of purchase.† U.S. issuer unless otherwise noted.
Country Concentration% of
Net Assets
United States* 87.01%Bermuda 7.93Canada 4.25
Total 99.19%
* Includes cash equivalents, classified as Short-Term Investments on the Portfolio of Investments.
Third Avenue TrustThird Avenue Small-Cap Value FundPortfolio of Investments (continued)at April 30, 2018 (Unaudited)
The accompanying notes are an integral part of the financial statements.
10

The summary of the Fund’s investments as of April 30, 2018 is as follows:
% of Net Assets
100 20 30
Indu
stry
Non-U.S. Real Estate Operating Companies
U.S. Real Estate Investment Trusts
Non-U.S. Real Estate Investment Trusts
Forest Products & Paper
U.S. Real Estate Operating Companies
U.S. Homebuilder
Banks
U.S. Government Obligations
Retail-Building Products
Lodging & Hotels
Industrial Services
Non-U.S. Real Estate Consulting/Management
Retail-Department Stores
Other
Consulting/Management
Other Assets less Liabilities
Third Avenue TrustThird Avenue Real Estate Value FundIndustry Diversification(Unaudited)
11

PrincipalAmount‡ Security†
Value(Note 1)
Term Loans - 0.46%Non-U.S. Real Estate Operating Companies - 0.00%*
36,644 EUR Concrete Investment II, L.P. S.A.R.L., Term Loan, Tranche A2,2.000% Cash or Payment-in-kind Interest,due 10/31/18 (Luxembourg)(a)(b)(c)(d) . . . . . . . . . . . . . . . . . . . . . . . . . . $ —
Retail-Department Stores - 0.46%9,871,134 Neiman Marcus Group Ltd. LLC, 1st Lien Term Loan, 5.141% (USD
3 Month LIBOR + 3.250%), due 10/25/20 (c) . . . . . . . . . . . . . . . . . . . . 8,707,752
Total Term Loans(Cost $8,528,344) . . . . . . . . . . . . . . . . . . . . . . . . . . . . . . . . . . . . . . . . . . . . . . . . 8,707,752
Shares
Common Stocks & Warrants - 91.78%Banks - 5.28%
896,250 PNC Financial Services Group, Inc., Warrants, expire 12/31/18 (e) . . 71,753,775520,400 Zions Bancorporation . . . . . . . . . . . . . . . . . . . . . . . . . . . . . . . . . . . . . . . . . . . . . . . 28,491,900
100,245,675
Consulting/Management - 0.97%501,745 FNF Group . . . . . . . . . . . . . . . . . . . . . . . . . . . . . . . . . . . . . . . . . . . . . . . . . . . . . . . . . . . 18,479,268
Forest Products & Paper - 10.62%2,548,003 Rayonier, Inc., REIT . . . . . . . . . . . . . . . . . . . . . . . . . . . . . . . . . . . . . . . . . . . . . . . . . . 94,760,2312,906,815 Weyerhaeuser Co., REIT . . . . . . . . . . . . . . . . . . . . . . . . . . . . . . . . . . . . . . . . . . . . . 106,912,656
201,672,887
Industrial Services - 1.44%80,699 AMERCO . . . . . . . . . . . . . . . . . . . . . . . . . . . . . . . . . . . . . . . . . . . . . . . . . . . . . . . . . . . . . 27,237,527
Lodging & Hotels - 1.81%4,384,514 Millennium & Copthorne Hotels PLC (United Kingdom) . . . . . . . . . . . . . 34,406,335
Non-U.S. Real Estate Consulting/Management - 1.05%1,483,350 Savills PLC (United Kingdom) . . . . . . . . . . . . . . . . . . . . . . . . . . . . . . . . . . . . . . . 19,984,478
Non-U.S. Real Estate Investment Trusts - 11.64%7,779,226 Hammerson PLC (United Kingdom) . . . . . . . . . . . . . . . . . . . . . . . . . . . . . . . . . 58,643,2646,580,499 Land Securities Group PLC (United Kingdom) . . . . . . . . . . . . . . . . . . . . . . . 89,332,0978,246,476 Segro PLC (United Kingdom) . . . . . . . . . . . . . . . . . . . . . . . . . . . . . . . . . . . . . . . . 73,177,725
221,153,086
Non-U.S. Real Estate Operating Companies - 26.42%2,077,489 Brookfield Asset Management, Inc., Class A (Canada) . . . . . . . . . . . . . . 82,351,664
10,146,334 Capital & Counties Properties PLC (United Kingdom) . . . . . . . . . . . . . . . 40,157,354
Third Avenue TrustThird Avenue Real Estate Value FundPortfolio of Investmentsat April 30, 2018 (Unaudited)
The accompanying notes are an integral part of the financial statements.
12

Shares Security†Value
(Note 1)
Common Stocks & Warrants (continued)Non-U.S. Real Estate Operating Companies (continued)
5,367,350 City Developments, Ltd. (Singapore) . . . . . . . . . . . . . . . . . . . . . . . . . . . . . . . . $ 51,005,40913,433,000 CK Asset Holdings, Ltd. (Cayman Islands) . . . . . . . . . . . . . . . . . . . . . . . . . . 115,966,64013,603,077 Henderson Land Development Co., Ltd. (Hong Kong) . . . . . . . . . . . . . . . . 86,251,037
2,418,000 Sun Hung Kai Properties, Ltd. (Hong Kong) . . . . . . . . . . . . . . . . . . . . . . . . . 38,940,5463,428,660 Wharf Holdings Ltd. (The) (Hong Kong) . . . . . . . . . . . . . . . . . . . . . . . . . . . . . 11,406,660
10,203,500 Wheelock & Co., Ltd. (Hong Kong) . . . . . . . . . . . . . . . . . . . . . . . . . . . . . . . . . . . 75,701,943
501,781,253
Retail-Building Products - 1.92%442,930 Lowe’s Cos., Inc. . . . . . . . . . . . . . . . . . . . . . . . . . . . . . . . . . . . . . . . . . . . . . . . . . . . . 36,510,720
U.S. Homebuilder - 5.38%1,773,764 Lennar Corp., Class A . . . . . . . . . . . . . . . . . . . . . . . . . . . . . . . . . . . . . . . . . . . . . . . 93,814,378
195,805 Lennar Corp., Class B . . . . . . . . . . . . . . . . . . . . . . . . . . . . . . . . . . . . . . . . . . . . . . . 8,358,915
102,173,293
U.S. Real Estate Investment Trusts - 17.86%1,686,478 Acadia Realty Trust . . . . . . . . . . . . . . . . . . . . . . . . . . . . . . . . . . . . . . . . . . . . . . . . . 39,800,8811,574,413 First Industrial Realty Trust, Inc. . . . . . . . . . . . . . . . . . . . . . . . . . . . . . . . . . . . . 48,979,9884,659,127 Forest City Realty Trust, Inc., Class A . . . . . . . . . . . . . . . . . . . . . . . . . . . . . . . 93,462,088
297,747 JBG SMITH Properties . . . . . . . . . . . . . . . . . . . . . . . . . . . . . . . . . . . . . . . . . . . . . . . 10,977,9321,459,512 Macerich Co. (The) . . . . . . . . . . . . . . . . . . . . . . . . . . . . . . . . . . . . . . . . . . . . . . . . . . 84,097,081
269,300 Seritage Growth Properties, Class A . . . . . . . . . . . . . . . . . . . . . . . . . . . . . . . . . 9,579,001769,363 Vornado Realty Trust . . . . . . . . . . . . . . . . . . . . . . . . . . . . . . . . . . . . . . . . . . . . . . . . 52,339,765
339,236,736
U.S. Real Estate Operating Companies - 7.39%1,712,857 Five Point Holdings, LLC, Class A (e) . . . . . . . . . . . . . . . . . . . . . . . . . . . . . . . . 22,780,9984,557,222 Five Point Holdings, LLC, Class A (a)(d)(e)(f) . . . . . . . . . . . . . . . . . . . . . . . . 60,266,2081,129,952 Tejon Ranch Co. (e) . . . . . . . . . . . . . . . . . . . . . . . . . . . . . . . . . . . . . . . . . . . . . . . . . . 27,491,7324,556,286 Trinity Place Holdings, Inc. (e)(f)(g). . . . . . . . . . . . . . . . . . . . . . . . . . . . . . . . . . 29,843,667
140,382,605
Total Common Stocks & Warrants(Cost $1,128,795,132). . . . . . . . . . . . . . . . . . . . . . . . . . . . . . . . . . . . . . . . . . . . 1,743,263,863
Purchased Options - 0.05%Total Purchased Options (see below for details)
(Cost $965,049) . . . . . . . . . . . . . . . . . . . . . . . . . . . . . . . . . . . . . . . . . . . . . . . . . . 1,019,221
Third Avenue TrustThird Avenue Real Estate Value FundPortfolio of Investments (continued)at April 30, 2018 (Unaudited)
The accompanying notes are an integral part of the financial statements.
13
PrincipalAmount($) Security
Value(Note 1)
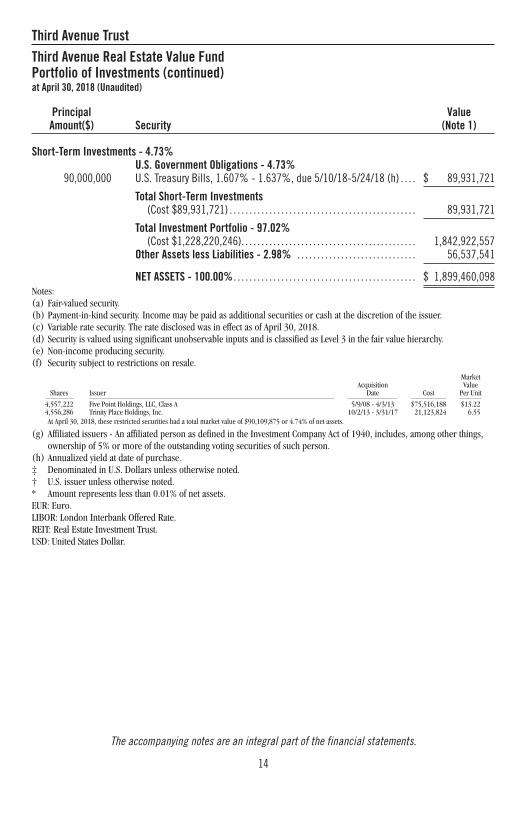
Short-Term Investments - 4.73%U.S. Government Obligations - 4.73%
90,000,000 U.S. Treasury Bills, 1.607% - 1.637%, due 5/10/18-5/24/18 (h) . . . . $ 89,931,721
Total Short-Term Investments(Cost $89,931,721) . . . . . . . . . . . . . . . . . . . . . . . . . . . . . . . . . . . . . . . . . . . . . . . 89,931,721
Total Investment Portfolio - 97.02%(Cost $1,228,220,246). . . . . . . . . . . . . . . . . . . . . . . . . . . . . . . . . . . . . . . . . . . . 1,842,922,557
Other Assets less Liabilities - 2.98% . . . . . . . . . . . . . . . . . . . . . . . . . . . . . . 56,537,541
NET ASSETS - 100.00%. . . . . . . . . . . . . . . . . . . . . . . . . . . . . . . . . . . . . . . . . . . . . . $ 1,899,460,098Notes:(a) Fair-valued security.(b) Payment-in-kind security. Income may be paid as additional securities or cash at the discretion of the issuer.(c) Variable rate security. The rate disclosed was in effect as of April 30, 2018.(d) Security is valued using significant unobservable inputs and is classified as Level 3 in the fair value hierarchy.(e) Non-income producing security.(f) Security subject to restrictions on resale.
Shares IssuerAcquisition
Date Cost
MarketValue
Per Unit
4,557,222 Five Point Holdings, LLC, Class A 5/9/08 - 4/3/13 $75,516,188 $13.224,556,286 Trinity Place Holdings, Inc. 10/2/13 - 3/31/17 21,123,824 6.55At April 30, 2018, these restricted securities had a total market value of $90,109,875 or 4.74% of net assets.
(g) Affiliated issuers - An affiliated person as defined in the Investment Company Act of 1940, includes, among other things,ownership of 5% or more of the outstanding voting securities of such person.
(h) Annualized yield at date of purchase.‡ Denominated in U.S. Dollars unless otherwise noted.† U.S. issuer unless otherwise noted.* Amount represents less than 0.01% of net assets.EUR: Euro.LIBOR: London Interbank Offered Rate.REIT: Real Estate Investment Trust.USD: United States Dollar.
Third Avenue TrustThird Avenue Real Estate Value FundPortfolio of Investments (continued)at April 30, 2018 (Unaudited)
The accompanying notes are an integral part of the financial statements.
14

Country Concentration% of
Net Assets
United States** 56.10%United Kingdom 16.62Hong Kong 11.18Cayman Islands 6.10Canada 4.34Singapore 2.68Luxembourg* 0.00
Total 97.02%
** Includes cash equivalents, classified as Short-Term Investments on the Portfolio of Investments.* Amount represents less than 0.01% of net assets.
Purchased Options
Description CounterpartyNumber ofContracts
NotionalAmount
ExercisePrice
ExpirationDate Value
JBG SMITHProperties, Call
GoldmanSachs & Co. 2,780 $10,249,860 36.50 USD 07/20/18 $479,046
JBG SMITHProperties, Call
GoldmanSachs & Co. 3,720 13,715,640 37.00 USD 07/20/18 540,175
U.S. Currency,Call
JPMorganChase Bank, N.A. 300,000,000 300,000,000 8.18 HKD 08/15/18 —
Total Purchased Options(Cost $965,049) $1,019,221
USD: United States Dollar.HKD: Hong Kong Dollar.
Third Avenue TrustThird Avenue Real Estate Value FundPortfolio of Investments (continued)at April 30, 2018 (Unaudited)
The accompanying notes are an integral part of the financial statements.
15

Written Options
Description CounterpartyNumber ofContracts
NotionalAmount
ExercisePrice
ExpirationDate Value
JBG SMITHProperties, Put
GoldmanSachs & Co. (2,780) $10,249,860 30.50 USD 07/20/18 $(65,608)
JBG SMITHProperties, Put
GoldmanSachs & Co. (3,720) 13,715,640 31.00 USD 07/20/18 (97,270)
Total Written Options(Premiums received $(574,271)) $(162,878)
USD: United States Dollar.
Third Avenue TrustThird Avenue Real Estate Value FundPortfolio of Investments (continued)at April 30, 2018 (Unaudited)
The accompanying notes are an integral part of the financial statements.
16

Value FundSmall-CapValue Fund
Real EstateValue Fund
Assets:Investments at value (Notes 1 and 4):
Unaffiliated issuers†. . . . . . . . . . . . . . . . . . . . . . . . . . . . . . . . . . . . . . . . . . . $1,079,139,553 $273,949,095 $1,812,059,669Affiliated issuers‡ . . . . . . . . . . . . . . . . . . . . . . . . . . . . . . . . . . . . . . . . . . . . . 87,544,285 — 29,843,667
Cash . . . . . . . . . . . . . . . . . . . . . . . . . . . . . . . . . . . . . . . . . . . . . . . . . . . . . . . . . . . . 15,493,831 3,228,618 54,474,557Dividends and interest receivable. . . . . . . . . . . . . . . . . . . . . . . . . . . . . . . . . . 2,707,503 384,733 3,410,264Receivable for securities sold . . . . . . . . . . . . . . . . . . . . . . . . . . . . . . . . . . . . . 1,180,837 — —Receivable for fund shares sold . . . . . . . . . . . . . . . . . . . . . . . . . . . . . . . . . . . 50,100 4,043 1,697,323Foreign currency at value^. . . . . . . . . . . . . . . . . . . . . . . . . . . . . . . . . . . . . . . . — — 294Purchased options at value* . . . . . . . . . . . . . . . . . . . . . . . . . . . . . . . . . . . . . . — — 1,019,221Other assets . . . . . . . . . . . . . . . . . . . . . . . . . . . . . . . . . . . . . . . . . . . . . . . . . . . . . 107,232 51,838 110,285
Total assets . . . . . . . . . . . . . . . . . . . . . . . . . . . . . . . . . . . . . . . . . . . . . . . . 1,186,223,341 277,618,327 1,902,615,280
Liabilities:Written options at value** . . . . . . . . . . . . . . . . . . . . . . . . . . . . . . . . . . . . . . . . — — 162,878Payable for securities purchased . . . . . . . . . . . . . . . . . . . . . . . . . . . . . . . . . . — 790,713 —Payable for fund shares redeemed . . . . . . . . . . . . . . . . . . . . . . . . . . . . . . . . . 1,130,901 270,430 854,646Payable to Adviser (Note 3). . . . . . . . . . . . . . . . . . . . . . . . . . . . . . . . . . . . . . . . 983,950 210,457 1,623,749Payable for shareholder servicing fees (Note 3) . . . . . . . . . . . . . . . . . . . . . 104,811 31,162 225,119Distribution fees payable (Note 5) . . . . . . . . . . . . . . . . . . . . . . . . . . . . . . . . . 3,259 878 49,742Payables to Trustees and officers . . . . . . . . . . . . . . . . . . . . . . . . . . . . . . . . . . 11,387 2,919 11,353Accrued expenses . . . . . . . . . . . . . . . . . . . . . . . . . . . . . . . . . . . . . . . . . . . . . . . . 394,152 124,871 227,695Taxes payable . . . . . . . . . . . . . . . . . . . . . . . . . . . . . . . . . . . . . . . . . . . . . . . . . . . . 450,191 — —
Total liabilities. . . . . . . . . . . . . . . . . . . . . . . . . . . . . . . . . . . . . . . . . . . . . . 3,078,651 1,431,430 3,155,182
Net assets. . . . . . . . . . . . . . . . . . . . . . . . . . . . . . . . . . . . . . . . . . . . . . . . . . $1,183,144,690 $276,186,897 $1,899,460,098
Third Avenue TrustStatement of Assets and Liabilitiesat April 30, 2018 (Unaudited)
The accompanying notes are an integral part of the financial statements.
17
Value FundSmall-CapValue Fund
Real EstateValue Fund
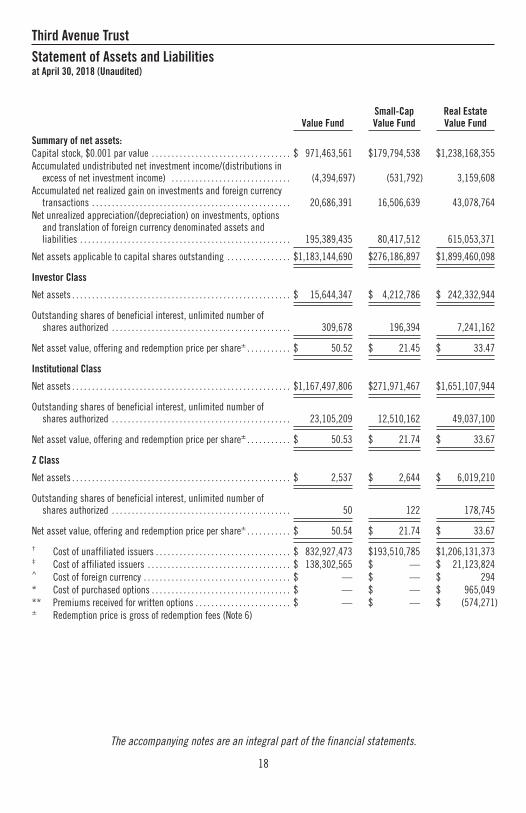
Summary of net assets:Capital stock, $0.001 par value . . . . . . . . . . . . . . . . . . . . . . . . . . . . . . . . . . . $ 971,463,561 $179,794,538 $1,238,168,355Accumulated undistributed net investment income/(distributions in
excess of net investment income) . . . . . . . . . . . . . . . . . . . . . . . . . . . . . . (4,394,697) (531,792) 3,159,608Accumulated net realized gain on investments and foreign currency
transactions . . . . . . . . . . . . . . . . . . . . . . . . . . . . . . . . . . . . . . . . . . . . . . . . . . 20,686,391 16,506,639 43,078,764Net unrealized appreciation/(depreciation) on investments, options
and translation of foreign currency denominated assets andliabilities . . . . . . . . . . . . . . . . . . . . . . . . . . . . . . . . . . . . . . . . . . . . . . . . . . . . . 195,389,435 80,417,512 615,053,371
Net assets applicable to capital shares outstanding . . . . . . . . . . . . . . . . $1,183,144,690 $276,186,897 $1,899,460,098
Investor Class
Net assets . . . . . . . . . . . . . . . . . . . . . . . . . . . . . . . . . . . . . . . . . . . . . . . . . . . . . . . $ 15,644,347 $ 4,212,786 $ 242,332,944
Outstanding shares of beneficial interest, unlimited number ofshares authorized . . . . . . . . . . . . . . . . . . . . . . . . . . . . . . . . . . . . . . . . . . . . . 309,678 196,394 7,241,162
Net asset value, offering and redemption price per share± . . . . . . . . . . . $ 50.52 $ 21.45 $ 33.47
Institutional Class
Net assets . . . . . . . . . . . . . . . . . . . . . . . . . . . . . . . . . . . . . . . . . . . . . . . . . . . . . . . $1,167,497,806 $271,971,467 $1,651,107,944
Outstanding shares of beneficial interest, unlimited number ofshares authorized . . . . . . . . . . . . . . . . . . . . . . . . . . . . . . . . . . . . . . . . . . . . . 23,105,209 12,510,162 49,037,100
Net asset value, offering and redemption price per share± . . . . . . . . . . . $ 50.53 $ 21.74 $ 33.67
Z Class
Net assets . . . . . . . . . . . . . . . . . . . . . . . . . . . . . . . . . . . . . . . . . . . . . . . . . . . . . . . $ 2,537 $ 2,644 $ 6,019,210
Outstanding shares of beneficial interest, unlimited number ofshares authorized . . . . . . . . . . . . . . . . . . . . . . . . . . . . . . . . . . . . . . . . . . . . . 50 122 178,745
Net asset value, offering and redemption price per share± . . . . . . . . . . . $ 50.54 $ 21.74 $ 33.67
† Cost of unaffiliated issuers . . . . . . . . . . . . . . . . . . . . . . . . . . . . . . . . . . $ 832,927,473 $193,510,785 $1,206,131,373‡ Cost of affiliated issuers . . . . . . . . . . . . . . . . . . . . . . . . . . . . . . . . . . . . $ 138,302,565 $ — $ 21,123,824^ Cost of foreign currency . . . . . . . . . . . . . . . . . . . . . . . . . . . . . . . . . . . . . $ — $ — $ 294* Cost of purchased options . . . . . . . . . . . . . . . . . . . . . . . . . . . . . . . . . . . $ — $ — $ 965,049** Premiums received for written options . . . . . . . . . . . . . . . . . . . . . . . . $ — $ — $ (574,271)± Redemption price is gross of redemption fees (Note 6)
Third Avenue TrustStatement of Assets and Liabilitiesat April 30, 2018 (Unaudited)
The accompanying notes are an integral part of the financial statements.
18

Value Fund Small-Cap Value Fund Real Estate Value FundInvestment Income:
Dividends - unaffiliated issuers* . . . . . . . . . . . . . . . . . . $ 16,243,739 $ 971,615 $12,674,624Interest - unaffiliated issuers . . . . . . . . . . . . . . . . . . . . . 1,077,453 112,021 1,666,308Interest - affiliated issuers (Note 4). . . . . . . . . . . . . . . . 282,484 — —Other income . . . . . . . . . . . . . . . . . . . . . . . . . . . . . . . . . . . . 24,563 2,959 217,165
Total investment income . . . . . . . . . . . . . . . . . . . . . . . 17,628,239 1,086,595 14,558,097Expenses:
Investment advisory fees (Note 3). . . . . . . . . . . . . . . . . . 5,105,697 1,262,336 8,689,287Shareholder servicing fees (Note 3) . . . . . . . . . . . . . . . . 534,557 146,731 1,041,118Auditing and tax fees . . . . . . . . . . . . . . . . . . . . . . . . . . . . . 78,469 42,463 51,266Transfer agent fees. . . . . . . . . . . . . . . . . . . . . . . . . . . . . . . 275,611 109,847 152,216Reports to shareholders. . . . . . . . . . . . . . . . . . . . . . . . . . . 42,314 11,965 60,485Accounting fees . . . . . . . . . . . . . . . . . . . . . . . . . . . . . . . . . . 73,081 27,540 95,104Administration fees (Note 3) . . . . . . . . . . . . . . . . . . . . . . 31,202 7,714 53,101Custodian fees. . . . . . . . . . . . . . . . . . . . . . . . . . . . . . . . . . . 43,987 4,176 90,068Trustees’ and officers’ fees and expenses . . . . . . . . . . 156,899 39,948 250,893Insurance . . . . . . . . . . . . . . . . . . . . . . . . . . . . . . . . . . . . . . . 38,563 9,971 63,788Legal fees . . . . . . . . . . . . . . . . . . . . . . . . . . . . . . . . . . . . . . . 121,440 20,900 146,780Distribution fees (Note 5) . . . . . . . . . . . . . . . . . . . . . . . . . 16,004 5,403 308,099Registration and filing fees . . . . . . . . . . . . . . . . . . . . . . . 14,623 11,879 24,110Miscellaneous . . . . . . . . . . . . . . . . . . . . . . . . . . . . . . . . . . . 27,029 6,764 42,364
Total expenses. . . . . . . . . . . . . . . . . . . . . . . . . . . . . . . . . 6,559,476 1,707,637 11,068,679Less: Fees waived/expenses reimbursed (Note 3) . (9,590) (87,478) —
Expenses reduced by custodian fee expenseoffset arrangement (Note 3) . . . . . . . . . . . . (9,936) (1,772) (14,261)
Net expenses . . . . . . . . . . . . . . . . . . . . . . . . . . . . . . . 6,539,950 1,618,387 11,054,418Net investment income/(loss) . . . . . . . . . . . . . . . . . . . 11,088,289 (531,792) 3,503,679
Realized and unrealized gain/(loss) on investments,options, and foreign currency transactions:Net realized gain on investments - unaffiliated
issuers . . . . . . . . . . . . . . . . . . . . . . . . . . . . . . . . . . . . . . . 91,509,393 17,322,525 48,137,650Net realized gain on investments - affiliated issuers
(Note 4). . . . . . . . . . . . . . . . . . . . . . . . . . . . . . . . . . . . . . . 24,424 — —Net realized loss on foreign currency transactions . . . (73,790) (643) (21,625)Net change in unrealized
appreciation/(depreciation) on investments -unaffiliated issuers . . . . . . . . . . . . . . . . . . . . . . . . . . . . (73,840,584) (3,676,665) 19,111,293
Net change in unrealizedappreciation/(depreciation) on investments -affiliated issuers (Note 4) . . . . . . . . . . . . . . . . . . . . . . 15,734,786 — (2,961,585)
Net change in unrealized appreciation on purchasedoptions . . . . . . . . . . . . . . . . . . . . . . . . . . . . . . . . . . . . . . . — — 455,422
Net change in unrealized appreciation on writtenoptions . . . . . . . . . . . . . . . . . . . . . . . . . . . . . . . . . . . . . . . — — 411,393
Third Avenue TrustStatement of OperationsFor the Six Months Ended April 30, 2018 (Unaudited)
The accompanying notes are an integral part of the financial statements.
19

Value Fund Small-Cap Value Fund Real Estate Value FundNet change in unrealized
appreciation/(depreciation) on translation ofother assets and liabilities denominated inforeign currency . . . . . . . . . . . . . . . . . . . . . . . . . . . . . . . $ (52,074) $ 12,400 $ (37,983)
Net gain on investments, options, and foreigncurrency transactions. . . . . . . . . . . . . . . . . . . . . 33,302,155 13,657,617 65,094,565
Net increase in net assets resulting from operations . $44,390,444 $13,125,825 $68,598,244
* Net of foreign withholding taxes of . . . . . . . . . . . . . . $ 410,058 $ — $ 534,847
Third Avenue TrustStatement of OperationsFor the Six Months Ended April 30, 2018 (Unaudited)
The accompanying notes are an integral part of the financial statements.
20

Value Fund Small-Cap Value Fund
For theSix Months Ended
April 30, 2018(Unaudited)
For the YearEnded
October 31, 2017
For theSix Months Ended
April 30, 2018(Unaudited)
For the YearEnded
October 31, 2017
Operations:Net investment income/(loss) . . . . . . $ 11,088,289 $ 2,726,305 $ (531,792) $ (1,706,354)Net realized gain . . . . . . . . . . . . . . . . . . 91,460,027 56,823,940 17,321,882 37,910,643Net change in unrealized
appreciation/(depreciation). . . . . . (58,157,872) 139,257,917 (3,664,265) 25,666,208
Net increase in net assets resultingfrom operations . . . . . . . . . . . . . . . . 44,390,444 198,808,162 13,125,825 61,870,497
Dividends and Distributions toShareholders from:Net investment income:
Investor Class . . . . . . . . . . . . . . . . . . (303,182) (80,506) — (14,608)Institutional Class . . . . . . . . . . . . . . (31,861,539) (9,820,946) — (1,692,492)
Net realized gains:Investor Class . . . . . . . . . . . . . . . . . . (1,284,139) (992,772) (531,795) (418,302)Institutional Class . . . . . . . . . . . . . . (121,053,241) (81,010,259) (34,224,758) (24,923,360)Z Class . . . . . . . . . . . . . . . . . . . . . . . . (162) — — —
Decrease in net assets fromdividends and distributions . . . . . (154,502,263) (91,904,483) (34,756,553) (27,048,762)
Capital Share Transactions:Proceeds from sale of shares . . . . . . . 10,043,885 22,590,057 3,559,170 6,636,283Net asset value of shares issued in
reinvestment of dividends anddistributions . . . . . . . . . . . . . . . . . . . 148,637,677 88,658,512 33,792,639 26,461,605
Redemption fees . . . . . . . . . . . . . . . . . . 1,659 5,237 552 1,921Cost of shares redeemed . . . . . . . . . . . (135,069,626) (230,652,894) (35,658,026) (69,109,275)Net asset value of shares acquired
in reorganization (Note 10) . . . . . . 125,474,722 — — —
Net increase/(decrease) in netassets resulting from capitalshare transactions. . . . . . . . . . . . . . 149,088,317 (119,399,088) 1,694,335 (36,009,466)
Net increase/(decrease) in netassets . . . . . . . . . . . . . . . . . . . . . . . . . 38,976,498 (12,495,409) (19,936,393) (1,187,731)
Net assets at beginning of period . . . 1,144,168,192 1,156,663,601 296,123,290 297,311,021
Net assets at end of period* . . . . . . . $1,183,144,690 $1,144,168,192 $276,186,897 $296,123,290
* Including accumulatedundistributed net investmentincome/ (distributions in excessof net investment income) of . . . . $ (4,394,697) $ 16,681,735 $ (531,792) $ —
Third Avenue TrustStatement of Changes in Net Assets
The accompanying notes are an integral part of the financial statements.
21

Real Estate Value Fund
For theSix Months Ended
April 30, 2018(Unaudited)
For the YearEnded
October 31, 2017
Operations:Net investment income . . . . . . . . . . . . . . . . . . . . . . . . . . . . . . . . . . . . . . . . . . . . . . . . . . . . . . $ 3,503,679 $ 14,320,665Net realized gain . . . . . . . . . . . . . . . . . . . . . . . . . . . . . . . . . . . . . . . . . . . . . . . . . . . . . . . . . . . 48,116,025 109,575,741Net change in unrealized appreciation/(depreciation) . . . . . . . . . . . . . . . . . . . . . . . . . . 16,978,540 183,153,378
Net increase in net assets resulting from operations . . . . . . . . . . . . . . . . . . . . . . . . . . . 68,598,244 307,049,784
Dividends and Distributions to Shareholders from:Net investment income:
Investor Class . . . . . . . . . . . . . . . . . . . . . . . . . . . . . . . . . . . . . . . . . . . . . . . . . . . . . . . . . . . (1,917,711) (1,265,619)Institutional Class . . . . . . . . . . . . . . . . . . . . . . . . . . . . . . . . . . . . . . . . . . . . . . . . . . . . . . . (17,522,365) (12,800,132)
Net realized gains:Investor Class . . . . . . . . . . . . . . . . . . . . . . . . . . . . . . . . . . . . . . . . . . . . . . . . . . . . . . . . . . . (12,415,464) (2,200,063)Institutional Class . . . . . . . . . . . . . . . . . . . . . . . . . . . . . . . . . . . . . . . . . . . . . . . . . . . . . . . (85,737,707) (14,239,140)
Decrease in net assets from dividends and distributions . . . . . . . . . . . . . . . . . . . . . . . (117,593,247) (30,504,954)
Capital Share Transactions:Proceeds from sale of shares . . . . . . . . . . . . . . . . . . . . . . . . . . . . . . . . . . . . . . . . . . . . . . . . 181,192,986 292,867,062Net asset value of shares issued in reinvestment of dividends and distributions . 111,488,847 28,821,858Redemption fees. . . . . . . . . . . . . . . . . . . . . . . . . . . . . . . . . . . . . . . . . . . . . . . . . . . . . . . . . . . . 31,678 28,310Cost of shares redeemed . . . . . . . . . . . . . . . . . . . . . . . . . . . . . . . . . . . . . . . . . . . . . . . . . . . . (289,851,796) (493,057,650)
Net increase/(decrease) in net assets resulting from capital share transactions. . 2,861,715 (171,340,420)
Net increase/(decrease) in net assets . . . . . . . . . . . . . . . . . . . . . . . . . . . . . . . . . . . . . . . . (46,133,288) 105,204,410
Net assets at beginning of period . . . . . . . . . . . . . . . . . . . . . . . . . . . . . . . . . . . . . . . . . . . . 1,945,593,386 1,840,388,976
Net assets at end of period* . . . . . . . . . . . . . . . . . . . . . . . . . . . . . . . . . . . . . . . . . . . . . . . . . $1,899,460,098 $1,945,593,386
* Including accumulated undistributed net investment income of. . . . . . . . . . . . . . . $ 3,159,608 $ 19,096,005
Third Avenue TrustStatement of Changes in Net Assets
The accompanying notes are an integral part of the financial statements.
22

Third Avenue Value FundFor The Six
Months EndedApril 30, Years Ended October 31,
2018 2017 2016 2015 2014 2013(Unaudited)
Investor Class:Net asset value, beginning of period . . . . . $ 55.94 $ 51.12 $ 54.22 $ 59.54 $ 57.73 $ 48.47Income/(loss) from investment
operations:Net investment income/(loss)@ . . . . . . . 0.50 (0.01) 0.41‡ 0.29 1.39± 0.61**
Net gain/(loss) on investmenttransactions(both realized and unrealized)1 . . . . . 1.60 8.83 0.38 (2.46) 2.22 9.89
Total from investment operations. . . . . . 2.10 8.82 0.79 (2.17) 3.61 10.50Less dividends and distributions to
shareholders:Dividends from net investment income. (1.45) (0.30) (0.61) (2.09) (1.80) (1.24)Distributions from net realized gain . . . (6.07) (3.70) (3.28) (1.06) — —Total dividends and distributions. . . . . . (7.52) (4.00) (3.89) (3.15) (1.80) (1.24)
Net asset value, end of period . . . . . . . . . . . $ 50.52 $ 55.94 $ 51.12 $ 54.22 $ 59.54 $ 57.73
Total return2 . . . . . . . . . . . . . . . . . . . . . . . . . . 3.88%3 18.05% 1.74% (3.90%) 6.45% 22.07%Ratios/Supplemental Data:
Net assets, end of period (inthousands) . . . . . . . . . . . . . . . . . . . . . . $15,644 $12,680 $14,415 $28,963 $33,936 $36,811
Ratio of expenses to average netassetsBefore fee waivers/expense
reimbursements/expense offsetarrangement/recovery . . . . . . . . . . 1.42%4 1.38% 1.40% 1.34% 1.33% 1.35%
After fee waivers/expensereimbursements/expense offsetarrangement/recovery5 . . . . . . . . . 1.40%4,# 1.38% 1.39% 1.34% 1.32% 1.35%†
Ratio of net investment income/(loss)to average net assets . . . . . . . . . . . . . 1.87%4 (0.02%) 0.83%‡ 0.52% 2.36%± 1.15%**
Portfolio turnover rate . . . . . . . . . . . . . . . 31%3 18% 17% 24% 31% 21%
Third Avenue TrustFinancial HighlightsSelected data (for a share outstanding throughout each period) and ratios are as follows:
The accompanying notes are an integral part of the financial statements.
23

1 Includes redemption fees of less than $0.01 per share.2 Performance figures may reflect fee waivers, expense reimbursements, expense offset arrangement and/or recovery of
previously waived fees. Past performance is no guarantee of future results. Total return would have been lower in certainperiods if the Adviser had not waived certain fees or reimbursed certain expenses. Conversely, total return would havebeen higher in certain periods if the Adviser had not recovered previously waived fees or reimbursed expenses. Totalreturn is calculated assuming an initial investment made at the net asset value at the beginning of the period, reinvestmentof all dividends and distributions at net asset value during the period and redemption on the last day of the period and isnot annualized.
3 Not annualized.4 Annualized.5 As a result of an expense limitation, the ratio of expenses (exclusive of taxes, interest, brokerage commissions, acquired
fund fees and expenses, and extraordinary items) to average net assets will not exceed 1.40%.@ Calculated based on the average number of shares outstanding during the period.‡ Investment income per share reflects a special dividend received during the period which amounted to $0.19 per share.
Excluding the special dividend, the ratio of net investment income to average net assets would have been 0.43%.± Investment income per share reflects special dividends received during the period which amounted to $0.41 per share.
Excluding the special dividends, the ratio of net investment income to average net assets would have been 1.67%.** Investment income per share reflects a special dividend received during the period which amounted to $0.44 per share.
Excluding the special dividend, the ratio of net investment income to average net assets would have been 0.33%.# Reflects fee waivers and/or expense reimbursements.† The Adviser recovered a portion of its previously waived fees.
Third Avenue TrustFinancial HighlightsSelected data (for a share outstanding throughout each period) and ratios are as follows:
The accompanying notes are an integral part of the financial statements.
24

Third Avenue Value FundFor The Six
Months EndedApril 30, Years Ended October 31,
2018 2017 2016 2015 2014 2013(Unaudited)
Institutional Class:Net asset value, beginning of period . . . . . $ 56.05 $ 51.22 $ 54.35 $ 59.69 $ 57.86 $ 48.53Income/(loss) from investment
operations:Net investment income@ . . . . . . . . . . . . . 0.52 0.13 0.57‡ 0.43 1.53± 0.77**
Net gain/(loss) on investmenttransactions(both realized and unrealized)1 . . . . . 1.64 8.85 0.35 (2.46) 2.23 9.87
Total from investment operations. . . . . . 2.16 8.98 0.92 (2.03) 3.76 10.64Less dividends and distributions to
shareholders:Dividends from net investment income. (1.61) (0.45) (0.77) (2.25) (1.93) (1.31)Distributions from net realized gain . . . (6.07) (3.70) (3.28) (1.06) — —Total dividends and distributions. . . . . . (7.68) (4.15) (4.05) (3.31) (1.93) (1.31)
Net asset value, end of period . . . . . . . . . . . $ 50.53 $ 56.05 $ 51.22 $ 54.35 $ 59.69 $ 57.86
Total return2 . . . . . . . . . . . . . . . . . . . . . . . . . . 4.01%3 18.38% 2.00% (3.64%) 6.70% 22.40%Ratios/Supplemental Data:
Net assets, end of period (inthousands) . . . . . . . . . . . . . . . . . . . . . . $1,167,498 $1,131,488 $1,142,249 $1,656,769 $2,131,554 $2,594,637
Ratio of expenses to average netassetsBefore fee waivers/expense
reimbursements/expense offsetarrangement/recovery . . . . . . . . . . 1.15%4 1.13% 1.15% 1.09% 1.08% 1.10%
After fee waivers/expensereimbursements/expense offsetarrangement/recovery5 . . . . . . . . . 1.15%4,# 1.13% 1.14% 1.09% 1.07% 1.10%†
Ratio of net investment income toaverage net assets . . . . . . . . . . . . . . . 1.96%4 0.23% 1.16%‡ 0.76% 2.61%± 1.45%**
Portfolio turnover rate . . . . . . . . . . . . . . . 31%3 18% 17% 24% 31% 21%
Third Avenue TrustFinancial HighlightsSelected data (for a share outstanding throughout each period) and ratios are as follows:
The accompanying notes are an integral part of the financial statements.
25

1 Includes redemption fees of less than $0.01 per share.2 Performance figures may reflect fee waivers, expense reimbursements, expense offset arrangement and/or recovery of
previously waived fees. Past performance is no guarantee of future results. Total return would have been lower in certainperiods if the Adviser had not waived certain fees or reimbursed certain expenses. Conversely, total return would havebeen higher in certain periods if the Adviser had not recovered previously waived fees or reimbursed expenses. Totalreturn is calculated assuming an initial investment made at the net asset value at the beginning of the period, reinvestmentof all dividends and distributions at net asset value during the period and redemption on the last day of the period and isnot annualized.
3 Not annualized.4 Annualized.5 As a result of an expense limitation, the ratio of expenses (exclusive of taxes, interest, brokerage commissions, acquired
fund fees and expenses, and extraordinary items) to average net assets will not exceed 1.15%.@ Calculated based on the average number of shares outstanding during the period.‡ Investment income per share reflects a special dividend received during the period which amounted to $0.19 per share.
Excluding the special dividend, the ratio of net investment income to average net assets would have been 0.76%.± Investment income per share reflects special dividends received during the period which amounted to $0.41 per share.
Excluding the special dividends, the ratio of net investment income to average net assets would have been 1.92%.** Investment income per share reflects a special dividend received during the period which amounted to $0.44 per share.
Excluding the special dividend, the ratio of net investment income to average net assets would have been 0.63%.# Reflects fee waivers and/or expense reimbursements.† The Adviser recovered a portion of its previously waived fees.
Third Avenue TrustFinancial HighlightsSelected data (for a share outstanding throughout each period) and ratios are as follows:
The accompanying notes are an integral part of the financial statements.
26

Third Avenue Value Fund
For the Period fromMarch 1, 2018
through April 30, 2018
(Unaudited)
Z Class:
Net asset value, beginning of period . . . . . . . . . . . . . . . . . . . . . . . . . . . . . . . . . . $ 53.23
Income from investment operations:Net investment income@ . . . . . . . . . . . . . . . . . . . . . . . . . . . . . . . . . . . . . . . . . 0.23Net gain on investment transactions
(both realized and unrealized) . . . . . . . . . . . . . . . . . . . . . . . . . . . . . . . . . . 0.54
Total from investment operations . . . . . . . . . . . . . . . . . . . . . . . . . . . . . . . . . . 0.77
Less distributions to shareholders:Distributions from net realized gain . . . . . . . . . . . . . . . . . . . . . . . . . . . . . . . . (3.46)
Total distributions . . . . . . . . . . . . . . . . . . . . . . . . . . . . . . . . . . . . . . . . . . . . . . . (3.46)
Net asset value, end of period . . . . . . . . . . . . . . . . . . . . . . . . . . . . . . . . . . . . . . . $ 50.54
Total return1 . . . . . . . . . . . . . . . . . . . . . . . . . . . . . . . . . . . . . . . . . . . . . . . . . . . . . . 1.45%2
Ratios/Supplemental Data:Net assets, end of period (in thousands) . . . . . . . . . . . . . . . . . . . . . . . . . . . . $ 3Ratio of expenses to average net assets
Before fee waivers/expense offsetarrangement. . . . . . . . . . . . . . . . . . . . . . . . . . . . . . . . . . . . . . . . . . . . . . . 0.98%3
After fee waivers/expense offsetarrangement4 . . . . . . . . . . . . . . . . . . . . . . . . . . . . . . . . . . . . . . . . . . . . . . 0.97%3
Ratio of net investment income to average net assets . . . . . . . . . . . . . . . . 2.75%3
Portfolio turnover rate . . . . . . . . . . . . . . . . . . . . . . . . . . . . . . . . . . . . . . . . . . . . 31%2
1 Performance figures may reflect fee waivers and/or expense offset arrangement. Past performance is no guarantee offuture results. In the absence of fee waivers and/or expense offset arrangement, the total return would have been lower.Total return is calculated assuming an initial investment made at the net asset value at the beginning of the period,reinvestment of all dividends and distributions at net asset value during the period and redemption on the last day of theperiod and is not annualized.
2 Not annualized.3 Annualized.4 As a result of an expense limitation, the ratio of expenses (exclusive of taxes, interest, brokerage commissions, acquired
fund fees and expenses, and extraordinary items) to average net assets will not exceed 1.05%.@ Calculated based on the average number of shares outstanding during the period.
Third Avenue TrustFinancial HighlightsSelected data (for a share outstanding throughout each period) and ratios are as follows:
The accompanying notes are an integral part of the financial statements.
27

Third Avenue Small-Cap Value FundFor The Six
Months EndedApril 30, Years Ended October 31,
2018 2017 2016 2015 2014 2013(Unaudited)
Investor Class:Net asset value, beginning of period . . . . . $ 23.30 $ 20.77 $ 22.28 $ 28.18 $ 28.10 $ 22.13Income/(loss) from investment
operations:Net investment income/(loss)@ . . . . . . . (0.07) (0.18) 0.08‡ (0.10) (0.11) 0.06*
Net gain/(loss) on investmenttransactions(both realized and unrealized)1 . . . . . 1.05 4.63 1.17 (0.19) 1.96 6.57
Total from investment operations. . . . . . 0.98 4.45 1.25 (0.29) 1.85 6.63Less dividends and distributions to
shareholders:Dividends from net investment income. — (0.06) — — — (0.16)Distributions from net realized gain . . . (2.83) (1.86) (2.76) (5.61) (1.77) (0.50)Total dividends and distributions. . . . . . (2.83) (1.92) (2.76) (5.61) (1.77) (0.66)
Net asset value, end of period . . . . . . . . . . . $ 21.45 $ 23.30 $ 20.77 $ 22.28 $ 28.18 $ 28.10
Total return2 . . . . . . . . . . . . . . . . . . . . . . . . . . 4.66%3 22.22% 6.71% (1.49%) 6.85% 30.74%Ratios/Supplemental Data:
Net assets, end of period (inthousands) . . . . . . . . . . . . . . . . . . . . . . $ 4,213 $ 4,955 $ 5,145 $ 9,379 $ 9,898 $11,995
Ratio of expenses to average netassetsBefore fee waivers/expense offset
arrangement . . . . . . . . . . . . . . . . . . 1.48%4 1.45% 1.45% 1.39% 1.35% 1.37%After fee waivers/expense offset
arrangement5 . . . . . . . . . . . . . . . . . 1.40%4,# 1.40%# 1.40%# 1.39% 1.35% 1.37%Ratio of net investment income/(loss)
to average net assets . . . . . . . . . . . . . (0.63%)4 (0.81%) 0.39%‡ (0.42%) (0.41%) 0.25%*
Portfolio turnover rate . . . . . . . . . . . . . . . 26%3 32% 20% 29% 40% 39%1 Includes redemption fees of less than $0.01 per share.2 Performance figures may reflect fee waivers and/or expense offset arrangement. Past performance in no guarantee of
future results. In the absence of fee waivers and/or expense offset arrangement, the total return would have been lower.Total return is calculated assuming an initial investment made at the net asset value at the beginning of the period,reinvestment of all dividends and distributions at net asset value during the period and redemption on the last day of theperiod and is not annualized.
3 Not annualized.4 Annualized.5 As a result of an expense limitation, the ratio of expenses (exclusive of taxes, interest, brokerage commissions, acquired
fund fees and expenses, and extraordinary items) to average net assets will not exceed 1.40%.@ Calculated based on the average number of shares outstanding during the period.‡ Investment income per share reflects special dividends received during the period which amounted to $0.11 per share.
Excluding the special dividends, the ratio of net investment income/(loss) to average net assets would have been (0.17%).* Investment income per share reflects special dividends received during the period which amounted to $0.11 per share.
Excluding the special dividends, the ratio of net investment income/(loss) to average net assets would have been (0.18%).# The Adviser waived a portion of its fees.
Third Avenue TrustFinancial HighlightsSelected data (for a share outstanding throughout each period) and ratios are as follows:
The accompanying notes are an integral part of the financial statements.
28

Third Avenue Small-Cap Value FundFor The Six
Months EndedApril 30, Years Ended October 31,
2018 2017 2016 2015 2014 2013(Unaudited)
Institutional Class:Net asset value, beginning of period . . . . . $ 23.55 $ 20.97 $ 22.42 $ 28.27 $ 28.16 $ 22.18Income/(loss) from investment
operations:Net investment income/(loss)@ . . . . . . . (0.04) (0.12) 0.13† (0.04) (0.05) 0.15‡
Net gain/(loss) on investmenttransactions(both realized and unrealized)1 . . . . . 1.06 4.69 1.18 (0.20) 1.97 6.54
Total from investment operations. . . . . . 1.02 4.57 1.31 (0.24) 1.92 6.69Less dividends and distributions to
shareholders:Dividends from net investment income. — (0.13) — — (0.04) (0.21)Distributions from net realized gain . . . (2.83) (1.86) (2.76) (5.61) (1.77) (0.50)Total dividends and distributions. . . . . . (2.83) (1.99) (2.76) (5.61) (1.81) (0.71)
Net asset value, end of period . . . . . . . . . . . $ 21.74 $ 23.55 $ 20.97 $ 22.42 $ 28.27 $ 28.16
Total return2 . . . . . . . . . . . . . . . . . . . . . . . . . . 4.79%3 22.59% 6.95% (1.27%) 7.09% 31.05%Ratios/Supplemental Data:
Net assets, end of period (inthousands) . . . . . . . . . . . . . . . . . . . . . . $271,971 $291,169 $292,166 $388,441 $510,053 $667,712
Ratio of expenses to average netassetsBefore fee waivers/expense offset
arrangement . . . . . . . . . . . . . . . . . . 1.21%4 1.20% 1.21% 1.14% 1.10% 1.12%After fee waivers/expense offset
arrangement5 . . . . . . . . . . . . . . . . . 1.15%4,# 1.15%# 1.15%# 1.14% 1.10% 1.12%Ratio of net investment income/(loss)
to average net assets . . . . . . . . . . . . . (0.38%)4 (0.56%) 0.65%† (0.16%) (0.17%) 0.62%‡
Portfolio turnover rate . . . . . . . . . . . . . . . 26%3 32% 20% 29% 40% 39%1 Includes redemption fees of less than $0.01 per share.2 Performance figures may reflect fee waivers and/or expense offset arrangement. Past performance in no guarantee of
future results. In the absence of fee waivers and/or expense offset arrangement, the total return would have been lower.Total return is calculated assuming an initial investment made at the net asset value at the beginning of the period,reinvestment of all dividends and distributions at net asset value during the period and redemption on the last day of theperiod and is not annualized.
3 Not annualized.4 Annualized.5 As a result of an expense limitation, the ratio of expenses (exclusive of taxes, interest, brokerage commissions, acquired
fund fees and expenses, and extraordinary items) to average net assets will not exceed 1.15%.@ Calculated based on the average number of shares outstanding during the period.† Investment income per share reflects special dividends received during the period which amounted to $0.11 per share.
Excluding the special dividends, the ratio of net investment income to average net assets would have been 0.09%.‡ Investment income per share reflects special dividends received during the period which amounted to $0.11 per share.
Excluding the special dividends, the ratio of net investment income to average net assets would have been 0.19%.# The Adviser waived a portion of its fees.
Third Avenue TrustFinancial HighlightsSelected data (for a share outstanding throughout each period) and ratios are as follows:
The accompanying notes are an integral part of the financial statements.
29

Third Avenue Small-Cap Value Fund
For the Period fromMarch 1, 2018
through April 30, 2018
(Unaudited)
Z Class:
Net asset value, beginning of period . . . . . . . . . . . . . . . . . . . . . . . . . . . . . . . . . . $ 20.56
Income/(loss) from investment operations:Net investment loss@ . . . . . . . . . . . . . . . . . . . . . . . . . . . . . . . . . . . . . . . . . . . . (0.02)Net gain on investment transactions
(both realized and unrealized) . . . . . . . . . . . . . . . . . . . . . . . . . . . . . . . . . . 1.20
Total from investment operations . . . . . . . . . . . . . . . . . . . . . . . . . . . . . . . . . . 1.18
Net asset value, end of period . . . . . . . . . . . . . . . . . . . . . . . . . . . . . . . . . . . . . . . $ 21.74
Total return1 . . . . . . . . . . . . . . . . . . . . . . . . . . . . . . . . . . . . . . . . . . . . . . . . . . . . . . 5.74%2
Ratios/Supplemental Data:Net assets, end of period (in thousands) . . . . . . . . . . . . . . . . . . . . . . . . . . . . $ 3Ratio of expenses to average net assets
Before fee waivers/expense offsetarrangement. . . . . . . . . . . . . . . . . . . . . . . . . . . . . . . . . . . . . . . . . . . . . . . 1.07%3
After fee waivers/expense offsetarrangement4 . . . . . . . . . . . . . . . . . . . . . . . . . . . . . . . . . . . . . . . . . . . . . . 1.04%3,#
Ratio of net investment loss to average net assets . . . . . . . . . . . . . . . . . . . (0.47%)3
Portfolio turnover rate . . . . . . . . . . . . . . . . . . . . . . . . . . . . . . . . . . . . . . . . . . . . 26%2
1 Performance figures may reflect fee waivers and/or expense offset arrangement. Past performance in no guarantee offuture results. In the absence of fee waivers and/or expense offset arrangement, the total return would have been lower.Total return is calculated assuming an initial investment made at the net asset value at the beginning of the period,reinvestment of all dividends and distributions at net asset value during the period and redemption on the last day of theperiod and is not annualized.
2 Not annualized.3 Annualized.4 As a result of an expense limitation, the ratio of expenses (exclusive of taxes, interest, brokerage commissions, acquired
fund fees and expenses, and extraordinary items) to average net assets will not exceed 1.05%.@ Calculated based on the average number of shares outstanding during the period.# The Adviser waived a portion of its fees.
Third Avenue TrustFinancial HighlightsSelected data (for a share outstanding throughout each period) and ratios are as follows:
The accompanying notes are an integral part of the financial statements.
30

Third Avenue Real Estate Value FundFor The Six
Months EndedApril 30, Years Ended October 31,
2018 2017 2016 2015 2014 2013(Unaudited)
Investor Class:Net asset value, beginning of period . . . . . $ 34.35 $ 29.51 $ 31.14 $ 31.84 $ 29.40 $ 26.53Income/(loss) from investment
operations:Net investment income/(loss)@ . . . . . . . 0.02 0.18* 0.08‡ (0.04) 0.50± 0.10Net gain/(loss) on investment
transactions(both realized and unrealized)1 . . . . . 1.15 5.10 (0.18) 0.41 2.60 4.99
Total from investment operations. . . . . . 1.17 5.28 (0.10) 0.37 3.10 5.09Less dividends and distributions to
shareholders:Dividends from net investment income. (0.27) (0.16) (0.13) (0.44) (0.26) (0.84)Distributions from net realized gain . . . (1.78) (0.28) (1.40) (0.63) (0.40) (1.38)Total dividends and distributions. . . . . . (2.05) (0.44) (1.53) (1.07) (0.66) (2.22)
Net asset value, end of period . . . . . . . . . . . $ 33.47 $ 34.35 $ 29.51 $ 31.14 $ 31.84 $ 29.40
Total return2 . . . . . . . . . . . . . . . . . . . . . . . . . . 3.36%3 18.13% (0.21%) 1.12% 10.84% 20.61%Ratios/Supplemental Data:
Net assets, end of period (inthousands) . . . . . . . . . . . . . . . . . . . . . . $242,333 $255,383 $243,502 $438,506 $367,834 $145,169
Ratio of expenses to average netassetsBefore fee waivers/expense offset
arrangement . . . . . . . . . . . . . . . . . . 1.38%4 1.36% 1.38% 1.35% 1.34% 1.34%After fee waivers/expense offset
arrangement5 . . . . . . . . . . . . . . . . . 1.38%4 1.36% 1.38% 1.35% 1.33% 1.33%Ratio of net investment income/(loss)
to average net assets . . . . . . . . . . . . . 0.13%4 0.56%* 0.28%‡ (0.11%) 1.63%± 0.36%Portfolio turnover rate . . . . . . . . . . . . . . . 12%3 7% 20% 17% 14% 13%
1 Includes redemption fees of less than $0.01 per share.2 Performance figures may reflect fee waivers and/or expense offset arrangement. Past performance in no guarantee of
future results. In the absence of fee waivers and/or expense offset arrangement, the total return would have been lower.Total return is calculated assuming an initial investment made at the net asset value at the beginning of the period,reinvestment of all dividends and distributions at net asset value during the period and redemption on the last day of theperiod and is not annualized.
3 Not annualized.4 Annualized.5 As a result of an expense limitation, the ratio of expenses (exclusive of taxes, interest, brokerage commissions, acquired
fund fees and expenses, and extraordinary items) to average net assets will not exceed 1.40%.@ Calculated based on the average number of shares outstanding during the period.* Investment income per share reflects a special dividend received during the period which amounted to $0.10 per share.
Excluding the special dividend, the ratio of net investment income to average net assets would have been 0.25%.‡ Investment income per share reflects a special dividend received during the period which amounted to $0.09 per share.
Excluding the special dividend, the ratio of net investment income/(loss) to average net assets would have been (0.04%).± Investment income per share reflects a special dividend received during the period which amounted to $0.06 per share.
Excluding the special dividend, the ratio of net investment income to average net assets would have been 1.43%.
Third Avenue TrustFinancial HighlightsSelected data (for a share outstanding throughout each period) and ratios are as follows:
The accompanying notes are an integral part of the financial statements.
31

Third Avenue Real Estate Value FundFor The Six
Months EndedApril 30, Years Ended October 31,
2018 2017 2016 2015 2014 2013(Unaudited)
Institutional Class:Net asset value, beginning of period . . . . . $ 34.59 $ 29.73 $ 31.36 $ 32.05 $ 29.56 $ 26.66Income/(loss) from investment
operations:Net investment income@ . . . . . . . . . . . . . 0.07 0.26* 0.16‡ 0.04 0.56± 0.18Net gain/(loss) on investment
transactions(both realized and unrealized)1 . . . . . 1.15 5.13 (0.18) 0.41 2.63 4.99
Total from investment operations. . . . . . 1.22 5.39 (0.02) 0.45 3.19 5.17Less dividends and distributions to
shareholders:Dividends from net investment income. (0.36) (0.25) (0.21) (0.51) (0.30) (0.89)Distributions from net realized gain . . . (1.78) (0.28) (1.40) (0.63) (0.40) (1.38)Total dividends and distributions. . . . . . (2.14) (0.53) (1.61) (1.14) (0.70) (2.27)
Net asset value, end of period . . . . . . . . . . . $ 33.67 $ 34.59 $ 29.73 $ 31.36 $ 32.05 $ 29.56
Total return2 . . . . . . . . . . . . . . . . . . . . . . . . . . 3.48%3 18.41% 0.05% 1.37% 11.11% 20.87%Ratios/Supplemental Data:
Net assets, end of period (inthousands) . . . . . . . . . . . . . . . . . . . . . . $1,651,108 $1,690,211 $1,596,887 $3,026,286 $2,866,849 $2,010,557
Ratio of expenses to average netassetsBefore fee waivers/expense offset
arrangement . . . . . . . . . . . . . . . . . . 1.11%4 1.11% 1.13% 1.10% 1.09% 1.09%After fee waivers/expense offset
arrangement5 . . . . . . . . . . . . . . . . . 1.11%4 1.11% 1.13% 1.10% 1.08% 1.08%Ratio of net investment income to
average net assets . . . . . . . . . . . . . . . 0.40%4 0.81%* 0.56%‡ 0.13% 1.82%± 0.65%Portfolio turnover rate . . . . . . . . . . . . . . . 12%3 7% 20% 17% 14% 13%
1 Includes redemption fees of less than $0.01 per share.2 Performance figures may reflect fee waivers and/or expense offset arrangement. Past performance in no guarantee of
future results. In the absence of fee waivers and/or expense offset arrangement, the total return would have been lower.Total return is calculated assuming an initial investment made at the net asset value at the beginning of the period,reinvestment of all dividends and distributions at net asset value during the period and redemption on the last day of theperiod and is not annualized.
3 Not annualized.4 Annualized.5 As a result of an expense limitation, the ratio of expenses (exclusive of taxes, interest, brokerage commissions, acquired
fund fees and expenses, and extraordinary items) to average net assets will not exceed 1.15%.@ Calculated based on the average number of shares outstanding during the period.* Investment income per share reflects a special dividend received during the period which amounted to $0.10 per share.
Excluding the special dividend, the ratio of net investment income to average net assets would have been 0.50%.‡ Investment income per share reflects a special dividend received during the period which amounted to $0.09 per share.
Excluding the special dividend, the ratio of net investment income to average net assets would have been 0.24%.± Investment income per share reflects a special dividend received during the period which amounted to $0.06 per share.
Excluding the special dividend, the ratio of net investment income to average net assets would have been 1.62%.
Third Avenue TrustFinancial HighlightsSelected data (for a share outstanding throughout each period) and ratios are as follows:
The accompanying notes are an integral part of the financial statements.
32

Third Avenue Real Estate Value Fund
For the Period fromMarch 1, 2018
through April 30, 2018
(Unaudited)
Z Class:
Net asset value, beginning of period . . . . . . . . . . . . . . . . . . . . . . . . . . . . . . . . . . $ 33.13
Income from investment operations:Net investment income@ . . . . . . . . . . . . . . . . . . . . . . . . . . . . . . . . . . . . . . . . . 0.18Net gain on investment transactions
(both realized and unrealized) . . . . . . . . . . . . . . . . . . . . . . . . . . . . . . . . . . 0.36
Total from investment operations . . . . . . . . . . . . . . . . . . . . . . . . . . . . . . . . . . 0.54
Net asset value, end of period . . . . . . . . . . . . . . . . . . . . . . . . . . . . . . . . . . . . . . . $ 33.67
Total return1 . . . . . . . . . . . . . . . . . . . . . . . . . . . . . . . . . . . . . . . . . . . . . . . . . . . . . . 1.63%2
Ratios/Supplemental Data:Net assets, end of period (in thousands) . . . . . . . . . . . . . . . . . . . . . . . . . . . . $ 6,019Ratio of expenses to average net assets
Before fee waivers/expense offsetarrangement. . . . . . . . . . . . . . . . . . . . . . . . . . . . . . . . . . . . . . . . . . . . . . . 1.05%3
After fee waivers/expense offsetarrangement4 . . . . . . . . . . . . . . . . . . . . . . . . . . . . . . . . . . . . . . . . . . . . . . 1.05%3
Ratio of net investment income to average net assets . . . . . . . . . . . . . . . . 3.27%3
Portfolio turnover rate . . . . . . . . . . . . . . . . . . . . . . . . . . . . . . . . . . . . . . . . . . . . 12%2
1 Performance figures may reflect fee waivers and/or expense offset arrangement. Past performance is no guarantee offuture results. In the absence of fee waivers and/or expense offset arrangement, the total return would have been lower.Total return is calculated assuming an initial investment made at the net asset value at the beginning of the period,reinvestment of all dividends and distributions at net asset value during the period and redemption on the last day of theperiod and is not annualized.
2 Not annualized.3 Annualized.4 As a result of an expense limitation, the ratio of expenses (exclusive of taxes, interest, brokerage commissions, acquired
fund fees and expenses, and extraordinary items) to average net assets will not exceed 1.05%.@ Calculated based on the average number of shares outstanding during the period.
Third Avenue TrustFinancial HighlightsSelected data (for a share outstanding throughout each period) and ratios are as follows:
The accompanying notes are an integral part of the financial statements.
33

1. SUMMARY OF ORGANIZATION AND SIGNIFICANT ACCOUNTING POLICIES
Organization:Third Avenue Trust (the “Trust”) is an open-end, management investment company organizedas a Delaware business trust pursuant to a Trust Instrument dated October 31, 1996. The Trustcurrently consists of the following diversified (within the meaning of Section 5(b)(2) of theInvestment Company Act), separate investment series: Third Avenue Value Fund, ThirdAvenue Small-Cap Value Fund and Third Avenue Real Estate Value Fund (each a “Fund” and,collectively, the “Funds”). The Trust also contains the Third Avenue Focused Credit Fund, aseparate non-diversified investment series of the Trust, whose financial statements arepresented separately. Third Avenue Management LLC (the “Adviser”) provides investmentadvisory services to each of the Funds in the Trust. The Funds seek to achieve their investmentobjectives by adhering to a strict value discipline when selecting securities and otherinstruments. Each Fund has a distinct investment mandate.
Third Avenue Value Fund acquired all the assets and liabilities of Third Avenue InternationalValue Fund in a reorganization on March 16, 2018. Third Avenue International Value Fundwas a separate investment series of the Trust prior to the reorganization. Please refer to Note 10for a discussion of the reorganization.
Third Avenue Value Fund seeks to achieve its long-term capital appreciation objective mainlyby acquiring common stocks of well-financed companies (meaning companies with highquality assets and conservative levels of liabilities) at a discount to what the Adviser believes istheir intrinsic value. The Fund may invest in companies of any market capitalization andacross all industries. The Fund may also acquire senior securities, such as convertible securities,preferred stocks and debt instruments (including high-yield and distressed securities that maybe in default and may have any or no credit rating), that the Adviser believes are undervalued.The Fund invests in both domestic and foreign securities.
Third Avenue Small-Cap Value Fund seeks to achieve its long-term capital appreciationobjective mainly by acquiring equity securities, including common stocks and convertiblesecurities, of well-financed (meaning companies with high quality assets and conservativelevels of liabilities) small companies at a discount to what the Adviser believes is their intrinsicvalue. Under normal circumstances, the Fund expects to invest at least 80% of its net assets(plus the amount of any borrowing for investment purposes) in securities of companies thatare considered small. The Fund considers a “small company” to be one whose marketcapitalization is between $50 million and the top range of capitalizations during the mostrecent quarter (as measured each quarter end) of companies in the Russell 2000 Index or theS&P Small Cap 600 Index at the time of investment (based on month-end data). The Fundmay also acquire senior securities of small companies, such as preferred stocks and debt
Third Avenue TrustNotes to Financial StatementsApril 30, 2018 (Unaudited)
34

instruments (including high-yield and distressed securities that may be in default and mayhave any or no credit rating), that the Adviser believes are undervalued. The Fund invests inboth domestic and foreign securities.
Third Avenue Real Estate Value Fund seeks to achieve its long-term capital appreciationobjective primarily by investing in equity securities, including common stocks and convertiblesecurities, of well-financed (meaning companies with high quality assets and conservativelevels of liabilities) real estate and real estate-related companies, or in companies which ownsignificant real estate assets or derive a significant portion of gross revenues or net profits fromreal estate-related companies at the time of investment (“real estate companies”). The Fundseeks to acquire these securities at a discount to what the Adviser believes is their intrinsicvalue. Under normal circumstances, at least 80% of the Fund’s net assets (plus the amount ofany borrowing for investment purposes) will be invested in securities of real estate and realestate-related companies. The Fund may invest in companies of any market capitalization. TheFund may also acquire senior securities, such as preferred stocks and debt instruments(including high-yield, distressed and mortgage-backed securities that may be in default andmay have any or no credit rating) of real estate companies or loans secured by real estate or realestate-related companies that the Adviser believes have above-average yield potential. TheFund invests in both domestic and foreign securities.
Because of the Funds’ disciplined and deliberate investing approach, there may be times whena Fund will have a significant cash position. A substantial cash position can adversely impactFund performance in certain market conditions, and may make it more difficult for a Fund toachieve its investment objective.
On March 1, 2018, Third Avenue Value Fund, Third Avenue Small-Cap Value Fund andThird Avenue Real Estate Value Fund began offering Z Class shares.
Accounting policies:The policies described below are followed consistently by the Funds in the preparation of theirfinancial statements in conformity with accounting principles generally accepted in theUnited States of America (“U.S. GAAP”). The Trust is an investment company and,accordingly, follows the investment company accounting and reporting guidance of theFinancial Accounting Standards Board Accounting Standards Codification (“FASB ASC”)Topic 946-Investment Companies, which is part of U.S. GAAP.
The preparation of financial statements in accordance with U.S. GAAP requires managementto make estimates and assumptions that affect the reported amounts and disclosures. Actualresults could differ from those estimates.
Security valuation:
Third Avenue TrustNotes to Financial Statements (continued)April 30, 2018 (Unaudited)
35

Generally, the Funds’ investments are valued at market value. Securities traded on a principalstock exchange, including The NASDAQ Stock Market, Inc. (“NASDAQ”), are valued at thelast quoted sales price, the NASDAQ official closing price, or, in the absence of closing salesprices on that day, securities are valued at the mean between the closing bid and ask price. Inaccordance with procedures approved by the Trust’s Board of Trustees (the “Board”), the Fundshave retained a third party provider that applies a statistical model to provide fair value pricingfor foreign equity securities with principal markets that are no longer open when a Fundcalculates its net asset value (“NAV”). Debt instruments with maturities greater than 60 days,including floating rate loan securities, are valued on the basis of prices obtained from a pricingservice approved by the Board or otherwise pursuant to policies and procedures approved bythe Board. Investments in derivative instruments are valued independently by service providersor by broker quotes based on pricing models. Short-term cash investments are valued at cost,plus accrued interest, which approximates market value. Short-term debt securities with 60days or less to maturity may be valued at amortized cost.
The Adviser has established a Valuation Committee (the “Committee”) which is responsiblefor overseeing the pricing and valuation of all securities held in the Funds. The Committeeoperates under pricing and valuation policies and procedures established by the Adviser andapproved by the Board, including pricing policies which set forth the mechanisms andprocesses to be employed on a daily basis to implement these policies and procedures. Inparticular, the pricing policies describe how to determine market quotations for securities andother instruments. The Committee’s responsibilities include: 1) fair value determinations (andoversight of third parties used in valuation determinations), and 2) regular monitoring of theAdviser’s pricing and valuation policies and procedures and modification or enhancement ofthese policies and procedures (or recommendation of the modification of these policies andprocedures) as the Committee believes appropriate.
Securities for which market quotations are not readily available are valued at “fair value,” asdetermined in good faith by the Committee as authorized by the Board, under policies andprocedures approved by the Board. At April 30, 2018, such securities had a total fair value of$3,288,138, or 0.28% of net assets of Third Avenue Value Fund, $1,519,814, or 0.55% of netassets of Third Avenue Small-Cap Value Fund and $60,266,208, or 3.17% of net assets ofThird Avenue Real Estate Value Fund. Among the factors that may be considered by theCommittee in determining fair value are: prior trades in the security in question, trades insimilar securities of the same or other issuers, the type of security, trading in marketablesecurities of the same issuer, the financial condition of the issuer, comparable multiples ofsimilar issuers, the operating results of the issuer and liquidation value of the issuer. See FairValue Measurements below for additional detail on fair value measurements for financial
Third Avenue TrustNotes to Financial Statements (continued)April 30, 2018 (Unaudited)
36

reporting purposes. The fair values determined in accordance with these policies andprocedures may differ significantly from the amounts which would be realized upondisposition of the securities.
Fair value measurements:In accordance with FASB ASC 820-10, Fair Value Measurements and Disclosures, the Fundsdisclose the fair value of their investments in a hierarchy that prioritizes the inputs to valuationtechniques used to measure the fair value. Fair value is defined as the price that a Fund wouldreceive upon selling an investment in an orderly transaction to an independent buyer in theprincipal or most advantageous market for the investment under current market conditions.The hierarchy gives the highest priority to valuations based upon unadjusted quoted prices inactive markets for identical assets or liabilities (Level 1 measurement) and the lowest priority tovaluations based upon unobservable inputs that are significant to the valuation (Level 3measurements). The three levels of the fair value hierarchy are as follows:
• Level 1 – Inputs that reflect unadjusted quoted prices in active markets for identicalassets or liabilities that the Funds have the ability to access at the measurement date;
• Level 2 – Inputs other than quoted prices that are observable for the asset orliability either directly or indirectly, including inputs in markets that are not consideredto be active; and
• Level 3 – Significant unobservable inputs (including the Funds’ own assumptionsin determining the fair value of investments)
A financial instrument’s level within the fair value hierarchy is based on the lowest level of anyinput both individually and in aggregate that is significant to the fair value measurement.However, the determination of what constitutes “observable” requires significant judgment bythe Funds. The Funds consider observable data to be market data which is readily available,regularly distributed or updated, reliable and verifiable, not proprietary, and provided byindependent sources that are actively involved in the relevant market. The inputs ormethodology used for valuing investments are not necessarily an indication of the riskassociated with investing in those investments.
The Funds use valuation techniques to measure fair value that are consistent with the marketapproach and/or income approach, depending on the type of security and the particularcircumstance. The market approach uses prices and other relevant information generated bymarket transactions involving identical or comparable securities. The income approach usesvaluation techniques to discount estimated future cash flows to present value.
Third Avenue TrustNotes to Financial Statements (continued)April 30, 2018 (Unaudited)
37

The following are certain inputs and techniques that the Funds generally use to evaluate howto classify each major category of assets and liabilities for Level 2 and Level 3, in accordancewith U.S. GAAP.
Equity Securities (Common Stocks, Preferred Stocks and Warrants)—Equity securities tradedin inactive markets and certain foreign equity securities are valued using inputs which includebroker-dealer quotes, recently executed transactions adjusted for changes in the benchmarkindex, or evaluated prices received from independent pricing services or brokers that take intoaccount the integrity of the market sector and issuer, the individual characteristics of thesecurity, and information received from broker-dealers and other market sources pertaining tothe issuer or security. To the extent that these inputs are observable, the values of equitysecurities are categorized as Level 2. To the extent that these inputs are unobservable, the valuesare categorized as Level 3.
U.S. Government Obligations—U.S. Government obligations are valued by independentpricing services based on pricing models that evaluate the mean between the closing bid andask price. The models also take into consideration data received from active market makers andbroker-dealers, yield curves, and the spread over comparable U.S. Government issues. Thespreads change daily in response to market conditions and are generally obtained from the newissue market and broker-dealer sources. To the extent that these inputs are observable, thevalues of U.S. Government obligations are categorized as Level 2. To the extent that theseinputs are unobservable, the values are categorized as Level 3.
Corporate Bonds and Notes—Corporate bonds and notes are generally comprised of twomain categories: investment grade bonds and high yield bonds. Investment grade bonds arevalued by independent pricing services or brokers using various inputs and techniques, whichinclude broker-dealer quotations, live trading levels, recently executed transactions in securitiesof the issuer or comparable issuers, and option adjusted spread models that include base curveand spread curve inputs. Adjustments to individual bonds can be applied to recognize tradingdifferences compared to other bonds issued by the same issuer. High yield bonds are valued byindependent pricing services or brokers based primarily on broker-dealer quotations fromrelevant market makers and recently executed transactions in securities of the issuer orcomparable issuers. The broker-dealer quotations received are supported by credit analysis ofthe issuer that takes into consideration credit quality assessments, daily trading activity, and theactivity of the underlying equities, listed bonds and sector specific trends. To the extent thatthese inputs are observable, the values of corporate bonds and notes are categorized as Level 2.To the extent that these inputs are unobservable, the values are categorized as Level 3.
Term Loans—Term loans are valued by independent pricing services based on the average ofevaluated quoted prices received from multiple dealers or valued relative to other benchmark
Third Avenue TrustNotes to Financial Statements (continued)April 30, 2018 (Unaudited)
38

securities when broker-dealer quotes are unavailable. Inputs may include quoted prices forsimilar investments in active markets, interest rates, coupon rates, yield curves, option adjustedspreads, default rates, credit spreads and other unique security features in order to estimate therelevant cash flows which are then discounted to calculate fair values. To the extent that theseinputs are observable, the values of term loans are categorized as Level 2. To the extent thatthese inputs are unobservable, the values are categorized as Level 3.
Options (Purchased and Written)—Options are valued by independent pricing services or bybrokers based on pricing models that take into account, among other factors, foreign exchangerate, time until expiration, and volatility of the underlying foreign currency security. To theextent that these inputs are observable, the values of options are categorized as Level 2. To theextent that these inputs are unobservable, the values are categorized as Level 3.
The following is a Summary by Level of Inputs used to value the Funds’ investments as ofApril 30, 2018:
Third Avenue ValueFund
Third AvenueSmall-Cap Value
FundThird Avenue RealEstate Value Fund
Level 1: Quoted Prices†Investments in Securities:
Common Stocks & Warrants:Engineering & Construction $ 3,007,604 $ — $ —Non-U.S. Real Estate Operating Companies — — 82,351,664Oil & Gas Production & Services 69,816,881 18,916,937 —U.S. Real Estate Operating Companies 32,962,795 10,641,826 80,116,397Other** 494,301,552 227,876,537 859,962,441
Total for Level 1 Securities 600,088,832 257,435,300 1,022,430,502
Level 2: Other Significant Observable Inputs†Investments in Securities:
Common Stocks:Automotive 51,852,568 — —Capital Goods 4,142,104 — —Diversified Holding Companies 146,049,200 — —Engineering & Construction 32,229,098 — —Non-U.S. Real Estate
Consulting/Management — — 19,984,478Non-U.S. Real Estate Investment Trusts — — 221,153,086Non-U.S. Real Estate Operating Companies 64,178,622 — 419,429,589Oil & Gas Production & Services 97,060,574 — —
Corporate Notes 2,849,250 — —Term Loans — — 8,707,752Purchased Options — — 1,019,221
Third Avenue TrustNotes to Financial Statements (continued)April 30, 2018 (Unaudited)
39

Summary by level of inputs (continued)
Third Avenue ValueFund
Third AvenueSmall-Cap Value
FundThird Avenue RealEstate Value Fund
Short-Term Investments:U.S. Government Obligations $ 164,945,452 $ 14,993,981 $ 89,931,721
Total for Level 2 Securities 563,306,868 14,993,981 760,225,847
Level 3: Significant Unobservable InputsInvestments in Securities:
Common Stocks:Consumer Products 1 — —Oil & Gas Production & Services — 1,519,814 —U.S. Real Estate Operating Companies — — 60,266,208
Preferred Stocks:Consumer Products 1 — —
Corporate Notes 3,288,136 — —Term Loans — — —*
Total for Level 3 Securities 3,288,138 1,519,814 60,266,208
Total Value of Investments $ 1,166,683,838 $ 273,949,095 $ 1,842,922,557
Investments in Other Financial Instruments:Level 2: Other Significant Observable InputsWritten Options $ — $ — $ (162,878)
Total Value or Appreciation/(Depreciation)of Other Financial Instruments $ — $ — $ (162,878)
† There were no transfers from Level 1 to Level 2 or from Level 2 to Level 1.* Investments fair valued at zero.** Please refer to the Portfolios of Investments for industry specifics of the portfolio holdings.
Third Avenue TrustNotes to Financial Statements (continued)April 30, 2018 (Unaudited)
40

The following is a reconciliation of Level 3 investments for which significant unobservableinputs were used to determine fair value:
Third Avenue Value FundCorporate
NotesCommonStocks
PreferredStocks Total
Balance as of 10/31/17 (fairvalue)Consumer Products $ 7,013,744 $ 1 $ 1 $ 7,013,746
SalesConsumer Products — — —* —
Net change in unrealizedgain/(loss)Consumer Products (3,725,608) — — (3,725,608)
Balance as of 4/30/18 (fair value)Consumer Products 3,288,136 1 1 3,288,138
Total $ 3,288,136 $ 1 $ 1 $ 3,288,138
Net change in unrealizedgain/(loss) related to securitiesstill held as of April 30, 2018: $ (3,725,608) $ — $ — $ (3,725,608)
* Includes shares reduced by corporate action.
Third Avenue Small-Cap Value FundCommonStocks
Balance as of 10/31/17 (fairvalue)Oil & Gas Production &
Services $ —Purchases
Oil & Gas Production &Services 1,300,000
Net change in unrealizedgain/(loss)Oil & Gas Production &
Services 219,814Balance as of 4/30/18 (fair value)
Oil & Gas Production &Services 1,519,814
Total $ 1,519,814
Net change in unrealizedgain/(loss) related to securitiesstill held as of April 30, 2018: $ 219,814
Third Avenue TrustNotes to Financial Statements (continued)April 30, 2018 (Unaudited)
41

Third Avenue Real Estate ValueFund
CommonStocks Term Loans Total
Balance as of 10/31/17 (fairvalue)Non-U.S. Real Estate Operating
Companies $ — $ 42,258 $ 42,258U.S. Real Estate Operating
Companies 57,490,575 — 57,490,575Payment-in-kind
Non-U.S. Real Estate OperatingCompanies — 442 442
Net change in unrealizedgain/(loss)Non-U.S. Real Estate Operating
Companies — (42,700) (42,700)U.S. Real Estate Operating
Companies 2,775,633 — 2,775,633Balance as of 4/30/18 (fair value)
Non-U.S. Real Estate OperatingCompanies — —* —
U.S. Real Estate OperatingCompanies 60,266,208 — 60,266,208
Total $ 60,266,208 $ — $ 60,266,208
Net change in unrealizedgain/(loss) related to securitiesstill held as of April 30, 2018: $ 2,775,633 $ (42,700) $ 2,732,933
* Investments fair valued at zero.
Third Avenue TrustNotes to Financial Statements (continued)April 30, 2018 (Unaudited)
42

Quantitative Information about Level 3 Fair Value Measurements(amounts in thousands)
Third Avenue Value FundFair Value at4/30/18
ValuationTechnique(s)
UnobservableInput(s) Range
Corporate Notes $ 3,288 Liquidation Value Liquidation Rate 20% - 85%Other (a) -*
$ 3,288
Third Avenue Small-Cap Value FundFair Value at4/30/18
ValuationTechnique(s)
UnobservableInput(s)
PercentageDiscount on
Restricted Shares
Common Stocks $ 1,520Option Pricing
Model (b) Share Volatility 1.30%
Third Avenue Real Estate Value FundFair Value at4/30/18
ValuationTechnique(s)
UnobservableInput(s)
PercentageDiscount on
Restricted Shares
Common Stocks $ 60,266Option Pricing
Model (b) Share Volatility 0.57%Other (a) -^
$ 60,266
(a) Includes securities less than 0.50% of net assets of the Fund.(b) Represents amounts used when the reporting entity has determined that market participants would take into account
premiums and discounts, as applicable, when pricing the investments.* Amount less than $1,000.^ Investments fair valued at zero.
The significant unobservable inputs used in the fair value measurement of the Funds’investments are listed above. Generally, a change in the assumptions used in any input inisolation may be accompanied by a change in another input. Significant changes in any of theunobservable inputs may significantly impact the fair value measurement. The impact is basedon the relationship between each unobservable input and the fair value measurement.Significant increases (decreases) in liquidation rate or share volatility may increase (decrease)the fair value measurement.
Security transactions and investment income:Security transactions for financial statement purposes are accounted for on a trade date basis.Dividend income is recorded on the ex-dividend date or, for certain foreign dividends, as soonas the Funds become aware of the dividends. Interest income is determined on the basis ofcoupon interest accrued using the effective interest method which adjusts for amortization ofpremiums and accretion of discounts. Dividend income on the Statement of Operations isshown net of any foreign taxes withheld on income from foreign securities. Payments receivedfrom certain investments held by the Funds may be comprised of dividends, capital gains and
Third Avenue TrustNotes to Financial Statements (continued)April 30, 2018 (Unaudited)
43

return of capital. The Funds originally estimate the expected classification of such payments.These amounts may subsequently be reclassified upon receipt of information from the issuer.Realized gains and losses from securities transactions are recorded on an identified cost basis.
Foreign currency translation and foreign investments:The books and records of the Funds are maintained in U.S. dollars. Foreign currency amountsare translated into U.S. dollars as follows:
• Investments and assets and liabilities denominated in foreign currencies: At theprevailing rates of exchange on the valuation date.
• Investment transactions and investment income: At the prevailing rates of exchangeon the date of such transactions.
The net assets of the Funds are presented at market values using the foreign exchange rates at theclose of the period. The Funds do not generally isolate that portion of the results of operationsarising as a result of changes in the foreign exchange rates from the fluctuations arising fromchanges in the market prices of the investments held.
Similarly, the Funds do not isolate the effect of changes in foreign exchange rates from thefluctuations arising from changes in the market prices of investments sold during the period.Accordingly, realized and unrealized foreign currency gains/(losses) are included in the reportednet realized gain/(loss) and unrealized appreciation/(depreciation) on investments transactionsand balances.
Net realized gains/(losses) on foreign currency transactions represent net foreign exchangegains/(losses) from disposition of foreign currencies, currency gains or losses realized betweenthe trade and settlement dates on securities transactions, and the difference between theamount of investment income and foreign withholding taxes recorded on the Funds’ books andthe U.S. dollar equivalent amounts actually received or paid. Net unrealized currencygains/(losses) from valuing foreign currency denominated assets and liabilities at period endexchange rates are reflected as a component of net unrealized appreciation/(depreciation) onthe Statement of Assets and Liabilities. The change in net unrealized currency gains/(losses) forthe period is reflected on the Statement of Operations.
Pursuant to U.S. federal income tax regulations, gains and losses from certain foreign currencytransactions and the foreign currency portion of gains and losses realized on sales and maturitiesof foreign denominated debt securities are generally treated as ordinary income.
Third Avenue TrustNotes to Financial Statements (continued)April 30, 2018 (Unaudited)
44

Payment-in-kind securities (�PIKs�):The Funds may invest in PIKs. PIKs may make a payment at each payment date in either cashor additional securities. Those additional securities usually have the same terms, includingmaturity dates and interest rates, and associated risks as the original securities.The daily marketquotations of the original securities may include the accrued income (referred to as a “dirty”price) and require a pro-rata adjustment from the unrealized appreciation or depreciation oninvestments to dividends and interest receivable on the Statement of Assets and Liabilities.
For the six months ended April 30, 2018, the total in-kind payments with respect to PIKsecurities that were received by theThird Avenue Real Estate Value Fund amounted to $442, orless than 0.01% of total investment income. This amount is included in interest income on theStatement of Operations.
Term loans:The Funds typically invest in loans which are structured and administered by a third partyentity (the “Agent”) that acts on behalf of a group of lenders that make or hold interests in theloan. These securities generally pay interest at rates which are periodically pre-determined byreference to a base lending rate plus a premium.These base lending rates are generally either thelending rate offered by one or more major European banks, such as the London InterbankOffered Rate (LIBOR), or the prime rate offered by one or more major United States banks, orthe certificate of deposit rate.
These securities are ordinarily contractually obligated to receive approval from the Agent bankand/or borrower prior to disposition. Remaining maturities of term loans may be less than thestated maturities shown as a result of contractual or optional payments by the borrower. Suchprepayments cannot be predicted with certainty. The interest rate disclosed reflects the rate ineffect on April 30, 2018.
Forward foreign currency contracts:The Funds may be exposed to foreign currency risks associated with portfolio investments andtherefore may use forward foreign currency contracts to hedge or manage these exposures. TheFunds also may buy forward foreign currency contracts to gain exposure to currencies. Forwardforeign currency contracts are valued at the forward rate and are marked-to-market daily. Thechange in market value is included in unrealized appreciation/(depreciation) on forwardforeign currency contracts. When the contract is closed, the Funds record a realized gain or lossequal to the difference between the value of the contract at the time it was opened and the valueat the time it was closed.
The use of forward foreign currency contracts does not eliminate fluctuations in the underlyingprices of the Funds’ portfolio securities, but it does establish a rate of exchange that can be
Third Avenue TrustNotes to Financial Statements (continued)April 30, 2018 (Unaudited)
45

achieved in the future. Although forward foreign currency contracts limit the risk of loss due toa decline in the value of the hedged currency, they also limit any potential gain that might resultshould the value of the currency increase. In addition, the Funds could be exposed to risks if thecounterparties to the contracts are unable to meet the terms of their contracts.
As of April 30, 2018, the Funds did not hold any forward foreign currency contracts.
Option contracts:The Funds may purchase and sell (“write”) put and call options on various instrumentsincluding investments, indices, and foreign currencies to manage and hedge exchange rate riskswithin their portfolios and also to gain long or short exposure to the underlying instruments.
An option contract gives the buyer the right, but not the obligation, to buy (call) or sell (put)an underlying item at a fixed exercise price on a certain date or during a specified period. Thecost of the underlying instruments acquired through the exercise of a call option is increased bythe premiums paid.The proceeds from the underlying instruments sold through the exercise ofa purchased put option are decreased by the premiums paid. Investments in over-the-counteroption contracts require the Funds to fair value or mark-to market the options on a daily basis,which reflects the change in the market value of the contracts at the close of each day’s trading.The cost of purchased options that expire unexercised are treated by the Funds, on expirationdate, as realized losses on purchased options.
When the Funds write an option, an amount equal to the premium received by the Funds isrecorded as a liability and is subsequently adjusted to the current fair value of the optionwritten. Premiums received from writing options that expire unexercised are treated by theFunds, on the expiration date, as realized gains on written options. The difference between thepremium and the amount paid on effecting a closing purchase transaction, including brokeragecommissions, is also treated as a realized gain, or, if the premium is less than the amount paidfor the closing purchase transaction, as a realized loss. If a call option is exercised, the premiumis added to the proceeds from the sale of the underlying security or currency in determiningwhether the Funds have a realized gain or loss. If a put option is exercised, the premium reducesthe cost basis of the security or currency purchased by the Funds. In purchasing and writingoptions, the Funds bear the market risk of an unfavorable change in the price of the underlyingsecurity or the risk that the Funds may not be able to enter into a closing transaction due to anilliquid market. Exercise of a written option could result in the Funds purchasing a security orcurrency at a price different from the current market value.The Funds may execute transactionsin both listed and over-the-counter options. Listed options involve minimal counterparty risksince listed options are guaranteed against default by the exchange on which they trade. Whenpurchasing over-the-counter options, the Funds bear the risk of economic loss fromcounterparty default, equal to the market value of the option.
Third Avenue TrustNotes to Financial Statements (continued)April 30, 2018 (Unaudited)
46

During the six months ended April 30, 2018, Third Avenue Real Estate Value Fund usedpurchased options on foreign currency for hedging purposes and/or to seek to protect againstlosses in foreign currencies.
During the six months ended April 30, 2018, Third Avenue Real Estate Value Fund usedwritten put options and purchased call options on equities to seek to enhance the yield of theFund.
Summary of derivatives information:The following tables present the value of derivatives held as of April 30, 2018, by their primaryunderlying risk exposure and respective location on the Statement of Assets and Liabilities:
Third Avenue Real Estate Value Fund
Derivative ContractStatement of Assets and
Liabilities Location Options
Assets:Equity contracts Purchased options at value $1,019,221Foreign currency contracts Purchased options at value —
Liabilities:Equity contracts Written options at value $ (162,878)
The following tables present the effect of derivatives on the Statement of Operations during thesix months ended April 30, 2018, by primary risk exposure:
Third Avenue Real Estate Value Fund
Amount of Change in Unrealized Appreciation/(Depreciation) on Derivatives Recognized in Income
Derivative ContractPurchased
OptionsWrittenOptions Total
Equity contracts $481,672(a) $411,393(b) $893,065Foreign currency contracts (26,250)(a) — (26,250)
Total $455,422 $411,393 $866,815
(a) Included in �Net change in unrealized appreciation on purchased options�.(b) Included in �Net change in unrealized appreciation on written options�.
Derivatives volume:The tables below disclose the volume of the Funds’ options activities during the six monthsended April 30, 2018 (amounts denominated in U.S. Dollars unless otherwise noted, exceptnumber of contracts). Please refer to the tables in the Summary of derivatives information for
Third Avenue TrustNotes to Financial Statements (continued)April 30, 2018 (Unaudited)
47

derivative-related gains and losses associated with volume activity (measured at eachmonth-end).
Third AvenueReal EstateValue Fund
OTC Equity Options:Average Number of Contracts - Purchased Options 3,789Average Notional - Purchased Options $ 12,985,686Average Number of Contracts - Written Options 3,789Average Notional - Written Options $ 12,985,686Foreign Currency Options:Average Notional - Purchased Options $ 300,000,000Ending Notional Balance - Purchased Options $ 300,000,000
Floating rate obligations:The Funds may invest in debt securities with interest payments or maturity values that are notfixed, but float in conjunction with an underlying index or price. These securities may bebacked by corporate issuers. The indices and prices upon which such securities can be basedinclude interest rates and currency rates. Floating rate securities pay interest according to acoupon which is reset periodically.
Dividends and distributions to shareholders:The amount of dividends and distributions paid to shareholders from net investment incomeand net realized capital gains on disposition of securities, respectively, is determined inaccordance with U.S. federal income tax law and regulations which may differ from U.S.GAAP. Such dividends and distributions are recorded on the ex-dividend date. The majority ofdividends and capital gains distributions from a Fund may be automatically reinvested intoadditional shares of that Fund, based upon the discretion of the Fund’s shareholders.
Income tax information:The Funds have complied and intend to continue to comply with the requirements of theInternal Revenue Code applicable to regulated investment companies, and each Fund intendsto distribute all of its taxable net investment income and net realized capital gains, if any, to itsshareholders. Therefore, no provision for U.S. federal income taxes is included on theaccompanying financial statements.
Income, including capital gains, from investments in foreign securities received by the Funds
Third Avenue TrustNotes to Financial Statements (continued)April 30, 2018 (Unaudited)
48

may be subject to income, withholding or other taxes imposed by foreign countries.
Management has analyzed the tax positions taken on the Funds’ U.S. federal income tax returnsfor all open tax years (generally the current and prior three tax years), and has concluded that noprovision for U.S. federal income tax is required in the Funds’ financial statements. Thisconclusion may be subject to future review and adjustment at a later date based upon factorsincluding, but not limited to, on-going analyses of and changes to tax laws, regulations andinterpretations thereof. The Funds are subject to possible examination by the relevant taxingauthorities for tax years for which the applicable statutes of limitations have not expired.
Expense allocation:Expenses attributable to a specific Fund are charged to that Fund. Expenses attributable to theTrust are generally allocated using the ratio of each series’ average net assets relative to the totalaverage net assets of the Trust. Certain expenses are shared with the Third Avenue VariableSeries Trust, an affiliated fund. Such costs are allocated using the ratio of the series’ average netassets relative to the total average net assets of each series of theTrust andThird Avenue VariableSeries Trust.
Share class accounting:Investment income, common expenses and realized/unrealized gains/(losses) are allocated tothe three classes of shares of each Fund on the basis of daily net assets of each class. Fees relatingto a specific class are charged directly to that share class.
Trustees’ and officers’ fees:The Trust does not pay any fees to its officers for their services as such, except for the ChiefCompliance Officer and the compliance personnel who report directly to the ChiefCompliance Officer, to whom the Trust paid $234,687, including, $18,123 from ThirdAvenue Focused Credit Fund, for the six month period ended April 30, 2018. The Trust doespay, together withThird Avenue Variable SeriesTrust,Trustees who are not �interested persons�(as defined in the Investment Company Act of 1940) of the Trust (�Independent Trustee�) a feeof $5,000 for each meeting of the Board that each Independent Trustee attends, in addition toreimbursing all Independent Trustees for travel and incidental expenses incurred by them inconnection with their attendance at meetings. If a special meeting is required,Trustees will eachreceive $2,500. The Trust, together with Third Avenue Variable Series Trust, also pays eachIndependent Trustee an annual retainer of $55,000 (the Chairman receives an additionalretainer of $20,000). The Trustees on the Audit Committee each receive $2,000 for each AuditCommittee meeting, and the Audit Committee Chairman receives an annual retainer of$6,000. Prior to his resignation in March 2018, an AdvisoryTrustee received an annual retainerof $27,500 and a fee of $2,500 for each Board meeting he attended.
Third Avenue TrustNotes to Financial Statements (continued)April 30, 2018 (Unaudited)
49

2. INVESTMENTS
Purchases and sales/conversions:The aggregate cost of purchases and aggregate proceeds from sales and conversions ofinvestments, excluding short-term investments, from unaffiliated and affiliated issuers (anaffiliated person as defined in the Investment Company Act of 1940, includes, among otherthings, ownership of 5% or more of the outstanding voting securities of such person) for the sixmonths ended April 30, 2018 were as follows:
Purchases Sales
Third Avenue Value FundAffiliated $ 18,094,639 $ 103,444Unaffiliated 274,740,487 380,427,788
Third Avenue Small-Cap Value FundUnaffiliated 66,058,746 83,792,931
Third Avenue Real Estate Value FundUnaffiliated 212,875,727 207,026,957
Unrealized appreciation/(depreciation):The following information is based upon the book basis of investment securities as of April 30,2018:
Third Avenue ValueFund
Third AvenueSmall-Cap Value
FundThird Avenue RealEstate Value Fund
Gross Unrealized Appreciation $ 288,261,877 $ 81,286,769 $ 651,460,692Gross Unrealized Depreciation (92,808,077) (848,459) (36,812,553)
Net Unrealized Appreciation (Depreciation) $ 195,453,800 $ 80,438,310 $ 614,648,139
Book Cost $ 971,230,038 $ 193,510,785 $ 1,227,255,197
Third Avenue TrustNotes to Financial Statements (continued)April 30, 2018 (Unaudited)
50

3. INVESTMENT ADVISORY SERVICES, ADMINISTRATION AND SERVICE FEE AGREEMENTS AND EXPENSE OFFSETARRANGEMENT
Each Fund has an Investment Advisory Agreement with the Adviser for investment advice andcertain management functions. The terms of the Investment Advisory Agreements provide theannual advisory fees based on the total average daily net assets for the Funds which are indicatedas below. These fees are calculated daily and paid monthly.
Fund
AnnualManagement
Fee
Third Avenue Value Fund 0.90%Third Avenue Small-Cap Value Fund 0.90%Third Avenue Real Estate Value Fund 0.90%
Additionally, the Adviser pays certain expenses on behalf of the Funds, which are partiallyreimbursed by the Funds, including service fees due to third parties, the compensation expensefor the Funds’ Chief Compliance Officer and compliance personnel who report directly to theChief Compliance Officer and other miscellaneous expenses.
The following were amounts payable to the Adviser at April 30, 2018:
Value FundSmall-CapValue Fund
Real EstateValue Fund
Advisory fees $ 868,724 $ 177,798 $ 1,405,883Administration fees 5,365 1,254 8,592Reimbursement for reports to
shareholders expenses 8,980 2,075 12,611Reimbursement for shareholder
servicing fees 95,307 28,027 187,736Reimbursement for Trustees’ and
officers’ fees 5,574 1,303 8,927
Total $ 983,950 $ 210,457 $ 1,623,749
Until March 1, 2019 (subject to renewal), whenever each Fund’s normal operating expenses,including the investment advisory fee and most other operating expenses, but excluding taxes,interest, brokerage commissions, acquired fund fees and expenses, and extraordinary items,exceeds the expense limitation based on each Fund’s average daily net assets, the Adviser hasagreed to waive a portion of its advisory fees and/or reimburse each Fund in an amount equalto that excess. The expense limitations for each Fund are disclosed in its correspondingFinancial Highlights. Below are the corresponding contingent liabilities to the Adviser in effectas of April 30, 2018:
Third Avenue TrustNotes to Financial Statements (continued)April 30, 2018 (Unaudited)
51

Fees Waived/Expenses Reimbursed throughFiscal Periods ending
October 31,2016
October 31,2017
October 31,2018
Subject to Repayment until October 31,
FundExpiration
Date 2019 2020 2021
Third AvenueValue Fund 2/28/2019 $ — $ — $ 9,590
Third AvenueSmall-Cap Value Fund 2/28/2019 171,158 151,026 87,478
The waived fees and reimbursed expenses may be paid to the Adviser during the followingthree-year period after the end of the fiscal year in which a fee is waived or expense reimbursedby the Adviser, to the extent that the payment of such fees and expenses would not cause a Fundto exceed the expense limitations.
The Trust has entered into an Administration Agreement with the Adviser pursuant to whichthe Adviser, as administrator, is responsible for providing various administrative services to theTrust.The Adviser has in turn entered into a Sub-Administration Agreement with BNY MellonInvestment Servicing (U.S.) Inc. (“BNY Mellon”) pursuant to which BNY Mellon providescertain of these administrative services on behalf of the Adviser. Each Fund pays the Adviser afee calculated at an annual rate of 0.0055% of the average daily net assets of each respectiveFund for such services. The Adviser pays BNY Mellon an annual sub-administration fee forsub-administration services provided to theTrust equal to $186,715, including $20,940 relatedto Third Avenue Focused Credit Fund.
Both the Trust and the Adviser have entered into agreements with financial intermediaries toprovide recordkeeping, processing, shareholder communications and other services tocustomers of the intermediaries investing in the Funds and have agreed to compensate theintermediaries for providing those services. Certain of those services would be provided by theFunds if the shares of each customer were registered directly with the Funds’ transfer agent.Accordingly, the Funds have agreed to reimburse a portion of the intermediary fees paid by theAdviser pursuant to provisions adopted by the Board. Each Fund pays a portion of theintermediary fees attributable to shares of the Fund not exceeding the estimated expense theFund would have paid its transfer agent had each customer’s shares been registered directly withthe transfer agent instead of held through the intermediary accounts. The Adviser pays theremainder of the fees. The fees incurred by the Funds are reflected as shareholder servicing feesin the Statement of Operations. For the six months ended April 30, 2018, such fees amountedto $534,557 forThird Avenue Value Fund, $146,731 forThird Avenue Small-Cap Value Fundand $1,041,118 for Third Avenue Real Estate Value Fund.
Third Avenue TrustNotes to Financial Statements (continued)April 30, 2018 (Unaudited)
52

The Funds have an expense offset arrangement in connection with their custodian contract.Credits realized as a result of uninvested cash balances are used to reduce a portion of the Funds’custodian expenses. The following amounts are the reduction of expenses due to thisarrangement for the six months ended April 30, 2018. These amounts are reflected as“Expenses reduced by custodian fee expense offset arrangement” in the Statement ofOperations.
Fund Custody Credit
Third Avenue Value Fund $ 9,936Third Avenue Small-Cap Value Fund 1,772Third Avenue Real Estate Value Fund 14,261
4. RELATED PARTY TRANSACTIONS
Investment in affiliates:A summary of the Funds’ transactions in securities of affiliated issuers for the six months endedApril 30, 2018 is set forth below:
Third Avenue TrustNotes to Financial Statements (continued)April 30, 2018 (Unaudited)
53

Inve
stm
enti
naf
filia
tes
(con
tinue
d)Th
irdAv
enue
Valu
eFu
nd
Nam
eof
Issu
er:
Shar
es/
Prin
cipa
lAm
ount
Held
atOc
t.31
,20
17
Gros
sPu
rcha
ses
and
Addi
tions
Gros
sSa
les
and
Redu
ctio
ns
Shar
es/
Prin
cipa
lAm
ount
Held
atAp
r.30
,20
18Va
lue
atAp
r.30
,201
8In
vest
men
tInc
ome
NetR
ealiz
edGa
in/(L
oss)
NetC
hang
ein
Unre
aliz
edAp
prec
iatio
n(D
epre
ciat
ion)
Hom
ePr
oduc
tsIn
tern
atio
nal,
Inc.
526,
368
--
526,
368
$1
$-
$-
$-
Hom
ePr
oduc
tsIn
tern
atio
nal,
Inc.
,Pre
ferre
dSt
ock,
Serie
sA,
Conv
ertib
le,8
.000
%Ca
shor
Paym
enti
nki
nd14
,316
,215
-1,
477,
0702
12,8
39,1
451
--
-Ho
me
Prod
ucts
Inte
rnat
iona
l,In
c.,2
ndLi
en,
6.00
0%,d
ue12
/20/
2211
,361
,970
--
11,3
61,9
703,
288,
136
282,
484
-(3
,725
,608
)Te
jon
Ranc
hCo
.1,
359,
121
-4,
300
1,35
4,82
132
,962
,795
-24
,424
7,42
2,38
4Tid
ewat
er,I
nc.*
584,
173
913,
0061
-1,
497,
179
51,2
93,3
52-
-12
,038
,010
Tota
lAffi
liate
s$8
7,54
4,28
5$2
82,4
84$2
4,42
4$1
5,73
4,78
6
1Sh
are
incr
ease
incl
udes
corp
orat
eac
tion.
2Sh
are
decr
ease
due
toco
rpor
ate
actio
n.*
Asof
Octo
ber3
1,20
17,n
otan
affil
iate
.
Third
Aven
ueRe
alEs
tate
Valu
eFu
nd
Nam
eof
Issu
er:
Shar
esHe
ldat
Oct.
31,
2017
Gros
sPu
rcha
ses
and
Addi
tions
Gros
sSa
les
and
Redu
ctio
ns
Shar
esHe
ldat
Apr.
30,
2018
Valu
eat
Apr.
30,2
018
Inve
stm
entI
ncom
eNe
tRea
lized
Gain
/(Los
s)
NetC
hang
ein
Unre
aliz
edAp
prec
iatio
n(D
epre
ciat
ion)
Trin
ityPl
ace
Hold
ings
,Inc
.4,
556,
286
--
4,55
6,28
6$2
9,84
3,66
7$
-$
-$
(2,9
61,5
85)
Tota
lAffi
liate
s$2
9,84
3,66
7$
-$
-$
(2,9
61,5
85)
54

Certain employees of the Adviser serve as members of the board of directors of companies inwhich the Funds have investments. As a result of such service, for the six months endedApril 30, 2018, the Funds received the following board member fees from these companies thatboard members employed by the Adviser agreed to have paid directly to the benefit of theFunds. These fees are included in “Other Income” on the accompanying Statement ofOperations.
Fund Fees
Third Avenue Value Fund $ 24,563Third Avenue Small-Cap Value Fund 2,959Third Avenue Real Estate Value Fund 217,165
5. DISTRIBUTION EXPENSES
The Board has adopted a distribution plan (the “Plan”) pursuant to Rule 12b-1 under theInvestment Company Act. The Plan provides that, as compensation for distribution andrelated services provided to Third Avenue Value Fund Investor Class, Third Avenue Small-CapValue Fund Investor Class and Third Avenue Real Estate Value Fund Investor Class, eachFund’s Investor Class accrues a fee calculated at the annual rate of 0.25% of average daily netassets of the class. Such fees may be paid to institutions that provide distribution services. Theamount of fees paid during any period may be more or less than the cost of distribution andother services provided. Financial Industry Regulatory Authority rules impose a ceiling on thecumulative distribution fees paid. The Plan complies with those rules.
For the six months ended April 30, 2018, fees paid pursuant to the Plan were as follows:
Fund Fees
Third Avenue Value Fund $ 16,004Third Avenue Small-Cap Value Fund 5,403Third Avenue Real Estate Value Fund 308,099
Third Avenue TrustNotes to Financial Statements (continued)April 30, 2018 (Unaudited)
55

6. CAPITAL SHARE TRANSACTIONS
Each Fund is authorized to issue an unlimited number of shares of each class of beneficialinterest with $0.001 par value.
Transactions in capital stock of each class were as follows:
Third Avenue Value FundFor the Six Months Ended
April 30, 2018For the Year EndedOctober 31, 2017
Investor Class Investor Class
Shares Amount Shares Amount
Shares sold 9,582 $ 511,640 24,105 $ 1,285,800Shares issued upon
reinvestment ofdividends anddistributions 30,154 1,563,378 20,789 1,055,644
Shares redeemed* (61,962) (3,283,769) (100,220) (5,374,364)Shares issued in
connection with fundreorganization(Note 10) 105,229 5,334,048 — —
Net increase/(decrease) 83,003 $ 4,125,297 (55,326) $ (3,032,920)
For the Six Months EndedApril 30, 2018
For the Year EndedOctober 31, 2017
Institutional Class Institutional Class
Shares Amount Shares Amount
Shares sold 178,108 $ 9,529,745 397,711 $ 21,304,257Shares issued upon
reinvestment ofdividends anddistributions 2,836,852 147,074,137 1,725,485 87,602,868
Shares redeemed* (2,468,849) (131,784,198) (4,233,547) (225,273,293)Shares issued in
connection with fundreorganization(Note 10) 2,370,251 120,140,674 — —
Net increase/(decrease) 2,916,362 $ 144,960,358 (2,110,351) $ (116,366,168)
Third Avenue TrustNotes to Financial Statements (continued)April 30, 2018 (Unaudited)
56

For the Period fromMarch 1, 2018
through April 30, 2018
Z Class
Shares Amount
Shares sold 47 $ 2,500Shares issued upon
reinvestment ofdividends anddistributions 3 162
Net increase 50 $ 2,662
Third Avenue Small-Cap Value FundFor the Six Months Ended
April 30, 2018For the Year EndedOctober 31, 2017
Investor Class Investor Class
Shares Amount Shares Amount
Shares sold 13,976 $ 294,625 34,661 $ 760,125Shares issued upon
reinvestment ofdividends anddistributions 25,510 527,803 20,023 430,279
Shares redeemed* (55,771) (1,215,565) (89,790) (1,969,457)
Net decrease (16,285) $ (393,137) (35,106) $ (779,053)
For the Six Months EndedApril 30, 2018
For the Year EndedOctober 31, 2017
Institutional Class Institutional Class
Shares Amount Shares Amount
Shares sold 150,819 $ 3,262,045 264,897 $ 5,876,158Shares issued upon
reinvestment ofdividends anddistributions 1,587,820 33,264,836 1,200,707 26,031,326
Shares redeemed* (1,594,761) (34,441,909) (3,028,631) (67,137,897)
Net increase/(decrease) 143,878 $ 2,084,972 (1,563,027) $ (35,230,413)
Third Avenue TrustNotes to Financial Statements (continued)April 30, 2018 (Unaudited)
57

For the Period fromMarch 1, 2018
through April 30, 2018
Z Class
Shares Amount
Shares sold 122 $ 2,500
Net increase 122 $ 2,500
Third Avenue Real Estate Value FundFor the Six Months Ended
April 30, 2018For the Year EndedOctober 31, 2017
Investor Class Investor Class
Shares Amount Shares Amount
Shares sold 787,766 $ 26,900,955 1,508,595 $ 48,704,952Shares issued upon
reinvestment ofdividends anddistributions 422,981 14,271,368 114,545 3,447,813
Shares redeemed* (1,405,052) (48,347,387) (2,439,557) (76,845,275)
Net decrease (194,305) $ (7,175,064) (816,417) $ (24,692,510)
For the Six Months EndedApril 30, 2018
For the Year EndedOctober 31, 2017
Institutional Class Institutional Class
Shares Amount Shares Amount
Shares sold 4,316,085 $ 148,316,598 7,496,990 $ 244,162,110Shares issued upon
reinvestment ofdividends anddistributions 2,866,081 97,217,479 839,089 25,374,045
Shares redeemed* (7,015,304) (241,472,731) (13,186,277) (416,184,065)
Net increase/(decrease) 166,862 $ 4,061,346 (4,850,198) $ (146,647,910)
Third Avenue TrustNotes to Financial Statements (continued)April 30, 2018 (Unaudited)
58

For the Period fromMarch 1, 2018
through April 30, 2018
Z Class
Shares Amount
Shares sold 178,745 $ 5,975,433
Net increase 178,745 $ 5,975,433
* Redemption fees are netted with redemption amounts.
Third Avenue Value Fund,Third Avenue Small-Cap Value Fund andThird Avenue Real EstateValue Fund each charge a redemption fee of 1% for shares redeemed or exchanged for shares ofanother series of the Trust within 60 days of the purchase date.
7. COMMITMENTS AND CONTINGENCIES
In the normal course of business, the Funds enter into contracts that contain a variety ofrepresentations and warranties and which provide general indemnifications. The Funds’maximum exposure under these arrangements is unknown, as this would involve future claimsthat may be made against the Funds that have not yet occurred.
8. RISKS RELATING TO CERTAIN INVESTMENTS
Foreign securities and emerging markets risk:Foreign securities from a particular country or region may be subject to currency fluctuationsand controls, or adverse political, social, economic or other developments that are unique tothat particular country or region. Therefore, the prices of foreign securities in particularcountries or regions may, at times, move in a different direction from those of U.S. securities.From time to time, foreign capital markets may exhibit more volatility than those in the U.S.,and the securities markets of emerging market countries can be extremely volatile. Emergingmarket countries can generally have economic structures that are less diverse and mature, andpolitical systems that are less stable, than those of developed countries, and, as a result, thesecurities markets of emerging market countries can be more volatile than more developedmarkets may be.
Third Avenue TrustNotes to Financial Statements (continued)April 30, 2018 (Unaudited)
59

High yield and distressed risk:The Funds’ investments in high-yield debt securities (commonly known as “junk bonds”) anddistressed securities may expose the Funds to greater risks than if the Funds only ownedhigher-grade securities. The value of high-yield, lower quality securities is affected by thecreditworthiness of the issuers of the securities and by general economic and specific industryconditions. The prices of high yield securities can fall in response to negative news about theissuer or its industry, or the economy in general to a greater extent than those of higher ratedsecurities. Issuers of high-yield securities are not as strong financially as those with higher creditratings, so the securities are usually considered speculative investments. These issuers are morevulnerable to financial setbacks and recession than are more creditworthy issuers, which mayimpair their ability to make interest and principal payments. The Funds may also invest indistressed securities, which the Adviser considers to be issued by companies that are, or mightbe, involved in reorganizations or financial restructurings, either out of court or in bankruptcy.The Funds’ investments in distressed securities typically may involve the purchase of high-yieldbonds, bank debt or other indebtedness of such companies.
Debt securities risk:The market value of a debt security may decline due to general market conditions that are notspecifically related to a particular company, such as real or perceived adverse economicconditions, changes in the outlook for corporate earnings, changes in interest or currency ratesor adverse investor sentiment generally. The debt securities market can be susceptible toincreases in volatility and decreases in liquidity. Increases in volatility and decreases in liquiditymay be caused by a rise in interest rates (or the expectation of a rise in interest rates), which areat or near historic lows in the United States and in other countries. During periods of reducedmarket liquidity, a Fund may not be able to readily sell debt securities at prices at or near theirperceived value. If a Fund needed to sell large blocks of debt securities to meet shareholderredemption requests or to raise cash, those sales could further reduce the prices of suchsecurities.
Prices of bonds and other debt securities tend to move inversely with changes in interest rates.Typically, a rise in rates will adversely affect debt securities and, accordingly, will cause the valueof a Fund’s investments in these securities to decline. When interest rates fall, the values ofalready-issued securities generally rise, although investments in new securities may be at loweryields.The prices of high-yield debt securities, unlike investment grade securities, may fluctuateunpredictably and not necessarily inversely with changes in interest rates.
The rates on floating debt instruments adjust periodically with changes in market interest rates.Although these instruments are generally less sensitive to interest rate changes than fixed rateinstruments, the value of floating rate loans and other floating rate securities may decline if their
Third Avenue TrustNotes to Financial Statements (continued)April 30, 2018 (Unaudited)
60

interest rates do not rise as quickly, or as much, as general interest rates. An unexpected increasein Fund redemption requests, including requests from shareholders who may own a significantpercentage of a Fund’s shares, which may be triggered by market turmoil or an increase ininterest rates, could cause the Fund to sell its holdings at a loss or at undesirable prices andadversely affect the Fund’s share price and increase the Fund’s liquidity risk, Fund expensesand/or taxable distributions. Economic and other developments can adversely affect debtsecurities markets.
Market risk:Prices of securities have historically fluctuated. The market value of a security may decline dueto general market conditions that are not related to the particular company, such as real orperceived adverse economic conditions, changes in the outlook for corporate earnings, changesin interest or currency rates or adverse investor sentiment generally. A security’s market valuealso may decline because of factors that affect the particular company, such as managementperformance, financial leverage, and reduced demand for the company’s products or services, orfactors that affect the company’s industry, such as labor shortages or increased production costsand competitive conditions within an industry. The value of the Funds will similarly fluctuateand you could lose money.
Liquidity risk:Liquidity risk exists when particular investments are difficult to sell.The Funds may not be ableto sell these investments at the best prices or at the value the Funds place on them. In such amarket, the value of such investments and a Fund’s share price may fall dramatically, evenduring periods of declining interest rates. Investments that are illiquid or that trade in lowervolumes may be more difficult to value. The market for high-yield debt securities may be lessliquid and therefore these securities may be harder to value or sell at an acceptable price,especially during times of market volatility or decline. Investments in foreign securities tend tohave greater exposure to liquidity risk than U.S. securities. Liquidity can decline unpredictablyin response to overall economic conditions or credit tightening. Investments in private debtinstruments, restricted securities, and securities having substantial market and/or credit riskmay involve greater liquidity risk.
Counterparty risk:The Funds are exposed to counterparty risk, or the risk that an institution or other entity withwhich the Funds have unsettled or open transactions will default. The potential loss to theFunds could exceed the value of the financial assets recorded in the Funds’ financial statements.Financial assets, which potentially expose the Funds to counterparty risk, consist principally ofcash due from counterparties and investments. The Adviser seeks to minimize the Funds’counterparty risk by performing reviews of each counterparty and by minimizing
Third Avenue TrustNotes to Financial Statements (continued)April 30, 2018 (Unaudited)
61

concentration of counterparty risk by undertaking transactions with multiple customers andcounterparties on recognized and reputable exchanges. Delivery of securities sold is only madeonce the Funds have received payment. Payment is made on a purchase once the securities havebeen delivered by the counterparty. The trade will fail if either party fails to meet its obligation.
At April 30, 2018, the Funds had counterparty concentration of credit risk primarily withGoldman Sachs & Co. and JPMorgan Chase Bank, N.A.
The Funds are party to International Swaps and Derivatives Association, Inc. MasterAgreements (“ISDA Master Agreements”) with select counterparties that govern transactions,over-the-counter derivatives and foreign exchange contracts entered into by the Funds andthose counterparties. The ISDA Master Agreements contain provisions for general obligations,representations, agreements, collateral and events of default or termination. Events oftermination include conditions that may entitle counterparties to elect to terminate early andcause settlement of all outstanding transactions under the applicable ISDA Master Agreement.Any election to terminate early could be material to the financial statements of the Funds.
The considerations and factors surrounding the settlement of certain purchases and sales madeon a delayed-delivery basis are governed by Master Securities Forward Transaction Agreements(“Master Forward Agreements”) between the Funds and select counterparties. The MasterForward Agreements maintain provisions for, among other things, initiation and confirmation,payment and transfer, events of default, termination, and maintenance of collateral.
The counterparty risk associated with certain contracts may be reduced by master nettingarrangements to the extent that if an event of default occurs, all amounts with the counterpartyare terminated and settled on a net basis. The Funds’ overall exposure to counterparty risk withrespect to transactions subject to master netting arrangements can change substantially withina short period, as it is affected by each transaction subject to the arrangement.
Collateral requirements:For derivatives traded under an ISDA Master Agreement and/or Master Forward Agreement,the collateral requirements are typically calculated by netting the mark-to-market amount foreach transaction under such agreement and comparing that amount to the value of anycollateral currently pledged by the Fund and the counterparty.
Cash collateral that has been pledged to cover obligations of a Fund and cash collateral receivedfrom the counterparty, if any, is reported separately on the Statement of Assets and Liabilities ascash pledged as collateral and cash received as collateral, respectively. Non-cash collateralpledged by a Fund, if any, is noted in the Portfolio of Investments. Generally, the amount ofcollateral due from or to a party has to exceed a minimum transfer amount threshold (e.g.$500,000) before a transfer is required, which is determined at the close of business of a Fund
Third Avenue TrustNotes to Financial Statements (continued)April 30, 2018 (Unaudited)
62

and any additional required collateral is delivered to/pledged by a Fund on the next businessday. Typically, a Fund and its counterparties are not permitted to sell, re-pledge or use thecollateral they receive.To the extent amounts due to a Fund from its counterparties are not fullycollateralized, contractually or otherwise, a Fund bears the risk of loss from counterpartynon-performance. The Funds attempt to mitigate counterparty risk by entering intoagreements only with counterparties that it believes have the financial resources to honor theirobligations and by monitoring the financial stability of those counterparties.
For financial reporting purposes, the Funds do not offset derivative assets and derivativeliabilities that are subject to netting arrangements in the Statement of Assets and Liabilities.
Third Avenue Real Estate Value FundAt April 30, 2018, the Fund’s derivative assets and liabilities (by type) on a gross basis are asfollows:
Assets LiabilitiesDerivative Financial Instruments:
Options $ 1,019,221 $ (162,878)
Total derivative assets and liabilities in the Statement of Assets andLiabilities 1,019,221 (162,878)
Derivatives not subject to a master netting agreement or similaragreement (�MNA�) — —
Total derivative assets and liabilities subject to a MNA $ 1,019,221 $ (162,878)
The following tables present the Fund’s derivative assets by counterparty net of amountsavailable for offset under a MNA and net of the related collateral received by the Fund as ofApril 30, 2018:
Counterparty
Amount ofAssets
Subject to aMNA by
Counterparty
DerivativesAvailable
for Offset1
Non-cashCollateralReceived2
CashCollateralReceived2
Net Amountof Derivative
Assets3
Goldman Sachs & Co. $ 1,019,221 $ (162,878) $ — $ — $ 856,3431 The amount of derivatives for offset is limited to the amount of assets and/or liabilities that are subject to a MNA.2 Excess of collateral received from the individual counterparty may not be shown for financial reporting purposes.3 Net amount represents the net amount receivable from the counterparty in the event of default.
The following tables present the Fund’s derivative liabilities by counterparty net of amountsavailable for offset under a MNA and net of the related collateral pledged by the Fund as ofApril 30, 2018:
Third Avenue TrustNotes to Financial Statements (continued)April 30, 2018 (Unaudited)
63

Counterparty
Amount ofLiabilities
Subject to aMNA by
Counterparty
DerivativesAvailable
for Offset1
Non-cashCollateralPledged2
CashCollateralPledged2
Net Amountof DerivativeLiabilities3
Goldman Sachs & Co. $ (162,878) $ 162,878 $ — $ — $ —1 The amount of derivatives for offset is limited to the amount of assets and/or liabilities that are subject to a MNA.2 Excess of collateral pledged to the individual counterparty may not be shown for financial reporting purposes.3 Net amount represents the net amount payable to the counterparty in the event of default.
Loans and other direct debt instruments:The Funds may invest in loans and other direct debt instruments issued by corporateborrowers. These loans represent amounts owed to lenders or lending syndicates (loans andloan participations) or to other parties. Direct debt instruments may involve a risk of loss in caseof default or insolvency of the borrower and may offer less legal protection to the Fund in theevent of fraud or misrepresentation. In addition, loan participations involve a risk of insolvencyof the lending bank or other financial intermediary. The markets in loans are not regulated byfederal securities laws or the SEC.
Cash concentration:The Funds’ cash balances are held at a major regional U.S. bank, JPMorgan Chase Bank, N.A.The Funds’ cash balances, which typically exceed Federal Deposit Insurance Corporationinsurance coverage, subject the Funds to a concentration of credit risk. The Funds regularlymonitor the credit ratings of this financial institution in order to mitigate the credit risk thatexists with the balances in excess of insured amounts.
Off-balance sheet risk:The Funds enter into derivatives which may represent off-balance sheet risk. Off-balance sheetrisk exists when the maximum potential loss on a particular investment is greater than the valueof such investment as reflected in the Statement of Assets and Liabilities.
Focused investing:The Funds hold relatively concentrated portfolios that may contain fewer securities orindustries than the portfolios of other mutual funds. Holding a relatively concentratedportfolio may increase the risk that the value of a Fund could decrease because of the poorperformance of one or a few investments. Concentrated positions may be difficult to liquidate.
Third Avenue TrustNotes to Financial Statements (continued)April 30, 2018 (Unaudited)
64

9. FEDERAL INCOME TAXES
The amount of dividends and distributions paid by the Funds from net investment income andnet realized capital gains are determined in accordance with U.S. federal income tax law andregulations which may differ from U.S. GAAP. Such dividends and distributions are recordedby the Funds on the ex-dividend date. In order to present accumulated undistributed netinvestment income (loss), accumulated net realized gain (loss) on investments and foreigncurrency transactions and capital stock on the Statement of Assets and Liabilities that moreclosely represent their tax character, certain adjustments have been made. “Book/tax”differences are either temporary or permanent in nature. To the extent these differences arepermanent in nature, such amounts are reclassified within the capital accounts based on theirtax-basis treatment. Temporary differences do not require reclassification. Permanentdifferences are primarily due to reclassification of certain transactions involving foreignsecurities and currencies, investments in passive foreign investment companies, real estateinvestment trusts (“REITs”) and partnerships, the difference in the treatment of amortizationof discount on certain debt instruments, certain derivative instruments and other book to taxadjustments. Net investment income (loss), net realized capital gain (loss) on investments andforeign currency transactions and net assets were not affected by these changes.
The book and tax unrealized appreciation/(depreciation) calculation differs. The difference isprimarily attributable to deferred losses on wash sales, mark-to-market treatment ofinvestments in certain passive foreign investment companies, investments in REITs andpartnerships, differences in the treatment of amortization of discount on certain debtinstruments, and other timing differences. Other cost basis adjustments are primarilyattributable to unrealized appreciation/(depreciation) on certain derivatives and items relatedto other miscellaneous investments.
10. BUSINESS COMBINATIONS
On March 9, 2018, shareholders of Third Avenue International Value Fund (the �TargetFund�) approved the Plan of Reorganization of the Target Fund into Third Avenue Value Fund(the “Acquiring Fund”). The purpose of the transaction was to combine two portfolios withsimilar investment objectives and strategies.
The reorganization was effective after the close of business on March 16, 2018 (the “EffectiveTime”). The Acquiring Fund acquired all of the assets and assumed all of the liabilities of theTarget Fund. The transaction was structured to qualify as a tax-free reorganization under theInternal Revenue Code of 1986. Pursuant to the Agreement and Plan of Reorganization,Investor Class and Institutional Class shareholders of the Target Fund received a number ofshares of the corresponding class in the Acquiring Fund, with a value equal to their holdings in
Third Avenue TrustNotes to Financial Statements (continued)April 30, 2018 (Unaudited)
65

the Target Fund as of the Effective Time. The investment portfolio of the Target Fund, with afair value of approximately $119,272,103 and identified cost of approximately $109,459,033as of the Effective Time, was the principal asset acquired by the Acquiring Fund. For financialstatement purposes, assets received and shares issued by the Acquiring Fund were recorded atfair value; however, the cost basis of the investments received from theTarget Fund were carriedover to the Acquiring Fund. As of the Effective Time, the Target Fund had a net long termcapital loss carryforward of $21,072,221.The Acquiring Fund will succeed to this carryforwardamount. Although there is no expiration date on the use of the carryforward, the AcquiringFund will be subject to certain annual limitations on its use.
The following is a summary of Shares Outstanding, Net Assets, Net Asset Value Per Share andNet Unrealized Appreciation (Depreciation) immediately before and after the reorganization:
SharesOutstanding
NetAssets
Net AssetValue
Per Share
Net UnrealizedAppreciation
(Depreciation)Target Fund $ 9,813,070
Investor Class 267,743 $ 5,334,048 $19.92Institutional Class 6,064,342 120,140,674 19.81
Acquiring Fund 215,620,235Investor Class 225,500 11,430,625 50.69Institutional Class 21,214,441 1,075,294,105 50.69Z Class 50 2,544 50.69
Post Reorganization 225,433,305Investor Class 330,729 16,764,673 50.69Institutional Class 23,584,692 1,195,434,779 50.69Z Class 50 2,544 50.69
Expenses related to the reorganization were incurred by the Adviser, with the exception oftransaction expenses which include, but are not limited to, trade commissions, related fees andtaxes, and any foreign exchange spread costs, where applicable, related to the purchase and saleof securities associated with the reorganization.
Assuming the reorganization had been completed on November 1, 2017, the beginning of thereporting period, the pro forma results of operations for the period ended April 30, 2018 are asfollows:
Net investment income (loss) $12,218,044Net realized/unrealized gains(losses) $36,858,571
Change in net assets resulting from operations $49,076,615
Third Avenue TrustNotes to Financial Statements (continued)April 30, 2018 (Unaudited)
66

Because the combined investment portfolios have been managed as a single integrated portfoliosince the reorganization was completed, it is not practicable to separate the amounts of revenueand earnings of the Target Fund that have been included on the Statement of Operations sinceMarch 16, 2018.
11. SUBSEQUENT EVENTS
Management has evaluated the impact of all subsequent events on the Funds through the datethe financial statements were issued, and has determined that there were no events requiringrecognition or disclosure in the Funds’ financial statements.
Third Avenue TrustNotes to Financial Statements (continued)April 30, 2018 (Unaudited)
67

As a shareholder of a Fund, you incur two types of costs: (1) transaction costs, such asredemption fees; and (2) ongoing costs, including management fees, shareholder servicingfees, distribution fees (if applicable) and other Fund expenses. This example is intended to helpyou understand your ongoing costs (in dollars) of investing in the Funds and to compare thesecosts with the ongoing costs of investing in other mutual funds.
The example is based on an investment of $1,000 invested at the beginning of the period,November 1, 2017 and held for the six month period ended April 30, 2018. The Z class sharesactual account values and expense ratios are calculated from March 1, 2018, through April 30,2018.
Actual ExpensesFor each Class of each Fund in the table below, the first line provides information about actualaccount values and actual expenses. You may use the information in this line, together with theamount you invested, to estimate the expenses that you paid over the period. Simply divideyour account value by $1,000 (for example, an $8,600 account value divided by $1,000 = 8.6),then multiply the result by the number in the first line under the heading entitled “ExpensesPaid During the Period” to estimate the expenses you paid on your account during this period.
Hypothetical Example for Comparison PurposesThe second line of each Class in the table below provides information about hypotheticalaccount values and hypothetical expenses based on the Class’ actual expense ratio and anassumed rate of return of 5% per year before expenses, which is not the Class’ actual return.The hypothetical account values and expenses may not be used to estimate the actual endingaccount balance or expenses you paid for the period. You may use this information to comparethe ongoing costs of investing in the Class of the Fund and other funds. To do so, compare this5% hypothetical example with the 5% hypothetical examples that appear in the shareholderreports of the other funds.
Please note that the expenses shown in the table are meant to highlight your ongoing costs onlyand do not reflect any transactional costs, such as redemption fees. Therefore, the second lineof each Class in the table is useful in comparing ongoing costs only, and will not help youdetermine the relative total costs of owning different funds. In addition, if these transactionalcosts were included, your costs would have been higher. The example also assumes alldividends and distributions have been reinvested.
Third Avenue TrustSchedule of Shareholder Expenses(Unaudited)
68
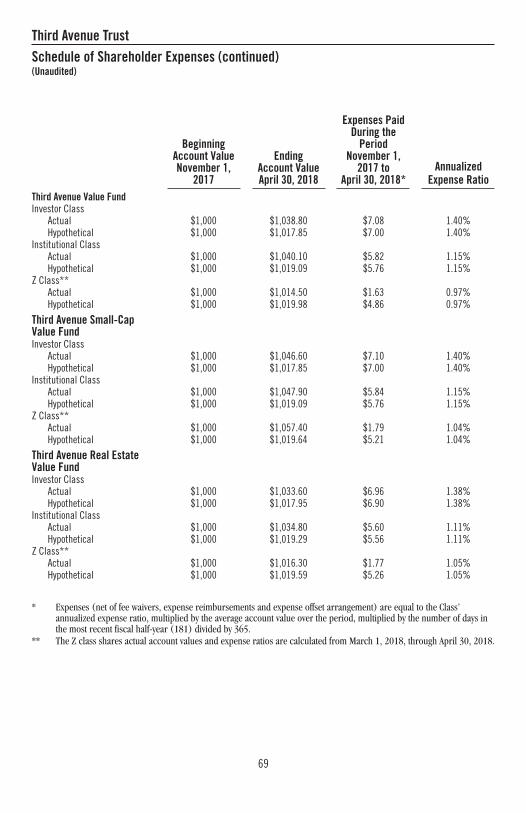
BeginningAccount ValueNovember 1,
2017
EndingAccount ValueApril 30, 2018
Expenses PaidDuring the
PeriodNovember 1,
2017 toApril 30, 2018*
AnnualizedExpense Ratio
Third Avenue Value FundInvestor Class
Actual $1,000 $1,038.80 $7.08 1.40%Hypothetical $1,000 $1,017.85 $7.00 1.40%
Institutional ClassActual $1,000 $1,040.10 $5.82 1.15%Hypothetical $1,000 $1,019.09 $5.76 1.15%
Z Class**Actual $1,000 $1,014.50 $1.63 0.97%Hypothetical $1,000 $1,019.98 $4.86 0.97%
Third Avenue Small-CapValue FundInvestor Class
Actual $1,000 $1,046.60 $7.10 1.40%Hypothetical $1,000 $1,017.85 $7.00 1.40%
Institutional ClassActual $1,000 $1,047.90 $5.84 1.15%Hypothetical $1,000 $1,019.09 $5.76 1.15%
Z Class**Actual $1,000 $1,057.40 $1.79 1.04%Hypothetical $1,000 $1,019.64 $5.21 1.04%
Third Avenue Real EstateValue FundInvestor Class
Actual $1,000 $1,033.60 $6.96 1.38%Hypothetical $1,000 $1,017.95 $6.90 1.38%
Institutional ClassActual $1,000 $1,034.80 $5.60 1.11%Hypothetical $1,000 $1,019.29 $5.56 1.11%
Z Class**Actual $1,000 $1,016.30 $1.77 1.05%Hypothetical $1,000 $1,019.59 $5.26 1.05%
* Expenses (net of fee waivers, expense reimbursements and expense offset arrangement) are equal to the Class’annualized expense ratio, multiplied by the average account value over the period, multiplied by the number of days inthe most recent fiscal half-year (181) divided by 365.
** The Z class shares actual account values and expense ratios are calculated from March 1, 2018, through April 30, 2018.
Third Avenue TrustSchedule of Shareholder Expenses (continued)(Unaudited)
69

BOARD OF TRUSTEESWilliam E. Chapman, II
Lucinda FranksEdward J. KaierEric Rakowski
Patrick ReinkemeyerCharles C. Walden — Chairman
OFFICERSW. James Hall III — President, General Counsel, Secretary
Michael A. Buono — Chief Financial Officer, TreasurerJoseph J. Reardon — Chief Compliance Officer
TRANSFER AGENTBNY Mellon Investment Servicing (U.S.) Inc.
P.O. Box 9802Providence, RI 02940-8002
610-239-4600800-443-1021 (toll-free)
INVESTMENT ADVISERThird Avenue Management LLC
622 Third AvenueNew York, NY 10017
INDEPENDENT REGISTERED PUBLIC ACCOUNTING FIRMPricewaterhouseCoopers LLP
300 Madison AvenueNew York, NY 10017
CUSTODIANJPMorgan Chase Bank, N.A.
383 Madison AvenueNew York, NY 10179
Third Avenue offers multiple investment solutions withunique exposures and return profiles. Our core strategiesare currently available through ’40Act mutual funds andcustomized accounts. If you would like further information,please contact a Relationship Manager at:
www.thirdave.com
/third-ave-management
622 Third Avenue
New York, NY 10017
212.906.1160