third quarter - textile.squaregroup.com fs- q3 2018-19 web (full).pdf · third quarter financial...
TRANSCRIPT
Third Quarter Financial Statement 2018-2019
(Unaudited)
SQUARE TEXTILES LIMITED
(Consolidated and Separate)

Particulars Notes 31-Mar-19 30-Jun-18
Taka Taka
ASSETS:Non-Current Assets 6,560,708,556 5,850,815,043
Property, Plant & Equipment- Carrying Value 02 5,085,713,939 4,369,283,667
Capital Work In Progress 1,418,710,857 1,425,247,616
Goodwill 56,283,760 56,283,760
Current Assets 6,530,409,791 5,708,002,400
Inventories 03 3,267,904,676 2,117,499,335
Accounts Receivable 04 2,644,535,231 2,537,386,382
Advances, Deposits & Prepayments 05 358,929,437 457,007,961
Cash & Cash Equivalents 06 259,040,447 596,108,722
TOTAL ASSETS 13,091,118,347 11,558,817,443
SHAREHOLDERS' EQUITY & LIABILITIES:Shareholders' Equity 7,424,387,816 7,444,414,383
Share Capital 1,972,520,000 1,878,590,480
Retained Earnings 5,451,867,816 5,565,823,903
Non controlling Interest 07 14,979,993 23,924,714
Non-Current LiabilitiesDeferred Tax Liability 08 248,379,338 222,054,637
Current Liabilities & Provisions 5,403,371,200 3,868,423,709
Short Term Bank Loan (Secured) 09 3,922,550,575 3,416,687,761
Creditors & Others Payable 10 91,516,396 131,402,995
Liabilities for Other Finance 11 149,005,838 136,623,950
Short Term Loan 12 1,020,376,322 1,385,741
Provision for Income Tax 13 219,922,069 182,323,262
TOTAL SHAREHOLDERS' EQUITY & LIABILITIES 13,091,118,347 11,558,817,443
Net Asset Value Per Share (Restated) 37.64 37.74
Attached notes form parts of these Financial Statements.
Sd/- Sd/- Sd/-
Tapan Chowdhury Ratna Patra Samuel S Chowdhury
Chairman Vice Chairman Managing Director
Sd/- Sd/-
Md. Alamgir Hossain Sanjib Baran Roy
Chief Financial Office Company Secretary
SQUARE Textiles Limited & It's SubsidiaryConsolidated Statement of Financial Position (Unaudited)
As at March 31, 2019

Particulars NOTE July to March July to March January to March January to March
2018-19 2017-18 2018-19 2017-18
Sales Revenue 14 7,194,618,151 6,451,587,856 2,441,651,126 2,342,964,381
Cost of Goods Sold 15 6,381,519,794 5,804,596,714 2,150,809,231 2,103,701,567
Gross Profit 813,098,357 646,991,142 290,841,895 239,262,814
Administrative Overhead 16 188,493,875 179,996,822 64,211,826 56,697,766
Selling and Distribution Overhead 17 10,354,108 9,192,752 3,174,283 5,764,913
Profit from Operations 614,250,374 457,801,568 223,455,786 176,800,135
Finance Cost 176,075,785 72,433,840 70,719,079 35,412,195
Non-Operating Income 3,869,702 2,550,880 919,148 1,583,913
Profit Before W.P.P.F & W.F 442,044,291 387,918,608 153,655,855 142,971,853
Allocation for W.P.P.F & W.F 21,049,727 18,472,315 7,316,945 6,808,183
Profit Before Tax 420,994,564 369,446,293 146,338,910 136,163,670
Provision for Tax (Current) 37,598,806 48,118,810 18,512,690 16,789,703
Provision for Tax (Deferred) 26,324,701 7,975,450 3,509,724 3,990,566
Profit After Tax for The Period 357,071,057 313,352,033 124,316,496 115,383,401
Non-Controlling Interest 1,379,528 1,036,143 301,490 198,488
Net Income for the Period 355,691,529 312,315,890 124,015,006 115,184,913
(Transferred to the Statement of Changes in Equity)
Earnings Per Share (EPS)- Restated 18 1.80 1.58 0.63 0.58
Attached notes form parts of these Financial Statements.
Sd/- Sd/- Sd/-
Tapan Chowdhury Ratna Patra Samuel S Chowdhury
Chairman Vice Chairman Managing Director
Sd/- Sd/-
Md. Alamgir Hossain Sanjib Baran Roy
Chief Financial Office Company Secretary
Third Quarter Results (Tk)
SQUARE Textiles Limited & It's Subsidiary
Consolidated Statement of Profit or Loss and Other Comprehensive Income (Unaudited)
For the 3rd Quarter Ended March 31, 2019
Nine Months Results (Tk)

Particulars Share CapitalRetained
EarningsTotal
Balance as at June 30, 2018 1,878,590,480 5,565,823,903 7,444,414,383
Net Profit for the 3rd Quarter Ended March 31, 2019 - 355,691,529 355,691,529
Cash Dividend for 2017-18 - (375,718,096) (375,718,096)
Stock Dividend for 2017-18 93,929,520 (93,929,520) -
Balance As at March 31, 2019 1,972,520,000 5,451,867,816 7,424,387,816
Particulars Share CapitalRetained
EarningsTotal
Balance as at June 30, 2017 1,789,133,790 5,556,051,868 7,345,185,658
Net Profit for the 3rd Quarter Ended March 31, 2018 - 312,315,890 312,315,890
Cash Dividend for 2016-17 - (357,826,758) (357,826,758)
Stock Dividend for 2016-17 89,456,690 (89,456,690) -
Balance As at March 31, 2018 1,878,590,480 5,421,084,310 7,299,674,790
Sd/- Sd/- Sd/-
Tapan Chowdhury Ratna Patra Samuel S Chowdhury
Chairman Vice Chairman Managing Director
Sd/- Sd/-
Md. Alamgir Hossain Sanjib Baran Roy
Chief Financial Office Company Secretary
Consolidated Statement of Changes in Equity (Unaudited)For the 3rd Quarter Ended March 31, 2018
SQUARE Textiles Limited & It's Subsidiary
Consolidated Statement of Changes in Equity (Unaudited)For the 3rd Quarter Ended March 31, 2019

Particulars
Cash Flows from Operating Activities:
Receipts from Sales Revenue 7,087,469,302 6,062,908,131
Exchange Fluctuation Gain 3,654,099 2,170,984
Receipts from Other Income 215,603 379,896
Total Receipts 7,091,339,004 6,065,459,011
Payments to Suppliers (5,839,286,340) (4,388,818,373)
Paid for Operating & Non-operating Expenses (1,456,698,237) (1,558,878,917)
Interest Expenses Paid (144,392,027) (61,281,583)
Income Tax Paid (42,480,935) (47,007,907)
Total Payments (7,482,857,539) (6,055,986,780)
Net Cash Generated (Used in) from Operating Activities (391,518,535) 9,472,231
Cash Flows from Investing Activities:
Sales (Purchase) of Property, Plant & Equipment (1,075,890,976) (722,955,290)
Paid for Non controlling Interest for Merger of SYL (9,287,050) -
Net Cash Generated (Used in) from Investing Activities (1,085,178,026) (722,955,290)
Cash Flows from Financing Activities:
Short Term Bank Loan Received/ (Repaid) 505,862,814 649,571,810
Short Term Loan from/ (To) Sister Company 1,009,483,568 20,598,244
Payment of Dividend (375,718,096) (357,826,758)
Net Cash Generated (Used in) from Financing Activities 1,139,628,286 312,343,296
Increase/ (Decrease) in Cash & Cash Equivalents (337,068,275) (401,139,763)
Opening Cash & Cash Equivalents 489,666,295 862,921,763
Cash Balance of SYL from Merger 106,442,427 -
Closing Cash & Cash Equivalents 259,040,447 461,782,000
Net Operating Cash Flows Per Share(Restated) (1.98) 0.05
Sd/- Sd/- Sd/-
Tapan Chowdhury Ratna Patra Samuel S Chowdhury
Chairman Vice Chairman Managing Director
Sd/- Sd/-
Md. Alamgir Hossain Sanjib Baran Roy
Chief Financial Office Company Secretary
Amount (Tk)
SQUARE Textiles Limited & It's Subsidiary
Consolidated Statement of Cash flows (Unaudited)
For the 3rd Quarter Ended March 31, 2019
July to March
2017-18
July to March
2018-19

02. Consolidated Property, Plant & Equipment: Tk. 5,085,713,939
31-Mar-19 30-Jun-18
Fixed Assets at Cost
Opening Balance 8,813,079,842 8,561,946,086
Addition during the Year 1,095,715,178 265,969,327
Addition of SYL before Merger 754,057 -
Sale/ Obsolete during the Year (219,837,243) (14,835,571)
Closing Balance(Cost) 9,689,711,834 8,813,079,842
Details of Property, Plant & Equipment and Depreciation as at March 31, 2019 are as below:
SQUARE TEXTILES LIMITED AND ITS SUBSIDIARIES
Notes to the Consolidated Interim Financial Statements (Unaudited)For The 3rd Quarter Ended March 31, 2019
These Financial Statements (They) are the unaudited consolidated interim financial statements (hereafter ”The Consolidated
Interim Financial Statements”) of Square Textiles Limited and Square Texcom Limited, Companies incorporated in Bangladesh
under Companies Act 1913 & 1994, for the 3rd quarter ended March 31, 2019 (hereafter “The Interim Period’). They are
prepared in accordance with the International Accounting Standard (IAS 34) “Interim Financial Reporting”. These financial
statements should read in conjunction with the Annual Financial Statements as on June 30, 2018, as they provide an update of
previously reported information.
01. Basis of preparation of the Consolidated Interim Financial Statements:
The Company has no reportable operating segments as per requirement of IFRS-8, “Operating Segment”.
Figures have been rounded off to the nearest Taka.
The accounting policies and presentation used are consistent with those used in the Annual Financial Statements, except
where noted below. Where necessary, the comparatives have been reclassified or extended from the previously reported
Interim Financial Statements to take into account any presentational changes made in the Annual Financial Statements or in
these Interim Financial Statements.
The preparation of the financial statements requires management to make estimates and assumptions that affect the reported
amounts of revenue, expenses, assets, liabilities and disclosure of contingent liabilities at the date of the Interim Financial
Statements. If in the future such estimates and assumptions, which are based on management’s best judgment at the date of
the interim financial statements, deviate from the actual circumstances, the original estimates and assumptions will be modified
as appropriate in the period in which the circumstances change.
We understand that our business is growing every year that means our assets are performing according to intention of
procurement and in sum up the discounted future cash flow from the operation of the assets would be positive if we dispose
those assets at the date of financial reporting. But presently we have on intension to dispose these assets, so it is not required
to record the impairment gain as provisions of IAS-36.
The company operates in industries where significant seasonal or cyclical variations in total sales are not experienced during
the reporting period.
There is no significant even after the end of the interim period that has to be reflected in the Consolidated Financial Statements
for the interim period except.
As per verdict of Hon'ble High Court, Square Yarns Limited (SYL) merged with Square Textiles Limited (STxL) with effect from
January 01, 2019. These financials include business result and financial positions of Square Yarns Limited (SYL) for the period
ended on December 31, 2018 to give clear understanding and comparability with last year published un-audit consolidated third
quarterly (March 31, 2018) report of Square Textiles Limited.

31-Mar-19 30-Jun-18
Accumulated Depreciation
Opening Balance 4,443,796,175 4,047,294,966
Charged during the Year 308,709,877 409,249,836
Charged of SYL before Merger 57,287,587 -
Adjustment for sale/Obsolete (205,795,744) (12,748,627)
4,603,997,895 4,443,796,175
Carrying Value Tk. 5,085,713,939 4,369,283,667
03. Consolidated Inventories: Tk. 3,267,904,676
Stocks of Raw Materials 3,000,616,035 1,851,301,619
Raw Materials 2,454,826,582 1,316,945,017
Raw Materials In Transit 162,468,776 253,946,100
Packing Materials 41,931,735 13,842,823
Work - in - process 97,785,117 73,007,237
Finished Goods 243,603,825 193,560,442
Stocks of Spares 267,288,641 266,197,716
Spares at Store 262,062,810 239,896,287
Spares in Transit 5,225,831 26,301,429
Tk. 3,267,904,676 2,117,499,335
04. Consolidated Accounts Receivable: Tk. 2,644,535,231
Aging of the above balance is as follows:
Below 60 days 1,247,577,508 1,043,624,024
Within 61-120 days 1,051,887,804 1,194,206,454
Above 120 days 345,069,919 299,555,904
Tk. 2,644,535,231 2,537,386,382
05. Consolidated Advances, Deposits & Prepayments: Tk. 358,929,437
This is made up of the followings:
Advance 276,326,256 375,973,570
Income Tax 195,522,059 153,041,124
Salary & PF Current account 1,359,000 2,244,602
Other Expenses 11,766,252 21,702,776
Suppliers & Contractor 67,678,945 198,985,068
Deposits
82,603,181 81,034,391
Security Deposit 73,798,648 70,924,398
Margin on Bank Guarantee 8,804,533 10,109,993
Tk. 358,929,437 457,007,961
a) There was no amount due from the Directors (Including Managing Director), Managing Agent, Manager and other Officers
of the Company and any of them severally or jointly with any other person.
b) The carrying amount of Trade Debtors pledged as security.
c) Accounts Receivable is secured, considered as good and is falling due within one year. Classification schedule as required
by Schedule XI of Companies Act 1994.

31-Mar-19 30-Jun-18
06. Consolidated Cash & Cash Equivalents: Tk. 259,040,447
This is made up of the followings:
Cash in hand 5,542,548 7,535,794
Cash at Bank 253,497,899 588,572,928
Tk. 259,040,447 596,108,722
07. Non Controlling Interest:Tk. 14,979,993
5,000 shares of Tk 100 at par of Square Yarns Limited - 500,000
5,000 shares of Tk 100 at par of Square Texcom Ltd. 500,000 500,000
Shares of Accumulated Profit 14,479,993 22,924,714
14,979,993 23,924,714
08. Consolidated Deferred Tax Liability: Tk. 248,379,338
Opening Balance 222,054,637 203,277,250
Deferred tax Adjustment/ Assets - (5,346,547)
Adjustment of SYL Before Merger (4,325,444) -
Deferred tax Liabilities 30,650,145 24,123,934
Closing Balance Tk. 248,379,338 222,054,637
09. Consolidated Short Term Bank Loan (Secured): Tk. 3,922,550,575
Bank Overdraft 4,078,792 5,569,544
Revolving Loan 800,000,000 -
Deferred LC Loan 3,118,471,783 3,411,118,217
Tk. 3,922,550,575 3,416,687,761
10. Consolidated Creditors & Others Payable: Tk. 91,516,396
Creditors & Others Payable 91,516,396 131,402,995
91,516,396 131,402,995
11. Consolidated Liabilities for Other Finance: Tk. 149,005,838
Retention Money 1,781,837 1,781,837
WPPF & Other Fund 17,229,294 27,128,907
Others 129,994,707 107,713,206
Tk. 149,005,838 136,623,950
12. Consolidated Short Term Loan: Tk. (1,020,376,322)
Loan To (From) Sqaure Pharma. Ltd. (1,020,376,322) (1,385,741)
Short Term Loan Received Tk. (1,020,376,322) (1,385,741)
This represents amount payable to regular suppliers of packing materials, utilities, and other services rendered to the
company. All suppliers were paid on a regular basis.
This represents tax liability payable in future due to accumulated taxable temporary differences (Above deferred tax balance
create only from difference between accounting basis depreciation and tax basis depreciation on fixed assets).
These short term loans are secured against hypothecation of Stock and Accounts Receivable.

31-Mar-19 30-Jun-18
13. Consolidated Provision for Income Tax: Tk. 219,922,069
Opening Balance 182,323,262 368,938,056
Adjustment with Advance Tax - (250,943,247)
Provision of SYL Before Merger 15,878,889 -
Provision made for the period 21,719,918 64,328,453
Closing Balance Tk. 219,922,069 182,323,262
July-March
2018-19
July-March 2017-
18
14. Consolidated Sales Revenue: Tk. 7,194,618,151
Export Sale of Yarns 7,194,618,151 6,451,587,856
Tk. 7,194,618,151 6,451,587,856
15. Consolidated Cost of Goods Sold: Tk. 6,381,519,794
Raw Materials Consumed 4,656,600,407 4,073,501,430
Factory Overhead 1,724,919,387 1,731,095,284
Cost of Goods Sold Tk. 6,381,519,794 5,804,596,714
16. Consolidated Administrative Overhead: Tk. 188,493,875
Salary and Allowances 91,713,568 90,122,812
Directors' Remuneration 29,963,067 26,824,347
Overseas Travelling 25,800,660 20,468,447
Vehicles Running & Maintenance 7,671,219 11,546,481
Fees & Subscription 10,168,524 8,954,401
Rental Expenses 9,758,709 7,902,510
Office Consumable Expense 2,081,993 1,983,069
Electricity, Gas & Water 2,786,162 1,570,672
Software & Hardware Support Expenses 1,822,028 2,067,041
Head Office Employees' Free Lunch 982,523 1,873,051
Annual General Meeting Expenses 356,970 1,534,445
Other Expenses 5,388,452 5,149,546
Total Tk. 188,493,875 179,996,822
17. Consolidated Selling & Distribution Overhead: Tk. 10,354,108
Export Sale Expenses 6,755,894 7,326,287
Loading & unloading 3,598,214 1,866,465
Total Tk. 10,354,108 9,192,752
18. Consolidated Earnings Per Share (EPS):
Tk. 355,691,529 312,315,890 Number of Ordinary
shares 197,252,000 197,252,000
Earnings Per Share Tk. 1.80 1.58
Earning attributable to Ordinary Shares including other
income
The company has completed Vortex project at Habiganj and started commercial production from July 2018, which generated
additional revenue with capacity of around 10/ton per day.
During the period sales increased by BDT 74.30 (11.52%) crore due to incremental production in Vortex project at Habiganj.

19. Regarding Consolidated Net Operating Cash Flows per Share:
The business (100% export oriented spinning industry) operation is volatile and realization from debtors (100% confirmed back
to back LC) also very positively co-related with this, but all import payments should be made as per provision of UCPDC-600,
resultant, the per share operating cash flows fluctuates from quarter to quarter, which is very common for the spinning
business trend. During the period under review cash flows from operating activities declined due to increase of inventory by
TK.115.04 crore and debtor’s by TK.10.71 crore for additional production capacity in Vortex project at Habiganj and seasonal
inventory procurement.
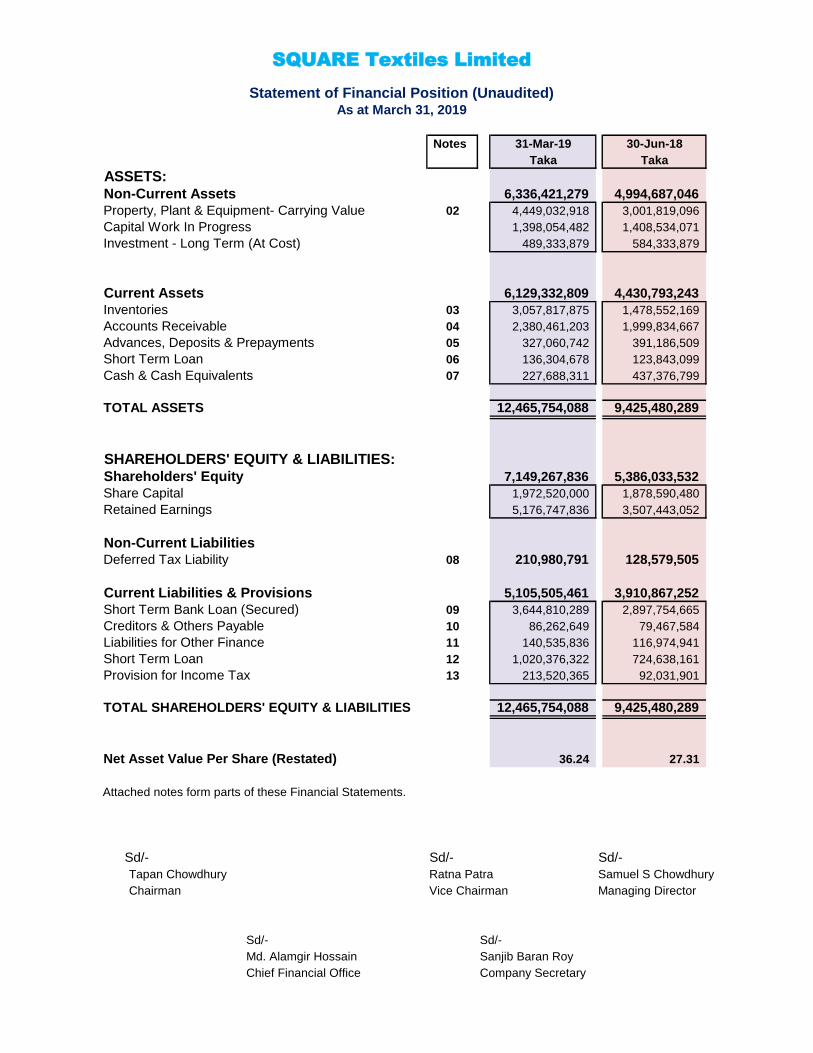
Notes 31-Mar-19 30-Jun-18
Taka Taka
ASSETS:Non-Current Assets 6,336,421,279 4,994,687,046
Property, Plant & Equipment- Carrying Value 02 4,449,032,918 3,001,819,096
Capital Work In Progress 1,398,054,482 1,408,534,071
Investment - Long Term (At Cost) 489,333,879 584,333,879
Current Assets 6,129,332,809 4,430,793,243
Inventories 03 3,057,817,875 1,478,552,169
Accounts Receivable 04 2,380,461,203 1,999,834,667
Advances, Deposits & Prepayments 05 327,060,742 391,186,509
Short Term Loan 06 136,304,678 123,843,099
Cash & Cash Equivalents 07 227,688,311 437,376,799
TOTAL ASSETS 12,465,754,088 9,425,480,289
SHAREHOLDERS' EQUITY & LIABILITIES:Shareholders' Equity 7,149,267,836 5,386,033,532
Share Capital 1,972,520,000 1,878,590,480
Retained Earnings 5,176,747,836 3,507,443,052
Non-Current LiabilitiesDeferred Tax Liability 08 210,980,791 128,579,505
Current Liabilities & Provisions 5,105,505,461 3,910,867,252
Short Term Bank Loan (Secured) 09 3,644,810,289 2,897,754,665
Creditors & Others Payable 10 86,262,649 79,467,584
Liabilities for Other Finance 11 140,535,836 116,974,941
Short Term Loan 12 1,020,376,322 724,638,161
Provision for Income Tax 13 213,520,365 92,031,901
TOTAL SHAREHOLDERS' EQUITY & LIABILITIES 12,465,754,088 9,425,480,289
Net Asset Value Per Share (Restated) 36.24 27.31
Attached notes form parts of these Financial Statements.
Sd/- Sd/- Sd/-
Tapan Chowdhury Ratna Patra Samuel S Chowdhury
Chairman Vice Chairman Managing Director
Sd/- Sd/-
Md. Alamgir Hossain Sanjib Baran Roy
Chief Financial Office Company Secretary
SQUARE Textiles Limited
Statement of Financial Position (Unaudited)As at March 31, 2019

Particulars NOTE July to March July to March January to March January to March
2018-19 2017-18 2018-19 2017-18
Sales Revenue 14 5,787,217,216 4,343,728,385 2,197,669,153 1,602,292,943
Cost of Goods Sold 15 5,133,023,540 3,878,283,893 1,927,846,192 1,420,666,085
Gross Profit 654,193,676 465,444,492 269,822,961 181,626,858
Administrative Overhead 16 159,612,058 147,902,973 58,658,251 49,095,348
Selling and Distribution Overhead 17 7,998,862 5,816,463 2,776,671 3,695,554
Profit from Operations 486,582,756 311,725,056 208,388,039 128,835,956
Finance Cost 156,906,644 54,376,485 65,960,876 24,294,084
Non-Operating Income 18 6,239,575 4,346,751 2,750,178 1,573,301
Profit Before W.P.P.F & W.F 335,915,687 261,695,322 145,177,341 106,115,173
Allocation for W.P.P.F & W.F 15,995,985 12,461,682 6,913,207 5,053,103
Profit Before Tax 319,919,702 249,233,640 138,264,134 101,062,070
Provision for Tax (Current) 19,744,315 26,504,608 17,763,099 12,054,215
Provision for Tax (Deferred) 28,867,598 11,315,113 3,251,539 3,262,425
Profit After Tax for The Period 271,307,789 211,413,919 117,249,496 85,745,430
(Transferred to the Statement of Changes in Equity)
Earnings Per Share (EPS)- Restated 22 1.38 1.07 0.59 0.43
Attached notes form parts of these Financial Statements.
Sd/- Sd/- Sd/-
Tapan Chowdhury Ratna Patra Samuel S Chowdhury
Chairman Vice Chairman Managing Director
Sd/- Sd/-
Md. Alamgir Hossain Sanjib Baran Roy
Chief Financial Office Company Secretary
Nine Months Results (Tk) Third Quarter Results (Tk)
SQUARE Textiles Limited
Statement of Profit or Loss and Other Comprehensive Income (Unaudited)
For the 3rd Quarter Ended March 31, 2019

Particulars Share CapitalRetained
EarningsTotal
Balance as at June 30, 2018 1,878,590,480 3,507,443,052 5,386,033,532
Net Profit for the 3rd Quarter Ended March 31, 2019 - 271,307,789 271,307,789
Cash Dividend for 2017-18 - (375,718,096) (375,718,096)
Stock Dividend for 2017-18 93,929,520 (93,929,520) -
Balance from Amalgamation of SQUARE Yarns Ltd. - 1,867,644,611 1,867,644,611
Balance As at March 31, 2019 1,972,520,000 5,176,747,836 7,149,267,836
Particulars Share CapitalRetained
EarningsTotal
Balance as at June 30, 2017 1,789,133,790 3,663,812,572 5,452,946,362
Net Profit for the 3rd Quarter Ended March 31, 2018 - 211,413,919 211,413,919
Cash Dividend for 2016-17 - (357,826,758) (357,826,758)
Stock Dividend for 2016-17 89,456,690 (89,456,690) -
Balance As at March 31, 2018 1,878,590,480 3,427,943,043 5,306,533,523
Sd/- Sd/- Sd/-
Tapan Chowdhury Ratna Patra Samuel S Chowdhury
Chairman Vice Chairman Managing Director
Sd/- Sd/-
Md. Alamgir Hossain Sanjib Baran Roy
Chief Financial Office Company Secretary
SQUARE Textiles Limited
Statement of Changes in Equity (Unaudited)For the 3rd Quarter Ended March 31, 2018
Statement of Changes in Equity (Unaudited)For the 3rd Quarter Ended March 31, 2019

Particulars Notes
Cash Flows from Operating Activities:
Receipts from Sales Revenue 5,668,730,674 4,146,677,362
Exchange Fluctuation Gain 2,740,281 1,526,762
Receipts from Other Income 201,661 344,736
Total Receipts 5,671,672,616 4,148,548,860
Payments to Suppliers (4,832,948,488) (2,927,548,658)
Paid for Operating & Non-operating Expenses (1,131,478,661) (1,098,445,117)
Interest Expenses Paid (125,643,515) (42,674,546)
Income Tax Paid (34,637,923) (29,364,387)
Total Payments (6,124,708,587) (4,098,032,708)
Net Cash Generated (Used in) from Operating Activities (453,035,971) 50,516,152
Cash Flows from Investing Activities:
Sales (Purchase) of Property, Plant & Equipment (1,081,324,204) (692,599,682)
Paid for Non controlling Interest for Merger of SYL (9,287,050) -
Net Cash Generated (Used in) from Investing Activities (1,090,611,254) (692,599,682)
Cash Flows from Financing Activities:
Short Term Bank Loan Received/ (Repaid) 560,478,246 642,468,075
Short Term Loan from/ (To) Sister Company 1,085,488,407 297,229,562
Payment of Dividend (375,718,096) (357,826,758)
Net Cash Generated (Used in) from Financing Activities 1,270,248,557 581,870,879
Increase/ (Decrease) in Cash & Cash Equivalents (273,398,668) (60,212,651)
Opening Cash & Cash Equivalents 437,376,799 373,083,455
Cash Balance of SYL from Merger 63,710,180 -
Closing Cash & Cash Equivalents 227,688,311 312,870,804
Net Operating Cash flows per Share (Restated) (2.30) 0.26
Sd/- Sd/- Sd/-
Tapan Chowdhury Ratna Patra Samuel S Chowdhury
Chairman Vice Chairman Managing Director
Sd/- Sd/-
Md. Alamgir Hossain Sanjib Baran Roy
Chief Financial Office Company Secretary
July to March
2017-18
SQUARE Textiles Limited
Statement of Cash flows (Unaudited)
For the 3rd Quarter Ended March 31, 2019
Amount (Tk)July to March
2018-19

02. Property, Plant & Equipment: Tk. 4,449,032,918
31-Mar-19 30-Jun-18
Fixed Assets at Cost
Opening Balance 5,985,889,409 5,808,792,102
Balance of SYL after Merger 1,825,727,192 -
Addition during the Year 1,095,391,345 183,407,307
Sale/ Obsolete during the Year (203,069,508) (6,310,000)
Closing Balance(Cost) 8,703,938,438 5,985,889,409
Accumulated Depreciation
Opening Balance 2,984,070,313 2,750,311,205
Balance of SYL after Merger 1,205,388,269 -
Charged during the Year 264,928,895 240,069,108
Adjustment for sale/Obsolete (199,481,957) (6,310,000)
4,254,905,520 2,984,070,313
Carrying Value Tk. 4,449,032,918 3,001,819,096
Details of Property, Plant & Equipment and Depreciation as at March 31, 2019 are as below:
SQUARE TEXTILES LIMITED
Notes to the Interim Financial Statements (Unaudited)
For The 3rd Quarter Ended March 31, 2019
01. Basis of preparation of the Interim Financial Statements:
These Financial Statements (They) are the unaudited interim Financial statement (here after 'the Interim Financial
Statements') of Square Textiles Ltd. , for the 3rd Quarter Ended on March 31, 2019 (here after the interim period).
They are prepared in accordance with the Bangladesh Accounting Standard (IAS-34) 'Interim Financial Reporting'.
These financial statement should read in conjunction with the Annual Financial Statements as of June 30, 2018, as
they provide an update of previous reported information.
The accounting policies and presentation used are consistent with those used in the Annual Financial Statements,
except where noted below. Where necessary, the comparatives have been reclassified or extended from the
previously reported Interim Financial Statements to take into account any presentational changes made in the Annual
Financial Statements or in these Interim Financial Statements.
The preparation of the financial statements requires management to make estimates and assumptions that affect the
reported amounts of revenue, expenses, assets, liabilities and disclosure of contingent liabilities at the date of the
Interim Financial Statements. If in the future such estimates and assumptions, which are based on management’s
best judgment at the date of the interim financial statements, deviate from the actual circumstances, the original
estimates and assumptions will be modified as appropriate in the period in which the circumstances change.
We understand that our business is growing every year that means our assets are performing according to intention of
procurement and in sum up the discounted future cash flow from the operation of the assets would be positive if we
dispose those assets at the date of financial reporting. But presently we have on intension to dispose these assets, so
it is not required to record the impairment gain as provisions of IAS-36.
The company operates in industries where significant seasonal or cyclical variations in total sales are not experienced
during the reporting period.
The Company has no reportable operating segments as per requirement of IFRS-8, “Operating Segment”.
Figures have been rounded off to the nearest Taka.
As per verdict of Hon'ble High Court, Square Yarns Limited (SYL) merged with Square Textiles Limited (STxL) with
effect from January 01, 2019.

31-Mar-19 30-Jun-18
03. Inventories: Tk. 3,057,817,875
Stocks of Raw Materials 2,808,095,536 1,267,037,971
Raw Materials 2,340,892,323 987,719,563
Raw Materials In Transit 120,118,645 77,114,929
Packing Materials 39,179,265 10,534,616
Work - in - process 82,457,202 42,694,518
Finished Goods 225,448,101 148,974,345
Stocks of Spares 249,722,339 211,514,198
Spares at Store 246,323,383 194,217,841
Spares in Transit 3,398,956 17,296,357
Tk. 3,057,817,875 1,478,552,169
04. Accounts Receivable: Tk. 2,380,461,203
Aging of the above balance is as follows:
Below 60 days 1,128,785,819 864,286,947
Within 61-120 days 954,623,495 902,795,356
Above 120 days 297,051,889 232,752,364
Tk. 2,380,461,203 1,999,834,667
05. Advances, Deposits & Prepayments: Tk. 327,060,742
This is made up of the followings:
Advance 255,919,457 334,833,685
Income Tax 186,842,453 125,021,010
Salary & PF Current account 1,356,000 1,995,000
Other Expenses 9,919,686 14,458,064
Suppliers & Contractor 57,801,318 193,359,611
Deposits
71,141,285 56,352,824
Security Deposit 63,122,583 49,539,729
Margin on Bank Guarantee 8,018,702 6,813,095
Tk. 327,060,742 391,186,509
06. Short Term Loan (Unsecured): Tk. 136,304,678
Loan To (From) Square Texcom Ltd. 136,304,678 123,843,099
Short Term Loan Given Tk. 136,304,678 123,843,099
a) There was no amount due from the Directors (Including Managing Director), Managing Agent, Manager and other
Officers of the Company and any of them severally or jointly with any other person.
b) The carrying amount of Trade Debtors pledged as security.
c) Accounts Receivable is secured, considered as good and is falling due within one year. Classification schedule as
required by Schedule XI of Companies Act 1994.

31-Mar-19 30-Jun-18
07. Cash & Cash Equivalents: Tk. 227,688,311
This is made up of the followings:
Cash in hand 4,591,686 5,619,110
Cash at Bank 223,096,625 431,757,689
Tk. 227,688,311 437,376,799
08. Deferred Tax Liability: Tk. 210,980,791
Opening Balance 128,579,505 109,649,529
Deferred tax Adjustment/ Assets - -
Balance of Deferred tax Liabilities of SYL 53,533,688 -
Deferred tax Liabilities 28,867,598 18,929,976
Closing Balance Tk. 210,980,791 128,579,505
09. Short Term Bank Loan (Secured): Tk. 3,644,810,289
Bank Overdraft 4,078,792 5,569,544
Revolving Loan 800,000,000 -
Deferred LC Loan 2,840,731,497 2,892,185,121 Tk. 3,644,810,289 2,897,754,665
10. Creditors & Others Payable: Tk. 86,262,649
Creditors & Others Payable 86,262,649 79,467,584
86,262,649 79,467,584
11. Liabilities for Other Finance: Tk. 140,535,836
Retention Money 1,714,756 1,714,756
WPPF & Other Fund 15,995,985 17,402,229
Others 122,825,095 97,857,956
Tk. 140,535,836 116,974,941
12. Short Term Loan: Tk. (1,020,376,322)
Loan To (From) Sqaure Pharma. Ltd. (1,020,376,322) (1,385,741)
Loan To (from) Square Yarns Ltd. - (723,252,420)
Short Term Loan Received Tk. (1,020,376,322) (724,638,161)
13. Provision for Income Tax: Tk. 213,520,365
Opening Balance 92,031,901 182,829,429
Adjustment with Advance Tax - (128,998,205)
Balance of Provision for tax Liabilities of SYL 101,744,149 -
Provision made for the period 19,744,315 38,200,677
Closing Balance Tk. 213,520,365 92,031,901
This represents amount payable to regular suppliers of packing materials, utilities, and other services rendered to the
company. All suppliers were paid on a regular basis.
This represents tax liability payable in future due to accumulated taxable temporary differences (Above deferred tax
balance create only from difference between accounting basis depreciation and tax basis depreciation on fixed
assets).
These short term loans are secured against hypothecation of Stock and Accounts Receivable.

July-March
2018-19
July-March 2017-
18
14. Sales Revenue: Tk. 5,787,217,216
Export Sale of Yarns 5,787,217,216 4,343,728,385
Tk. 5,787,217,216 4,343,728,385
15. Cost of Goods Sold: Tk. 5,133,023,540
This is arrived as follows:
Raw Materials Consumed 3,809,208,428 2,686,275,826
Factory Overhead 1,323,815,112 1,192,008,067
Cost of Goods Sold Tk. 5,133,023,540 3,878,283,893
16. Administrative Overhead: Tk. 159,612,058
Salary and Allowances 73,141,900 74,210,192
Directors' Remuneration 29,963,067 26,824,347
Overseas Travelling 18,750,910 10,743,590
Vehicles Running & Maintenance 7,024,801 10,477,783
Fees & Subscription 9,691,731 7,400,616
Rental Expenses 9,656,709 6,574,212
Office Consumable Expense 1,842,186 1,626,087
Electricity, Gas & Water 2,363,842 1,311,944
Software & Hardware Support Expenses 1,441,570 1,324,562
Head Office Employees' Free Lunch 937,723 1,812,376
Annual General Meeting Expenses 356,970 1,534,445
Other Expenses 4,440,649 4,062,819
Total Tk. 159,612,058 147,902,973
17. Selling & Distribution Overhead: Tk. 7,998,862
This is arrived as follows:
Export Sale Expenses 4,973,390 4,533,022
Loading & unloading 3,025,472 1,283,441
Total Tk. 7,998,862 5,816,463
18. Non-Operating Income: Tk. 6,239,575
Interest Income 3,499,294 2,819,989
Forex Exchange Rate Fluctuation Gain/ (Loss) 2,740,281 1,526,762
Tk. 6,239,575 4,346,751
19. Key Management Personnel Compensation:
Short Term Employee Benefits 85,865,817 76,896,549
Post Employment Benefits 14,431,845 10,845,237
Other Long Term Benefits - -
Termination Benefits - -
Share Based Payment - -
During the year, the amount of compensation paid to Key Management Personnel including Board of Directors
is as under (As para 17 of IAS 24):
During the period sales increased by BDT 144.35 (33.23%) crore due to incremental production in Vortex project at
Habiganj and inclusion of three months operational result of Square Yarns Limited after merger.

July-March
2018-19
July-March 2017-
18
20. Related Party Transaction:
SQUARE Pharmaceuticals Ltd. (1,020,376,322) (1,385,741)
SQUARE Yarns Ltd. - (723,252,420)
SQUARE Texcom Ltd. 136,304,678 123,843,099
SQUARE InformatiX Ltd. - -
AEGIS Services Ltd. - -
SQUARE Hospitals Ltd. - -
21. Contingent Liability:
22. Earnings Per Share (EPS):
The Computation is given below:
Tk. 271,307,789 211,413,919 Number of Ordinary
shares 197,252,000 197,252,000
Earnings Per Share Tk. 1.38 1.07
Earning attributable to Ordinary Shares
including other income
Contingent Liability of the Company was Tk. 117.96 Crore as on March 31, 2019 for opening LCs by the banks in
favour of foreign suppliers for raw materials and spares.
Earnings Per Share (EPS) increased in current period due to additional revenue from new vortex project at habiganj
and merger of Square Yarns Limited (SYL).
The business (100% export oriented spinning industry) operation is volatile and realization from debtors (100%
confirmed back to back LC) also very positively co-related with this, but all import payments should be made as per
provision of UCPDC-600, resultant, the per share operating cash flows fluctuates from quarter to quarter, which is very
common for the spinning business trend. During the period under review cash flows from operating activities declined
due to increase of inventory by TK.110.69 crore and debtor’s by TK.5.95 crore for additional production capacity in
Vortex project at Habiganj and seasonal inventory procurement.
23. Regarding Net Operating Cash Flows per Share:
During the year, the Company carried out a number of transactions with related parties in the normal course of
business and on an arms' length basis. The name of related parties, nature of relationship and their total value
have been set out in accordance with the provisions of IAS 24: Related Party Disclosure.