third quarter financial report september 30, 2017
TRANSCRIPT

THIRD QUARTER FINANCIAL REPORTSEPTEMBER 30, 2017

TORONTO HYDRO CORPORATION
TABLE OF CONTENTS
Glossary 3Management’s Discussion and Analysis 4
Introduction 5Business of Toronto Hydro Corporation 6Results of Operations 7Summary of Quarterly Results of Operations 13Financial Position 14Liquidity and Capital Resources 15Corporate Developments 20Share Capital 21Controls and Procedures 21Future Accounting Pronouncements 21Forward-Looking Information 22Additional Information 23
Unaudited Condensed Interim Consolidated Financial Statements 24Notes to Unaudited Condensed Interim Consolidated Financial Statements 28

3
GLOSSARY
CDM – Conservation and demand management
CIR – Custom Incentive Rate-setting
City – City of Toronto
Copeland Station – The Clare R. Copelandtransformer station, formerly “Bremner Station”
Corporation – Toronto Hydro Corporation
Electricity Act – Electricity Act, 1998 (Ontario)
GWh – Gigawatt hour
IAS – International Accounting Standard
IASB – International Accounting Standards Board
ICM – Incremental Capital Module
IESO – Independent Electricity System Operator
IFRIC – International Financial ReportingInterpretations Committee
IFRS – International Financial Reporting Standards
kW – Kilowatt
LDC – Toronto Hydro-Electric System Limited
LRAM – Lost revenue adjustment mechanism
MD&A – Management's Discussion and Analysis
OEB – Ontario Energy Board
OPEB – Other post-employment benefits
PP&E – Property, plant and equipment
TH Energy – Toronto Hydro Energy Services Inc.
WMS – Wholesale Market Service

MANAGEMENT’S DISCUSSION AND ANALYSISFOR THE INTERIM PERIODS ENDED
SEPTEMBER 30, 2017 AND 2016

5
Introduction
This MD&A should be read in conjunction with:
· the Corporation’s unaudited condensed interim consolidated financial statements and accompanying notes as atand for the three and nine months ended September 30, 2017 and 2016, which were prepared in accordance withIAS 34 Interim Financial Reporting (the “Interim Financial Statements”);
· the Corporation’s audited consolidated financial statements and accompanying notes as at and for the years endedDecember 31, 2016 and 2015, which were prepared in accordance with IFRS; and
· the Corporation’s MD&A for the three months and years ended December 31, 2016 and 2015 (the “2016 AnnualMD&A”) (including the sections entitled “Electricity Distribution – Industry Overview”, “CorporateDevelopments – Changes to the Corporation’s Board of Directors and Audit Committee”, “CorporateDevelopments - CDM Activities”, “Legal Proceedings”, “Transactions with Related Parties”, “Risk Managementand Risk Factors”, “Critical Accounting Estimates”, “Significant Accounting Policies”, and “Changes inAccounting Policies”, which remain substantially unchanged as at the date hereof, except as may be noted belowor as updated by the Interim Financial Statements).
Copies of these documents are available on the System for Electronic Document Analysis and Retrieval website atwww.sedar.com.
6
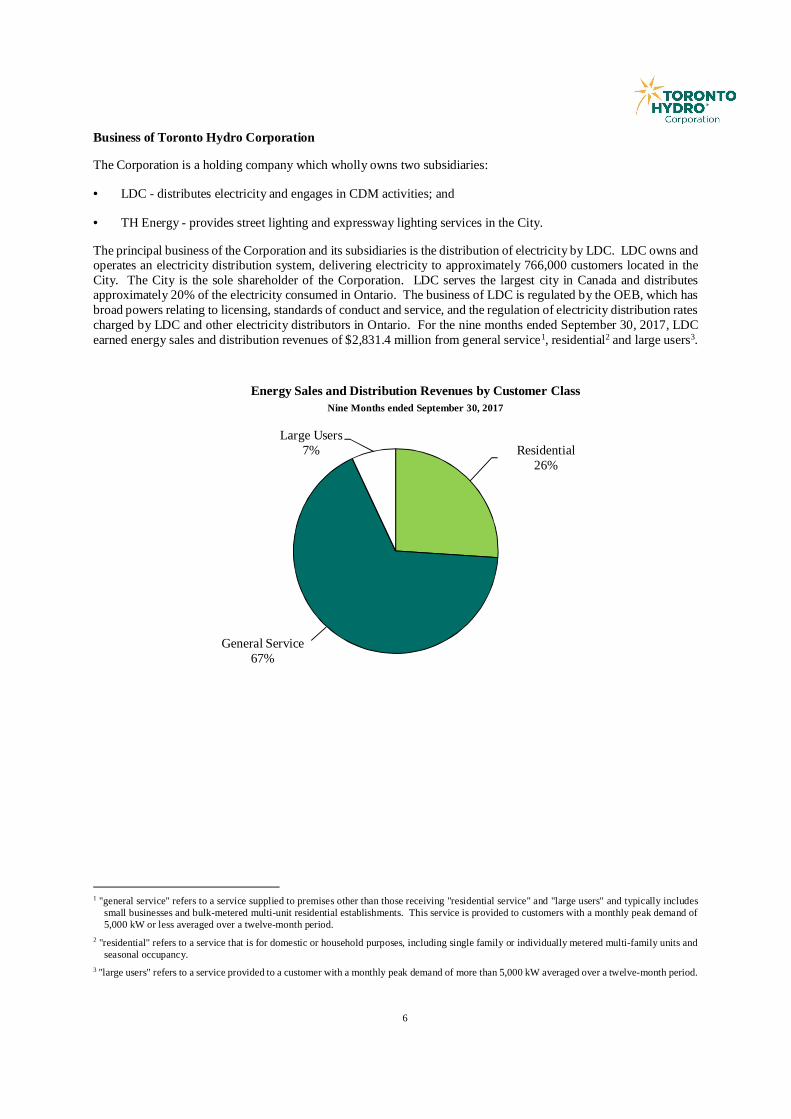
Business of Toronto Hydro Corporation
The Corporation is a holding company which wholly owns two subsidiaries:
· LDC - distributes electricity and engages in CDM activities; and
· TH Energy - provides street lighting and expressway lighting services in the City.
The principal business of the Corporation and its subsidiaries is the distribution of electricity by LDC. LDC owns andoperates an electricity distribution system, delivering electricity to approximately 766,000 customers located in theCity. The City is the sole shareholder of the Corporation. LDC serves the largest city in Canada and distributesapproximately 20% of the electricity consumed in Ontario. The business of LDC is regulated by the OEB, which hasbroad powers relating to licensing, standards of conduct and service, and the regulation of electricity distribution ratescharged by LDC and other electricity distributors in Ontario. For the nine months ended September 30, 2017, LDCearned energy sales and distribution revenues of $2,831.4 million from general service1, residential2 and large users3.
1 "general service" refers to a service supplied to premises other than those receiving "residential service" and "large users" and typically includessmall businesses and bulk-metered multi-unit residential establishments. This service is provided to customers with a monthly peak demand of5,000 kW or less averaged over a twelve-month period.
2 "residential" refers to a service that is for domestic or household purposes, including single family or individually metered multi-family units andseasonal occupancy.
3 "large users" refers to a service provided to a customer with a monthly peak demand of more than 5,000 kW averaged over a twelve-month period.
Residential26%
Large Users7%
Energy Sales and Distribution Revenues by Customer ClassNine Months ended September 30, 2017
General Service67%

7
Results of Operations
Net Income after Net Movements in Regulatory Balances
Condensed Interim Consolidated Statements of IncomeThree months ended September 30
(in millions of Canadian dollars)
2017$
2016$
Change$
RevenuesEnergy sales 817.9 899.9 (82.0)Distribution revenue 186.1 183.3 2.8Other 36.6 21.2 15.4
1,040.6 1,104.4 (63.8)
ExpensesEnergy purchases 790.2 866.9 76.7Operating expenses 71.1 68.9 (2.2)Depreciation and amortization 56.8 51.8 (5.0)
918.1 987.6 69.5
Finance costs (19.1) (17.5) (1.6)Gain on disposals of PP&E 0.2 - 0.2
Income before income taxes 103.6 99.3 4.3Income tax expense (13.7) (16.5) 2.8
Net income 89.9 82.8 7.1Net movements in regulatory balances (44.5) (37.0) (7.5)Net movements in regulatory balances arising from deferred tax assets 1.4 6.7 (5.3)Net income after net movements in regulatory balances 46.8 52.5 (5.7)
The decrease in net income after net movements in regulatory balances for the three months ended September 30,2017 compared to the same period in the prior year was primarily due to lower electricity consumption in 2017, one-time residual ICM balance recorded as an increase in equity through net movements in regulatory balances in 2016,and higher depreciation and amortization related to new in-service additions, partially offset by higher 2017 electricitydistribution rates and higher other revenue related to the recognition of the CDM mid-term incentive.

8
Condensed Interim Consolidated Statements of IncomeNine months ended September 30(in millions of Canadian dollars)
2017$
2016$
Change$
RevenuesEnergy sales 2,288.9 2,492.9 (204.0)Distribution revenue 542.5 488.9 53.6Other 80.0 53.9 26.1
2,911.4 3,035.7 (124.3)
ExpensesEnergy purchases 2,312.8 2,434.3 121.5Operating expenses 215.2 198.5 (16.7)Depreciation and amortization 162.2 152.6 (9.6)
2,690.2 2,785.4 95.2
Finance costs (58.8) (54.7) (4.1)Gain on disposals of PP&E 9.6 - 9.6
Income before income taxes 172.0 195.6 (23.6)Income tax expense (33.6) (39.1) 5.5
Net income 138.4 156.5 (18.1)Net movements in regulatory balances (24.0) (46.6) 22.6Net movements in regulatory balances arising from deferred tax assets 7.0 18.1 (11.1)Net income after net movements in regulatory balances 121.4 128.0 (6.6)
The decrease in net income after net movements in regulatory balances for the nine months ended September 30, 2017compared to the same period in the prior year was primarily due to lower electricity consumption in 2017, higheroperating expenses in connection with system and street lighting maintenance, higher depreciation and amortizationrelated to new in-service asset additions, higher income taxes, and one-time residual ICM balance recorded as anincrease in equity through net movements in regulatory balances in 2016. These variances were partially offset byhigher 2017 electricity distribution rates and higher other revenue related to the recognition of the CDM mid-termincentive and pole and duct rentals. The 2016 first quarter implementation of the new electricity distribution rates alsoresulted in $19.2 million of foregone revenue being recorded in net movements in regulatory balances for thecomparable period, instead of distribution revenue given IFRS 14 - Regulatory Deferral Accounts (“IFRS 14”)treatment.
Energy Sales
LDC’s energy sales arise from charges to customers for electricity consumed, based on regulated rates. Energy salesinclude amounts billed or billable to customers for commodity charges, retail transmission charges, and WMS chargesat current rates. These charges are passed through to customers over time and are considered revenue by LDC. Duringthe same period, energy sales should be equal to the cost of energy purchased. However, a difference between energysales and energy purchases arises when there is a timing difference between the amounts charged by LDC tocustomers, based on regulated rates, and the electricity and non-competitive electricity service costs billed monthlyby the IESO to LDC. This difference is recorded as a settlement variance, representing amounts to be recovered fromor refunded to customers through future rates approved by the OEB.

9
In accordance with IFRS 14, this settlement variance is presented within regulatory balances on the condensed interimconsolidated balance sheets (“Consolidated Balance Sheets”) and within net movements in regulatory balances on thecondensed interim consolidated statements of income and comprehensive income (“Consolidated Statements ofIncome”).
Energy sales for the three months ended September 30, 2017 were $817.9 million compared to $899.9 million for thecomparable period in 2016. The decrease was due to lower retail transmission charges ($33.1 million), lowercommodity charges ($29.6 million), and lower WMS charges ($19.3 million). The decrease in commodity, retailtransmission and WMS charges was primarily due to lower electricity consumption and lower pass-through electricitycosts.
Energy Purchases , Energy Sales, and Settlement VariancesThree months ended September 30, 2017
(in millions of Canadian dollars)
Energy Purchases$
Energy Sales$
Settlement Variances$
Commodity Charges 686.0 723.7 (37.7)
Retail Transmission Charges 78.4 69.3 9.1
WMS Charges 25.8 24.9 0.9
Total 790.2 817.9 (27.7)
For the three months ended September 30, 2017, LDC recognized $817.9 million in energy sales to customers andwas billed $790.2 million for energy purchases from the IESO. The difference between energy sales and energypurchases represents a $27.7 million settlement variance for the period. The settlement variance was recorded as anincrease to the regulatory credit balance ($27.9 million including carrying charges on the accumulated settlementvariance balance) on the Consolidated Balance Sheets, and presented within net movements in regulatory balances onthe Consolidated Statements of Income.
723.7
69.324.9
753.3
102.444.2
-
100.0
200.0
300.0
400.0
500.0
600.0
700.0
800.0
Commodity Transmission WMS
Energy SalesThree months ended September 30, 2017
(in millions of Canadian dollars)
Q3 2017 Q3 2016

10
Energy sales for the nine months ended September 30, 2017 were $2,288.9 million compared to $2,492.9 million forthe comparable period in 2016. The decrease was due to lower commodity charges ($124.2 million), lower retailtransmission charges ($63.7 million), and lower WMS charges ($16.1 million). The decrease in commodity, retailtransmission and WMS charges was primarily due to lower electricity consumption and lower pass-through electricitycosts.
Energy Purchases, Energy Sales, and Settlement VariancesNine months ended September 30, 2017
(in millions of Canadian dollars)
Energy Purchases$
Energy Sales$
Settlement Variances$
Commodity Charges 2,008.3 1,988.6 19.7
Retail Transmission Charges 216.6 199.0 17.6
WMS Charges 87.9 101.3 (13.4)
Total 2,312.8 2,288.9 23.9
For the nine months ended September 30, 2017, LDC recognized $2,288.9 million in energy sales to customers andwas billed $2,312.8 million for energy purchases from the IESO. The difference between energy sales and energypurchases represents a $23.9 million settlement variance for the period. The settlement variance was recorded as adecrease to the regulatory credit balance ($23.3 million including carrying charges on the accumulated settlementvariance balance, see the regulatory credit balance table in note 6 to the Interim Financial Statements) on theConsolidated Balance Sheets, and presented within net movements in regulatory balances on the ConsolidatedStatements of Income.
Distribution Revenue
Distribution revenue is recorded based on OEB-approved distribution rates to recover the costs incurred by LDC indelivering electricity to customers, and includes revenue collected through OEB-approved rate riders.
Distribution revenue for the three months and nine months ended September 30, 2017 was $186.1 million and $542.5million, respectively, compared to $183.3 million and $488.9 million for the comparable periods in 2016.
1,988.6
199.0101.3
2,112.8
262.7117.4
-
500.0
1,000.0
1,500.0
2,000.0
2,500.0
Commodity Transmission WMS
LDC Energy SalesNine months ended September 30, 2017
(in millions of Canadian dollars)
Q3 YTD 2017 Q3 YTD 2016

11
The increase in distribution revenue for the three months ended September 30, 2017 was primarily due to higherelectricity distribution rates ($13.5 million) and additional revenue collected through OEB-approved rate riders ($5.0million), partially offset by lower electricity consumption in the third quarter of 2017 ($15.7 million).
The increase in distribution revenue for the nine months ended September 30, 2017 was primarily due to higherelectricity distribution rates ($37.1 million) and additional revenue collected through OEB-approved rate riders ($17.1million), partially offset by lower electricity consumption in 2017 ($20.5 million). The remaining increase was relatedto the 2016 foregone revenue ($19.2 million) from the implementation of the new electricity distribution rates effectiveMarch 1, 2016, which was recorded in net movements in regulatory balances for the nine months ended September30, 2016 given the IFRS 14 treatment, instead of distribution revenue.
Other Revenue
Other revenue includes revenue from services ancillary to electricity distribution, delivery of street lighting services,pole and duct rentals, amortization of deferred revenue related to capital contributions received from customers, andCDM cost efficiency incentives.
Other revenue for the three months and nine months ended September 30, 2017 was $36.6 million and $80.0 million,respectively, compared to $21.2 million and $53.9 million for the comparable periods in 2016. The increase wasprimarily due to higher revenue in connection with ancillary services, CDM mid-term incentive, pole and duct rentals,and excess expansion deposits retained by LDC where the requested number of connections or demand were not metby the connecting customer (see development charges in note 6 to the Interim Financial Statements).
The excess expansion deposits were recorded as a regulatory balance on the Consolidated Balance Sheets, with acorresponding offset in net movements in regulatory balances. This regulatory balance is expected to offset futureelectricity distribution rates for customers, although application has yet to be made to dispose of the balance.
Operating Expenses
Operating expenses for the three months and nine months ended September 30, 2017 were $71.1 million and $215.2million, respectively, compared to $68.9 million and $198.5 million for the comparable periods in 2016.
The increase in operating expenses for the three months ended September 30, 2017 was primarily attributable to highercosts in connection with system maintenance programs, partially offset by lower rental expenses.
The increase in operating expenses for the nine months ended September 30, 2017 was primarily attributable to highercosts in connection with system maintenance programs, ancillary services, and street lighting maintenance, partiallyoffset by lower rental expenses.
Depreciation and Amortization
Depreciation and amortization expense for the three months and nine months ended September 30, 2017 was $56.8million and $162.2 million, respectively, compared to $51.8 million and $152.6 million for the comparable periods in2016. The increase was related to new in-service asset additions in 2017, partially offset by lower derecognition ofassets removed from service and certain assets being fully depreciated.
Finance Costs
Finance costs for the three months and nine months ended September 30, 2017 were $19.1 million and $58.8 million,respectively, compared to $17.5 million and $54.7 million for the comparable periods in 2016. The increase wasprimarily due to a higher average amount of long-term debt outstanding during 2017 compared with the same periodsin 2016.

12
Gain on Disposals of PP&E
Gain on disposals of PP&E for the three months and nine months ended September 30, 2017 was $0.2 million and$9.6 million, respectively, compared to $nil for the comparable periods in 2016.
The variance in gain on disposals of PP&E for the nine months ended September 30, 2017 was primarily due to thegain realized on disposal of a property in the second quarter of 2017 ($9.3 million). The gain, (net of tax) of $8.0million was recorded as a regulatory balance on the Consolidated Balance Sheets to reduce future electricitydistribution rates for customers, with a corresponding offset in net movements in regulatory balances.
Income Tax Expense and Income Tax Recorded in Net Movements in Regulatory Balances
Income tax expense and income tax recorded in net movements in regulatory balances for the three months and ninemonths ended September 30, 2017 were $12.3 million and $26.6 million, respectively, compared to $9.8 million and$21.0 million for the comparable periods in 2016. The unfavourable variances were primarily due to lower netdeductions for permanent and temporary differences between accounting and tax treatments.
Net Movements in Regulatory Balances
In accordance with IFRS 14, the Corporation separately presents regulatory balances and related net movements onthe Consolidated Balance Sheets and Consolidated Statements of Income.
The decrease in the regulatory debit ($14.4 million) and the increase in the regulatory credit ($2.6 million) balancesfor the nine months ended September 30, 2017 equals the sum ($17.0 million) of net movements in regulatory balancesand net movements in regulatory balances arising from deferred tax assets for the period (see “Financial Position”below).
Energy purchases record the actual cost of power purchased which varies from month to month. Since the sellingprice of power within energy sales is fixed for set periods of time, a gain or loss usually results, and is part of thecalculation of net income. However, per OEB regulations, such gains or losses on energy sales are deferred withinbalance sheet regulatory variance accounts for later disposition to or from rate payers via rate riders after approval bythe OEB. Deferrals of gains or losses on energy sales (see “settlement variance” under “Results of Operations” above),or disposition of past deferrals in electricity rates will usually represent the largest single element of the net movementsin regulatory balances for a period.
Net movements in regulatory balances for the three months and nine months ended September 30, 2017 were a chargeof $44.5 million and $24.0 million, respectively, compared to a charge of $37.0 million and $46.6 million for thecomparable periods in 2016. The charge of $44.5 million for the three months ended September 30, 2017 wasprimarily due to the timing difference between the electricity costs billed monthly by the IESO and LDC’s billing tocustomers, amounts being deferred into capital-related regulatory accounts for future refunds to customers, andamounts disposed through OEB-approved rate riders. The charge of $37.0 million for the three months endedSeptember 30, 2016 was primarily due to the timing difference between the IESO and LDC’s billings, and amountsbeing deferred into capital-related regulatory accounts for future refunds to customers, partially offset by the residualICM balance recorded as an increase in equity through net movements in regulatory balances.
The charge of $24.0 million for the nine months ended September 30, 2017 was primarily due to amounts disposedthrough OEB-approved rate riders and amounts being deferred into capital-related regulatory accounts for futurerefunds to customers, partially offset by the timing difference between the IESO and LDC’s billings. The charge of$46.6 million for the nine months ended September 30, 2016 was primarily due to the timing difference between theIESO and LDC’s billings, amounts disposed through OEB-approved rate riders, and amounts being deferred intocapital-related regulatory accounts for future refunds to customers, partially offset by the foregone revenue recognizedin the first quarter of 2016 as a result of the timing and impact of the OEB’s CIR decision and rate order and theresidual ICM balance recorded as an increase in equity through net movements in regulatory balances.

13
Summary of Quarterly Results of Operations
The table below presents a summary of Corporation’s results of operations for eight quarters including andimmediately preceding September 30, 2017.
Summary of Quarterly Results of Operations(in millions of Canadian dollars)
September 302017
$
June 302017
$
March 312017
$
December 312016
$
Energy sales 817.9 721.8 749.2 813.3Distribution revenue 186.1 178.2 178.2 159.0Other 36.6 23.0 20.4 22.0
Revenues 1,040.6 923.0 947.8 994.3Net income after net movementsin regulatory balances 46.8 35.0 39.6 23.4
September 302016
$
June 302016
$
March 312016
$
December 312015
$
Energy sales 899.9 801.1 791.9 708.7Distribution revenue 183.3 158.8 146.8 131.3Other 21.2 16.8 15.9 15.3
Revenues 1,104.4 976.7 954.6 855.3Net income after net movementsin regulatory balances 52.5 31.2 44.3 74.3
The Corporation’s revenues, all other things being equal, are impacted by seasonal temperatures. Revenues wouldtend to be higher in the first quarter as a result of higher energy consumption for winter heating, and in the third quarterdue to air conditioning/cooling. The Corporation’s revenues are also impacted by fluctuations in electricity prices andthe timing and recognition of regulatory decisions. The variation from the seasonal trend discussed above for the firstquarter of 2017 was primarily due to lower commodity charges charged by the IESO and lower consumption as aresult of a mild winter, and the variation for the second quarter of 2016 was primarily due to implementation of higherelectricity rates per the OEB’s CIR decision and rate order.

14
Financial Position
The following table outlines the significant changes in the Consolidated Balance Sheets as at September 30, 2017compared to December 31, 2016.
Consolidated Balance Sheet Data(in millions of Canadian dollars)
Balance Sheet AccountIncrease
(Decrease) Explanation of Significant Change$
Assets
Accounts receivable and unbilledrevenue
(3.3) The decrease was primarily due to lower pass-through electricity costs, partially offset by timingvariances of billing and collection activities and therecognition of the CDM mid-term incentivereceivable.
PP&E and intangible assets 237.2 The increase was primarily due to capitalexpenditures, partially offset by depreciation andderecognition during the period.
Deferred tax assets (7.2) The decrease was primarily due to lower netdeductible temporary differences between tax andaccounting values of regulatory balances and PP&Eand intangible assets.
Liabilities and Equity
Commercial paper (106.0) The decrease was due to repayment using the equityinjection from the City in June 2017 ($250.0million), offset by funding required for generalcorporate purposes.
Accounts payable and accruedliabilities
(22.9) The decrease was primarily due to lower electricitycosts payable to the IESO, partially offset by timingdifferences in payments.
Deferred revenue 28.0 The increase was primarily due to capitalcontributions received in 2017 and pole and ductrentals.
Share capital 250.0 The increase was due to the equity injection fromthe City resulting in the issuance of 200 commonshares to the City in June 2017.

15
Consolidated Balance Sheet Data(in millions of Canadian dollars)
Balance Sheet AccountIncrease
(Decrease) Explanation of Significant Change$
Regulatory Balances
Regulatory debit balances (14.4) The decrease was primarily due to amountsdisposed through OEB-approved rate riders.
Regulatory credit balances 2.6 The increase was primarily due to amounts beingdeferred into capital-related regulatory accountsfor future refunds to customers and amountsdisposed through OEB-approved rate riders,partially offset by new balances arising in theperiod related to settlement variances.
Liquidity and Capital Resources
The Corporation's current assets and current liabilities amounted to $571.5 million and $980.9 million, respectively,as at September 30, 2017, resulting in a working capital deficit of $409.4 million. The deficit is primarily attributableto the series 2 debentures due November 14, 2017 for $250.0 million and the Corporation’s preference for utilizing itsCommercial Paper Program and Working Capital Facility (both defined below) before issuing additional debenturesto fulfill the Corporation’s ongoing liquidity requirements, including funding of significant capital spending in thecurrent year. The Corporation seeks to maintain an optimal mix of short-term and long-term debt in order to loweroverall financing costs and to enhance borrowing flexibility.
The Corporation’s primary sources of liquidity and capital resources are cash provided by operating activities,issuances of commercial paper, amounts available to be drawn against its credit facilities, and borrowings from debtcapital markets. The Corporation’s liquidity and capital resource requirements are mainly for capital expenditures tomaintain and improve the electricity distribution system of LDC, for energy purchases, and to meet financingobligations.
The amount available under the Revolving Credit Facility and the outstanding borrowings under the Revolving CreditFacility and Commercial Paper Program are as follows:
RevolvingCredit Facility
Limit
RevolvingCredit Facility
Borrowings
CommercialPaper
Outstanding
RevolvingCredit Facility
Availability(in millions of Canadian dollars) $ $ $ $
September 30, 2017 800.0 - 155.0 645.0December 31, 2016 800.0 - 261.0 539.0

16
Condensed Interim Consolidated Statements of Cash Flow Data (in millions of Canadian dollars)
Three monthsended September 30
Nine monthsended September 30
2017$
2016$
2017$
2016$
Working capital facility beginning of period (11.8) (6.7) (7.1) (14.2)Net cash provided by operating activities 105.1 143.0 373.3 379.6Net cash used in investing activities (132.3) (128.7) (388.6) (411.2)Net cash provided by (used in) financing activities 28.9 (16.7) 12.3 36.7Working capital facility, end of period (10.1) (9.1) (10.1) (9.1)
The Corporation is a party to a $20.0 million demand facility with a Canadian chartered bank for the purpose ofworking capital management (“Working Capital Facility”). As at September 30, 2017, $10.1 million was drawn underthe Working Capital Facility compared to $7.1 million as at December 31, 2016.
Operating Activities
Net cash provided by operating activities for the three months and nine months ended September 30, 2017 was $105.1million and $373.3 million, respectively, compared to $143.0 million and $379.6 million for the comparable periodsin 2016.
The decrease in net cash provided by operating activities for the three months ended September 30, 2017 was primarilydue to a decrease in working capital mainly related to timing of settlement of accounts receivable and accountspayables.
The decrease in net cash provided by operating activities for the nine months ended September 30, 2017 was primarilydue to lower net income before net movements in regulatory balances and after adjustments for non-cash items, andtiming of income tax instalments paid, partially offset by improved working capital mainly related to timing ofsettlement of accounts receivable, unbilled revenue, and accounts payables, and an increase in the deferredconservation credit.
Investing Activities
Net cash used in investing activities for the three months and nine months ended September 30, 2017 was $132.3million and $388.6 million, respectively, compared to $128.7 million and $411.2 million for the comparable periodsin 2016.
The increase in net cash used in investing activities for the three months ended September 30, 2017 was due to highercash spending on capital projects.
The decrease in net cash used in investing activities for the nine months ended September 30, 2017 was due to proceedsreceived from the disposal of a property in the second quarter of 2017 and lower cash spending on capital projects.
Electricity distribution is a capital-intensive business. As the municipal electricity distribution company serving thelargest city in Canada, LDC continues to invest in the renewal of existing aging infrastructure to address safety,reliability and customer service requirements.

17
The following table summarizes the Corporation’s capital expenditures, both PP&E and intangible assets, which areinclusive of capital accruals, for the periods indicated.
Capital Expenditures(in millions of Canadian dollars)
Three monthsended September 30
Nine monthsended September 30
2017$
2016$
2017$
2016$
Regulated LDCDistribution system
Planned 1 90.4 90.3 269.9 280.2Reactive 12.7 12.6 35.3 30.7Copeland Station 4.2 4.3 18.3 14.8
Facilities consolidation 9.2 15.6 35.2 34.5Technology assets 12.6 8.0 34.6 32.1Other 2 1.7 3.0 5.2 7.0
Regulated capital expenditures 130.8 133.8 398.5 399.3Unregulated capital expenditures 3 2.1 1.8 5.5 3.2Total capital expenditures 132.9 135.6 404.0 402.51 Includes, among other initiatives, the replacement of underground and overhead infrastructures, and the delivery of customer connections.2 Includes fleet capital and buildings.3 Primarily relates to street lighting and generation equipment.
The total regulated capital expenditures for the three months and nine months ended September 30, 2017 were $130.8million and $398.5 million, respectively, compared to $133.8 million and $399.3 million for the comparable periodsin 2016.
For the three months ended September 30, 2017, the decrease in regulated capital expenditures was primarily relatedto lower spending on the facilities consolidation program ($6.4 million) and customer connections ($2.5 million).These variances were partially offset by higher spending on station programs ($4.3 million).
For the nine months ended September 30, 2017, the decrease in regulated capital expenditures was primarily relatedto lower spending on overhead infrastructure ($14.3 million) and technology assets in relation to the radio project($11.4 million). These variances were partially offset by higher spending on station programs ($21.5 million) andunderground infrastructure ($2.8 million).
The largest capital initiatives in 2017 include the replacement of underground and overhead infrastructures, deliveryof customer connections, the facilities consolidation program, and construction of Copeland Station in response to thegrowing need for distribution options in the downtown core of the City.
The replacement of underground infrastructure includes replacing direct buried cables, transformer switches,handwells and other aging underground infrastructure. The replacement of overhead infrastructure includes replacingpoles, overhead transformers, conductors, overhead switches and other aging overhead infrastructure and equipment.Both initiatives will allow LDC to continue to provide ongoing safe and reliable service to its customers. For the ninemonths ended September 30, 2017, capital expenditures for the underground and overhead infrastructures were $68.1million and $48.9 million, respectively.
The delivery of customer connections includes spending related to new services and upgrades to existing services forspecific commercial customers. For the nine months ended September 30, 2017, capital expenditures for the deliveryof customer connections were $40.9 million.
The facilities consolidation program relates to the consolidation of operating centres to lower operating centre costsand simplify long-term planning. In 2017, the Corporation continued relocating staff, equipment and operations aswell as performing the required capital investment on specific properties and incurred costs of $35.2 million for thenine months ended September 30, 2017.

18
Copeland Station will be the first transformer station built in downtown Toronto since the 1960’s and will be thesecond underground transformer station in Canada. It will provide electricity to buildings and neighbourhoods in thecentral-southwest area of the City. During the third quarter of 2017, control wiring was completed and systemintegration commenced. The machine shop was largely completed. In addition, electric station service equipmentwas installed and energized and commissioning of mechanical equipment began. Hydro One commenced theinstallation of their equipment, including high voltage switchgear and protection and control equipment. Visibleprogress has been achieved on the landscaping and sidewalks. As at September 30, 2017, the cumulative capitalexpenditures on the Copeland Station project amounted to $191.1 million, plus capitalized borrowing costs. All capitalexpenditures related to Copeland Station are recorded to PP&E. See “Risk Management and Risk Factors” in the2016 Annual MD&A for further information on the Copeland Station project.
Financing Activities
Net cash provided by (used in) financing activities for the three months and nine months ended September 30, 2017was $28.9 million and $12.3 million, respectively, compared to $(16.7) million and $36.7 million for the comparableperiods in 2016. The change for the nine month period was primarily due to a decrease in the proceeds from debenturesand commercial paper, and an increase in dividends paid, partially offset by the equity injection received from theCity in June 2017.
The Corporation is a party to a revolving credit facility expiring on October 10, 2022 (“Revolving Credit Facility”),pursuant to which it may borrow up to $800.0 million, of which up to $210.0 million is available in the form of lettersof credit. On August 1, 2017, the maturity date of the Revolving Credit Facility was extended by one year fromOctober 10, 2021 to October 10, 2022. As at September 30, 2017, the Corporation was in compliance with allcovenants included in its Revolving Credit Facility agreement.
The Corporation has a commercial paper program allowing up to $600.0 million of unsecured short-term promissorynotes (“Commercial Paper Program”) to be issued in various maturities of no more than one year. Proceeds from theCommercial Paper Program are used for general corporate purposes.
For the three months and nine months ended September 30, 2017, the average aggregate outstanding borrowings underthe Corporation’s Revolving Credit Facility, Working Capital Facility and Commercial Paper Program were $137.9million and $233.9 million respectively, with a weighted average interest rate of 1.07% and 0.87% (compared to$287.5 million and $380.8 million with a weighted average interest rate of 0.84% and 0.88% for the three months andnine months ended September 30, 2016).
Additionally, the Corporation is a party to a $75.0 million demand facility with a Canadian chartered bank for thepurpose of issuing letters of credit mainly to support LDC’s prudential requirements with the IESO (“PrudentialFacility”). As at September 30, 2017, $40.4 million of letters of credit were issued against the Prudential Facility.
The Corporation filed a base shelf prospectus dated May 8, 2017 with the securities commissions or similar regulatoryauthorities in each of the provinces of Canada. These filings allow the Corporation to make offerings of unsecureddebt securities of up to $1.0 billion during the 25-month period following the date of the prospectus.
As at September 30, 2017, the Corporation had debentures outstanding in the principal amount of $2.1 billion. Thesedebentures will mature between 2017 and 2063. As at September 30, 2017, the Corporation was in compliance withall covenants included in its trust indenture and supplemental trust indentures.
On November 14, 2017, the Corporation issued $200.0 million of 3.485% senior unsecured debentures due onFebruary 28, 2048 at a price of $999.29 per $1,000 principal amount (“Series 13”). The Series 13 debentures bearinterest payable semi-annually in arrears. The net proceeds will be used to repay certain existing indebtedness and forgeneral corporate purposes. Debt issuance costs of $1.5 million relating to the Series 13 debentures will be recordedagainst the carrying amount of the debentures in the fourth quarter of 2017 and will be amortized to finance costsusing the effective interest method.
The Corporation’s Series 2 debentures matured and were repaid on November 14, 2017.

19
The following table sets out the current credit ratings of the Corporation:
Credit RatingsAs at September 30, 2017
DBRS Standard & Poor’sCredit Rating Trend Credit Rating Outlook
Issuer rating A Stable A StableSenior unsecured debentures A Stable A -Commercial paper R-1 (low) Stable - -
The Corporation believes that it has sufficient available sources of liquidity and capital to satisfy working capitalrequirements for the next twelve months.
On March 2, 2017, the Board of Directors of the Corporation declared dividends in the amount of $6.25 million withrespect to the first quarter of 2017 (March 31, 2016 – $44.6 million), which was paid to the City on March 31, 2017.
On May 11, 2017, the Board of Directors of the Corporation declared dividends in the amount of $6.25 million withrespect to the second quarter of 2017 (June 30, 2016 – $6.25 million), which was paid to the City on June 30, 2017.
In connection with receipt of the equity investment from the City, the Board of Directors of the Corporation declareddividends payable to the City and approved amendments to the Corporation’s Dividend Policy, as follows:
· In respect of fiscal 2017, an aggregate amount of $75.0 million shall be paid to the City, consisting of the twopreviously declared and paid instalments of $6.25 million each and a further $62.5 million. The $62.5 millionwas paid to the City on July 7, 2017.
· In respect of fiscal 2018 and subsequent fiscal years, 60% of the Corporation’s consolidated net income after netmovements in regulatory balances for the prior fiscal year shall be declared separately in four equal quarterlyinstalments, with each instalment payable to the City on the last business day of each fiscal quarter.

20
Summary of Contractual Obligations and Other Commitments
The following table presents a summary of the Corporation’s debentures, major contractual obligations and othercommitments.
Summary of Contractual Obligations and Other CommitmentsAs at September 30, 2017
(in millions of Canadian dollars)
Total$
2017 1
$2018/2019
$2020/2021
$After 2021
$Working Capital Facility 10.1 10.1 - - -Commercial paper 2 155.0 155.0 - - -Debentures – principal repayment 2,095.0 250.0 250.0 300.0 1,295.0Debentures – interest payments 1,291.7 31.4 140.4 118.0 1,001.9Operating leases 3.1 0.1 1.3 1.3 0.4Capital projects 3 and other 29.9 3.9 24.3 1.5 0.2Finance leases 2.2 2.2 - - -Total contractual obligations and othercommitments
3,587.0 452.7 416.0 420.8 2,297.5
1 Due over the period from October 1, 2017 to December 31, 2017.2 The notes under the Commercial Paper Program were issued at a discount and are repaid at their principal amount.3 Mainly commitments for construction services and estimated capital contributions.
Corporate Developments
Ontario’s Fair Hydro Plan
On March 2, 2017, the Government of Ontario announced Ontario’s Fair Hydro Plan (“OFHP”) which includes anumber of initiatives, some of which affect LDC or its customers.
OFHP includes the Ontario Rebate for Electricity Consumers Act, 2016 (“OREC”), which came into effect on January1, 2017. The OREC provides eligible customers with financial assistance in the form of an 8% rebate of the pre-taxcost of their electricity. The OREC rebates are administered by LDC and paid by the IESO in the month followingcustomer billing. Current accounts receivable and unbilled revenue include the amount owing by the IESO toLDC. No effect on revenue or expense is recognized by LDC in respect of the OREC rebates.
OFHP also includes the Fair Hydro Act, 2017 (“OFHA”), which enacted the Ontario Fair Hydro Plan Act, 2017 andamended the Electricity Act, 1998 and the Ontario Energy Board Act, 1998. The OFHA came into effect on June 1,2017 and is reflected in the Interim Financial Statements. The OFHA provides eligible customers with financialassistance through various changes to commodity pricing, new or amended programs, and eliminating or reducingcertain provincial charges on the electricity bill. During the period, the OFHA reduces the total electricity bill foreligible customers and, accordingly, reduces current accounts receivable and unbilled revenue and accounts payableand accrued liabilities for LDC. No effect on distribution revenue or expense is recognized by LDC in respect of theOFHA.
CDM Activities
As at September 30, 2017, LDC estimated that approximately $12.2 million qualified as a joint mid-term incentive,of which $11.5 million represents LDC’s portion and is included within accounts receivable.
LDC entered into an agreement to transfer $4.0 million of funding and a corresponding 20 GWh of its energy savingstarget to another local distribution company, effective on October 16, 2017. This agreement will decrease the jointCDM plan funding with Oakville Hydro to $421.0 million, with a revised energy savings target of 1,648 GWh.

21
Electricity Distribution Rates
On March 1, 2016 pursuant to LDC’s 2015 – 2019 CIR application, the OEB set 2018 distribution rates on an interimbasis. On August 23, 2017, LDC filed its 2018 rate application seeking OEB’s approval to finalize distribution ratesand other charges for the period commencing on January 1, 2018 and ending on December 31, 2018.
Share Capital
Share capital consists of the following:
September 30,2017
Number ofShares
September 30,2017
$AuthorizedThe authorized share capital of the Corporation consists of an unlimitednumber of common shares without par value. All shares issued werefully paid.
Issued and outstandingCommon shares, beginning of the period 1,000 567.8Common shares issued 1 200 250.0Common shares issued and outstanding, end of the period 1,200 817.8
1 On June 28, 2017, the Corporation issued 200 common shares to the City for total proceeds of $250.0 million, net of share issue costs andexpenses.
Controls and Procedures
For purposes of certain Canadian securities regulations, the Corporation is a “Venture Issuer”. As such, it is exemptfrom certain requirements of National Instrument 52-109 Certification of Disclosure in Issuers’ Annual and InterimFilings. Accordingly, the Chief Executive Officer and Chief Financial Officer have reviewed the Interim FinancialStatements and the MD&A for the interim periods ended September 30, 2017 and 2016. Based on their knowledgeand exercise of reasonable diligence, they have concluded that these documents fairly present in all material respectsthe financial condition, financial performance and cash flows of the Corporation as at the date of and for the periodpresented.
Future Accounting Pronouncements
A number of new standards, amendments and interpretations are effective for annual periods beginning afterDecember 31, 2017, and as such, have not yet been applied in preparing these Interim Financial Statements. Inaddition to the changes described in note 25 to the Corporation’s audited consolidated financial statements for the yearended December 31, 2016, the Corporation has determined that the following could have an impact on its consolidatedfinancial statements.
Revenue from Contracts with Customers
In May 2014, the IASB issued IFRS 15 Revenue from Contracts with Customers (“IFRS 15”), which replaces existingrevenue recognition guidance, including IAS 18 Revenue and IFRIC 18 Transfers of Assets from Customers. IFRS15 contains a single model that applies to contracts with customers with two methods for recognizing revenue: at apoint in time or over time. IFRS 15 is effective for annual periods beginning on or after January 1, 2018.
The Corporation will adopt IFRS 15 on January 1, 2018 using the modified retrospective approach. The Corporationhas completed its initial assessment of the key revenue streams. Working groups have been established to assist withdetermining the impact of the adoption of IFRS 15 and the management’s whitepaper is currently under review.
The majority of the Corporation’s revenue (energy sales and distribution revenue) is generated from electricitydistribution at regulated prices and the Corporation does not expect IFRS 15 to have a material impact on theaccounting for these revenue streams. The Corporation has determined that IFRS 15 will impact its required disclosure
22
and is currently assessing the impact on other revenue. The quantitative impact is expected to be disclosed in thefinancial statements relating to the fourth quarter of 2017.
Financial Instruments
In July 2014, the IASB issued the final version of IFRS 9 Financial Instruments (“IFRS 9”), which replaces IAS 39Financial Instruments: Recognition and Measurement (“IAS 39”). IFRS 9 includes revised guidance on theclassification and measurement of financial instruments, including a new expected credit loss model for measuringimpairment on financial assets, and new general hedge accounting requirements. It also carries forward the guidanceon recognition and derecognition of financial instruments from IAS 39. The standard is effective for annual periodsbeginning on or after January 1, 2018, and will be applied retrospectively with some exceptions. The Corporation iscurrently evaluating the impact of the new standard and the management’s whitepaper is currently under review. TheCorporation has started the assessment of the quantitative impact which is expected to be disclosed in the financialstatements relating to the fourth quarter of 2017.
Leases
In January 2016, the IASB issued IFRS 16 Leases (“IFRS 16”), which replaces IAS 17 Leases (“IAS 17”) and relatedinterpretations. IFRS 16 introduces a single lessee accounting model eliminating the current distinction betweenfinance and operating leases. It requires the recognition of lease-related assets and liabilities on the balance sheet,except for short-term leases and low value underlying assets. In addition, the nature and timing of expenses relatedto leases will change, as IFRS 16 replaces the straight-line operating leases expense with the depreciation expense forthe assets and interest expense on the lease liabilities. Lessor accounting remains substantially unchanged. Thestandard is effective for annual periods beginning on or after January 1, 2019, and may be applied either retrospectivelyor using a modified retrospective approach. Early adoption is permitted if IFRS 15 is also adopted.
The Corporation intends to early adopt IFRS 16 on January 1, 2018. The Corporation has completed its initialassessment of existing operating leases and anticipates that IFRS 16 will not have a significant impact on theCorporation’s consolidated financial statements and the management’s whitepaper is currently under review. TheCorporation has started the assessment of the quantitative impact which is expected to be disclosed in the financialstatements relating to the fourth quarter of 2017.
Forward-Looking Information
Certain information included in this MD&A constitutes "forward-looking information" within the meaning ofapplicable securities legislation. The purpose of the forward-looking information is to provide the Corporation'scurrent expectations regarding future results of operations, performance, business prospects and opportunities andmay not be appropriate for other purposes. All information, other than statements of historical fact, which addressactivities, events or developments that we expect or anticipate may or will occur in the future, are forward-lookinginformation. The words "anticipates", "believes", “budgets”, “committed”, “can”, "could", "estimates", "expects",“focus”, “forecasts”, “intends”, “future”, "may", “might”, “objective”, "outlook", "plans", “projects”, “propose”,“schedule”, “seek”, "should", “trend”, "will", "would", or the negative or other variations of these words or othercomparable words or phrases, are intended to identify forward-looking information, although not all forward-lookinginformation contains these identifying words. The forward-looking information reflects the Corporation's currentbeliefs and is based on information currently available to the Corporation.
Specific forward-looking information in the MD&A includes, but is not limited to, the statements regarding thesettlement variance and other regulatory balance variances as described in the section entitled “Results of Operations”;the effect of changes in energy consumption on future revenue as described in the sections entitled “Summary ofQuarterly Results of Operations”; the Corporation’s plans to finance the investment in LDC’s infrastructure and theCorporation’s available sources of liquidity and capital resources and the sufficiency thereof to satisfy working capitalrequirements for the next twelve months as described in the section entitled “Liquidity and Capital Resources”; theplanned and proposed capital initiatives and the expected results of such initiatives as described in the section entitled“Liquidity and Capital Resources”; the anticipated contractual obligations and other commitments of the Corporationover the next five years as set out in the section entitled “Liquidity and Capital Resources”; the payment of dividendsas described in the section entitled “Liquidity and Capital Resources” and the adoption and impact of new standards,amendments and interpretations on the Corporation’s consolidated financial statements in the section entitled “FutureAccounting Pronouncements”.

23
The forward-looking information is based on estimates and assumptions made by the Corporation's management inlight of past experience and perception of historical trends, current conditions and expected future developments, aswell as other factors that management believes to be reasonable in the circumstances, including, but not limited to, theamount of indebtedness of the Corporation, changes in funding requirements, the future course of the economy andfinancial markets, no unforeseen delays and costs in the Corporation’s capital projects (including Copeland Station),no unforeseen changes in the legislative and operating framework for Ontario's electricity market, the receipt ofapplicable regulatory approvals and requested rate orders, no unexpected delays in obtaining required approvals, theability of the Corporation to obtain and retain qualified staff, equipment and services in a timely and cost efficientmanner, the receipt of favourable judgments, no unforeseen changes in rate orders or rate setting methodologies, nounfavourable changes in environmental regulation, the level of interest rates and the Corporation's ability to borrow,and assumptions regarding general business and economic conditions.
The forward-looking information is subject to risks, uncertainties and other factors that could cause actual results todiffer materially from historical results or results anticipated by the forward-looking information. The factors whichcould cause results or events to differ from current expectations include, but are not limited to, risks associated withthe execution of the Corporation’s capital and maintenance programs necessary to maintain the performance of ouraging distribution assets and make required infrastructure improvements; risks associated with capital projects,including Copeland Station; risks associated with electricity industry regulatory developments and other governmentalpolicy changes; risks associated with the timing and results of regulatory decisions regarding the Corporation’srevenue requirements, cost recovery and rates; risks associated with information system security and with maintainingcomplex information technology systems; risk to the Corporation’s facilities and operations posed by unexpectedweather conditions caused by climate change and other factors, terrorism and pandemics and the Corporation’s limitedinsurance coverage for losses resulting from these events; risks associated with being controlled by the City, includingpotential conflicts of interest that may arise between the Corporation and the City; risks related to the Corporation’swork force demographic and its potential inability to attract, train and retain skilled employees; risks associated withpossible labour disputes and the Corporation’s ability to negotiate appropriate collective agreements; risk that theCorporation is not able to arrange sufficient and cost-effective debt financing to repay maturing debt and to fundcapital expenditures and other obligations; risk of downgrades to the Corporation’s credit rating; risks related to thetiming and extent of changes in prevailing interest rates and discounts rates and their effect on future revenuerequirements and future post-employment benefit obligations; risk of substantial and currently undetermined orunderestimated environmental costs and liabilities; risk that assumptions that form the basis of the Corporation’srecorded environmental liabilities and related regulatory balances may change; risk that the presence or release ofhazardous or harmful substances could lead to claims by third parties and/or governmental orders and other factorswhich are discussed in more detail under the section entitled "Risk Management and Risk Factors" in the Corporation’s2016 Annual MD&A. Please review the section – "Risk Management and Risk Factors" in the Corporation’s 2016Annual MD&A in detail. All of the forward-looking information included in this MD&A is qualified by the cautionarystatements in this "Forward-Looking Information" section of this MD&A and the "Risk Management and RiskFactors" section in the Corporation’s 2016 Annual MD&A. These factors are not intended to represent a completelist of the factors that could affect the Corporation; however, these factors should be considered carefully and readersshould not place undue reliance on forward-looking information made herein. Furthermore, the forward-lookinginformation contained herein is dated as of the date of this MD&A or as of the date specified in this MD&A, as thecase may be, and the Corporation has no intention and undertakes no obligation to update or revise any forward-looking information, whether as a result of new information, future events or otherwise, except as required by law.
Additional Information
Additional information with respect to the Corporation (including its annual information form) is available on theSystem for Electronic Document Analysis and Retrieval website at www.sedar.com.
Toronto, Canada
November 23, 2017

See Third Quarter Financial Report for abbreviations and defined termsused in the unaudited condensed interim consolidated financial statements.
UNAUDITED CONDENSED INTERIM CONSOLIDATED FINANCIAL STATEMENTSFOR THE THREE AND NINE MONTHS ENDED SEPTEMBER 30, 2017 AND 2016

CONDENSED INTERIM CONSOLIDATED BALANCE SHEETS[in millions of Canadian dollars, unaudited]
As at As atSeptember 30, December 31,
2017 2016$ $
[note 26]ASSETSCurrentAccounts receivable [notes 4 and 15[b]] 256.4 229.8Unbilled revenue [note 15[b]] 290.6 320.5Materials and supplies [note 5] 9.6 9.7Other assets [note 5] 14.9 13.5Total current assets 571.5 573.5Property, plant and equipment [note 4] 4,101.0 3,907.2Intangible assets [note 5] 261.2 217.8Deferred tax assets [note 20] 56.6 63.8Other assets [note 5] 2.2 1.3Total assets 4,992.5 4,763.6Regulatory balances [note 6] 176.4 190.8Total assets and regulatory balances 5,168.9 4,954.4
LIABILITIES AND EQUITYCurrentWorking capital facility [note 7] 10.1 7.1Commercial paper [note 7] 155.0 261.0Accounts payable and accrued liabilities [note 10] 481.5 504.4Income tax payable 13.3 8.1Customer deposits 46.2 39.1Deferred revenue [note 8] 12.7 5.1Deferred conservation credit [note 3[b]] 9.9 5.5Debentures [note 9] 250.0 249.8Other liabilities [note 23] 2.2 3.1Total current liabilities 980.9 1,083.2Debentures [note 9] 1,835.4 1,834.8Customer deposits 8.9 15.0Deferred revenue [note 8] 160.7 140.3Post-employment benefits [note 13] 285.1 280.5Other liabilities [note 23] 0.6 2.3Total liabilities 3,271.6 3,356.1
Commitments, contingencies and subsequent events [notes 2, 14 and 15]
EquityShare capital [note 11] 817.8 567.8Retained earnings 907.5 861.1Total equity 1,725.3 1,428.9Total liabilities and equity 4,996.9 4,785.0Regulatory balances [note 6] 172.0 169.4Total liabilities, equity and regulatory balances 5,168.9 4,954.4
See accompanying notes to the condensed interim consolidated financial statements.
25

CONDENSED INTERIM CONSOLIDATED STATEMENTS OF INCOME AND COMPREHENSIVE INCOME[in millions of Canadian dollars, unaudited]
Three months ended Nine months endedSeptember 30, September 30,
2017 2016 2017 2016$ $ $ $
[note 23] [note 26]RevenuesEnergy sales 817.9 899.9 2,288.9 2,492.9Distribution revenue 186.1 183.3 542.5 488.9Other [note 17] 36.6 21.2 80.0 53.9
1,040.6 1,104.4 2,911.4 3,035.7
ExpensesEnergy purchases 790.2 866.9 2,312.8 2,434.3Operating expenses [note 18] 71.1 68.9 215.2 198.5Depreciation and amortization [notes 4 and 5] 56.8 51.8 162.2 152.6
918.1 987.6 2,690.2 2,785.4
Finance costs [note 19] (19.1) (17.5) (58.8) (54.7)Gain on disposals of property, plant and equipment [note 5] 0.2 - 9.6 -
Income before income taxes 103.6 99.3 172.0 195.6Income tax expense [note 12] (13.7) (16.5) (33.6) (39.1)
Net income 89.9 82.8 138.4 156.5Net movements in regulatory balances [note 6] (44.5) (37.0) (24.0) (46.6)Net movements in regulatory balances arising from deferred tax assets [note 6] 1.4 6.7 7.0 18.1Net income after net movements in regulatory balances 46.8 52.5 121.4 128.0
Other comprehensive income - - - -Total comprehensive income 46.8 52.5 121.4 128.0
CONDENSED INTERIM CONSOLIDATED STATEMENTS OF CHANGES IN EQUITY[in millions of Canadian dollars, unaudited]
Three months ended Nine months endedSeptember 30, September 30,
2017 2016 2017 2016$ $ $ $
[note 23] [note 26]Share capital [note 17] 817.8 567.8 817.8 567.8Retained earnings, beginning of period 860.7 804.0 861.1 773.1Net income after net movements in regulatory balances 46.8 52.5 121.4 128.0Dividends [note 11] - (12.5) (75.0) (57.1)Retained earnings, end of period 907.5 844.0 907.5 844.0Total equity 1,725.3 1,411.8 1,725.3 1,411.8
See accompanying notes to the condensed interim consolidated financial statements.
26

CONDENSED INTERIM CONSOLIDATED STATEMENTS OF CASH FLOWS
Three months ended Nine months endedSeptember 30, September 30,
2017 2016 2017 2016$ $ $ $
[note 23] [note 26]OPERATING ACTIVITIESNet income after net movements in regulatory balances 46.8 52.5 121.4 128.0Net movements in regulatory balances [note 6] 44.5 37.0 24.0 46.6Net movements in regulatory balances arising from deferred tax assets [note 6] (1.4) (6.7) (7.0) (18.1)Adjustments Depreciation and amortization [notes 4 and 5] 56.8 51.8 162.2 152.6 Amortization of deferred revenue [note 8] (1.2) (0.9) (3.5) (2.6) Finance costs 19.1 17.5 58.8 54.7 Income tax expense 13.7 16.5 33.6 39.1 Post-employment benefits 1.5 2.3 4.6 6.9 Gain on disposals of property, plant and equipment (0.2) - (9.6) - Other 0.4 (0.1) 1.0 -Capital contributions received [note 8] 8.4 10.9 30.3 28.0Net change in other non-current assets and liabilities (5.1) (1.2) (6.1) (1.3)Increase (decrease) in customer deposits (2.5) 3.0 1.0 3.7Changes in non-cash working capital balances [note 13] (72.8) (39.6) (20.8) (57.1)Income tax paid (2.9) - (16.6) (0.9)Net cash provided by operating activities 105.1 143.0 373.3 379.6
INVESTING ACTIVITIESPurchase of property, plant and equipment [note 13] (111.1) (118.2) (343.6) (392.5)Purchase of intangible assets [note 13] (21.4) (10.6) (57.3) (19.2)Proceeds on disposals of property, plant and equipment [note 5] 0.2 0.1 12.3 0.5Net cash used in investing activities (132.3) (128.7) (388.6) (411.2)
FINANCING ACTIVITIESIncrease (decrease) in commercial paper, net [note 7] 103.0 6.0 (106.0) (51.0)Common shares issued [note 11] - - 250.0 -Dividends paid [note 11] (62.5) (12.5) (75.0) (57.1)Proceeds from debentures [note 12] - - - 200.0Debt issuance costs paid [note 12] - - - (1.3)Repayment of finance lease liability (0.7) (0.7) (2.2) (2.4)Interest paid (10.9) (9.5) (54.5) (51.5)Net cash provided by (used in) financing activities 28.9 (16.7) 12.3 36.7
Net decrease (increase) in working capital facility during the period 1.7 (2.4) (3.0) 5.1
Working capital facility, beginning of period (11.8) (6.7) (7.1) (14.2)
Working capital facility, end of period (10.1) (9.1) (10.1) (9.1)
See accompanying notes to the condensed interim consolidated financial statements.
[in millions of Canadian dollars, unaudited]
27

NOTES TO THE CONDENSED INTERIM CONSOLIDATED FINANCIAL STATEMENTSFor the three and nine months ended September 30, 2017 and 2016[Unaudited; all tabular amounts in millions of Canadian dollars]
28
1. NATURE OF BUSINESS
The Corporation was incorporated on June 23, 1999 under the Business Corporations Act (Ontario) in accordance with theElectricity Act. The Corporation is wholly owned by the City and is domiciled in Canada, with its registered office locatedat 14 Carlton Street, Toronto, Ontario, M5B 1K5. The Corporation and its subsidiaries distribute electricity to customersand provide street lighting and expressway lighting services in the City.
2. BASIS OF PRESENTATION
The Corporation’s unaudited condensed interim consolidated financial statements for the three and nine months endedSeptember 30, 2017 and 2016 [“Interim Financial Statements”] have been prepared in accordance with IAS 34 InterimFinancial Reporting. The notes presented in these Interim Financial Statements include only significant transactions andchanges occurring for the three and nine months since the year-end of December 31, 2016. The disclosures in these InterimFinancial Statements do not conform in all respects to the requirements of IFRS for annual consolidated financialstatements. These Interim Financial Statements follow the same accounting policies and methods of computation as theCorporation’s audited consolidated financial statements for the year ended December 31, 2016. Accordingly, they shouldbe read in conjunction with the Corporation’s annual consolidated financial statements.
These Interim Financial Statements are presented in Canadian dollars, the Corporation’s functional currency, and havebeen prepared on the historical cost basis, except for post-employment benefits which are recorded at actuarial value.
The Corporation’s revenues, all other things being equal, are impacted by temperature fluctuations. Revenues would tendto be higher in the first quarter as a result of higher energy consumption for winter heating, and in the third quarter due toair conditioning/cooling. The Corporation’s quarterly results are also impacted by fluctuations in electricity prices and thetiming and recognition of regulatory decisions.
The Corporation has evaluated the events and transactions occurring after the condensed interim consolidated balance sheetdate through November 23, 2017 when the Corporation’s Interim Financial Statements were authorized for issuance by theCorporation’s Board of Directors, and identified the events and transactions which required recognition in the InterimFinancial Statements and/or disclosure in the notes to the Interim Financial Statements [notes 3 and 9].
Refer to the summary of significant accounting policies disclosed in note 25 to the Corporation’s audited consolidatedfinancial statements for the year ended December 31, 2016.
3. REGULATION
a) Ontario’s Fair Hydro Plan
On March 2, 2017, the Government of Ontario announced Ontario’s Fair Hydro Plan [“OFHP”] which includes a numberof initiatives, some of which affect LDC or its customers.
OFHP includes the Ontario Rebate for Electricity Consumers Act, 2016 [“OREC”], which came into effect on January 1,2017. The OREC provides eligible customers with financial assistance in the form of an 8% rebate of the pre-tax cost oftheir electricity. The OREC rebates are administered by LDC and paid by the IESO in the month following customerbilling. Current accounts receivable and unbilled revenue include the amount owing by the IESO to LDC. No effect onrevenue or expense is recognized by LDC in respect of the OREC rebates.
NOTES TO THE CONDENSED INTERIM CONSOLIDATED FINANCIAL STATEMENTSFor the three and nine months ended September 30, 2017 and 2016[Unaudited; all tabular amounts in millions of Canadian dollars]
29
OFHP also includes the Fair Hydro Act, 2017 [“OFHA”], which enacted the Ontario Fair Hydro Plan Act, 2017 andamended the Electricity Act, 1998 and the Ontario Energy Board Act, 1998. The OFHA came into effect on June 1, 2017and is reflected in the Interim Financial Statements. The OFHA provides eligible customers with financial assistancethrough various changes to commodity pricing, new or amended programs, and eliminating or reducing certain provincialcharges on the electricity bill. During the period, the OFHA reduces the total electricity bill for eligible customers and,accordingly, reduces current accounts receivable and unbilled revenue and accounts payable and accrued liabilities forLDC. No effect on distribution revenue or expense is recognized by LDC in respect of the OFHA.
b) CDM Activities
Under the energy conservation agreement with the IESO, LDC has a joint CDM plan with Oakville Hydro ElectricityDistribution Inc. [“Oakville Hydro”] for the delivery of CDM programs over the 2015-2020 period. The joint CDM planprovides combined funding of approximately $425.0 million, including participant incentives and program administrationcosts, with an energy savings target of approximately 1,668 GWh. The programs for Oakville Hydro under the joint CDMplan started on January 1, 2016. LDC received $44.9 million cumulatively as at December 31, 2016 and $44.8 million inthe nine months ended September 30, 2017 from the IESO for the delivery of CDM programs. Amounts received but notyet spent are presented on the consolidated balance sheets under current liabilities as deferred conservation credit. As atSeptember 30, 2017, LDC estimated that approximately $12.2 million qualified as a joint mid-term incentive, of which$11.5 million represents LDC’s portion and is included within accounts receivable.
LDC entered into an agreement to transfer $4.0 million of funding and a corresponding 20 GWh of its energy savings targetto another local distribution company, effective on October 16, 2017. This agreement will decrease the joint CDM planfunding with Oakville Hydro to $421.0 million, with a revised energy savings target of 1,648 GWh.
c) Electricity Distribution Rates
On March 1, 2016 pursuant to LDC’s 2015 – 2019 CIR application, the OEB set 2018 distribution rates on an interimbasis. On August 23, 2017, LDC filed its 2018 rate application seeking OEB’s approval to finalize distribution rates andother charges for the period commencing on January 1, 2018 and ending on December 31, 2018.

NOTES TO THE CONDENSED INTERIM CONSOLIDATED FINANCIAL STATEMENTSFor the three and nine months ended September 30, 2017 and 2016[Unaudited; all tabular amounts in millions of Canadian dollars]
30
4. PROPERTY, PLANT AND EQUIPMENT
PP&E consist of the following:
Construction in progress additions are net of transfers to the other PP&E categories.
Distributionassets
Land andbuildings
Equipmentand other
Constructionin progress
Total
$ $ $ $ $
CostBalance as at December 31, 2016 3,376.3 314.3 242.4 451.0 4,384.0Additions/(Transfers) 216.5 65.5 17.8 43.5 343.3Disposals and retirements (18.3) (3.2) (0.3) — (21.8)Balance as at September 30, 2017 3,574.5 376.6 259.9 494.5 4,705.5
Accumulated depreciationBalance as at December 31, 2016 347.3 26.0 103.5 — 476.8Depreciation 102.5 9.8 19.9 — 132.2Disposals and retirements (3.7) (0.5) (0.3) — (4.5)Balance as at September 30, 2017 446.1 35.3 123.1 — 604.5
Carrying amountBalance as at December 31, 2016 3,029.0 288.3 138.9 451.0 3,907.2Balance as at September 30, 2017 3,128.4 341.3 136.8 494.5 4,101.0

NOTES TO THE CONDENSED INTERIM CONSOLIDATED FINANCIAL STATEMENTSFor the three and nine months ended September 30, 2017 and 2016[Unaudited; all tabular amounts in millions of Canadian dollars]
31
5. INTANGIBLE ASSETS
Intangible assets consist of the following:
Contributions represent payments made to Hydro One Networks Inc. for dedicated infrastructure in order to receiveconnections to transmission facilities.
Software in development and contributions for work in progress additions are net of transfers to the other intangible assetcategories.
Computersoftware
Contributions Software indevelopment
Contributionsfor work in
progress
Total
$ $ $ $ $
CostBalance as at December 31, 2016 113.5 75.5 20.2 70.1 279.3Additions/(Transfers) 7.3 — 19.4 34.0 60.7Balance as at September 30, 2017 120.8 75.5 39.6 104.1 340.0
Accumulated amortizationBalance as at December 31, 2016 57.4 4.1 — — 61.5Amortization 14.9 2.4 — — 17.3Balance as at September 30, 2017 72.3 6.5 — — 78.8
Carrying amountBalance as at December 31, 2016 56.1 71.4 20.2 70.1 217.8Balance as at September 30, 2017 48.5 69.0 39.6 104.1 261.2

NOTES TO THE CONDENSED INTERIM CONSOLIDATED FINANCIAL STATEMENTSFor the three and nine months ended September 30, 2017 and 2016[Unaudited; all tabular amounts in millions of Canadian dollars]
32
6. REGULATORY BALANCES
Debit balances consist of the following:
January 1,2017
$
Balancesarising inthe period
$
Recovery/reversal
$
Othermovements
$
September30, 2017
$
Remainingrecovery/reversalperiod
(months)
Carryingcharges
applicable
OPEB actuarial net loss 60.2 — — — 60.2 (1) —Foregone revenue 64.3 — (15.4) — 48.9 27 —IFRS transitionaladjustments
22.8 — (5.9) — 16.9 27 —
LRAM 10.5 8.5 (3.6) — 15.4 (1) (2)
Gain on disposal 8.6 (8.1) 14.0 — 14.5 (1) (2)
Stranded meters 11.4 — (2.9) — 8.5 27 (2)
OPEB cash versus accrual 2.9 1.2 — — 4.1 (1) —Named properties 4.6 — (1.1) — 3.5 27 —Capital contributions 1.5 — (0.4) — 1.1 27 —Smart meters 2.1 — (3.1) 1.0 — — —Other 1.9 1.4 — — 3.3 — (2)
190.8 3.0 (18.4) 1.0 176.4
Credit balances consist of the following:
January 1,2017
$
Balancesarising inthe period
$
Recovery/reversal
$
Othermovements
$
September30, 2017
$
Remainingrecovery/reversalperiod
(months)
Carryingcharges
applicable
Deferred taxes 65.3 (7.0) — — 58.3 (1) —Settlement variances 62.8 (23.3) 17.1 — 56.6 (1) (2)
Derecognition 12.8 6.5 — — 19.3 (1) (2)
Capital-related revenuerequirement
8.8 9.4 — — 18.2 (1) (2)
Tax-related variances 17.5 — (6.2) — 11.3 15 (2)
Development charges — 4.6 — — 4.6 note 6[b] (2)
Smart meters — — (0.7) 1.0 0.3 — —Other 2.2 1.6 (0.4) — 3.4 — (2)
169.4 (8.2) 9.8 1.0 172.0
(1) There were no significant changes to the disposition period for the nine months ended September 30, 2017. Refer to note 8 to theCorporation’s audited consolidated financial statements for the year ended December 31, 2016 for details.(2) Carrying charges were added to the regulatory balance in accordance with the OEB’s direction at a rate of 1.10% for 2017 [2016 -1.10%].

NOTES TO THE CONDENSED INTERIM CONSOLIDATED FINANCIAL STATEMENTSFor the three and nine months ended September 30, 2017 and 2016[Unaudited; all tabular amounts in millions of Canadian dollars]
33
The “Balances arising in the period” column consists of new additions to regulatory balances (for both debits and credits).The “Recovery/reversal” column consists of amounts disposed through OEB-approved rate riders or transactions reversingan existing regulatory balance. The “Other movements” column consists of impairment and reclassification between theregulatory debit and credit balances.
a) Gain on disposal
The balance arising in this account relates to a realized gain of $8.0 million, net of tax, in connection with the disposal ofa property by LDC in the second quarter of 2017. This balance is expected to reduce future electricity distribution ratesfor customers, although the timing of disposition is currently unknown.
b) Development charges
This regulatory balance relates to excess expansion deposits retained by LDC where the requested number of connectionsor electricity demand were not met by the connecting customer. Pursuant to the OEB’s Distribution System Code, LDCmay collect expansion deposits on offers to connect from specific customers to guarantee the payment of additional costsrelating to expansion projects. During the customer connection horizon, LDC has an obligation to annually return theexpansion deposit to the connecting customer in proportion to the actual connections or electricity demand that occurredin that year. If the number of connections or electricity demand requested by the customer do not materialize by the endof the specified customer connection horizon, LDC retained the excess expansion deposit not otherwise returned to theconnecting customer.
The excess expansion deposits were recorded as a regulatory balance on the Consolidated Balance Sheets, with acorresponding offset in net movements in regulatory balances. This regulatory balance is expected to offset futureelectricity distribution rates for customers, although application has yet to be made to dispose of the balance.
For a full description of the regulatory balances, refer to note 8 to the Corporation’s audited consolidated financialstatements for the year ended December 31, 2016.

NOTES TO THE CONDENSED INTERIM CONSOLIDATED FINANCIAL STATEMENTSFor the three and nine months ended September 30, 2017 and 2016[Unaudited; all tabular amounts in millions of Canadian dollars]
34
7. SHORT-TERM BORROWINGS
The amount available under the Revolving Credit Facility and the outstanding borrowings under the Revolving CreditFacility and Commercial Paper Program are as follows:
RevolvingCredit Facility
Limit
RevolvingCredit Facility
Borrowings
CommercialPaper
Outstanding
RevolvingCredit Facility
Availability$ $ $ $
September 30, 2017 800.0 — 155.0 645.0December 31, 2016 800.0 — 261.0 539.0
On August 1, 2017, the maturity date of the Revolving Credit Facility was extended by one year from October 10, 2021 toOctober 10, 2022.
For the three and nine months ended September 30, 2017, the average aggregate outstanding borrowings under theCorporation’s Revolving Credit Facility, Working Capital Facility and Commercial Paper Program were $137.9 millionand $233.9 million [three and nine months ended September 30, 2016 – $287.5 million and $380.8 million] with a weightedaverage interest rate of 1.07% and 0.87% [three and nine months ended September 30, 2016 – 0.84% and 0.88%].
As at September 30, 2017, $10.1 million was drawn under the Working Capital Facility [December 31, 2016 – $7.1 million]and $40.4 million of letters of credit were issued against the Prudential Facility [December 31, 2016 – $33.4 million].
8. DEFERRED REVENUE
Deferred revenue consists of the following:
As at and ninemonths endedSeptember 30,
2017$
As at and yearended
December 31,2016
$
Capital contributions, beginning of period 143.6 103.0Capital contributions received 30.3 44.7Amortization (3.5) (3.8)Other (0.9) (0.3)Capital contributions, end of period 169.5 143.6Other 3.9 1.8Total deferred revenue 173.4 145.4Less: Current portion of deferred revenue relating to:
Capital contributions 8.8 3.3Other 3.9 1.8
Current portion of deferred revenue 12.7 5.1Non-current portion of deferred revenue 160.7 140.3

NOTES TO THE CONDENSED INTERIM CONSOLIDATED FINANCIAL STATEMENTSFor the three and nine months ended September 30, 2017 and 2016[Unaudited; all tabular amounts in millions of Canadian dollars]
35
9. DEBENTURES
The Corporation filed a base shelf prospectus dated May 8, 2017 with the securities commissions or similar regulatoryauthorities in each of the provinces of Canada. These filings allow the Corporation to make offerings of unsecured debtsecurities of up to $1.0 billion during the 25-month period following the date of the prospectus.
On November 14, 2017, the Corporation issued $200.0 million of 3.485% senior unsecured debentures due on February28, 2048 at a price of $999.29 per $1,000 principal amount [“Series 13”]. The Series 13 debentures bear interest payablesemi-annually in arrears. The net proceeds will be used to repay certain existing indebtedness and for general corporatepurposes. Debt issuance costs of $1.5 million relating to the Series 13 debentures will be recorded against the carryingamount of the debentures in the fourth quarter of 2017 and will be amortized to finance costs using the effective interestmethod.
The Corporation’s Series 2 debentures matured and were repaid on November 14, 2017.
10. FINANCIAL INSTRUMENTS
Recognition and measurement
As at September 30, 2017 and December 31, 2016, the fair values of accounts receivable, Working Capital Facility,commercial paper, and accounts payable and accrued liabilities approximated their carrying amounts due to the shortmaturity of these instruments. The fair value of customer deposits approximates their carrying amounts taking into accountinterest accrued on the outstanding balance. Obligations under finance leases are measured based on a discounted cashflow analysis and approximate the carrying amounts as management believes that the fixed interest rates are representativeof current market rates.
The fair value of the debentures is based on the present value of contractual cash flows, discounted at the Corporation’scurrent borrowing rate for similar debt instruments, and is included in Level 2 of the fair value hierarchy. As atSeptember 30, 2017, the total fair value of the Corporation’s debentures was determined to be approximately $2,174.4million [December 31, 2016 – $2,207.7 million], with a total carrying amount of $2,085.4 million [December 31, 2016– $2,084.6 million].

NOTES TO THE CONDENSED INTERIM CONSOLIDATED FINANCIAL STATEMENTSFor the three and nine months ended September 30, 2017 and 2016[Unaudited; all tabular amounts in millions of Canadian dollars]
36
11. SHARE CAPITAL
Share capital consists of the following:
September 30,2017
Number ofShares
September 30,2017
$
AuthorizedThe authorized share capital of the Corporation consists of an unlimited number ofcommon shares without par value. All shares issued were fully paid.
Issued and outstandingCommon shares, beginning of the period 1,000 567.8Common shares issued (1) 200 250.0Common shares issued and outstanding, end of the period 1,200 817.8
(1) On June 28, 2017, the Corporation issued 200 common shares to the City for total proceeds of $250.0 million, net of share issue costsand expenses.
Dividends
On March 2, 2017, the Board of Directors of the Corporation declared dividends in the amount of $6.25 million withrespect to the first quarter of 2017 [March 31, 2016 – $44.6 million], which was paid to the City on March 31, 2017.
On May 11, 2017, the Board of Directors of the Corporation declared dividends in the amount of $6.25 million with respectto the second quarter of 2017 [June 30, 2016 – $6.25 million], which was paid to the City on June 30, 2017. In connectionwith receipt of the equity investment from the City, the Board of Directors of the Corporation declared dividends payableto the City and approved amendments to the Corporation’s Dividend Policy, as follows:
[i] In respect of fiscal 2017, an aggregate amount of $75.0 million shall be paid to the City, consisting of the twopreviously declared and paid instalments of $6.25 million each and a further $62.5 million. The $62.5 millionwas paid to the City on July 7, 2017.
[ii] In respect of fiscal 2018 and subsequent fiscal years, 60% of the Corporation’s consolidated net income after netmovements in regulatory balances for the prior fiscal year shall be declared separately in four equal quarterlyinstalments, with each instalment payable to the City on the last business day of each fiscal quarter.

NOTES TO THE CONDENSED INTERIM CONSOLIDATED FINANCIAL STATEMENTSFor the three and nine months ended September 30, 2017 and 2016[Unaudited; all tabular amounts in millions of Canadian dollars]
37
12. INCOME TAXES
The Corporation's effective tax rate after net movements in regulatory balances for the three and nine months endedSeptember 30, 2017 was 20.8% and 18.0% [three and nine months ended September 30, 2016 – 15.7% and 14.1%]. Theeffective tax rate for the three and nine months ended September 30, 2017 was higher than the three and nine months endedSeptember 30, 2016 primarily due to changes in permanent and temporary differences between accounting and taxtreatments.
Income tax expense as presented in the condensed interim consolidated statements of income is as follows:
Three months endedSeptember 30,
Nine months endedSeptember 30,
2017 2016 2017 2016$ $ $ $
Income tax expense 13.7 16.5 33.6 39.1Income tax recorded in net movements inregulatory balances
(1.4) (6.7) (7.0) (18.1)
Income tax expense and income tax recordedin net movements in regulatory balances
12.3 9.8 26.6 21.0
13. CONSOLIDATED STATEMENTS OF CASH FLOWS
Changes in non-cash working capital provided/(used) cash as follows:
Three months endedSeptember 30,
Nine months endedSeptember 30,
2017$
2016$
2017$
2016$
Accounts receivable (38.7) (50.9) (26.6) (96.0)Unbilled revenue (23.5) 10.3 29.9 9.9Income tax receivable — 3.3 — 9.9Materials and supplies 0.2 1.2 0.1 —Other current assets 0.3 1.0 (1.4) (2.0)Accounts payable and accrued liabilities (21.7) (6.7) (39.1) 22.4Income tax payable 7.2 6.2 5.2 6.2Deferred revenue 3.3 (1.5) 7.6 1.8Deferred conservation credit 1.0 (2.5) 4.4 (9.1)Other current liabilities (0.9) — (0.9) (0.2)
(72.8) (39.6) (20.8) (57.1)

NOTES TO THE CONDENSED INTERIM CONSOLIDATED FINANCIAL STATEMENTSFor the three and nine months ended September 30, 2017 and 2016[Unaudited; all tabular amounts in millions of Canadian dollars]
38
Reconciliation between the amount presented on the condensed interim consolidated statements of cash flows afterfactoring in the non-cash additions and total additions to PP&E and intangible assets is as follows:
Three months endedSeptember 30,
Nine months endedSeptember 30,
2017$
2016$
2017$
2016$
Purchase of PP&E, cash basis 111.1 118.2 343.6 392.5Net change in accruals related to PP&E (2.9) 6.4 (1.3) (10.4)Other 0.3 0.4 1.0 1.2Total additions to PP&E 108.5 125.0 343.3 383.3
Purchase of intangible assets, cash basisNet change in accruals related to intangible assets
21.4 3.0
10.6 —
57.3 3.4
19.2 —
Total additions to intangible assets 24.4 10.6 60.7 19.2
14. COMMITMENTS
Operating leases and capital projects
As at September 30, 2017, the future minimum payments under property operating leases, capital projects and othercommitments were as follows:
Operatingleases
Capitalprojects (4)
and other$ $
Less than one year (1) 0.1 3.9Between one and five years (2) 2.6 25.8More than five years (3) 0.4 0.2
3.1 29.9
(1) Due over the period from October 1, 2017 to December 31, 2017.(2) Due over the period from January 1, 2018 to December 31, 2021.(3) Due from January 1, 2022 and beyond.(4) Mainly commitments for construction services and estimated capital contributions.

NOTES TO THE CONDENSED INTERIM CONSOLIDATED FINANCIAL STATEMENTSFor the three and nine months ended September 30, 2017 and 2016[Unaudited; all tabular amounts in millions of Canadian dollars]
39
15. CONTINGENCIES
Legal Proceedings
In the ordinary course of business, the Corporation is subject to various legal actions and claims from customers, suppliers,former employees and other parties. On an ongoing basis, the Corporation assesses the likelihood of any adverse judgmentsor outcomes as well as potential ranges of probable costs and losses. A determination of the provision required, if any, forthese contingencies is made after an analysis of each individual issue. The provision may change in the future due to newdevelopments in each matter or changes in approach, such as a change in settlement strategy. If damages were awardedunder these actions, the Corporation and its subsidiaries would make a claim under any applicable liability insurancepolicies which the Corporation believes would cover any damages which may become payable by the Corporation and itssubsidiaries in connection with these actions, subject to such claim not being disputed by the insurer. There have been nomaterial changes in legal proceedings as disclosed in note 24 to the Corporation’s audited consolidated financial statementsfor the year ended December 31, 2016.
16. SUMMARY OF SIGNIFICANT ACCOUNTING POLICIES
a) Use of judgements and estimates
The preparation of the Corporation’s Interim Financial Statements requires management to make judgements, estimatesand assumptions which affect the application of accounting policies, reported assets, liabilities and regulatory balances,and the disclosure of contingent assets and liabilities at the date of the Interim Financial Statements, and the reportedrevenues and expenses for the period. The estimates are based on historical experience, current conditions and variousother assumptions that are believed to be reasonable under the circumstances, the results of which form the basis for makingjudgments about the carrying values of assets and liabilities as well as for identifying and assessing the accounting treatmentwith respect to commitments and contingencies. Actual results could differ from those estimates, including changes as aresult of future decisions made by the OEB, the IESO, the Ontario Ministry of Energy or the Ontario Ministry of Finance.Estimates and underlying assumptions are reviewed on an ongoing basis. Revisions to estimates are recognizedprospectively.
b) Future accounting pronouncements
A number of new standards, amendments and interpretations are effective for annual periods beginning after December31, 2017, and as such, have not yet been applied in preparing these Interim Financial Statements. In addition to the changesdescribed in note 25 to the Corporation’s audited consolidated financial statements for the year ended December 31, 2016,the Corporation has determined that the following could have an impact on its consolidated financial statements.
Revenue from Contracts with Customers
In May 2014, the IASB issued IFRS 15 Revenue from Contracts with Customers [“IFRS 15”], which replaces existingrevenue recognition guidance, including IAS 18 Revenue and IFRIC 18 Transfers of Assets from Customers. IFRS 15contains a single model that applies to contracts with customers with two methods for recognizing revenue: at a point intime or over time. IFRS 15 is effective for annual periods beginning on or after January 1, 2018.
The Corporation will adopt IFRS 15 on January 1, 2018 using the modified retrospective approach. The Corporation hascompleted its initial assessment of the key revenue streams. Working groups have been established to assist withdetermining the impact of the adoption of IFRS 15 and the management’s whitepaper is currently under review.
The majority of the Corporation’s revenue (energy sales and distribution revenue) is generated from electricity distributionat regulated prices and the Corporation does not expect IFRS 15 to have a material impact on the accounting for these

NOTES TO THE CONDENSED INTERIM CONSOLIDATED FINANCIAL STATEMENTSFor the three and nine months ended September 30, 2017 and 2016[Unaudited; all tabular amounts in millions of Canadian dollars]
40
revenue streams. The Corporation has determined that IFRS 15 will impact its required disclosure and is currently assessingthe impact on other revenue. The quantitative impact is expected to be disclosed in the financial statements relating to thefourth quarter of 2017.
Financial Instruments
In July 2014, the IASB issued the final version of IFRS 9 Financial Instruments [“IFRS 9”], which replaces IAS 39Financial Instruments: Recognition and Measurement [“IAS 39”]. IFRS 9 includes revised guidance on the classificationand measurement of financial instruments, including a new expected credit loss model for measuring impairment onfinancial assets, and new general hedge accounting requirements. It also carries forward the guidance on recognition andderecognition of financial instruments from IAS 39. The standard is effective for annual periods beginning on or afterJanuary 1, 2018, and will be applied retrospectively with some exceptions. The Corporation is currently evaluating theimpact of the new standard and the management’s whitepaper is currently under review. The Corporation has started theassessment of the quantitative impact which is expected to be disclosed in the financial statements relating to the fourthquarter of 2017.
Leases
In January 2016, the IASB issued IFRS 16 Leases [“IFRS 16”], which replaces IAS 17 Leases [“IAS 17”] and relatedinterpretations. IFRS 16 introduces a single lessee accounting model eliminating the current distinction between financeand operating leases. It requires the recognition of lease-related assets and liabilities on the balance sheet, except for short-term leases and low value underlying assets. In addition, the nature and timing of expenses related to leases will change,as IFRS 16 replaces the straight-line operating leases expense with the depreciation expense for the assets and interestexpense on the lease liabilities. Lessor accounting remains substantially unchanged. The standard is effective for annualperiods beginning on or after January 1, 2019, and may be applied either retrospectively or using a modified retrospectiveapproach. Early adoption is permitted if IFRS 15 is also adopted.
The Corporation intends to early adopt IFRS 16 on January 1, 2018. The Corporation has completed its initial assessmentof existing operating leases and anticipates that IFRS 16 will not have a significant impact on the Corporation’sconsolidated financial statements and the management’s whitepaper is currently under review. The Corporation has startedthe assessment of the quantitative impact which is expected to be disclosed in the financial statements relating to the fourthquarter of 2017.