third quarter economic report 2017 and updated economic ... · pdf file6 . continued expansion...
TRANSCRIPT

1
Third Quarter Economic Report 2017 &
Updated economic forecasts for 2017
10 November 2017
Hong Kong SAR Government
1

2
Highlights of the latest economic situation • Hong Kong’s economy continued to expand notably in Q3, by 3.6%
year-on-year
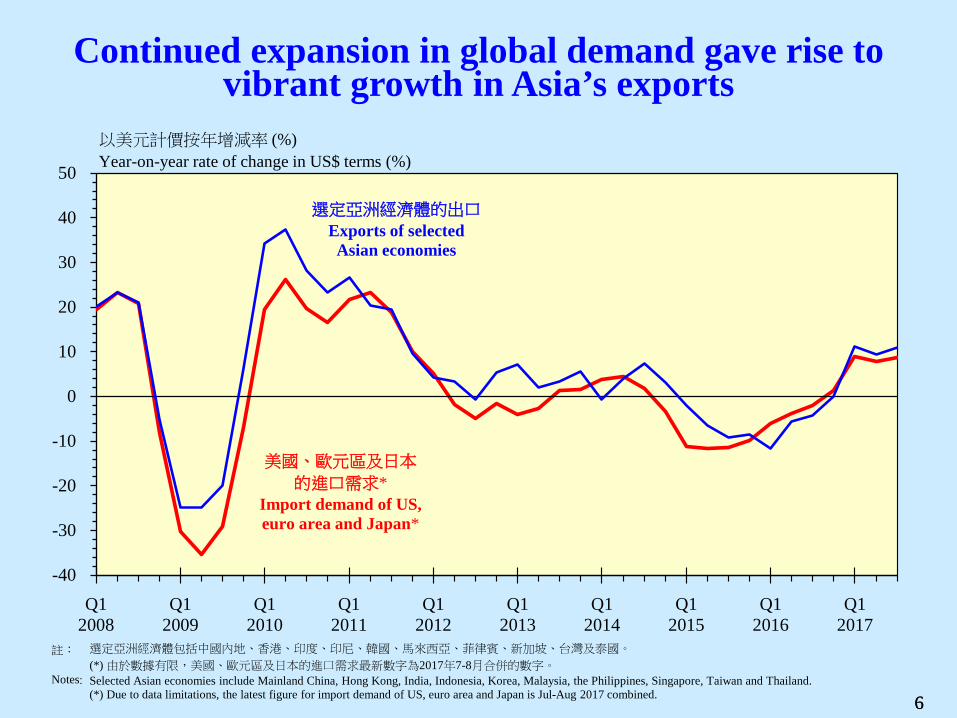
• External demand stayed vibrant, supported by the broadly benign global economic conditions
• Domestic demand stayed firm; labour market remained in a state of full employment
• Inflation pressure was largely contained
• Latest real GDP growth forecast for 2017 at 3.7%; underlying inflation rate forecast revised slightly down to 1.7%

3
Economic performance in Q3 2017
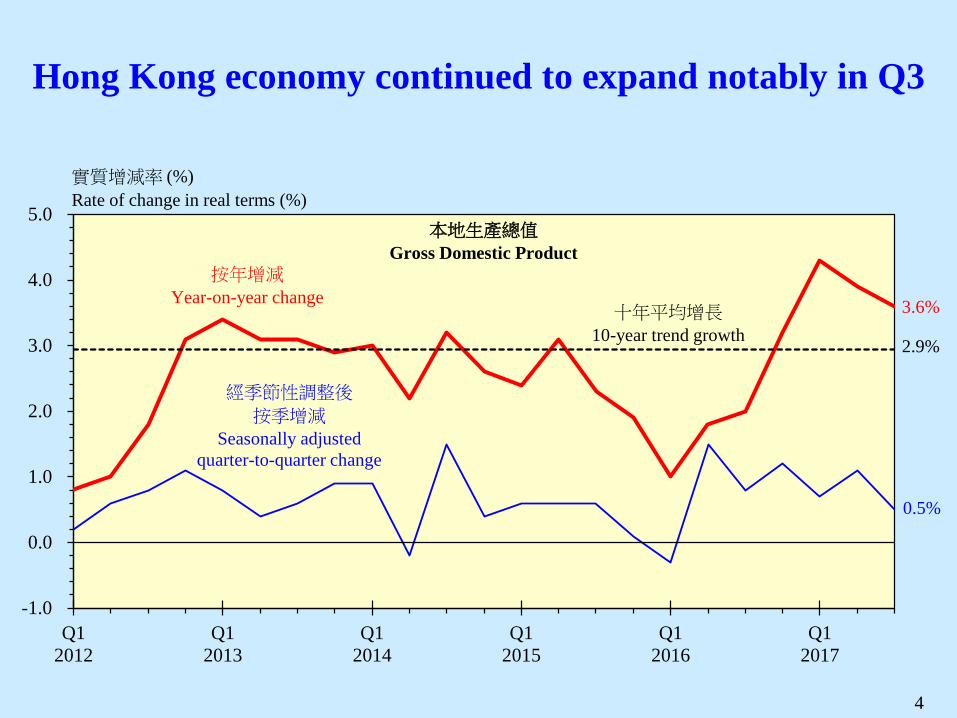
Hong Kong economy continued to expand notably in Q3
4
Q12012
Q12013
Q12014
Q12015
Q12016
Q12017
-1.0
0.0
1.0
2.0
3.0
4.0
5.0
按年增減
Year-on-year change
經季節性調整後
按季增減
Seasonally adjusted quarter-to-quarter change
實質增減率 (%)Rate of change in real terms (%)
本地生產總值
Gross Domestic Product
3.6%
0.5%
十年平均增長
10-year trend growth 2.9%

5
External sector
5
6
Continued expansion in global demand gave rise to vibrant growth in Asia’s exports
6
Q12008
Q12009
Q12010
Q12011
Q12012
Q12013
Q12014
Q12015
Q12016
Q12017
-40
-30
-20
-10
0
10
20
30
40
50
以美元計價按年增減率 (%)Year-on-year rate of change in US$ terms (%)
美國、歐元區及日本
的進口需求*Import demand of US, euro area and Japan*
選定亞洲經濟體的出口
Exports of selected Asian economies
註:
Notes:
選定亞洲經濟體包括中國內地、香港、印度、印尼、韓國、馬來西亞、菲律賓、新加坡、台灣及泰國。
(*) 由於數據有限,美國、歐元區及日本的進口需求最新數字為2017年7-8月合併的數字。
Selected Asian economies include Mainland China, Hong Kong, India, Indonesia, Korea, Malaysia, the Philippines, Singapore, Taiwan and Thailand.(*) Due to data limitations, the latest figure for import demand of US, euro area and Japan is Jul-Aug 2017 combined.

Q12012
Q12013
Q12014
Q12015
Q12016
Q12017
-8
-6
-4
-2
0
2
4
6
8
10
12
實質增減率 (%)Rate of change in real terms (%)
貨物出口
Exports of goods
5.5%
0.7%
按年增減
Year-on-year change
經季節性調整後按季增減
Seasonally adjusted quarter-to-quarter change
7
Hong Kong’s exports of goods maintained visible growth
7
Total exports of goods by major market
Year-on-year rate of change in real terms (%)
2016 2017
Annual Q1 Q2 Q3
Mainland 2.2 9.3 3.9 6.0
U.S. -1.9 3.4 1.1 -0.5
E.U. -0.7 3.0 1.3 5.0
Japan -2.3 7.5 12.0 10.8
India 17.6 40.1 53.8 9.9
Taiwan 19.0 44.3 23.0 14.7
Korea 1.5 15.3 -2.8 -1.5
Singapore 5.9 -1.2 3.9 11.7

8
Exports of services picked up in growth
8
Q12012
Q12013
Q12014
Q12015
Q12016
Q12017
-8
-6
-4
-2
0
2
4
6
8
10服務輸出
Exports of services
實質增減率 (%)Rate of change in real terms (%)
3.7%
2.8%
按年增減
Year-on-year change
經季節性調整後按季增減
Seasonally adjusted quarter-to-quarter change

9 9
Exports of services
Year-on-year rate of change in real terms (%)
Travel
Transport
Financial services
Business and other services
2016 Annual -8.6 2.2 -3.7 -1.0
Q3 -8.1 2.5 -1.7 -1.1
Q4 -4.0 9.6 -0.2 0.2
2017 Q1 -1.1 9.2 2.4 0.9
Q2 -1.9 8.2 2.9 0.5
Q3 1.8 7.0 4.1 0.6
Exports of services saw growth in all segments; exports of travel services resumed growth

10
Domestic sector
10
11
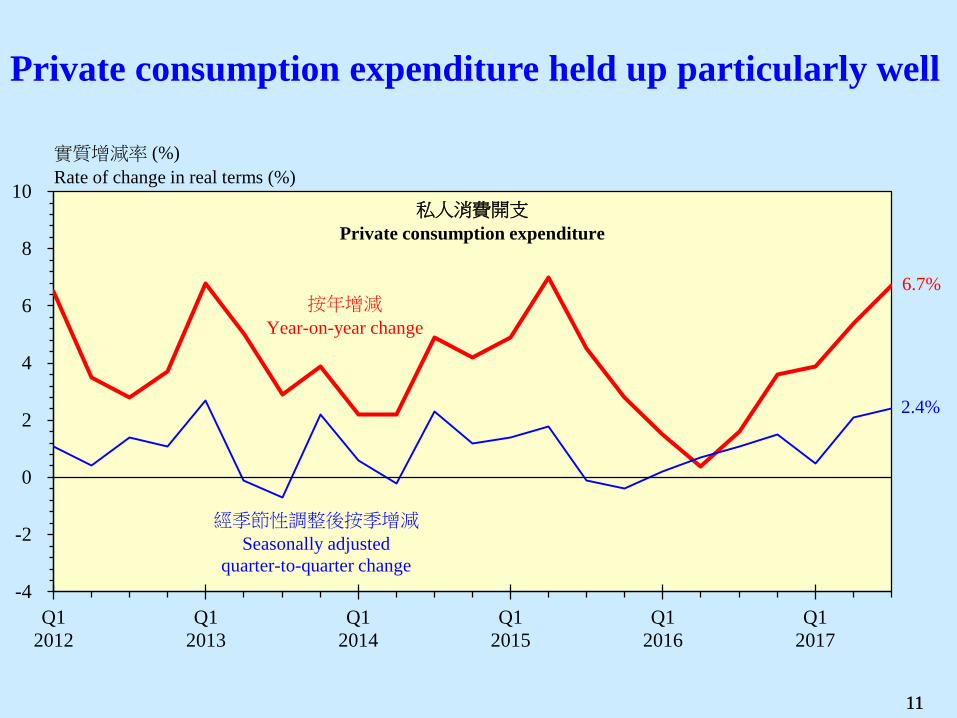
Private consumption expenditure held up particularly well
11
Q12012
Q12013
Q12014
Q12015
Q12016
Q12017
-4
-2
0
2
4
6
8
10
實質增減率 (%)Rate of change in real terms (%)
私人消費開支
Private consumption expenditure
6.7%
2.4%
按年增減
Year-on-year change
經季節性調整後按季增減
Seasonally adjusted quarter-to-quarter change
Q12012
Q12013
Q12014
Q12015
Q12016
Q12017
-15
-10
-5
0
5
10
15
本地固定資本形成總額
Gross domestic fixedcapital formation
按年實質增減率 (%)Year-on-year rate of change in real terms (%)
本地固定資本形成總額
Gross domestic fixedcapital formation
按年實質增減率 (%)Year-on-year rate of change in real terms (%)
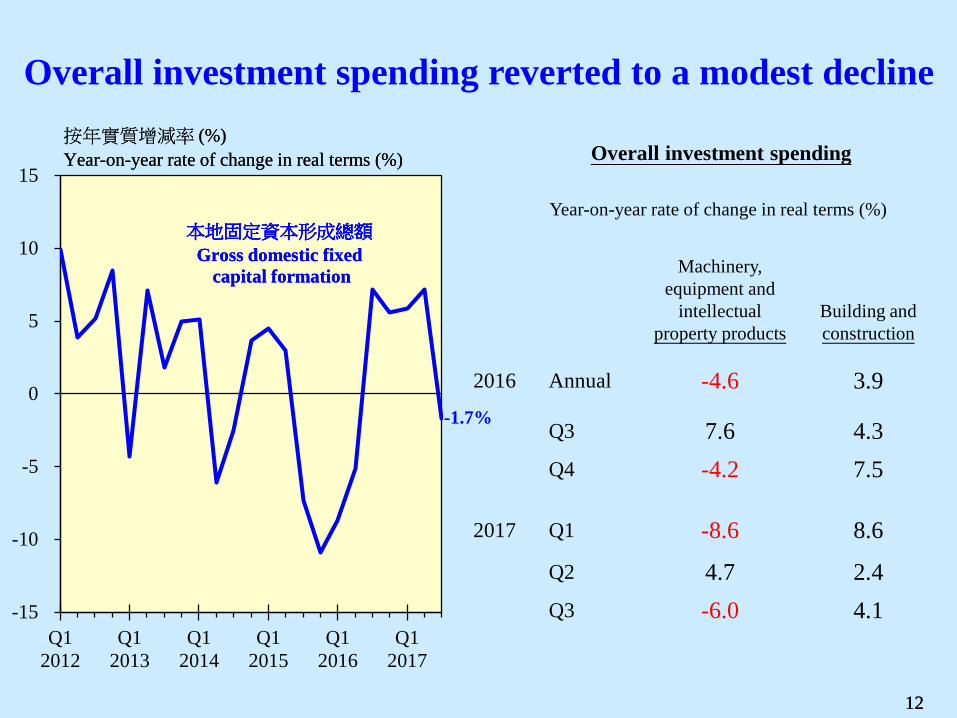
-1.7%
12
Overall investment spending reverted to a modest decline
12
Machinery,
equipment and intellectual
property products
Building and construction
2016 Annual -4.6 3.9
Q3 7.6 4.3 Q4 -4.2 7.5
2017 Q1 -8.6 8.6
Q2 4.7 2.4 Q3 -6.0 4.1
Year-on-year rate of change in real terms (%)
Overall investment spending

13
Labour market
13

14
Labour market remained in a state of full employment
註: 除整體失業率外,其他均為未經季節性調整數字。 Note: Not seasonally adjusted except the overall unemployment rate.
14
Q12000
Q12001
Q12002
Q12003
Q12004
Q12005
Q12006
Q12007
Q12008
Q12009
Q12010
Q12011
Q12012
Q12013
Q12014
Q12015
Q12016
Q12017
0
2
4
6
8
10
12
較低技術勞工
Lower-skilled workers
整體
Overall
失業率 (%)Unemployment rate (%)
專業及管理員工
Professional andmanagerial staff
1.7%
3.1%3.3%

Year-on-year rate of change (%)
Nominal growth
Real growth
Index of payroll per person engaged (Q2 2017) 3.8 1.7
Wage index (June 2017) 3.8 1.5
Median monthly household income (Q3 2017) 4.9 3.1
Average monthly employment earnings of full-time employees of the lowest three decile groups (Q3 2017) 6.1 4.0
15 15
Note: (*) Excluding foreign domestic helpers.
Income*
Incomes generally sustained gains in real terms

16
Inflation
16

17
Inflation pressure was largely contained Contribution to the year-on-year rate of change in the underlying Composite Consumer Price Index (CCPI) by major component
17 註: (*) 根據以二零一四至一五年度為基期的消費物價指數新數列計算。 Note: (*) By reference to the new 2014/15-based CPI series.
1.2 1.2 1.3 1.2 1.2 1.1 1.1 1.1 1.1 1.0 1.2 1.1 1.2 0.9 0.8 0.8
0.4 0.6 0.7
1.5 1.6 1.8 1.9 1.7 1.6 1.4 1.3 1.3 1.2
1.3 1.3 1.3
1.1 0.9 0.7
0.6 0.7 0.6
3.8 3.9 4.3
4.0 3.8
3.5 3.3 3.3
2.7 2.5 2.4 2.2
2.8
2.3 2.1 2.1
1.4
2.0 1.7
-0.5
0.0
0.5
1.0
1.5
2.0
2.5
3.0
3.5
4.0
4.5
5.0
5.5
6.0
Q1 13 Q2 13 Q3 13 Q4 13 Q1 14 Q2 14 Q3 14 Q4 14 Q1 15 Q2 15 Q3 15 Q4 15* Q1 16* Q2 16* Q3 16* Q4 16* Q1 17* Q2 17* Q3 17*
其他
Others交通
Transport私人房屋租金
Private housing rentals食品
Food基本綜合消費物價指數
Underlying CCPI
(%)(%)

18
Property market
18

Note: Mass market flats refer to those with a saleable area of less than 70 m2, while large flats refer to those with a saleable area of at least 100 m2.
19
Residential property market transactions eased in Q3, flat prices recorded a decelerated increase
19
-4
-3
-2
-1
0
1
2
3
4
07/15 10/15 01/16 04/16 07/16 10/16 01/17 04/17 07/17
整體住宅價格
Overall flat prices
0
1 000
2 000
3 000
4 000
5 000
6 000
7 000
8 000
9 000
09/15 03/16 09/16 03/17 09/17
買賣合約數目
Agreements received
1997-2016年每月平均
1997-2016 monthly average
中小型單位價格
Mass market flat prices
大型單位價格
Large flat prices
按月升跌 (%)Monthly rate of change (%)
住宅售價
Flat prices住宅物業買賣合約數目
No. of S&P agreements for residential property
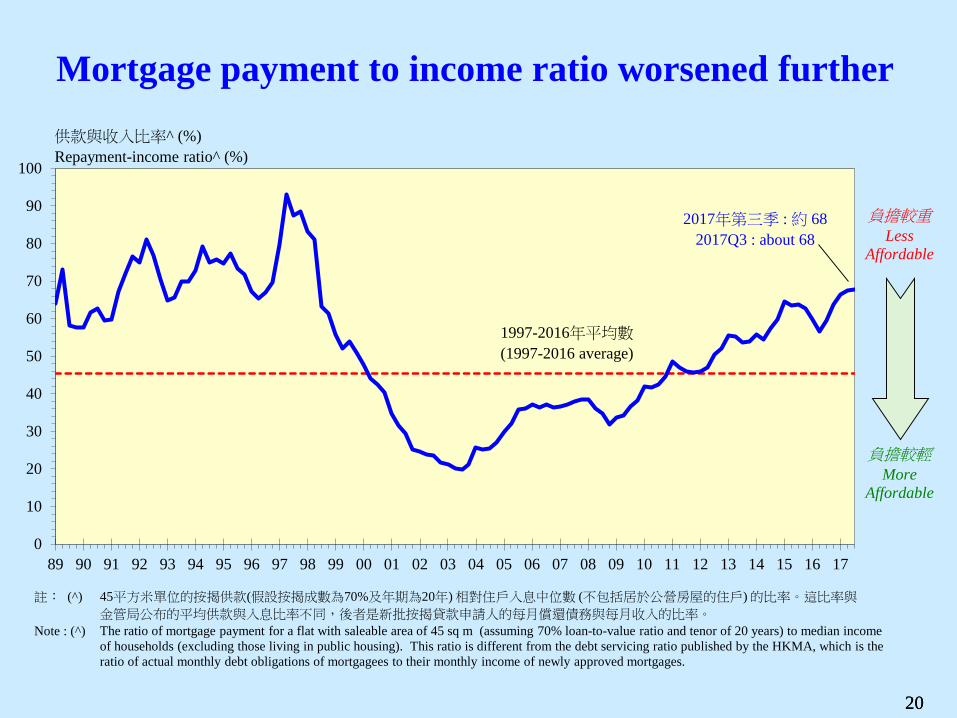
89 90 91 92 93 94 95 96 97 98 99 00 01 02 03 04 05 06 07 08 09 10 11 12 13 14 15 16 170
10
20
30
40
50
60
70
80
90
100
供款與收入比率^ (%)Repayment-income ratio^ (%)
1997-2016年平均數
(1997-2016 average)
45平方米單位的按揭供款(假設按揭成數為70%及年期為20年) 相對住戶入息中位數 (不包括居於公營房屋的住戶) 的比率。這比率與
金管局公布的平均供款與入息比率不同,後者是新批按揭貸款申請人的每月償還債務與每月收入的比率。
The ratio of mortgage payment for a flat with saleable area of 45 sq m (assuming 70% loan-to-value ratio and tenor of 20 years) to median incomeof households (excluding those living in public housing). This ratio is different from the debt servicing ratio published by the HKMA, which is theratio of actual monthly debt obligations of mortgagees to their monthly income of newly approved mortgages.
註︰ (^)
Note : (^)
負擔較輕More
Affordable
負擔較重Less
Affordable
2017年第三季 : 約 682017Q3 : about 68
20
Mortgage payment to income ratio worsened further
20

21
Total medium-term flat supply at a high level of 97 000
21
Q12006
Q12007
Q12008
Q12009
Q12010
Q12011
Q12012
Q12013
Q12014
Q12015
Q12016
Q12017
50 000
60 000
70 000
80 000
90 000
100 000
住宅單位數目
Number of domestic units
未來三至四年可提供的私人住宅單位數目
Number of domestic units to be available in the coming three to four years
以上數字包括已落成樓宇但仍未售出的單位數目、建築中而且尚未預售的單位數目,及已批出土地並可隨時動工的項目。
運輸及房屋局。
The above figures included unsold units in completed projects, units under construction but not yet sold by presale, and units from disposed sites whereconstruction may start anytime.Transport and Housing Bureau.
註︰
資料來源:
Note :
Source :

22
Outlook for the remaining 2017
22
23
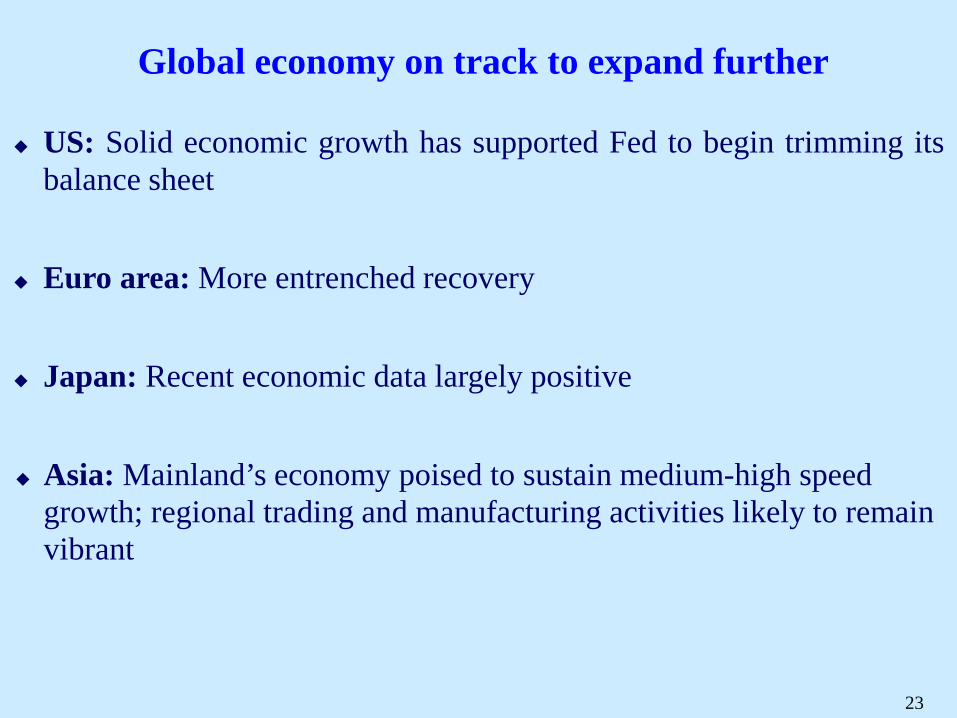
US: Solid economic growth has supported Fed to begin trimming its balance sheet
Euro area: More entrenched recovery
Japan: Recent economic data largely positive
Asia: Mainland’s economy poised to sustain medium-high speed growth; regional trading and manufacturing activities likely to remain vibrant
Global economy on track to expand further
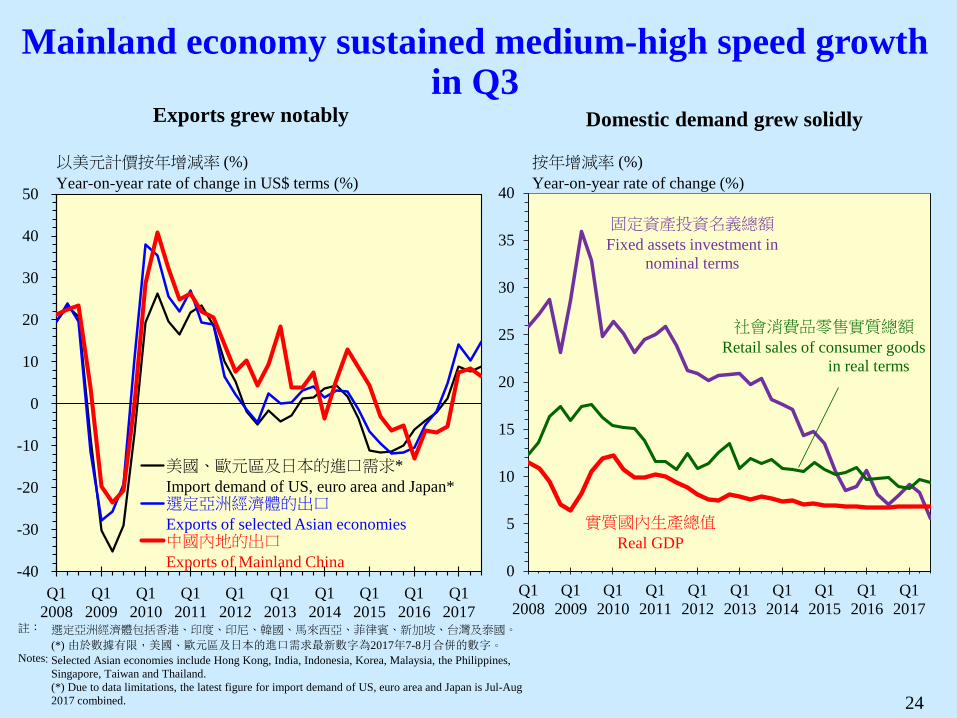
Mainland economy sustained medium-high speed growth in Q3
24
Exports grew notably Domestic demand grew solidly
Q12008
Q12009
Q12010
Q12011
Q12012
Q12013
Q12014
Q12015
Q12016
Q12017
-40
-30
-20
-10
0
10
20
30
40
50
美國、歐元區及日本的進口需求* Import demand of US, euro area and Japan*選定亞洲經濟體的出口
Exports of selected Asian economies 中國內地的出口
Exports of Mainland China
以美元計價按年增減率 (%)Year-on-year rate of change in US$ terms (%)
0
5
10
15
20
25
30
35
40
Q12008
Q12009
Q12010
Q12011
Q12012
Q12013
Q12014
Q12015
Q12016
Q12017
社會消費品零售實質總額
Retail sales of consumer goods in real terms
按年增減率 (%)Year-on-year rate of change (%)
固定資產投資名義總額
Fixed assets investment in nominal terms
實質國內生產總值
Real GDP
選定亞洲經濟體包括香港、印度、印尼、韓國、馬來西亞、菲律賓、新加坡、台灣及泰國。
(*) 由於數據有限,美國、歐元區及日本的進口需求最新數字為2017年7-8月合併的數字。
Selected Asian economies include Hong Kong, India, Indonesia, Korea, Malaysia, the Philippines, Singapore, Taiwan and Thailand.(*) Due to data limitations, the latest figure for import demand of US, euro area and Japan is Jul-Aug 2017 combined.
註:
Notes:

25
IMF revised up its global growth forecasts
GDP growth
in 2016
IMF forecasts for 2017 GDP growth
2017 Change between
Jul and Oct
Jul
Oct
World 3.2 3.5 3.6 0.1
U.S. 1.5 2.1 2.2 0.1
Euro area 1.8 1.9 2.1 0.2
Japan 1.0 1.3 1.5 0.2
Mainland China 6.7 6.7 6.8 0.1
Developing Asia 6.4 6.5 6.5 0.0
Emerging market and developing economies 4.3 4.6 4.6 0.0
26
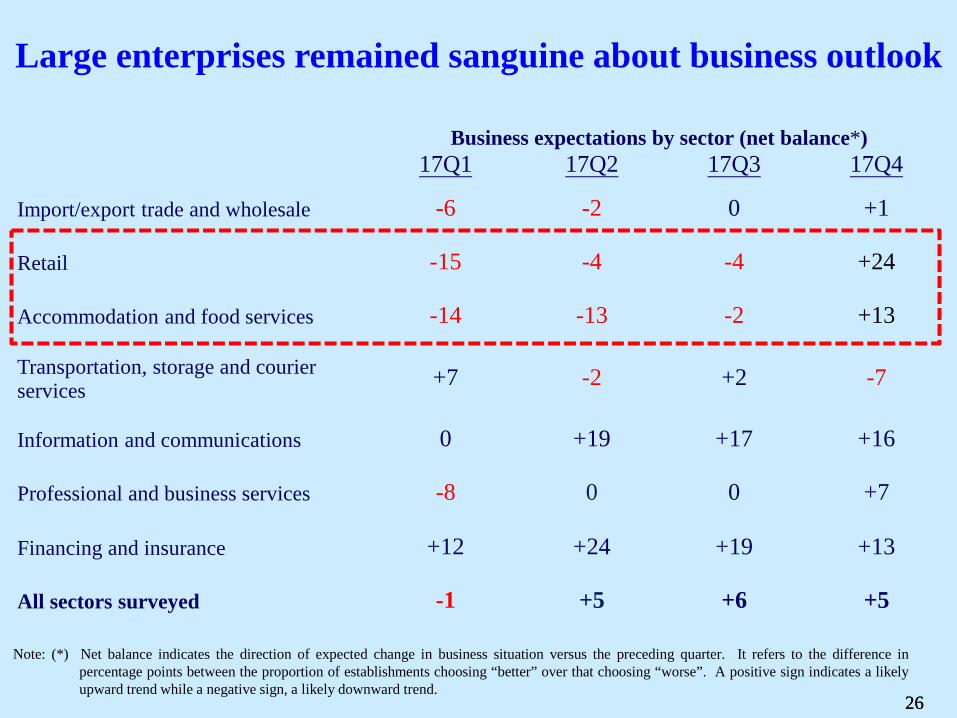
Business expectations by sector (net balance*) 17Q1 17Q2 17Q3 17Q4
Import/export trade and wholesale -6 -2 0 +1
Retail -15 -4 -4 +24
Accommodation and food services -14 -13 -2 +13
Transportation, storage and courier services +7 -2 +2 -7
Information and communications 0 +19 +17 +16
Professional and business services -8 0 0 +7
Financing and insurance +12 +24 +19 +13
All sectors surveyed -1 +5 +6 +5
Large enterprises remained sanguine about business outlook
26
Note: (*) Net balance indicates the direction of expected change in business situation versus the preceding quarter. It refers to the difference in percentage points between the proportion of establishments choosing “better” over that choosing “worse”. A positive sign indicates a likely upward trend while a negative sign, a likely downward trend.

27
Improving external environment should support our exports down the road
Domestic demand is likely to stay firm
While there remain various uncertainties in the external environment, Hong Kong economy is poised for further solid growth in the rest of this year
Upside risks to inflation remain limited
Near-term economic outlook

28
Latest economic forecasts for 2017 as a whole
Forecasts as released on 11 August
Latest
forecasts
Real GDP growth 3-4% 3.7%
Underlying inflation 1.8% 1.7%
Headline inflation 1.6% 1.5%
28

29
Third Quarter Economic Report 2017 &
Updated economic forecasts for 2017
10 November 2017
Hong Kong SAR Government
29