third quarter and first nine months 2016 results...1 paris, october 28, 2016 third quarter and first...
TRANSCRIPT

1
Paris, October 28, 2016
Third quarter and first nine months 2016 results
Total’s Board of Directors met on October 27, 2016, to review the Group’s third quarter accounts. Commenting on the results, Chairman and CEO Patrick Pouyanné said: “Total once again reported solid quarterly results with adjusted net income of $2.1 billion and operating cash flow before working capital changes of $4.5 billion. The Group increased cash flow by 13% compared to the second quarter 2016 despite a 27% reduction in European refining margins and flat Brent prices. Total continues to benefit from its integrated business model and is responding effectively to short-term challenges due to good operational performance and strong cost discipline. In the Upstream, production increased by more than 4% compared to a year ago. Following the start up of Laggan-Tormore, Vega Pleyade and Angola LNG in the first half of the year, Incahuasi was put on stream in August and Kashagan in October. The five major projects of the year are thus all in production. The Downstream contribution remained strong during the third quarter despite the decrease in European refining margins, and cash flow generation over the first 9 months was $5 billion, in line with the target for the year. Discipline on cost control continued. Organic investments were $4.1 billion in the third quarter, and the Group plans to invest $18 billion in 2016. Operating costs continue to fall and savings are expected to increase to more than $2.7 billion in 2016, or 10% above the objective set at the start of the year. In addition, the sale of Atotech for $3.2 billion in cash, or close to 12 times Ebitda, was part of the Group’s portfolio management strategy to align its asset base with its ambitions and contributes to achieving the $10 billion asset sale program for 2015-17. Finally, the net debt to equity ratio is stable at 30.6%, confirming the priority given to maintaining a strong balance sheet.” 1 Definition on page 2. 2 Group share. 3 The ex-dividend date will be March 20, 2017, and the payment date will be set for April 6, 2017.
3Q16Change vs 3Q15
9M16Change vs
9M15
Adjusted net income1
- in billions of dollars (B$) 2.1 -25% 5.9 -30%
- in dollars per share 0.84 -28% 2.42 -34%
Operating cash flow
before working capital changes1 (B$)4.5 -11% 12.2 -19%
Net income2 of 2.0 B$ in 3Q16
Net-debt-to-equity ratio of 31% at September 30, 2016
Hydrocarbon production of 2,443 kboe/d in the third quarter 2016
3Q16 interim dividend of 0.61 €/share payable in April 20173
New
s Rel
ease
Com
mun
iqué
de
Pres
se
2, place Jean Millier Arche Nord Coupole/Regnault 92 400 Courbevoie France Mike SANGSTER
Nicolas FUMEX Kim HOUSEGO Romain RICHEMONT
Tel. : + 44 (0)207 719 7962 Fax : + 44 (0)207 719 7959 Robert HAMMOND (U.S.) Tel. : +1 713-483-5070 Fax : +1 713-483-5629 TOTAL S.A. Capital : 6 321 148 030,00 € € 542 051 180 R.C.S. Nanterre total.com

2
Key figures456789
* Average €-$ exchange rate: 1.1166 in the third quarter 2016 and 1.1162 in the first nine months 2016. Highlights since the beginning of the third quarter 201610
Started up production on the Incahuasi gas field in Bolivia with a capacity of 50 thousand barrels of oil equivalent per day (kboe/d)
Re-started production on the giant Kashagan field in Kazakhstan with a nameplate capacity of 370 kb/d
Exercised pre-emption right to acquire Barnett shale gas assets with a capacity of about 65 kboe/d in 2016
Oil discovery in the Black Sea (Bulgaria) opening a new play, and acquisition of the CI-605 license in Ivory Coast
Successful appraisal of the giant deep offshore Owowo field in Nigeria (discovered by Total in 2012)
Sale of specialty chemicals unit Atotech for $3.2 billion, or close to 12 times Ebitda
Signed an agreement to supply 0.4 million tons of LNG per year to Chugoku Electric in Japan for a period of 17 years
4 Adjusted results are defined as income using replacement cost, adjusted for special items, excluding the impact of changes for fair value; adjustment items are on page 9. 5 Tax on adjusted net operating income / (adjusted net operating income – income from equity affiliates – dividends received from investments – impairment of goodwill + tax on adjusted net operating income). 6 Including acquisitions and increases in non-current loans. 7 Net investments = investments - divestments - repayment of non-current loans - other operations with non-controlling interests. 8 Organic investments = net investments excluding acquisitions, asset sales, and other operations with non-controlling interests. 9 Operating cash flow before working capital changes, previously referred to as adjusted cash flow from operations, is defined as cash flow from operating activities before changes in working capital at replacement cost. The inventory valuation effect is explained on page 13. 10 Certain transactions referred to in the highlights are subject to approval by authorities or to other conditions as per the agreements.
3Q16 2Q16 3Q153Q16
vs3Q15
In millions of dollars, except effective tax rate,earnings per share and number of shares
9M16 9M159M16
vs9M15
37,412 37,215 40,580 -8% Sales 107,468 127,608 -16%
2,237 1,979 3,204 -30% Adjusted operating income from business segments 5,986 10,579 -43%
2,339 2,523 2,963 -21% Adjusted net operating income from business segments 6,740 9,077 -26%
877 1,127 1,107 -21% Upstream 2,502 4,026 -38%
917 1,018 1,433 -36% Refining & Chemicals 3,063 3,882 -21%
545 378 423 +29% Marketing & Services 1,175 1,169 +1%
515 797 493 +4% Contribution of equity affiliates to adjusted net income 1,811 1,804 -
21.5% 21.8% 27.2% - Group effective tax rate5* 22.0% 35.5% -
2,070 2,174 2,756 -25% Adjusted net income 5,880 8,443 -30%
0.84 0.90 1.17 -28% Adjusted fully-diluted earnings per share (dollars) 2.42 3.64 -34%
0.76 0.79 1.06 -28% Adjusted fully-diluted earnings per share (euros)* 2.17 3.27 -34%
2,404 2,379 2,312 +4% Fully-diluted weighted-average shares (millions) 2,375 2,295 +3%
1,954 2,088 1,079 +81% Net income (Group share) 5,648 6,713 -16%
5,201 4,566 6,040 -14% Investments6 14,675 21,439 -32%
192 773 410 -53% Divestments 1,950 5,287 -63%
5,116 3,790 5,630 -9% Net investments7 12,829 16,071 -20%
4,082 4,059 5,394 -24% Organic investments8 12,756 16,611 -23%
4,522 4,000 5,059 -11%Operating cash flow
before working capital changes9 12,230 15,011 -19%
4,740 2,882 5,989 -21% Cash flow from operations 9,503 15,108 -37%

3
Analysis of business segments Upstream
> Environment – liquids and gas price realizations*
* Consolidated subsidiaries, excluding fixed margins.
> Production
Hydrocarbon production was 2,443 thousand barrels of oil equivalent per day (kboe/d) in the third quarter 2016, an increase of 4.3% compared to the third quarter 2015, due to the following: +7% due to new start ups and ramp ups, notably Laggan-Tormore, Vega Pleyade, Surmont Phase 2, Moho
Phase 1b, Gladstone LNG and Incahuasi; -2% due to the security situation in Nigeria and wild fires in Canada; -1% due to natural field decline and maintenance operations, partially offset by a positive PSC price effect
and good performance of new wells. In the first nine months 2016, hydrocarbon production was 2,449 kboe/d, an increase of 4.4% compared to the first nine months 2015, due to the following: +5% due to new start ups and ramp ups, notably Laggan-Tormore, Termokarstovoye, Surmont Phase 2,
Moho Phase 1b, Gladstone LNG and Vega Pleyade; -2% due to the security situation in Nigeria and Yemen, and wild fires in Canada; +1% due to the PSC price effect and operational performance offsetting natural field decline.
3Q16 2Q16 3Q153Q16
vs3Q15
9M16 9M159M16
vs9M15
45.9 45.6 50.5 -9% Brent ($/b) 41.9 55.3 -24%
41.4 43.0 44.0 -6% Average liquids price ($/b) 38.4 50.5 -24%
3.45 3.43 4.47 -23% Average gas price ($/Mbtu) 3.45 4.85 -29%
32.4 33.0 36.6 -11% Average hydrocarbon price ($/boe) 30.6 41.3 -26%
3Q16 2Q16 3Q153Q16
vs3Q15
Hydrocarbon production 9M16 9M159M16
vs9M15
2,443 2,424 2,342 +4% Combined production (kboe/d) 2,449 2,345 +4%
1,290 1,253 1,241 +4% Liquids (kb/d) 1,276 1,232 +4%
6,286 6,466 6,003 +5% Gas (Mcf/d) 6,397 6,074 +5%

4
> Results
* Details on adjustment items are shown in the business segment information annex to financial statements. ** Tax on adjusted net operating income / (adjusted net operating income - income from equity affiliates - dividends received from investments- impairment of goodwill + tax on adjusted net operating income). In the third quarter 2016, Upstream operating cash flow before working capital changes was 2,751 M$, an increase of 21% compared to the second quarter 2016 in an unchanged price environment, notably due to the ramps ups of new production with higher margins and the decrease in operating costs. In the first nine months 2016, Upstream operating cash flow before working capital changes was 6,863 M$, a decrease of 21% compared to the first nine months 2015, essentially due to the decrease in hydrocarbon prices, partially offset by the increase in production and decrease in operating costs. Upstream adjusted net operating income was: 877 M$ in the third quarter 2016, a decrease of 21% compared to the third quarter 2015, essentially due to
the decrease in the average hydrocarbon price, partially offset by the increase in production and decrease in operating costs;
2,502 M$ in the first nine months 2016, a decrease of 38% compared to the first nine months 2015. The increase in production combined with the decrease in operating costs and exploration expenses as well as the lower effective tax rate partially offset the decrease in the average hydrocarbon price.
Refining & Chemicals
> Refinery throughput and utilization rates*
* Includes share of TotalErg, as well as refineries in Africa and the French Antilles that are reported in the Marketing & Services segment. The condensate splitters at Port Arthur and Daesan are also included and 2015 figures have been restated. ** Based on distillation capacity at the beginning of the year. Refinery throughput: decreased by 6% in the third quarter 2016 compared to the third quarter 2015, due to a higher level of
maintenance and the sale of the Schwedt refinery in the fourth quarter 2015; decreased by 4% in the first nine months 2016 compared to the first nine months 2015, mainly due to
outages in Europe and the United States in the second quarter and the sale of the Schwedt refinery.
3Q16 2Q16 3Q153Q16
vs3Q15
In millions of dollars, except effective tax rate 9M16 9M159M16
vs9M15
781 580 994 -21% Adjusted operating income* 1,503 4,520 -67%
28.1% 3.2% 33.8% - Effective tax rate** 14.1% 44.5% -
877 1,127 1,107 -21% Adjusted net operating income* 2,502 4,026 -38%
260 452 316 -18% including income from equity affiliates 981 1,308 -25%
3,648 3,539 5,173 -29% Investments 11,424 18,977 -40%
129 448 272 -53% Divestments 1,492 1,813 -18%
3,356 3,261 4,676 -28% Organic investments 10,764 15,400 -30%
2,751 2,281 2,736 +1%Operating cash flow before working capital changes
6,863 8,665 -21%
2,380 983 2,320 +3% Cash flow from operations 5,476 8,558 -36%
3Q16 2Q16 3Q153Q16
vs3Q15
9M16 9M159M16
vs9M15
1,947 1,795 2,061 -6% Total refinery throughput (kb/d) 1,949 2,024 -4%
681 522 662 +3% France 653 671 -3%
771 803 891 -13% Rest of Europe 806 853 -6%
495 470 508 -3% Rest of world 490 500 -2%
Utlization rates**
85% 77% 87% Based on crude only 84% 86%
87% 80% 90% Based on crude and other feedstock 87% 88%

5
> Results
* Details on adjustment items are shown in the business segment information annex to financial statements. ** Hutchinson and Atotech, Bostik until February 2015. The Group’s European refining margin indicator (ERMI) was impacted by high inventory levels, falling to 25.5 $/t in the third quarter 2016, a 53% decrease compared to the third quarter 2015. The petrochemical environment remained favorable, even though margins were down compared to the third quarter 2015. Refining & Chemicals adjusted net operating income was: 917 M$ in the third quarter 2016, a decrease of only 36% compared to the third quarter 2015 despite the
strong decrease in refining margins and lower petrochemical margins, due to the reduction in breakeven and the strong operational performance of the Group’s major integrated platforms;
3,063 M$ in the first nine months 2016, a decrease of 21% compared to the first nine months 2015 due to the less favorable environment.
Marketing & Services
> Petroleum product sales
* 2015 data restated.
** Excludes trading and bulk refining sales, includes share of TotalErg. In the third quarter 2016, petroleum product sales decreased by 1% compared to the third quarter 2015, mainly due to the sale of the marketing network in Turkey in the second quarter 2016. In the first nine months 2016, refined product sales decreased by 2% compared to the first nine months 2015, essentially due to the disposal of mature assets or assets lacking critical mass. Excluding the portfolio effects, retail network sales and sales of land-based lubricants increased by nearly 4%.
3Q16 2Q16 3Q153Q16
vs3Q15
In millions of dollarsexcept the ERMI
9M16 9M159M16
vs9M15
25.5 35 54.8 -53% European refining margin indicator - ERMI ($/t) 31.9 52 -39%
891 965 1,713 -48% Adjusted operating income* 3,153 4,652 -32%
917 1,018 1,433 -36% Adjusted net operating income* 3,063 3,882 -21%
150 150 128 +17% including Specialty Chemicals** 416 379 +10%
550 480 358 +54% Investments 1,289 1,257 +3%
21 23 12 +75% Divestments 73 2,652 -97%
399 457 348 +15% Organic investments 1,088 333 x3.2
1,052 1,138 1,797 -41%Operating cash flow before working capital changes
3,509 4,743 -26%
1,698 1,560 2,291 -26% Cash flow from operations 2,837 4,305 -34%
3Q16 2Q16 3Q15*3Q16
vs3Q15
Sales in kb/d** 9M16 9M15*9M16
vs9M15
1,814 1,793 1,839 -1% Total Marketing & Services sales 1,788 1,825 -2%
1,113 1,074 1,121 -1% Europe 1,083 1,101 -2%
701 719 718 -2% Rest of world 705 724 -3%

6
> Results
* Details on adjustment items are shown in the business segment information annex to financial statements. Marketing & Services adjusted net operating income was: 545 M$ in the third quarter 2016, a 29% increase compared to the third quarter 2015, due to a strong
contribution from New Energies with the sale of the Henrietta solar farm in the United States; 1,175 M$ in the first nine months 2016, stable compared to the first nine months 2015. The impact of assets
sales was offset by the contribution from New Energies in the third quarter. At 1.2 B$, investments were sharply higher in the third quarter 2016 compared to the third quarter 2015 due to the acquisition of Saft for 1 B$. Organic investments, however, decreased by 12% over the same period. Group results
> Net operating income from business segments
Adjusted net operating income from the business segments was: 2,339 M$ in the third quarter 2016, a decrease of 21% compared to the third quarter 2015, mainly due to
lower average hydrocarbon prices in the Upstream and lower refining margins; 6,740 M$ in the first nine months of 2016, a decrease of 26% compared to the first nine months 2015 for the
same reasons. The effective tax rate11 for the business segments was: 23.5% in the third quarter 2016 compared to 29.8% in the third quarter 2015, mainly due to the lower
effective tax rate in the Upstream; 22.5% in the first nine months 2016 compared to 35.0% in the first nine months 2015, for the same
reason.
> Net income (Group share)
Adjusted net income, evolving in line with the net operating income, was: 2,070 M$ in the third quarter 2016 compared to 2,756 M$ in the third quarter 2015, a decrease of 25%; 5,880 M$ in the first nine months 2016 compared to 8,443 M$ in the first nine months 2015, a decrease of
30%. Adjusted net income excludes the after-tax inventory effect, special items and the impact of changes in fair value12. 11 Tax on adjusted net operating income / (adjusted net operating income – income from equity affiliates – dividends received from investments – impairment of goodwill + tax on adjusted net operating income). 12 Details shown on page 13.
3Q16 2Q16 3Q153Q16
vs3Q15
In millions of dollars 9M16 9M159M16
vs9M15
17,964 17,305 19,522 -8% Sales 50,702 59,561 -15%
565 434 497 +14% Adjusted operating income* 1,330 1,407 -5%
545 378 423 +29% Adjusted net operating income* 1,175 1,169 +1%
100 (43) (82) na including New Energies 20 (169) na
1,175 339 501 x2.3 Investments 1,904 1,152 +65%
40 296 121 -67% Divestments 373 800 -53%
322 329 365 -12% Organic investments 872 832 +5%
600 511 518 +16%Operating cash flow before working capital changes
1,473 1,467 -
495 (15) 1,011 -51% Cash flow from operations 720 2,034 -65%

7
Total adjustments affecting net income (Group share)13 were: -116 M$ in the third quarter 2016; -232 M$ in the first nine months 2016, including mainly the inventory effect, the gain on the sale of the
FUKA gas pipeline network in the North Sea in the first quarter and the impairment of assets that were not developed in the second quarter 2016.
The number of fully-diluted shares was 2,407 million on September 30, 2016, and 2,310 million on September 30, 2015.
Divestments – acquisitions
Asset sales were: 91 M$ in the third quarter 2016; 1,448 M$ in the first nine months 2016, comprised mainly of the sales of the FUKA gas pipeline network in
the North Sea and the retail network in Turkey.
Acquisitions were: 1,018 M$ in the third quarter 2016, comprised mainly of the acquisitions of Saft and Lampiris; 1,417 M$ in the first nine months 2016, comprised mainly of the acquisitions of Saft, Lampiris and a retail
network in the Dominican Republic. The impact on net cash flow from asset sales and acquisitions was -927 M$ in the third quarter 2016 compared to -236 M$ in the third quarter 2015. The impact was 31 M$ in the first nine months 2016 compared to 459 M$ in the first nine months 2015.
Net cash flow
The Group’s net cash flow14 was: -594 M$ in the third quarter 2016 compared to -571 M$ in the third quarter 2015 despite the 11% drop in
Brent price, 53% decrease in refining margins and the Group’s higher acquisitions in the third quarter 2016. This performance is due to the resilience of cash flow generation and lower organic investments;
-599 M$ in the first nine months 2016 compared to -1,060 M$ in the first nine months 2015, an improvement despite the decrease in Brent price from 55 $/b to 42 $/b and a decrease of 39% in refining margins. Operating cash flow before working capital changes was 12.2 B$ compared to 15.0 B$ in the first nine months 2015 and net investments were 12.8 B$ compared to 16.1 B$ in the first nine months 2015, mainly due to the decrease in organic investments.
Return on equity
Return on equity from October 1, 2015 to September 30, 2016 was 8.3%15.
13 Details shown on page 10 and in the annex to the financial statements. 14 Net cash flow = operating cash flow before working capital changes - net investments (including other transactions with non-controlling interests). 15 Details shown on page 12.

8
Summary and outlook Following the remarks by OPEC countries and Russia, Brent rose to around 50 $/b despite high inventory levels. With the market expected to remain volatile, Total is pursuing its efforts to lower its breakeven. In the Upstream, the five major projects of the year have all been put on stream and production is ramping up. The production target of more than 4% growth in 2016 compared to 2015 is set to be achieved and the teams are focused on delivering the 2017-18 project start-ups. In 2017, production from projects started up since 2015 are expected to deliver 350 kboe/d net to Total and around 3 B$ in cash flow with Brent at 60 $/b, given that these new barrels have a higher average margin than existing production. In the Downstream, refining margins have increased to 40 $/t at the beginning of the fourth quarter driven by a high level of maintenance as well as logistics constraints, resulting in tight gasoline market conditions. The petrochemical market remains favorable and the Group’s major platforms are well-positioned to benefit from this. The Group’s cost reduction program is ahead of schedule, underlining its ability to deliver the 4 B$ savings target by 2018. Given the capex guidance of 15-17 B$ from 2017 and increase in operating cash flow, the Group’s net cash flow is entering a growth phase. Operating cash flow before working capital changes should cover organic investments, including resource renewal, and dividend cash-out, with oil prices at 55 $/b in 2017. The discounted scrip dividend will be ended in 2017 if Brent is at 60 $/b.
To listen to CFO Patrick de La Chevardière’s conference call with financial analysts today at 13:00 (London time) please log on to total.com or call +44 (0)203 427 1914 in Europe or +1 646 254 3388 in the United States (access code: 1018478). For a replay, please consult the website or call +44 (0)203 427 0598 in Europe or +1 347 366 9565 in the United States (access code: 1018478).

9
Operating information by segment Upstream*
* The regional reporting has been changed to reflect the Company’s internal organization. Historical data is available at total.com.
** Sales, Group share, excluding trading; 2015 data restated to reflect volume estimates for Bontang LNG in Indonesia based on the 2015 SEC coefficient.
3Q16 2Q16 3Q153Q16
vs3Q15
Combined liquids and gasproduction by region (kboe/d)
9M16 9M159M16
vs9M15
720 770 677 +6% Europe and Central Asia 759 658 +15%
649 634 646 - Africa 638 639 -
529 505 525 +1% Middle East and North Africa 522 541 -3%
285 251 249 +14% Americas 265 255 +4%
261 264 245 +6% Asia Pacific 265 253 +5%
2,443 2,424 2,342 +4% Total production 2,449 2,345 +4%
592 627 574 +3% including equity affiliates 613 565 +9%
3Q16 2Q16 3Q153Q16
vs3Q15
Liquids production by region (kb/d) 9M16 9M159M16
vs9M15
238 251 219 +9% Europe and Central Asia 247 211 +17%
524 511 522 - Africa 518 520 -
380 367 378 +1% Middle East and North Africa 376 376 -
118 93 92 +29% Americas 105 93 +13%
29 30 30 -4% Asia Pacific 31 33 -6%
1,290 1,253 1,241 +4% Total production 1,276 1,232 +4%
249 265 230 +8% including equity affiliates 251 218 +15%
3Q16 2Q16 3Q153Q16
vs3Q15
Gas production by region (Mcf/d) 9M16 9M159M16
vs9M15
2,594 2,876 2,458 +6% Europe and Central Asia 2,760 2,406 +15%
617 594 622 -1% Africa 592 593 -
813 762 806 +1% Middle East and North Africa 805 905 -11%
927 881 878 +6% Americas 889 905 -2%
1,335 1,353 1,239 +8% Asia Pacific 1,351 1,265 +7%
6,286 6,466 6,003 +5% Total production 6,397 6,074 +5%
1,831 1,927 1,850 -1% including equity affiliates 1,932 1,858 +4%
3Q16 2Q16 3Q153Q16
vs3Q15
Liquefied natural gas 9M16 9M159M16
vs9M15
2.69 2.76 2.53 +6% LNG sales** (Mt) 8.09 7.74 +5%

10
Downstream (Refining & Chemicals and Marketing & Services)
* 2015 data restated. **Includes share of TotalErg.
Adjustment items
Adjustments to operating income
Adjustment to net income (Group share)
3Q16 2Q16 3Q15*3Q16
vs3Q15
Petroleum product sales by region (kb/d)** 9M16 9M15*9M16
vs9M15
2,430 2,372 2,282 +6% Europe 2,363 2,146 +10%
537 597 609 -12% Africa 545 643 -15%
627 597 585 +7% Americas 585 597 -2%
567 705 610 -7% Rest of world 681 636 +7%
4,161 4,271 4,086 +2% Total consolidated sales 4,174 4,022 +4%
706 717 648 +9% Including bulk sales 707 636 +11%
1,641 1,761 1,599 +3% Including trading 1,679 1,561 +8%
3Q16 2Q16 3Q15 In millions of dollars 9M16 9M15
(115) (633) (654) Special items affecting operating income (1,212) (2,505)
(15) (8) - Restructuring charges (34) -
- (200) (650) Impairments (200) (1,944)
(100) (425) (4) Other (978) (561)
(47) 634 (1,127) Pre-tax inventory effect: FIFO vs. replacement cost 305 (649)
(18) (6) (10) Effect of changes in fair value (21) (16)
(180) (5) (1,791) Total adjustments affecting operating income (928) (3,170)
3Q16 2Q16 3Q15 In millions of dollars 9M16 9M15
(98) (486) (912) Special items affecting net income (Group share) (434) (1,289)
(32) (14) (98) Gain (loss) on asset sales 312 1,231
(18) (2) (12) Restructuring charges (22) (43)
(33) (178) (650) Impairments (211) (2,004)
(15) (292) (152) Other (513) (473)
(5) 405 (760) After-tax inventory effect: FIFO vs. replacement cost 217 (432)
(13) (5) (5) Effect of changes in fair value (15) (9)
(116) (86) (1,677) Total adjustments affecting net income (232) (1,730)
11
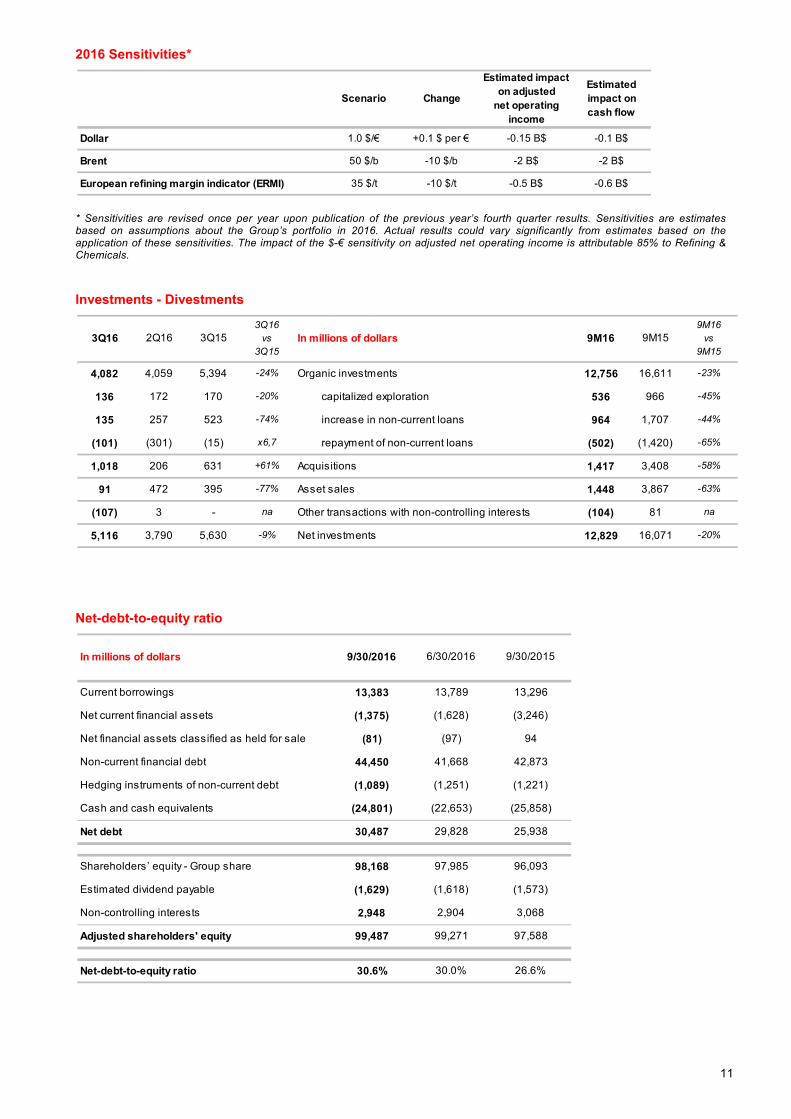
2016 Sensitivities*
* Sensitivities are revised once per year upon publication of the previous year’s fourth quarter results. Sensitivities are estimates based on assumptions about the Group’s portfolio in 2016. Actual results could vary significantly from estimates based on the application of these sensitivities. The impact of the $-€ sensitivity on adjusted net operating income is attributable 85% to Refining & Chemicals. Investments - Divestments
Net-debt-to-equity ratio
Scenario Change
Estimated impact on adjusted
net operating income
Estimated impact on cash flow
Dollar 1.0 $/€ +0.1 $ per € -0.15 B$ -0.1 B$
Brent 50 $/b -10 $/b -2 B$ -2 B$
European refining margin indicator (ERMI) 35 $/t -10 $/t -0.5 B$ -0.6 B$
3Q16 2Q16 3Q153Q16
vs3Q15
In millions of dollars 9M16 9M159M16
vs9M15
4,082 4,059 5,394 -24% Organic investments 12,756 16,611 -23%
136 172 170 -20% capitalized exploration 536 966 -45%
135 257 523 -74% increase in non-current loans 964 1,707 -44%
(101) (301) (15) x6,7 repayment of non-current loans (502) (1,420) -65%
1,018 206 631 +61% Acquisitions 1,417 3,408 -58%
91 472 395 -77% Asset sales 1,448 3,867 -63%
(107) 3 - na Other transactions with non-controlling interests (104) 81 na
5,116 3,790 5,630 -9% Net investments 12,829 16,071 -20%
In millions of dollars 9/30/2016 6/30/2016 9/30/2015
Current borrowings 13,383 13,789 13,296
Net current financial assets (1,375) (1,628) (3,246)
Net financial assets classified as held for sale (81) (97) 94
Non-current financial debt 44,450 41,668 42,873
Hedging instruments of non-current debt (1,089) (1,251) (1,221)
Cash and cash equivalents (24,801) (22,653) (25,858)
Net debt 30,487 29,828 25,938
Shareholders’ equity - Group share 98,168 97,985 96,093
Estimated dividend payable (1,629) (1,618) (1,573)
Non-controlling interests 2,948 2,904 3,068
Adjusted shareholders' equity 99,487 99,271 97,588
Net-debt-to-equity ratio 30.6% 30.0% 26.6%

12
Return on equity
Return on average capital employed
Twelve months ended September 30, 2016
Twelve months ended June 30, 2016
Twelve months ended December 31, 2015
* At replacement cost (excluding after-tax inventory effect).
In millions of dollars
Adjusted net income
Average adjusted shareholders' equity
Return on equity (ROE)
January 1, 2015 to December 31, 2015
10,698
92,854
11.5%8.3% 8.9%
October 1, 2015 to September 30, 2016
July 1, 2015 to June 30, 2016
8,207 8,817
98,538 99,029
In millions of dollars UpstreamRefining & Chemicals
Marketing & Services
Group
Adjusted net operating income 3,250 4,070 1,705 8,968
Capital employed at 9/30/2015* 108,425 11,319 7,865 123,904
Capital employed at 9/30/2016* 110,590 12,030 10,316 130,534
ROACE 3.0% 34.9% 18.8% 7.0%
In millions of dollars UpstreamRefining & Chemicals
Marketing & Services
Group
Adjusted net operating income 3,480 4,586 1,583 9,565
Capital employed at 06/30/2015* 107,214 12,013 8,234 124,001
Capital employed at 06/30/2016* 108,733 12,249 9,021 129,635
ROACE 3.2% 37.8% 18.3% 7.5%
In millions of dollars UpstreamRefining & Chemicals
Marketing & Services
Group
Adjusted net operating income 4,774 4,889 1,699 11,400
Capital employed at 12/31/2014* 100,497 13,451 8,825 120,526
Capital employed at 12/31/2015* 105,580 10,407 8,415 121,143
ROACE 4.6% 41.0% 19.7% 9.4%

13
This press release presents the results for the third quarter 2016 and the first nine months 2016 from the consolidated financial statements of TOTAL S.A. as of September 30, 2016. The notes to these consolidated financial statements (unaudited) are available on the TOTAL website total.com. This document may contain forward-looking information on the Group (including objectives and trends), as well as forward-looking statements within the meaning of the Private Securities Litigation Reform Act of 1995, notably with respect to the financial condition, results of operations, business, strategy and plans of TOTAL. These data do not represent forecasts within the meaning of European Regulation No. 809/2004. Such forward-looking information and statements included in this document are based on a number of economic data and assumptions made in a given economic, competitive and regulatory environment. They may prove to be inaccurate in the future, and are subject to a number of risk factors that could lead to a significant difference between actual results and those anticipated, including currency fluctuations, the price of petroleum products, the ability to realize cost reductions and operating efficiencies without unduly disrupting business operations, environmental regulatory considerations and general economic and business conditions. Certain financial information is based on estimates particularly in the assessment of the recoverable value of assets and potential impairments of assets relating thereto. Neither TOTAL nor any of its subsidiaries assumes any obligation to update publicly any forward-looking information or statement, objectives or trends contained in this document whether as a result of new information, future events or otherwise. Further information on factors, risks and uncertainties that could affect the Company’s financial results or the Group’s activities is provided in the most recent Registration Document, the French language version of which is filed by the Company with the French Autorité des Marchés Financiers and annual report on Form 20-F filed with the United States Securities and Exchange Commission (“SEC”). Financial information by business segment is reported in accordance with the internal reporting system and shows internal segment information that is used to manage and measure the performance of TOTAL. In addition to IFRS measures, certain alternative performance indicators are presented, such as performance indicators excluding the adjustment items described below (adjusted operating income, adjusted net operating income, adjusted net income), return on equity (ROE), return on average capital employed (ROACE) and net-debt-to-equity ratio. These indicators are meant to facilitate the analysis of the financial performance of TOTAL and the comparison of income between periods. They allow investors to track the measures used internally to manage and measure the performance of the Group. These adjustment items include: (i) Special items Due to their unusual nature or particular significance, certain transactions qualified as "special items" are excluded from the business segment figures. In general, special items relate to transactions that are significant, infrequent or unusual. However, in certain instances, transactions such as restructuring costs or asset disposals, which are not considered to be representative of the normal course of business, may be qualified as special items although they may have occurred within prior years or are likely to occur again within the coming years. (ii) Inventory valuation effect The adjusted results of the Refining & Chemicals and Marketing & Services segments are presented according to the replacement cost method. This method is used to assess the segments’ performance and facilitate the comparability of the segments’ performance with those of its competitors. In the replacement cost method, which approximates the LIFO (Last-In, First-Out) method, the variation of inventory values in the statement of income is, depending on the nature of the inventory, determined using either the month-end price differentials between one period and another or the average prices of the period rather than the historical value. The inventory valuation effect is the difference between the results according to the FIFO (First-In, First-Out) and the replacement cost. (iii) Effect of changes in fair value The effect of changes in fair value presented as an adjustment item reflects, for some transactions, differences between internal measures of performance used by TOTAL’s management and the accounting for these transactions under IFRS. IFRS requires that trading inventories be recorded at their fair value using period-end spot prices. In order to best reflect the management of economic exposure through derivative transactions, internal indicators used to measure performance include valuations of trading inventories based on forward prices. Furthermore, TOTAL, in its trading activities, enters into storage contracts, whose future effects are recorded at fair value in Group’s internal economic performance. IFRS precludes recognition of this fair value effect. The adjusted results (adjusted operating income, adjusted net operating income, adjusted net income) are defined as replacement cost results, adjusted for special items, excluding the effect of changes in fair value. Euro amounts presented for the fully adjusted-diluted earnings per share represent dollar amounts converted at the average euro-dollar (€-$) exchange rate for the applicable period and are not the result of financial statements prepared in euros. Cautionary Note to U.S. Investors – The SEC permits oil and gas companies, in their filings with the SEC, to separately disclose proved, probable and possible reserves that a company has determined in accordance with SEC rules. We may use certain terms in this press release, such as “potential reserves” or “resources”, that the SEC’s guidelines strictly prohibit us from including in filings with the SEC. U.S. investors are urged to consider closely the disclosure in our Form 20-F, File N° 1-10888, available from us at 2, place Jean Millier – Arche Nord Coupole/Regnault - 92078 Paris-La Défense Cedex, France, or at our website total.com. You can also obtain this form from the SEC by calling 1-800-SEC-0330 or on the SEC’s website sec.gov.

Main indicators
Chart updated around the middle of the month following the end of each quarter
$/€ European refining
margin ERMI* ($/t)** Brent ($/b) Average liquids price*** ($/b) Average gas price ($/Mbtu)***
Third quarter 2016 1.12 25.5 45.9 41.4 3.45
Second quarter 2016 1.13 35.0 45.6 43.0 3.43
First quarter 2016 1.10 35.1 33.9 31.0 3.46
Fourth quarter 2015 1.10 38.1 43.8 38.1 4.45
Third quarter 2015 1.11 54.8 50.5 44.0 4.47
* European Refining Margin Indicator (ERMI) is an indicator intended to represent the margin after variable costs for a hypothetical complex refinery located around Rotterdam in Northern Europe that processes a mix of crude oil and other inputs commonly supplied to this region to produce and market the main refined products at prevailing prices in this region. The indicator margin may not be representative of the actual margins achieved by Total in any period because of Total’s particular refinery configurations, product mix effects or other company-specific operating conditions.
** 1 $/t = 0.136 $/b
*** consolidated subsidiaries, excluding fixed margin contracts, including hydrocarbon production overlifting / underlifting position valued at market price. Disclaimer: data is based on Total’s reporting, is not audited and is subject to change.

Total financial statements Third quarter and first nine months 2016 consolidated accounts, IFRS

CONSOLIDATED STATEMENT OF INCOME
TOTAL
(M$) (a)
3rd quarter2016
2nd quarter2016
3rd quarter2015
Sales 37,412 37,215 40,580Excise taxes (5,587) (5,504) (5,683)
Revenues from sales 31,825 31,711 34,897
Purchases, net of inventory variation (21,223) (20,548) (24,240)Other operating expenses (5,469) (5,906) (5,794)
Exploration costs (274) (536) (275)
Depreciation, depletion and impairment of tangible assets and mineral interests (2,936) (2,968) (3,345)Other income 290 172 430Other expense (351) (133) (441)
Financial interest on debt (268) (267) (233)Financial income and expense from cash & cash equivalents (5) 1 10
Cost of net debt (273) (266) (223)
Other financial income 265 312 185Other financial expense (154) (166) (154)
Equity in net income (loss) of affiliates 531 776 486
Income taxes (251) (330) (461)
Consolidated net income 1,980 2,118 1,065
Group share 1,954 2,088 1,079Non-controlling interests 26 30 (14)
Earnings per share ($) 0.79 0.86 0.45
Fully-diluted earnings per share ($) 0.79 0.86 0.45 (a) Except for per share amounts.
(unaudited)
16

CONSOLIDATED STATEMENT OF COMPREHENSIVE INCOME
TOTAL
(M$)3rd quarter
20162nd quarter
20163rd quarter
2015
Consolidated net income 1,980 2,118 1,065
Other comprehensive income
Actuarial gains and losses (363) (132) 46
Tax effect 47 40 (21)
Currency translation adjustment generated by the parent company 439 (2,113) 132
Items not potentially reclassifiable to profit and loss 123 (2,205) 157
Currency translation adjustment (362) 589 (736)Available for sale financial assets 15 (4) (3)Cash flow hedge 113 (66) (95)Share of other comprehensive income of equity affiliates, net amount 123 355 (626)Other (3) - -Tax effect (41) 21 31Items potentially reclassifiable to profit and loss (155) 895 (1,429)Total other comprehensive income (net amount) (32) (1,310) (1,272)
Comprehensive income 1,948 808 (207)
Group share 1,909 795 (167)Non-controlling interests 39 13 (40)
(unaudited)
17
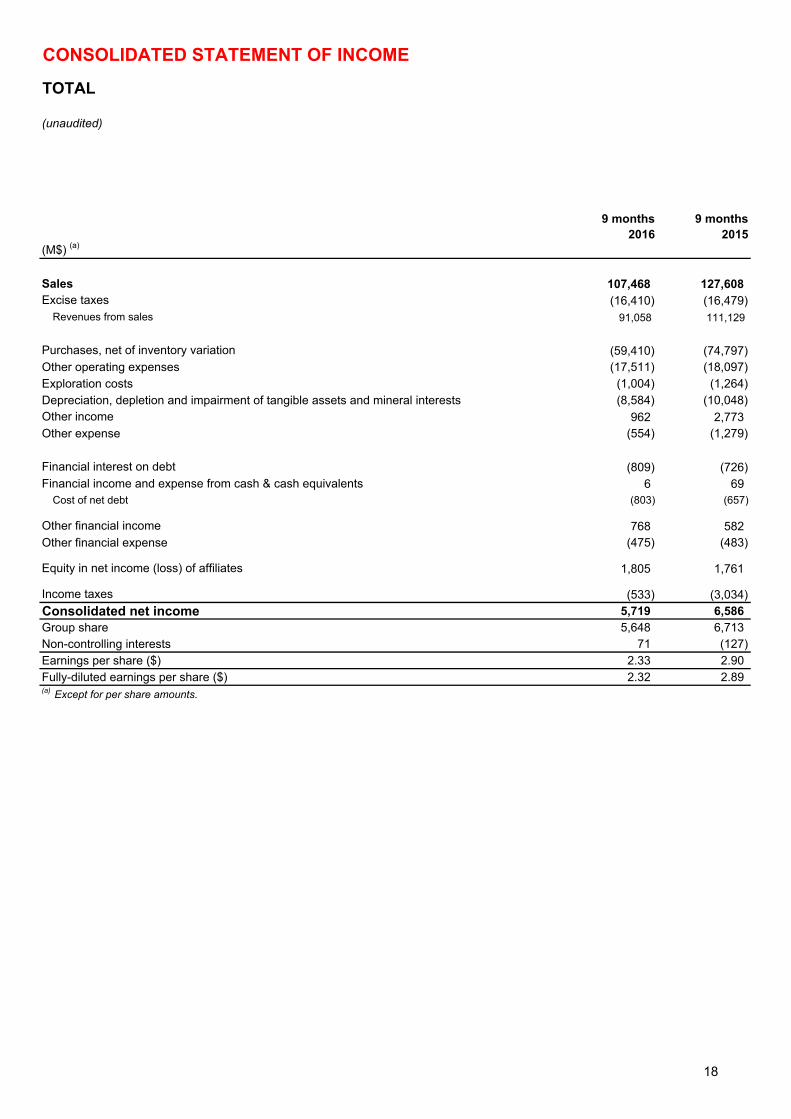
CONSOLIDATED STATEMENT OF INCOME
TOTAL
(M$) (a)
9 months2016
9 months2015
Sales 107,468 127,608Excise taxes (16,410) (16,479)
Revenues from sales 91,058 111,129
Purchases, net of inventory variation (59,410) (74,797)Other operating expenses (17,511) (18,097)Exploration costs (1,004) (1,264)Depreciation, depletion and impairment of tangible assets and mineral interests (8,584) (10,048)Other income 962 2,773Other expense (554) (1,279)
Financial interest on debt (809) (726)Financial income and expense from cash & cash equivalents 6 69
Cost of net debt (803) (657)
Other financial income 768 582Other financial expense (475) (483)
Equity in net income (loss) of affiliates 1,805 1,761
Income taxes (533) (3,034)
Consolidated net income 5,719 6,586Group share 5,648 6,713Non-controlling interests 71 (127)Earnings per share ($) 2.33 2.90 Fully-diluted earnings per share ($) 2.32 2.89 (a) Except for per share amounts.
(unaudited)
18

CONSOLIDATED STATEMENT OF COMPREHENSIVE INCOME
TOTAL
(M$)
9 months2016
9 months2015
Consolidated net income 5,719 6,586
Other comprehensive income
Actuarial gains and losses (576) 199
Tax effect 119 (138)
Currency translation adjustment generated by the parent company 1,967 (5,097)
Items not potentially reclassifiable to profit and loss 1,510 (5,036)
Currency translation adjustment (1,717) 1,852Available for sale financial assets 1 (7)Cash flow hedge 145 (189)Share of other comprehensive income of equity affiliates, net amount 477 215Other - 1Tax effect (44) 60Items potentially reclassifiable to profit and loss (1,138) 1,932Total other comprehensive income (net amount) 372 (3,104)
Comprehensive income 6,091 3,482
Group share 6,012 3,666Non-controlling interests 79 (184)
(unaudited)
19

CONSOLIDATED BALANCE SHEET
TOTAL
(M$)
September 30, 2016
(unaudited)
June 30, 2016
(unaudited)
December 31, 2015
(unaudited)
September 30, 2015
(unaudited)
ASSETS
Non-current assetsIntangible assets, net 14,916 14,207 14,549 15,639Property, plant and equipment, net 113,433 111,420 109,518 108,886Equity affiliates : investments and loans 20,870 20,683 19,384 19,200Other investments 1,565 1,411 1,241 1,227Hedging instruments of non-current financial debt 1,089 1,251 1,219 1,221Deferred income taxes 4,434 4,175 3,982 3,439Other non-current assets 4,534 4,467 4,355 4,292
Total non-current assets 160,841 157,614 154,248 153,904
Current assetsInventories, net 14,635 15,021 13,116 14,773Accounts receivable, net 11,501 11,933 10,629 12,306Other current assets 14,927 14,850 15,843 15,102Current financial assets 1,755 2,018 6,190 3,448Cash and cash equivalents 24,801 22,653 23,269 25,858Assets classified as held for sale 1,045 1,257 1,189 3,734
Total current assets 68,664 67,732 70,236 75,221
Total assets 229,505 225,346 224,484 229,125
LIABILITIES & SHAREHOLDERS' EQUITY
Shareholders' equityCommon shares 7,849 7,846 7,670 7,602Paid-in surplus and retained earnings 106,189 106,343 101,528 103,519Currency translation adjustment (11,448) (11,619) (12,119) (10,443)Treasury shares (4,422) (4,585) (4,585) (4,585)
98,168 97,985 92,494 96,093
Non-controlling interests 2,948 2,904 2,915 3,068
Total shareholders' equity 101,116 100,889 95,409 99,161
Non-current liabilitiesDeferred income taxes 11,390 11,345 12,360 12,836Employee benefits 4,247 3,887 3,774 4,312Provisions and other non-current liabilities 17,320 17,270 17,502 17,053Non-current financial debt 44,450 41,668 44,464 42,873
Total non-current liabilities 77,407 74,170 78,100 77,074
Current liabilitiesAccounts payable 19,799 20,478 20,928 20,003Other creditors and accrued liabilities 16,895 14,983 16,884 17,991Current borrowings 13,383 13,789 12,488 13,296Other current financial liabilities 380 390 171 202Liabilities directly associated with the assets classified as held for sale 525 647 504 1,398
Total current liabilities 50,982 50,287 50,975 52,890
Total liabilities & shareholders' equity 229,505 225,346 224,484 229,125
(unaudited)
20

CONSOLIDATED STATEMENT OF CASH FLOW
TOTAL
(M$)
3rd quarter2016
2nd quarter2016
3rd quarter2015
CASH FLOW FROM OPERATING ACTIVITIES
Consolidated net income 1,980 2,118 1,065Depreciation, depletion, amortization and impairment 3,297 3,361 3,519Non-current liabilities, valuation allowances and deferred taxes (539) (477) (540)Impact of coverage of pension benefit plans - - -(Gains) losses on disposals of assets 94 (48) 22Undistributed affiliates' equity earnings (192) (280) (61)(Increase) decrease in working capital 265 (1,752) 2,057Other changes, net (165) (40) (73)Cash flow from operating activities 4,740 2,882 5,989
CASH FLOW USED IN INVESTING ACTIVITIES
Intangible assets and property, plant and equipment additions (4,124) (4,094) (5,266)Acquisitions of subsidiaries, net of cash acquired (1,119) 11 (76)Investments in equity affiliates and other securities 177 (226) (175)Increase in non-current loans (135) (257) (523)Total expenditures (5,201) (4,566) (6,040)Proceeds from disposals of intangible assets and property, plant and equipment 57 200 6Proceeds from disposals of subsidiaries, net of cash sold - 270 289Proceeds from disposals of non-current investments 34 2 100Repayment of non-current loans 101 301 15Total divestments 192 773 410Cash flow used in investing activities (5,009) (3,793) (5,630)
CASH FLOW USED IN FINANCING ACTIVITIES
Issuance (repayment) of shares: - Parent company shareholders 36 4 4
- - (237)Dividends paid: - Parent company shareholders - (1,173) (681) - Non-controlling interests (2) (72) (25)Issuance of perpetual subordinated notes - 1,950 -Payments on perpetual subordinated notes - - -Other transactions with non-controlling interests (107) 3 -Net issuance (repayment) of non-current debt 3,127 400 356Increase (decrease) in current borrowings (909) 1,011 23Increase (decrease) in current financial assets and liabilities 257 1,399 (1,096)Cash flow used in financing activities 2,402 3,522 (1,656)Net increase (decrease) in cash and cash equivalents 2,133 2,611 (1,297)Effect of exchange rates 15 (528) (167)Cash and cash equivalents at the beginning of the period 22,653 20,570 27,322Cash and cash equivalents at the end of the period 24,801 22,653 25,858
(unaudited)
21

CONSOLIDATED STATEMENT OF CASH FLOW
TOTAL
(M$)
9 months2016
9 months2015
CASH FLOW FROM OPERATING ACTIVITIES
Consolidated net income 5,719 6,586Depreciation, depletion, amortization and impairment 9,393 11,056Non-current liabilities, valuation allowances and deferred taxes (1,284) (701)Impact of coverage of pension benefit plans - -(Gains) losses on disposals of assets (321) (1,794)Undistributed affiliates' equity earnings (708) (350)(Increase) decrease in working capital (3,032) 746Other changes, net (264) (435)Cash flow from operating activities 9,503 15,108
CASH FLOW USED IN INVESTING ACTIVITIES
Intangible assets and property, plant and equipment additions (12,364) (19,213)Acquisitions of subsidiaries, net of cash acquired (1,241) (86)Investments in equity affiliates and other securities (106) (433)Increase in non-current loans (964) (1,707)Total expenditures (14,675) (21,439)Proceeds from disposals of intangible assets and property, plant and equipment 1,049 1,186Proceeds from disposals of subsidiaries, net of cash sold 270 2,450Proceeds from disposals of non-current investments 129 231Repayment of non-current loans 502 1,420Total divestments 1,950 5,287Cash flow used in investing activities (12,725) (16,152)
CASH FLOW USED IN FINANCING ACTIVITIES
Issuance (repayment) of shares: - Parent company shareholders 40 454
- (237)Dividends paid: - Parent company shareholders (2,127) (2,253) - Non-controlling interests (77) (97)Issuance of perpetual subordinated notes 1,950 5,616Payments on perpetual subordinated notes (133) -Other transactions with non-controlling interests (104) 81Net issuance (repayment) of non-current debt 3,681 2,127Increase (decrease) in current borrowings (2,925) (66)Increase (decrease) in current financial assets and liabilities 4,402 (2,197)Cash flow used in financing activities 4,707 3,428Net increase (decrease) in cash and cash equivalents 1,485 2,384Effect of exchange rates 47 (1,707)Cash and cash equivalents at the beginning of the period 23,269 25,181Cash and cash equivalents at the end of the period 24,801 25,858
(unaudited)
22

CONSOLIDATED STATEMENT OF CHANGES IN SHAREHOLDERS' EQUITY
TOTAL
(unaudited)
(M$) Number Amount Number Amount
As of January 1, 2015 2,385,267,525 7,518 94,646 (7,480) (109,361,413) (4,354) 90,330 3,201 93,531
Net income of the first 9 months 2015 - - 6,713 - - - 6,713 (127) 6,586
Other comprehensive Income - - (84) (2,963) - - (3,047) (57) (3,104)
Comprehensive Income - - 6,629 (2,963) - - 3,666 (184) 3,482
Dividend - - (4,740) - - - (4,740) (97) (4,837)
Issuance of common shares 29,822,264 84 1,241 - - - 1,325 - 1,325
Purchase of treasury shares - - - - (4,711,935) (237) (237) - (237)
Sale of treasury shares (1) - - (6) - 103,270 6 - - -
Share-based payments - - 96 - - - 96 - 96
Share cancellation - - - - - - - - -
- - 5,616 - - - 5,616 - 5,616
Payments on perpetual subordinated notes - - (80) - - - (80) - (80)
Other operations with non-controlling interests - - 19 - - - 19 59 78
Other items - - 98 - - - 98 89 187
As of September 30, 2015 2,415,089,789 7,602 103,519 (10,443) (113,970,078) (4,585) 96,093 3,068 99,161
Net income from October 1 to December 31, 2015 - - (1,626) - - - (1,626) (174) (1,800)
Other comprehensive Income - - 269 (1,676) - - (1,407) (24) (1,431)
Comprehensive Income - - (1,357) (1,676) - - (3,033) (198) (3,231)
Dividend - - (1,563) - - - (1,563) (3) (1,566)
Issuance of common shares 24,968,094 68 918 - - - 986 - 986
Purchase of treasury shares - - - - - - - - -
Sale of treasury shares (1) - - - - 2,320 - - - -
Share-based payments - - 5 - - - 5 - 5
Share cancellation - - - - - - - - -
Issuance of perpetual subordinated notes - - - - - - - - -
Payments on perpetual subordinated notes - - (34) - - - (34) - (34)
Other operations with non-controlling interests - - 4 - - - 4 5 9
Other items - - 36 - - - 36 43 79
As of December 31, 2015 2,440,057,883 7,670 101,528 (12,119) (113,967,758) (4,585) 92,494 2,915 95,409
Net income of the first 9 months 2016 - - 5,648 - - - 5,648 71 5,719
Other comprehensive Income - - (307) 671 - - 364 8 372
Comprehensive Income - - 5,341 671 - - 6,012 79 6,091
Dividend - - (4,872) - - - (4,872) (77) (4,949)
Issuance of common shares 63,971,645 179 2,524 - - - 2,703 - 2,703
Purchase of treasury shares - - - - - - - - -
Sale of treasury shares (1) - - (163) - 3,047,118 163 - - -
Share-based payments - - 81 - - - 81 - 81
Share cancellation - - - - - - - - -
Issuance of perpetual subordinated notes - - 1,950 - - - 1,950 - 1,950
Payments on perpetual subordinated notes - - (131) - - - (131) - (131)
Other operations with non-controlling interests - - (100) - - - (100) (41) (141)
Other items - - 31 - - - 31 72 103
As of September 30, 2016 2,504,029,528 7,849 106,189 (11,448) (110,920,640) (4,422) 98,168 2,948 101,116
(1) Treasury shares related to the restricted stock grants.
Total shareholders'
equity
Shareholders' equity -
Group share
Common shares issued Treasury sharesPaid-in surplus and
retained earnings
Currency translation adjustment
Non-controlling interests
23

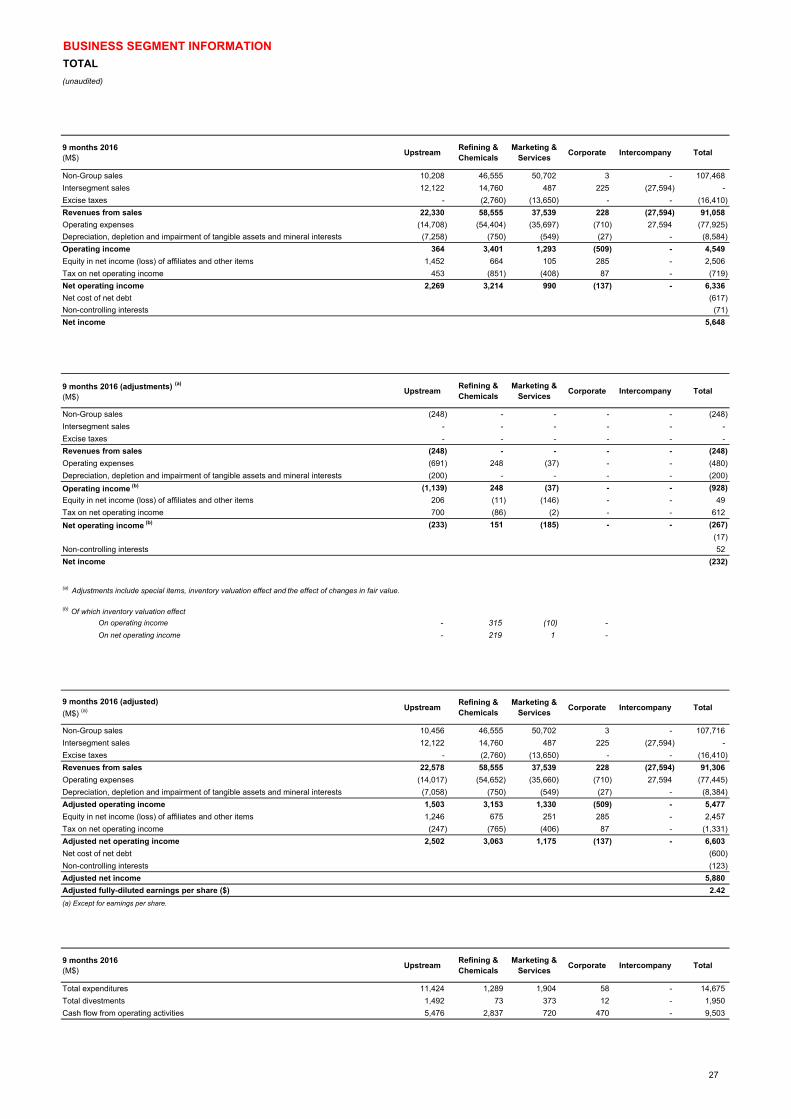
BUSINESS SEGMENT INFORMATION
TOTAL
(unaudited)
3rd quarter 2016(M$)
UpstreamRefining & Chemicals
Marketing & Services
Corporate Intercompany Total
Non-Group sales 3,398 16,050 17,964 - - 37,412
Intersegment sales 4,701 5,072 147 74 (9,994) -
Excise taxes - (875) (4,712) - - (5,587)
Revenues from sales 8,099 20,247 13,399 74 (9,994) 31,825
Operating expenses (4,954) (19,101) (12,708) (197) 9,994 (26,966)
Depreciation, depletion and impairment of tangible assets and mineral interests (2,480) (251) (194) (11) - (2,936)
Operating income 665 895 497 (134) - 1,923
Equity in net income (loss) of affiliates and other items 213 227 57 84 - 581
Tax on net operating income (40) (196) (138) 58 - (316)
Net operating income 838 926 416 8 - 2,188
Net cost of net debt (208)
Non-controlling interests (26)
Net income 1,954
3rd quarter 2016 (adjustments) (a)
(M$)Upstream
Refining & Chemicals
Marketing & Services
Corporate Intercompany Total
Non-Group sales (116) - - - - (116)
Intersegment sales - - - - - -
Excise taxes - - - - - -
Revenues from sales (116) - - - - (116)
Operating expenses - 4 (68) - - (64)
Depreciation, depletion and impairment of tangible assets and mineral interests - - - - - -
Operating income (b) (116) 4 (68) - - (180)
Equity in net income (loss) of affiliates and other items (123) 16 (67) - - (174)
Tax on net operating income 200 (11) 6 - - 195
Net operating income (b) (39) 9 (129) - - (159)
(6)
Non-controlling interests 49
Net income (116)
On operating income - 4 (51) -
On net operating income - 21 (33) -
(240) (185) (144) 58
3rd quarter 2016 (adjusted)
(M$) (a) UpstreamRefining & Chemicals
Marketing & Services
Corporate Intercompany Total
Non-Group sales 3,514 16,050 17,964 - - 37,528
Intersegment sales 4,701 5,072 147 74 (9,994) -
Excise taxes - (875) (4,712) - - (5,587)
Revenues from sales 8,215 20,247 13,399 74 (9,994) 31,941
Operating expenses (4,954) (19,105) (12,640) (197) 9,994 (26,902)
Depreciation, depletion and impairment of tangible assets and mineral interests (2,480) (251) (194) (11) - (2,936)
Adjusted operating income 781 891 565 (134) - 2,103
Equity in net income (loss) of affiliates and other items 336 211 124 84 - 755
Tax on net operating income (240) (185) (144) 58 - (511)
Adjusted net operating income 877 917 545 8 - 2,347
Net cost of net debt (202)
Non-controlling interests (75)
Adjusted net income 2,070
Adjusted fully-diluted earnings per share ($) 0.84
(a) Except for earnings per share.
3rd quarter 2016(M$)
UpstreamRefining & Chemicals
Marketing & Services
Corporate Intercompany Total
Total expenditures 3,648 550 1,175 (172) - 5,201
Total divestments 129 21 40 2 - 192
Cash flow from operating activities 2,380 1,698 495 167 - 4,740
(a) Adjustments include special items, inventory valuation effect and the effect of changes in fair value.
(b) Of which inventory valuation effect
24

BUSINESS SEGMENT INFORMATION
TOTAL
(unaudited)
2nd quarter 2016(M$)
UpstreamRefining & Chemicals
Marketing & Services
Corporate Intercompany Total
Non-Group sales 3,344 16,567 17,305 (1) - 37,215
Intersegment sales 4,159 5,540 208 81 (9,988) -
Excise taxes - (924) (4,580) - - (5,504)
Revenues from sales 7,503 21,183 12,933 80 (9,988) 31,711
Operating expenses (4,956) (19,521) (12,208) (293) 9,988 (26,990)
Depreciation, depletion and impairment of tangible assets and mineral interests (2,531) (246) (183) (8) - (2,968)
Operating income 16 1,416 542 (221) - 1,753
Equity in net income (loss) of affiliates and other items 569 260 34 98 - 961
Tax on net operating income 180 (379) (190) (8) - (397)
Net operating income 765 1,297 386 (131) - 2,317
Net cost of net debt (199)
Non-controlling interests (30)
Net income 2,088
2nd quarter 2016 (adjustments) (a)
(M$)Upstream
Refining & Chemicals
Marketing & Services
Corporate Intercompany Total
Non-Group sales (6) - - - - (6)
Intersegment sales - - - - - -
Excise taxes - - - - - -
Revenues from sales (6) - - - - (6)
Operating expenses (358) 451 108 - - 201
Depreciation, depletion and impairment of tangible assets and mineral interests (200) - - - - (200)
Operating income (b) (564) 451 108 - - (5)
Equity in net income (loss) of affiliates and other items - (27) (62) - - (89)
Tax on net operating income 202 (145) (38) - - 19
Net operating income (b) (362) 279 8 - - (75)
(5)
Non-controlling interests (6)
Net income (86)
On operating income - 516 118 -
On net operating income - 331 84 -
(22) (234) (152) (8)
2nd quarter 2016 (adjusted)
(M$) (a) UpstreamRefining & Chemicals
Marketing & Services
Corporate Intercompany Total
Non-Group sales 3,350 16,567 17,305 (1) - 37,221
Intersegment sales 4,159 5,540 208 81 (9,988) -
Excise taxes - (924) (4,580) - - (5,504)
Revenues from sales 7,509 21,183 12,933 80 (9,988) 31,717
Operating expenses (4,598) (19,972) (12,316) (293) 9,988 (27,191)
Depreciation, depletion and impairment of tangible assets and mineral interests (2,331) (246) (183) (8) - (2,768)
Adjusted operating income 580 965 434 (221) - 1,758
Equity in net income (loss) of affiliates and other items 569 287 96 98 - 1,050
Tax on net operating income (22) (234) (152) (8) - (416)
Adjusted net operating income 1,127 1,018 378 (131) - 2,392
Net cost of net debt (194)
Non-controlling interests (24)
Adjusted net income 2,174
Adjusted fully-diluted earnings per share ($) 0.90
(a) Except for earnings per share.
2nd quarter 2016(M$)
UpstreamRefining & Chemicals
Marketing & Services
Corporate Intercompany Total
Total expenditures 3,539 480 339 208 - 4,566
Total divestments 448 23 296 6 - 773
Cash flow from operating activities 983 1,560 (15) 354 - 2,882
(a) Adjustments include special items, inventory valuation effect and the effect of changes in fair value.
(b) Of which inventory valuation effect
25

BUSINESS SEGMENT INFORMATION
TOTAL
(unaudited)
3rd quarter 2015(M$)
UpstreamRefining & Chemicals
Marketing & Services
Corporate Intercompany Total
Non-Group sales 3,660 17,397 19,522 1 - 40,580
Intersegment sales 4,280 6,912 201 51 (11,444) -
Excise taxes - (1,094) (4,589) - - (5,683)
Revenues from sales 7,940 23,215 15,134 52 (11,444) 34,897
Operating expenses (4,717) (22,169) (14,651) (216) 11,444 (30,309)
Depreciation, depletion and impairment of tangible assets and mineral interests (2,898) (256) (185) (6) - (3,345)
Operating income 325 790 298 (170) - 1,243
Equity in net income (loss) of affiliates and other items 360 152 (29) 23 - 506
Tax on net operating income (345) (152) (126) 128 - (495)
Net operating income 340 790 143 (19) - 1,254
Net cost of net debt (189)
Non-controlling interests 14
Net income 1,079
3rd quarter 2015 (adjustments) (a)
(M$)Upstream
Refining & Chemicals
Marketing & Services
Corporate Intercompany Total
Non-Group sales (10) - - - - (10)
Intersegment sales - - - - - -
Excise taxes - - - - - -
Revenues from sales (10) - - - - (10)
Operating expenses (9) (923) (199) - - (1,131)
Depreciation, depletion and impairment of tangible assets and mineral interests (650) - - - - (650)
Operating income (b) (669) (923) (199) - - (1,791)
Equity in net income (loss) of affiliates and other items (151) (14) (145) - - (310)
Tax on net operating income 53 294 64 - - 411
Net operating income (b) (767) (643) (280) - - (1,690)
-
Non-controlling interests 13
Net income (1,677)
On operating income - (934) (193) -
On net operating income - (631) (139) -
(398) (446) (190) 128
3rd quarter 2015 (adjusted)
(M$) (a) UpstreamRefining & Chemicals
Marketing & Services
Corporate Intercompany Total
Non-Group sales 3,670 17,397 19,522 1 - 40,590
Intersegment sales 4,280 6,912 201 51 (11,444) -
Excise taxes - (1,094) (4,589) - - (5,683)
Revenues from sales 7,950 23,215 15,134 52 (11,444) 34,907
Operating expenses (4,708) (21,246) (14,452) (216) 11,444 (29,178)
Depreciation, depletion and impairment of tangible assets and mineral interests (2,248) (256) (185) (6) - (2,695)
Adjusted operating income 994 1,713 497 (170) - 3,034
Equity in net income (loss) of affiliates and other items 511 166 116 23 - 816
Tax on net operating income (398) (446) (190) 128 - (906)
Adjusted net operating income 1,107 1,433 423 (19) - 2,944
Net cost of net debt (189)
Non-controlling interests 1
Adjusted net income 2,756
Adjusted fully-diluted earnings per share ($) 1.17
(a) Except for earnings per share.
3rd quarter 2015(M$)
UpstreamRefining & Chemicals
Marketing & Services
Corporate Intercompany Total
Total expenditures 5,173 358 501 8 - 6,040
Total divestments 272 12 121 5 - 410
Cash flow from operating activities 2,320 2,291 1,011 367 - 5,989
(a) Adjustments include special items, inventory valuation effect and the effect of changes in fair value.
(b) Of which inventory valuation effect
26
BUSINESS SEGMENT INFORMATION
TOTAL
(unaudited)
9 months 2016(M$)
UpstreamRefining & Chemicals
Marketing & Services
Corporate Intercompany Total
Non-Group sales 10,208 46,555 50,702 3 - 107,468
Intersegment sales 12,122 14,760 487 225 (27,594) -
Excise taxes - (2,760) (13,650) - - (16,410)
Revenues from sales 22,330 58,555 37,539 228 (27,594) 91,058
Operating expenses (14,708) (54,404) (35,697) (710) 27,594 (77,925)
Depreciation, depletion and impairment of tangible assets and mineral interests (7,258) (750) (549) (27) - (8,584)
Operating income 364 3,401 1,293 (509) - 4,549
Equity in net income (loss) of affiliates and other items 1,452 664 105 285 - 2,506
Tax on net operating income 453 (851) (408) 87 - (719)
Net operating income 2,269 3,214 990 (137) - 6,336
Net cost of net debt (617)
Non-controlling interests (71)
Net income 5,648
9 months 2016 (adjustments) (a)
(M$)Upstream
Refining & Chemicals
Marketing & Services
Corporate Intercompany Total
Non-Group sales (248) - - - - (248)
Intersegment sales - - - - - -
Excise taxes - - - - - -
Revenues from sales (248) - - - - (248)
Operating expenses (691) 248 (37) - - (480)
Depreciation, depletion and impairment of tangible assets and mineral interests (200) - - - - (200)
Operating income (b) (1,139) 248 (37) - - (928)
Equity in net income (loss) of affiliates and other items 206 (11) (146) - - 49
Tax on net operating income 700 (86) (2) - - 612
Net operating income (b) (233) 151 (185) - - (267)
(17)
Non-controlling interests 52
Net income (232)
On operating income - 315 (10) -
On net operating income - 219 1 -
(247) (765) (406) 87
9 months 2016 (adjusted)
(M$) (a) UpstreamRefining & Chemicals
Marketing & Services
Corporate Intercompany Total
Non-Group sales 10,456 46,555 50,702 3 - 107,716
Intersegment sales 12,122 14,760 487 225 (27,594) -
Excise taxes - (2,760) (13,650) - - (16,410)
Revenues from sales 22,578 58,555 37,539 228 (27,594) 91,306
Operating expenses (14,017) (54,652) (35,660) (710) 27,594 (77,445)
Depreciation, depletion and impairment of tangible assets and mineral interests (7,058) (750) (549) (27) - (8,384)
Adjusted operating income 1,503 3,153 1,330 (509) - 5,477
Equity in net income (loss) of affiliates and other items 1,246 675 251 285 - 2,457
Tax on net operating income (247) (765) (406) 87 - (1,331)
Adjusted net operating income 2,502 3,063 1,175 (137) - 6,603
Net cost of net debt (600)
Non-controlling interests (123)
Adjusted net income 5,880
Adjusted fully-diluted earnings per share ($) 2.42
(a) Except for earnings per share.
9 months 2016(M$)
UpstreamRefining & Chemicals
Marketing & Services
Corporate Intercompany Total
Total expenditures 11,424 1,289 1,904 58 - 14,675
Total divestments 1,492 73 373 12 - 1,950
Cash flow from operating activities 5,476 2,837 720 470 - 9,503
(a) Adjustments include special items, inventory valuation effect and the effect of changes in fair value.
(b) Of which inventory valuation effect
27

BUSINESS SEGMENT INFORMATION
TOTAL
(unaudited)
9 months 2015(M$)
UpstreamRefining & Chemicals
Marketing & Services
Corporate Intercompany Total
Non-Group sales 13,383 54,654 59,561 10 - 127,608
Intersegment sales 13,585 21,262 696 159 (35,702) -
Excise taxes - (3,034) (13,445) - - (16,479)
Revenues from sales 26,968 72,882 46,812 169 (35,702) 111,129
Operating expenses (16,135) (68,068) (45,022) (635) 35,702 (94,158)
Depreciation, depletion and impairment of tangible assets and mineral interests (8,668) (799) (561) (20) - (10,048)
Operating income 2,165 4,015 1,229 (486) - 6,923
Equity in net income (loss) of affiliates and other items 1,448 1,021 394 491 - 3,354
Tax on net operating income (1,622) (1,031) (450) (47) - (3,150)
Net operating income 1,991 4,005 1,173 (42) - 7,127
Net cost of net debt (541)
Non-controlling interests 127
Net income 6,713
9 months 2015 (adjustments) (a)
(M$)Upstream
Refining & Chemicals
Marketing & Services
Corporate Intercompany Total
Non-Group sales (314) - - - - (314)
Intersegment sales - - - - - -
Excise taxes - - - - - -
Revenues from sales (314) - - - - (314)
Operating expenses (151) (606) (155) - - (912)
Depreciation, depletion and impairment of tangible assets and mineral interests (1,890) (31) (23) - - (1,944)
Operating income (b) (2,355) (637) (178) - - (3,170)
Equity in net income (loss) of affiliates and other items (206) 576 140 - - 510
Tax on net operating income 526 184 42 - - 752
Net operating income (b) (2,035) 123 4 - - (1,908)
-
Non-controlling interests 178
Net income (1,730)
On operating income - (500) (149) -
On net operating income - (343) (101) -
(2,148) (1,215) (492) (47)
9 months 2015 (adjusted)
(M$) (a) UpstreamRefining & Chemicals
Marketing & Services
Corporate Intercompany Total
Non-Group sales 13,697 54,654 59,561 10 - 127,922
Intersegment sales 13,585 21,262 696 159 (35,702) -
Excise taxes - (3,034) (13,445) - - (16,479)
Revenues from sales 27,282 72,882 46,812 169 (35,702) 111,443
Operating expenses (15,984) (67,462) (44,867) (635) 35,702 (93,246)
Depreciation, depletion and impairment of tangible assets and mineral interests (6,778) (768) (538) (20) - (8,104)
Adjusted operating income 4,520 4,652 1,407 (486) - 10,093
Equity in net income (loss) of affiliates and other items 1,654 445 254 491 - 2,844
Tax on net operating income (2,148) (1,215) (492) (47) - (3,902)
Adjusted net operating income 4,026 3,882 1,169 (42) - 9,035
Net cost of net debt (541)
Non-controlling interests (51)
Adjusted net income 8,443
Adjusted fully-diluted earnings per share ($) 3.64
(a) Except for earnings per share.
9 months 2015(M$)
UpstreamRefining & Chemicals
Marketing & Services
Corporate Intercompany Total
Total expenditures 18,977 1,257 1,152 53 - 21,439
Total divestments 1,813 2,652 800 22 - 5,287
Cash flow from operating activities 8,558 4,305 2,034 211 - 15,108
(a) Adjustments include special items, inventory valuation effect and the effect of changes in fair value.
(b) Of which inventory valuation effect
* Reclassification of intercompany transactions between Upstream and Corporate for €823 million with no impact on the total of cash flow from operating activities
28

Reconciliation of the information by business segment with consolidated financial statements
TOTAL
3rd quarter 2016(M$)
Adjusted Adjustments (a) Consolidated statement of income
Sales 37,528 (116) 37,412Excise taxes (5,587) - (5,587)
Revenues from sales 31,941 (116) 31,825
Purchases, net of inventory variation (21,176) (47) (21,223)Other operating expenses (5,452) (17) (5,469)Exploration costs (274) - (274)Depreciation, depletion and impairment of tangible assets and mineral interests (2,936) - (2,936)Other income 284 6 290Other expense (155) (196) (351)
Financial interest on debt (262) (6) (268)Financial income and expense from cash & cash equivalents (5) - (5)
Cost of net debt (267) (6) (273)
Other financial income 265 - 265Other financial expense (154) - (154)
Equity in net income (loss) of affiliates 515 16 531
Income taxes (446) 195 (251)Consolidated net income 2,145 (165) 1,980Group share 2,070 (116) 1,954Non-controlling interests 75 (49) 26
(a) Adjustments include special items, inventory valuation effect and the effect of changes in fair value.
3rd quarter 2015(M$)
Adjusted Adjustments (a) Consolidated statement of income
Sales 40,590 (10) 40,580Excise taxes (5,683) - (5,683)
Revenues from sales 34,907 (10) 34,897
(23,113) (1,127) (24,240)Other operating expenses (5,790) (4) (5,794)Exploration costs (275) - (275)Depreciation, depletion and impairment of tangible assets and mineral interests (2,695) (650) (3,345)Other income 415 15 430Other expense (123) (318) (441)
Financial interest on debt (233) - (233)Financial income and expense from cash & cash equivalents 10 - 10
Cost of net debt (223) - (223)
Other financial income 185 - 185Other financial expense (154) - (154)
Equity in net income (loss) of affiliates 493 (7) 486
Income taxes (872) 411 (461)Consolidated net income 2,755 (1,690) 1,065Group share 2,756 (1,677) 1,079Non-controlling interests (1) (13) (14)
(a) Adjustments include special items, inventory valuation effect and the effect of changes in fair value.
(unaudited)
29

Reconciliation of the information by business segment with consolidated financial statements
TOTAL
(unaudited)
9 months 2016(M$)
Adjusted Adjustments (a) Consolidated statement of income
Sales 107,716 (248) 107,468Excise taxes (16,410) - (16,410)
Revenues from sales 91,306 (248) 91,058
Purchases, net of inventory variation (59,663) 253 (59,410)Other operating expenses (17,128) (383) (17,511)Exploration costs (654) (350) (1,004)Depreciation, depletion and impairment of tangible assets and mineral interests (8,384) (200) (8,584)Other income 627 335 962Other expense (274) (280) (554)
Financial interest on debt (792) (17) (809)Financial income and expense from cash & cash equivalents 6 - 6
Cost of net debt (786) (17) (803)
Other financial income 768 - 768Other financial expense (475) - (475)
Equity in net income (loss) of affiliates 1,811 (6) 1,805
Income taxes (1,145) 612 (533)Consolidated net income 6,003 (284) 5,719Group share 5,880 (232) 5,648Non-controlling interests 123 (52) 71
(a) Adjustments include special items, inventory valuation effect and the effect of changes in fair value.
9 months 2015(M$)
Adjusted Adjustments (a) Consolidated statement of income
Sales 127,922 (314) 127,608Excise taxes (16,479) - (16,479)
Revenues from sales 111,443 (314) 111,129
(74,148) (649) (74,797)Other operating expenses (17,921) (176) (18,097)Exploration costs (1,177) (87) (1,264)Financial income & expense from marketable securities & cash equivalents (8,104) (1,944) (10,048)Other income 1,299 1,474 2,773Other expense (358) (921) (1,279)
Financial interest on debt (726) - (726)Financial income and expense from cash & cash equivalents 69 - 69
Cost of net debt (657) - (657)
Other financial income 582 - 582Other financial expense (483) - (483)
Equity in net income (loss) of affiliates 1,804 (43) 1,761
Income taxes (3,786) 752 (3,034)Consolidated net income 8,494 (1,908) 6,586Group share 8,443 (1,730) 6,713Non-controlling interests 51 (178) (127)
(a) Adjustments include special items, inventory valuation effect and the effect of changes in fair value.
30