third quarter 2017 results - shell.com · pdf filechief financial officer royal dutch shell ....
TRANSCRIPT
Royal Dutch Shell November 2, 2017
Royal Dutch Shell plcNovember 2, 2017
Third quarter 2017 resultsRe-shaping Shell, to create a world-class investment case
#makethefuture

Royal Dutch Shell November 2, 2017
Jessica UhlChief Financial OfficerRoyal Dutch Shell

Royal Dutch Shell November 2, 2017 3
Definitions & cautionary note
Underlying operating cost is defined as operating cost less identified items. A reconciliation can be found in the quarterly results announcement.
Divestments. A reconciliation can be found in the quarterly results announcement.
The companies in which Royal Dutch Shell plc directly and indirectly owns investments are separate legal entities. In this presentation “Shell”, “Shell group” and “Royal Dutch Shell” are sometimes used for convenience where references are made to Royal Dutch Shell plc and its subsidiaries in general. Likewise, the words “we”, “us” and “our” are also used to refer to subsidiaries in general or to those who work for them. These expressions are also used where no useful purpose is served by identifying the particular company or companies. ‘‘Subsidiaries’’, “Shell subsidiaries” and “Shell companies” as used in this presentation refer to companies over which Royal Dutch Shell plc either directly or indirectly has control. Entities and unincorporated arrangements over which Shell has joint control are generally referred to as “joint ventures” and “joint operations” respectively. Entities over which Shell has significant influence but neither control nor joint control are referred to as “associates”. The term “Shell interest” is used for convenience to indicate the direct and/or indirect ownership interest held by Shell in a venture, partnership or company, after exclusion of all third-party interest.
This presentation contains forward-looking statements concerning the financial condition, results of operations and businesses of Royal Dutch Shell. All statements other than statements of historical fact are, or may be deemed to be, forward-looking statements. Forward-looking statements are statements of future expectations that are based on management’s current expectations and assumptions and involve known and unknown risks and uncertainties that could cause actual results, performance or events to differ materially from those expressed or implied in these statements. Forward-looking statements include, among other things, statements concerning the potential exposure of Royal Dutch Shell to market risks and statements expressing management’s expectations, beliefs, estimates, forecasts, projections and assumptions. These forward-looking statements are identified by their use of terms and phrases such as ‘‘anticipate’’, ‘‘believe’’, ‘‘could’’, ‘‘estimate’’, ‘‘expect’’, ‘‘goals’’, ‘‘intend’’, ‘‘may’’, ‘‘objectives’’, ‘‘outlook’’, ‘‘plan’’, ‘‘probably’’, ‘‘project’’, ‘‘risks’’, “schedule”, ‘‘seek’’, ‘‘should’’, ‘‘target’’, ‘‘will’’ and similar terms and phrases. There are a number of factors that could affect the future operations of Royal Dutch Shell and could cause those results to differ materially from those expressed in the forward-looking statements included in this presentation, including (without limitation): (a) price fluctuations in crude oil and natural gas; (b) changes in demand for Shell’s products; (c) currency fluctuations; (d) drilling and production results; (e) reserves estimates; (f) loss of market share and industry competition; (g) environmental and physical risks; (h) risks associated with the identification of suitable potential acquisition properties and targets, and successful negotiation and completion of such transactions; (i) the risk of doing business in developing countries and countries subject to international sanctions; (j) legislative, fiscal and regulatory developments including regulatory measures addressing climate change; (k) economic and financial market conditions in various countries and regions; (l) political risks, including the risks of expropriation and renegotiation of the terms of contracts with governmental entities, delays or advancements in the approval of projects and delays in the reimbursement for shared costs; and (m) changes in trading conditions. No assurance is provided that future dividend payments will match or exceed previous dividend payments. All forward-looking statements contained in this presentation are expressly qualified in their entirety by the cautionary statements contained or referred to in this section. Readers should not place undue reliance on forward-looking statements. Additional risk factors that may affect future results are contained in Royal Dutch Shell’s 20-F for the year ended December 31, 2016 (available at www.shell.com/investor and www.sec.gov ). These risk factors also expressly qualify all forward looking statements contained in this presentation and should be considered by the reader. Each forward-looking statement speaks only as of the date of this presentation, November 2, 2017. Neither Royal Dutch Shell plc nor any of its subsidiaries undertake any obligation to publicly update or revise any forward-looking statement as a result of new information, future events or other information. In light of these risks, results could differ materially from those stated, implied or inferred from the forward-looking statements contained in this presentation. This presentation may contain references to Shell’s website. These references are for the readers’ convenience only. Shell is not incorporating by reference any information posted on www.shell.com. We may have used certain terms, such as resources, in this presentation that the United States Securities and Exchange Commission (SEC) strictly prohibits us from including in our filings with the SEC. U.S. investors are urged to consider closely the disclosure in our Form 20-F, File No 1-32575, available on the SEC website www.sec.gov.

Royal Dutch Shell November 2, 2017 4
Summary Q3 2017 – cash momentum
Underlying CCS earnings $4.1 billion
CFFO excl. working capital $10 billion
Free cash flow $3.7 billion
Q317 dividend $0.47 per share
Q3 2017 – 4 quarters rolling
CFFO excl. working capital $40 billion
Cash dividend covered
Balance sheet: 25.4% gearing
Leader: value + influence
Reducing our carbon
intensity
Shared value with
society
World-class investment case
FCF/share + ROCE growth
Conservative financial
management

Royal Dutch Shell November 2, 2017 5
Q3 2017
Portfolio highlights
Prelude sail away – arrived in Australia Appomattox hull arrival USGC
Mexico – Retail country entryGbaran-Ubie – Phase 2
Royal Dutch Shell November 2, 2017
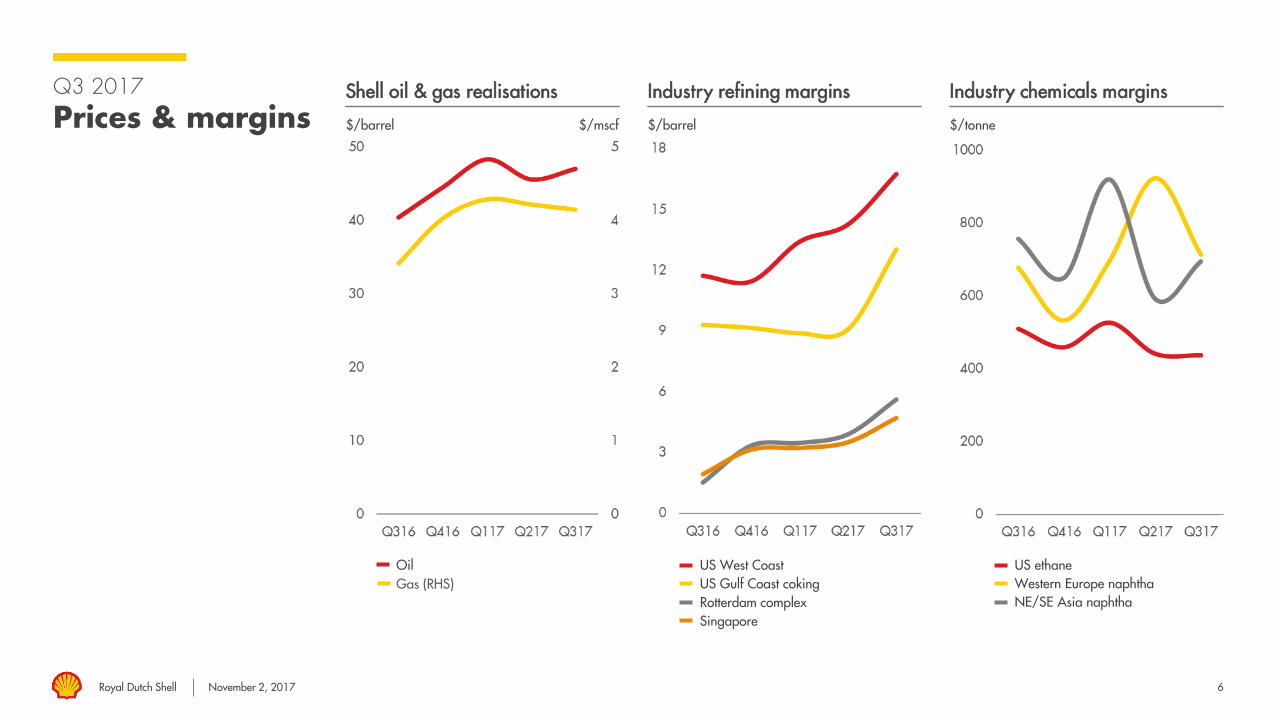
Q3 2017
Prices & margins $/barrel
Shell oil & gas realisations
$/barrel
Industry refining margins
$/tonne
Industry chemicals margins
US ethaneWestern Europe naphthaNE/SE Asia naphtha
US West CoastUS Gulf Coast cokingRotterdam complexSingapore
OilGas (RHS)
6
$/mscf

Royal Dutch Shell November 2, 2017 7
Q3 2017
Financial highlights
Earnings and ROACE on CCS basis, excluding identified items
$ billion
Earnings Q3 2016 to Q3 2017$ billion Q3 2016 Q3 2017
Upstream 0.0 0.6
Integrated Gas 0.9 1.3
Downstream (CCS) 2.1 2.7
Corporate & non-controlling interest (0.2) (0.4)
CCS net earnings 2.8 4.1
CCS earnings, $ per share 0.35 0.50
Cash flow from operations 8.5 7.6
Free cash flow 3.3 3.7
Dividend 3.8 4.0
ROACE (%) 2.8 4.6

Royal Dutch Shell November 2, 2017 8
Q3 2017
Cash momentum
Earnings on CCS basis, excluding identified items
Cash flow from operations excluding working capitalCash flow from operations excluding working capital – 4 quarters rolling (RHS)
Strong cash flow momentum continued from 2016 into 2017
CFFO excluding working capital (4 quarters rolling):$40 billion @ $51/bbl
Average Brent oil price - 4 quarters rolling ($/bbl)
Earnings
$ billion $ billion
$107 $51

Royal Dutch Shell November 2, 2017
3.00
3.50
9
Q3 2017
Oil and gas production + LNG liquefaction volumes
Million boe per day
Upstream + Integrated Gas – oil & gas
Million tonnes
LNG liquefaction volumes
3.25
3.75
4.00

Royal Dutch Shell November 2, 2017 10
Q3 2017
Earnings $ billion
Earnings Q3 2016 to Q3 2017

Royal Dutch Shell November 2, 2017 11
Financial and competitive performance
Chemicals
Earnings and ROACE on CCS basis, excluding identified items; source: company reports, Shell analysis
Chemicals peer group: XOM, LBI, DOW, RDS. Q3 2017 competitor data not yet available
$ billion
Earnings – Chemicals
%
Competitive performance – ROACE 4Q rolling
Improve base business
Expand current base portfolio
Adding to portfolio -growth
Average Brent oil price (RHS)Earnings
Average: $104
Average: $49
$/barrel
13Q1 17Q214Q1 15Q1 16Q1
CHEMICALS
Shell Peer group

Royal Dutch Shell November 2, 2017
Under construction
12
Growth projects
Chemicals Million metric tonnes
Ethylene capacity
Nanhai II
Pennsylvaniacracker
USGCrestructuring
Nanhai I
Bukom start-up
12
Geismar, USA
Nanhai, China
Pennsylvania, USA
425,000 metric tonnes per annum additional Alpha Olefins capacity
New liquids cracker and derivatives units
Capacity: ~1.2 million metric tonnes ethylene per annum
50/50 JV CNOOC
Greenfield FID 2016
Capacity: ~1.5 million metrictonnes ethylene per annum and polyethylene derivatives
2006Nanhai
2010 USGC go-light strategy
2010 Singapore
2016+ China + USA
LiquidGas
2022
Feedstock mix
CHEMICALS
SADAF exit

Royal Dutch Shell November 2, 2017 13
Q3 2017
Cashperformance + Divestments
Divestments: table D of Q3 2017 Quarterly Results Announcement;
Integrated gas split out from Upstream from 2011 onwards
$ billion
Sources and uses of cash – 17Q3 4Q rolling
$ billion
Interest paid
Debt repayments & other financing
Divestments
Downstream/CorporateUpstreamIntegrated gas
Divestments2016 – 2017 to date:
Completed: $20 billion
Announced: $2 billion
In progress: >$5 billion

Royal Dutch Shell November 2, 2017 14
Q3 2017
Net debt + Dividend
$ billion
Dividend + gearing
UPSTREAM
IG
DOWNSTREAM/CORPORATE
S&P credit rating upgrade: A+
$ billion
Net debt + gearing
Dividend Buy-backs Gearing (RHS)
%
-$10 billion
Net debt
%
Gearing (RHS)

Royal Dutch Shell November 2, 2017 15
Cash flow priorities 2016-18
Priorities for cash Debt reduction Dividends Buy-backs
& capital investment
1 2 3
Divestments Reduce capital investment
Reduce operating costs
Deliver new projects
Royal Dutch Shell November 2, 2017 16
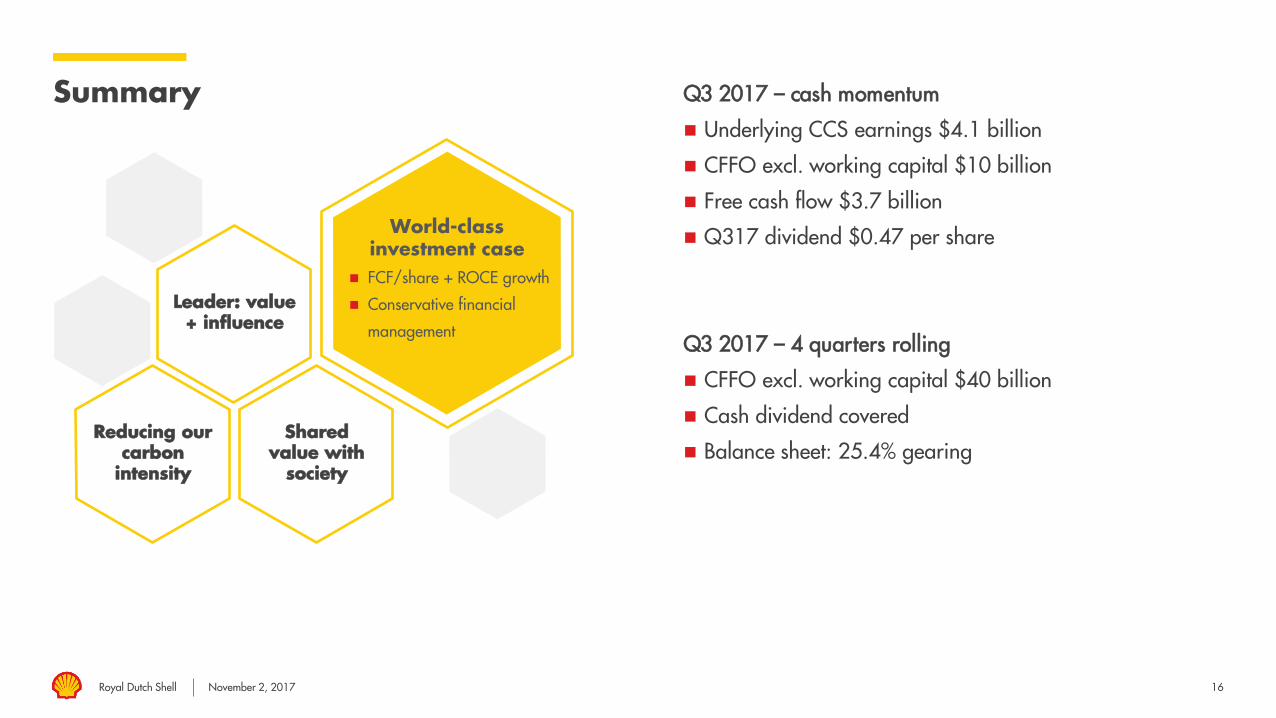
Summary Q3 2017 – cash momentum
Underlying CCS earnings $4.1 billion
CFFO excl. working capital $10 billion
Free cash flow $3.7 billion
Q317 dividend $0.47 per share
Q3 2017 – 4 quarters rolling
CFFO excl. working capital $40 billion
Cash dividend covered
Balance sheet: 25.4% gearing
Leader: value + influence
Reducing our carbon
intensity
Shared value with
society
World-class investment case
FCF/share + ROCE growth
Conservative financial
management

Royal Dutch Shell November 2, 2017 17
Questions & Answers
Jessica UhlChief Financial Officer
Royal Dutch Shell November 2, 2017

Royal Dutch Shell November 2, 2017
Royal Dutch Shell plcNovember 2, 2017
Third quarter 2017 resultsRe-shaping Shell, to create a world-class investment case
#makethefuture

Royal Dutch Shell November 2, 2017
Q4 2017Outlook
Q4 – Q4 OUTLOOK: Year-ago baseline reflects Shell’s earnings seasonality
Integrated gas Gorgon and portfolio impacts: positive impact of ~90 kboe/d
Upstream Divestment impact: reduction of ~250 kboe/d
Maintenance: negative impact of ~40 kboe/d
Lower production in the Netherlands (NAM) and improved security situation in Nigeria are expected to be largely offsetting
Downstream Refinery availability to increase
Chemicals availability to increase
Divestment impacts: reduction of ~250 thousand b/d in oil products sales volumes
Corporate segment Net charge of $350 – 450 million excluding identified items and the impact of currency exchange rate effects
2017 OUTLOOK:
Shell earnings sensitivity:
Brent: $10/bbl Brent +/- ~$5 billion earnings per annum, of which:Upstream +/- ~$3 billion; Integrated Gas +/- ~$2 billion (4-6 month LNG price lag versus Brent)
Henry Hub: $1/mmbtu +/- ~$250 million earnings per annum
19

Royal Dutch Shell November 2, 2017 20
Q3 2017
Upstream results – cash flow momentum
Earnings on CCS basis, excluding identified items
$ billion
Earnings Q3 2016 to Q3 2017
$ billion
Cash flow momentum
Earnings
Cash flow from operations excluding working capitalCash flow from operations excluding working capital – 4-quarters rolling (RHS)
$ billion
$51$42
Average Brent oil price - 4 quarters rolling ($/bbl)
0.5
0

Royal Dutch Shell November 2, 2017 21
Q3 2017
Integrated Gas results – cash flow momentum
Earnings on CCS basis, excluding identified items
$ billion
Earnings Q3 2016 to Q3 2017
$ billion
Cash flow momentum
Earnings
Cash flow from operations excluding working capitalCash flow from operations excluding working capital – 4-quarters rolling (RHS)
$ billion

Royal Dutch Shell November 2, 2017 22
Q3 2017
Downstream results – cash flow momentum
Earnings on CCS basis, excluding identified items
$ billion
Earnings Q3 2016 to Q3 2017
$ billion
Cash flow momentum
$ billion
Earnings
Cash flow from operations excluding working capitalCash flow from operations excluding working capital – 4-quarters rolling (RHS)

Royal Dutch Shell November 2, 2017