third quarter 2013 - kuwait sulaiman al-omar ceo kuwait finance house supervision by : eng. fahad k....
TRANSCRIPT
1
Third Quarter 2013 - Kuwait
KFH Local Real Estate ReportThird Quarter 2013 - Kuwait
The World ... Is Your Home
kfh.com 180 3333
KFH Local Real Estate ReportThird Quarter 2013 - Kuwait
Mohammad Sulaiman Al-Omar
CEO
Kuwait Finance House
Supervision by :Eng. Fahad K. Al-MukhaizeemGeneral Manager of Strategy and Corporate AffairsPrepared by :Dr. Mohamed Jamel Al-ShebshiryStrategy and Corporate Affairs
Ahmed AbdulMohsen Al-FarhanWajeeh ZedanYaser Saleh Bin najiLocal Real Estate Dept. - Property Evaluation
Technical Accreditation :Waled Ahmed Al-AhmedLocal Real Estate Dept.
Creative Direction by :Ahmed Al-RashidMarketing & P.R. Dept.
Cover:Photo by: Saleh Al-Rashid
Local Real Estate Dept.
Tel : 22905800
Fax: 22905804
Marketing & Public Relations Dept.
Tel : 22445050 - Ext: 4231
Fax: 22409414
P.O. Box: 24989 Safat, 13110 Kuwait
Email: [email protected]
KFH Local Real Estate Service Locations :KFH HEAD OFFICE
Banking Hall
Tel: 22445050 Ext: 2158 / 2122
KFH AL-FAIHA BRANCH
Tel: 22522264 - 22520174 Ext: 304 / 305
KFH KHEITAN BRANCH
Tel: 24756491
KFH MUBARAK AL-ABDULLA BRANCH
Exhibition Ground
Tel: 25379182 / 3 / 4 Ext:104
KFH AL-ANDALUS BRANCH
Tel: 24866037
MAKKI JOMAA TOWER
4th Floor
Tel: 22413720
Dear Reader, Driven by its firm commitment to carry out its unwavering role
towards community service, social responsibility and promoting
insight into the real estate marketplace, Kuwait Finance House
(“KFH”) is pleased to release KFH Local Real Estate Market
Report (“Report”) of the Third Quarter – 2013 which displays
and analyzes the data and key performance indicators of the
real estate sector.
The report provides a set of indicators which by far covers
the geographical areas of Kuwait and credibly depicts reality
to customers, decision makers, private sector institutions and
other stakeholders inside and outside Kuwait based on reliable
data and authentic sources of information.
Lastly, I would like to present my warm thanks to the Research
and Studies team who took the responsibility of producing
this Report and to everybody who provided the technical and
administrative support to help put this Report at your hands.
I hope that this Report will contribute to promoting the solid
knowledge of the real estate marketplace in Kuwait.
We truly urge everybody who reads this Report to provide
us with constructive feedback or suggestion that would
contribute to developing this Report and promoting KFH’s role
in enhancing the real estate trading. In addition to the Arabic
version, this Report will continue to be issued in English to
showcase helpful data on the real estate marketplace, display
the results and recommendations, and meet the needs of the
real estate marketplace.
For the convenience of non-specialists, the Report provides at
the end of this Report a terminology list of the key real estate
terms and definitions that are commonly used in the local real
estate market.

6
KFH Local Real Estate Report
7
Third Quarter 2013 - Kuwait
IntroductionThe housing problem has come back to focus during Q3-2013 as the questionnaire prepared by
National Assembly revealed that housing is a top priority for Kuwaitis. A set of studies and discussions
have followed as an assertion that the housing problem has become under attention in light of inability
of a Kuwaiti national to afford a suitable housing especially with the growing demand on housing and the
government’s inability to meet the growing needs of people on housing or provide extra lands; factors
which have contributed to increasing the prices of lands coupled with the scarcity of lands as well.
The discussions of specialists and interested parties highlighted several initiatives and hands-on solutions
for the housing problem through a plan set by the government for resolving this irremediable problem.
Mass media asserted that the government is working out innovative and non-traditional solutions that
are based on vertical expansion in the sense that a 400 sqm piece of land can fairly accommodate 8
families. The government’s plan (2013-2014 / 2016-2017) aims at constructing 36,705 housing units.
Volume of real estate sales soared up in Q3 – 2013 compared to Q2-2013 overstepping KD 1 billion
for the second successive year as the value of real estate trading skyrocketed as never been witnessed
since Q4-2007. This upward trend, though coincided with the vacation season and the Holy Month
of Ramadan, is attributable to the growing demand on residential and investment properties coupled
with a corresponding rise in prices. High sales turnover of commercial real estate properties, especially
commercial buildings and towers, is reported during this Q3-2013.
The value of total real estate trading soared up during Q3-2013 by 4% accounting for KD 41 Million
as the total real estate trading valued KD 1.047 billion during Q3-2013 compared to KD 1.007 billion
during Q2-2013. As such, the value of real estate sales since the beginning of the year up to Q3-2013
approached the barrier of KD 3 billion as it registered KD 2.9 billion hiking up noticeably by 19% worth
KD 463 million compared to the sales turnover at the same period of the past year when the real estate
sales valued KD 2.4 billion.
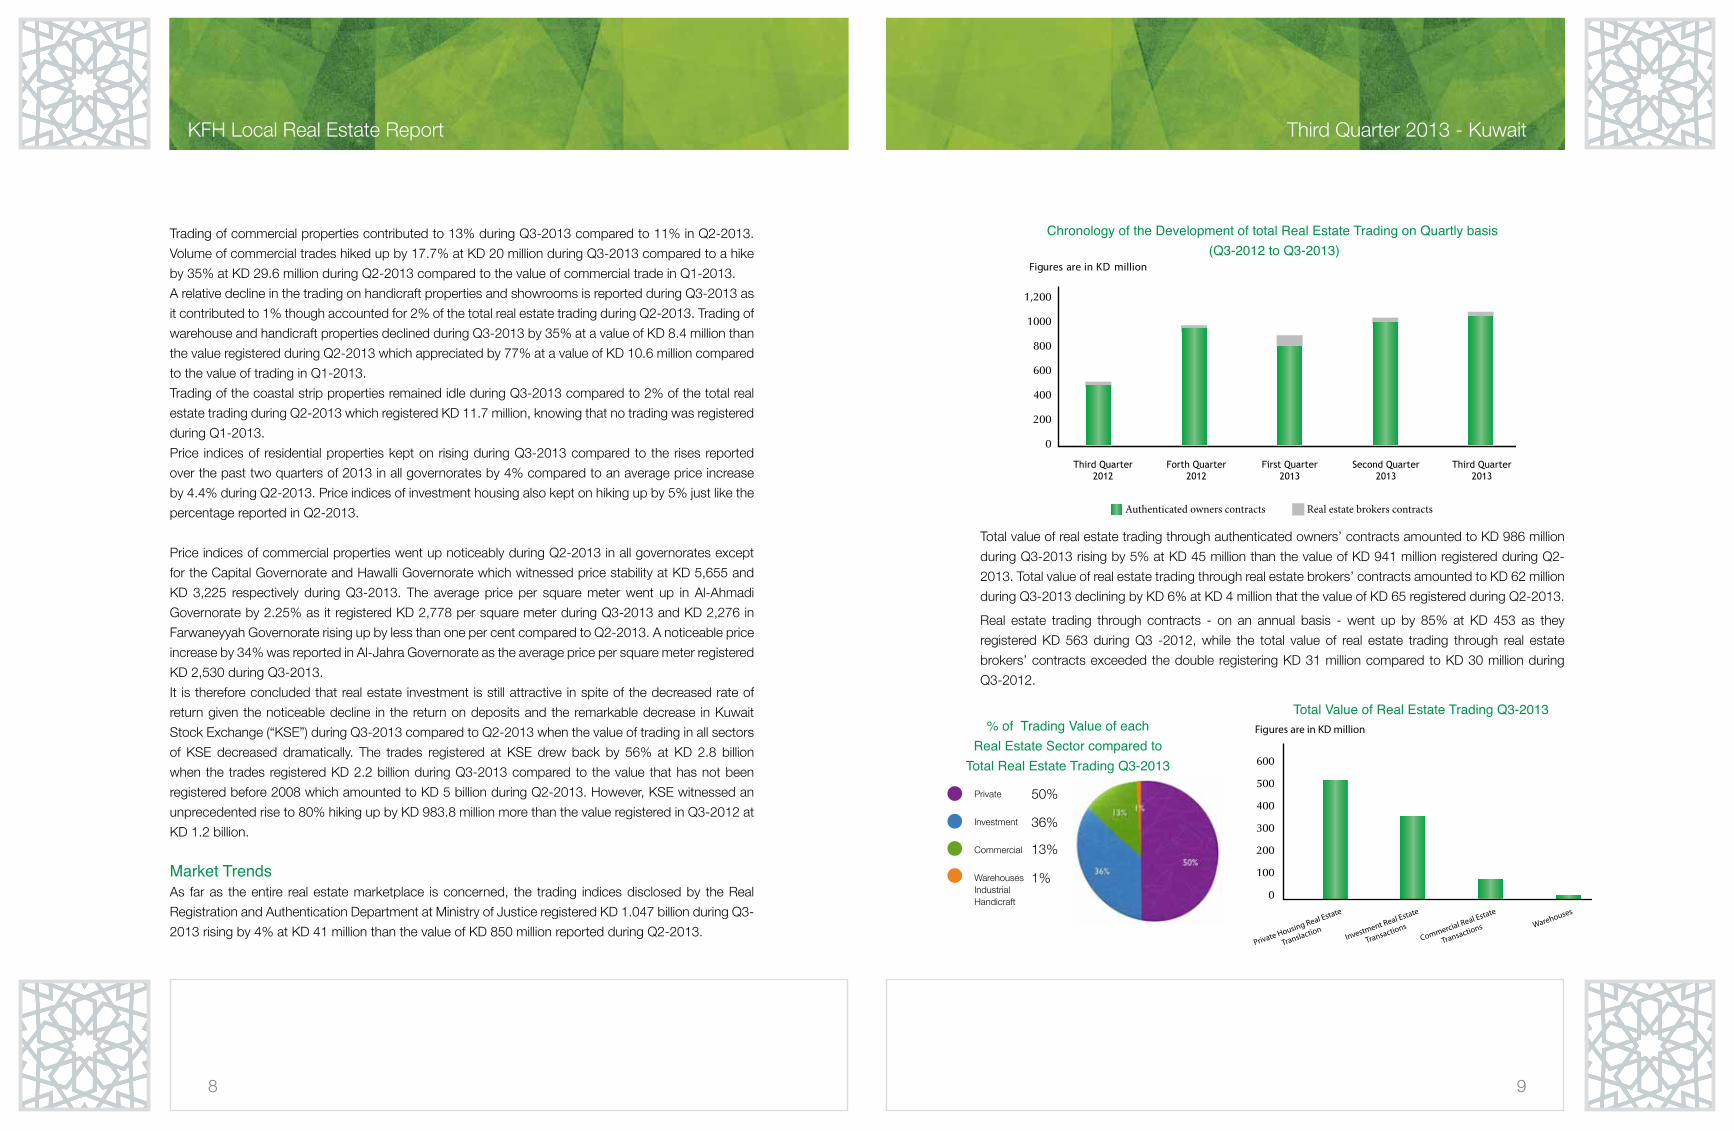
Trading of private housing contributed to 50% of the total real estate trading during Q2 and Q3-2013
though the volume of residential real estate trading increased by 3.9% equal to KD 19.6 million during
Q3-2013 compared to the value of residential real estate trading during Q2-2013 which hiked up by KD
65 million at 15% compared to the residential real estate trading in Q1.-2013.
Investment real estate trading contributed to 36% of the total real estate trading during Q2 and Q3 2013
as it hiked up by 6% at KD 21.6 million during Q3-2013 compared Q2-2013 when the investment real
estate trading increased by 12% at KD 39 million compared to Q1-2013.
The low rate of return on investment properties attracted attention as the average rate of return on
investment properties reached 6.47% at the Capital Governorate, 6.48% at Hawalli Governorate, 6.83%
at Farwaneyyah Governorate, 7.39% at Al-Ahmadi Governorate, 7.17% at Al-Jahra Governorate and
7.15% at Mubarak Al-Kabeer Governorate. This reflects the noticeable appreciation in the value of
investment properties as the average value of a building in the State of Kuwait is estimated at KD 881
million during Q3-2013.
This appreciation in the value of investment properties was conducive to corresponding appreciation
in the value of rentals of investment properties especially the new properties whose rates hiked up by
16% to 35% during Q3-2013 compared to Q3-2012 depending on the location, rating and services of
the leased properties. Rentals ranged from KD 190 to 280 during Q3-2012 compared to KD 250 to KD
350 during Q3-2013 for 60 sqm investment apartments, and from KD 280 to KD 415 for investment
apartments during Q3-2013 compared to KD 200 to KD 350 during Q3-2012 for 70 to 74 sqm
apartments, and from KD 220 to KD 400 during Q3-2012 for 80 to 85 sqm investment apartments, and
from KD 425 to KD 565 during Q3-2013 compared to KD 280 to KD 550 during Q2-2012 for 100 to
110 sqm investment apartments.
Critical to this is that the pay raises in the public sector have contributed to increasing the demand on
private housing though scarcity in supply leading immediately to a rise in the rentals at residential areas.
Pays at public sector hiked to KD 4.8 billion during 2013 rising by 18% equal to KD 728 million than pays
in 2012 which valued KD 4.1 billion.
Chronology of development of pays at public Sector(2004-2005 to 2012-2013)
6,000
5,000
4,000
3,000
2,000
1,000
0
KD Million %
Development of Pays (Right)Pays (Left)
2005 2006 2007 2008 2009 2010 2011 2012 2013
30%
25%
20%
15%
10%
5%
0%
8
KFH Local Real Estate Report
9
Third Quarter 2013 - Kuwait
Trading of commercial properties contributed to 13% during Q3-2013 compared to 11% in Q2-2013.
Volume of commercial trades hiked up by 17.7% at KD 20 million during Q3-2013 compared to a hike
by 35% at KD 29.6 million during Q2-2013 compared to the value of commercial trade in Q1-2013.
A relative decline in the trading on handicraft properties and showrooms is reported during Q3-2013 as
it contributed to 1% though accounted for 2% of the total real estate trading during Q2-2013. Trading of
warehouse and handicraft properties declined during Q3-2013 by 35% at a value of KD 8.4 million than
the value registered during Q2-2013 which appreciated by 77% at a value of KD 10.6 million compared
to the value of trading in Q1-2013.
Trading of the coastal strip properties remained idle during Q3-2013 compared to 2% of the total real
estate trading during Q2-2013 which registered KD 11.7 million, knowing that no trading was registered
during Q1-2013.
Price indices of residential properties kept on rising during Q3-2013 compared to the rises reported
over the past two quarters of 2013 in all governorates by 4% compared to an average price increase
by 4.4% during Q2-2013. Price indices of investment housing also kept on hiking up by 5% just like the
percentage reported in Q2-2013.
Price indices of commercial properties went up noticeably during Q2-2013 in all governorates except
for the Capital Governorate and Hawalli Governorate which witnessed price stability at KD 5,655 and
KD 3,225 respectively during Q3-2013. The average price per square meter went up in Al-Ahmadi
Governorate by 2.25% as it registered KD 2,778 per square meter during Q3-2013 and KD 2,276 in
Farwaneyyah Governorate rising up by less than one per cent compared to Q2-2013. A noticeable price
increase by 34% was reported in Al-Jahra Governorate as the average price per square meter registered
KD 2,530 during Q3-2013.
It is therefore concluded that real estate investment is still attractive in spite of the decreased rate of
return given the noticeable decline in the return on deposits and the remarkable decrease in Kuwait
Stock Exchange (“KSE”) during Q3-2013 compared to Q2-2013 when the value of trading in all sectors
of KSE decreased dramatically. The trades registered at KSE drew back by 56% at KD 2.8 billion
when the trades registered KD 2.2 billion during Q3-2013 compared to the value that has not been
registered before 2008 which amounted to KD 5 billion during Q2-2013. However, KSE witnessed an
unprecedented rise to 80% hiking up by KD 983.8 million more than the value registered in Q3-2012 at
KD 1.2 billion.
Market TrendsAs far as the entire real estate marketplace is concerned, the trading indices disclosed by the Real
Registration and Authentication Department at Ministry of Justice registered KD 1.047 billion during Q3-
2013 rising by 4% at KD 41 million than the value of KD 850 million reported during Q2-2013.
Chronology of the Development of total Real Estate Trading on Quartly basis (Q3-2012 to Q3-2013)
Total value of real estate trading through authenticated owners’ contracts amounted to KD 986 million
during Q3-2013 rising by 5% at KD 45 million than the value of KD 941 million registered during Q2-
2013. Total value of real estate trading through real estate brokers’ contracts amounted to KD 62 million
during Q3-2013 declining by KD 6% at KD 4 million that the value of KD 65 registered during Q2-2013.
Real estate trading through contracts - on an annual basis - went up by 85% at KD 453 as they
registered KD 563 during Q3 -2012, while the total value of real estate trading through real estate
brokers’ contracts exceeded the double registering KD 31 million compared to KD 30 million during
Q3-2012.
Third Quarter2013
Second Quarter2013
First Quarter2013
Forth Quarter2012
Third Quarter2012
1,200
1000
800
600
400
200
0
Real estate brokers contractsAuthenticated owners contracts
50%
36%
13%
1%0
100
200
300
400
500
600
Total Value of Real Estate Trading Q3-2013% of Trading Value of each
Real Estate Sector compared toTotal Real Estate Trading Q3-2013
Private
Investment
Commercial
WarehousesIndustrialHandicraft
10
KFH Local Real Estate Report
11
Third Quarter 2013 - Kuwait
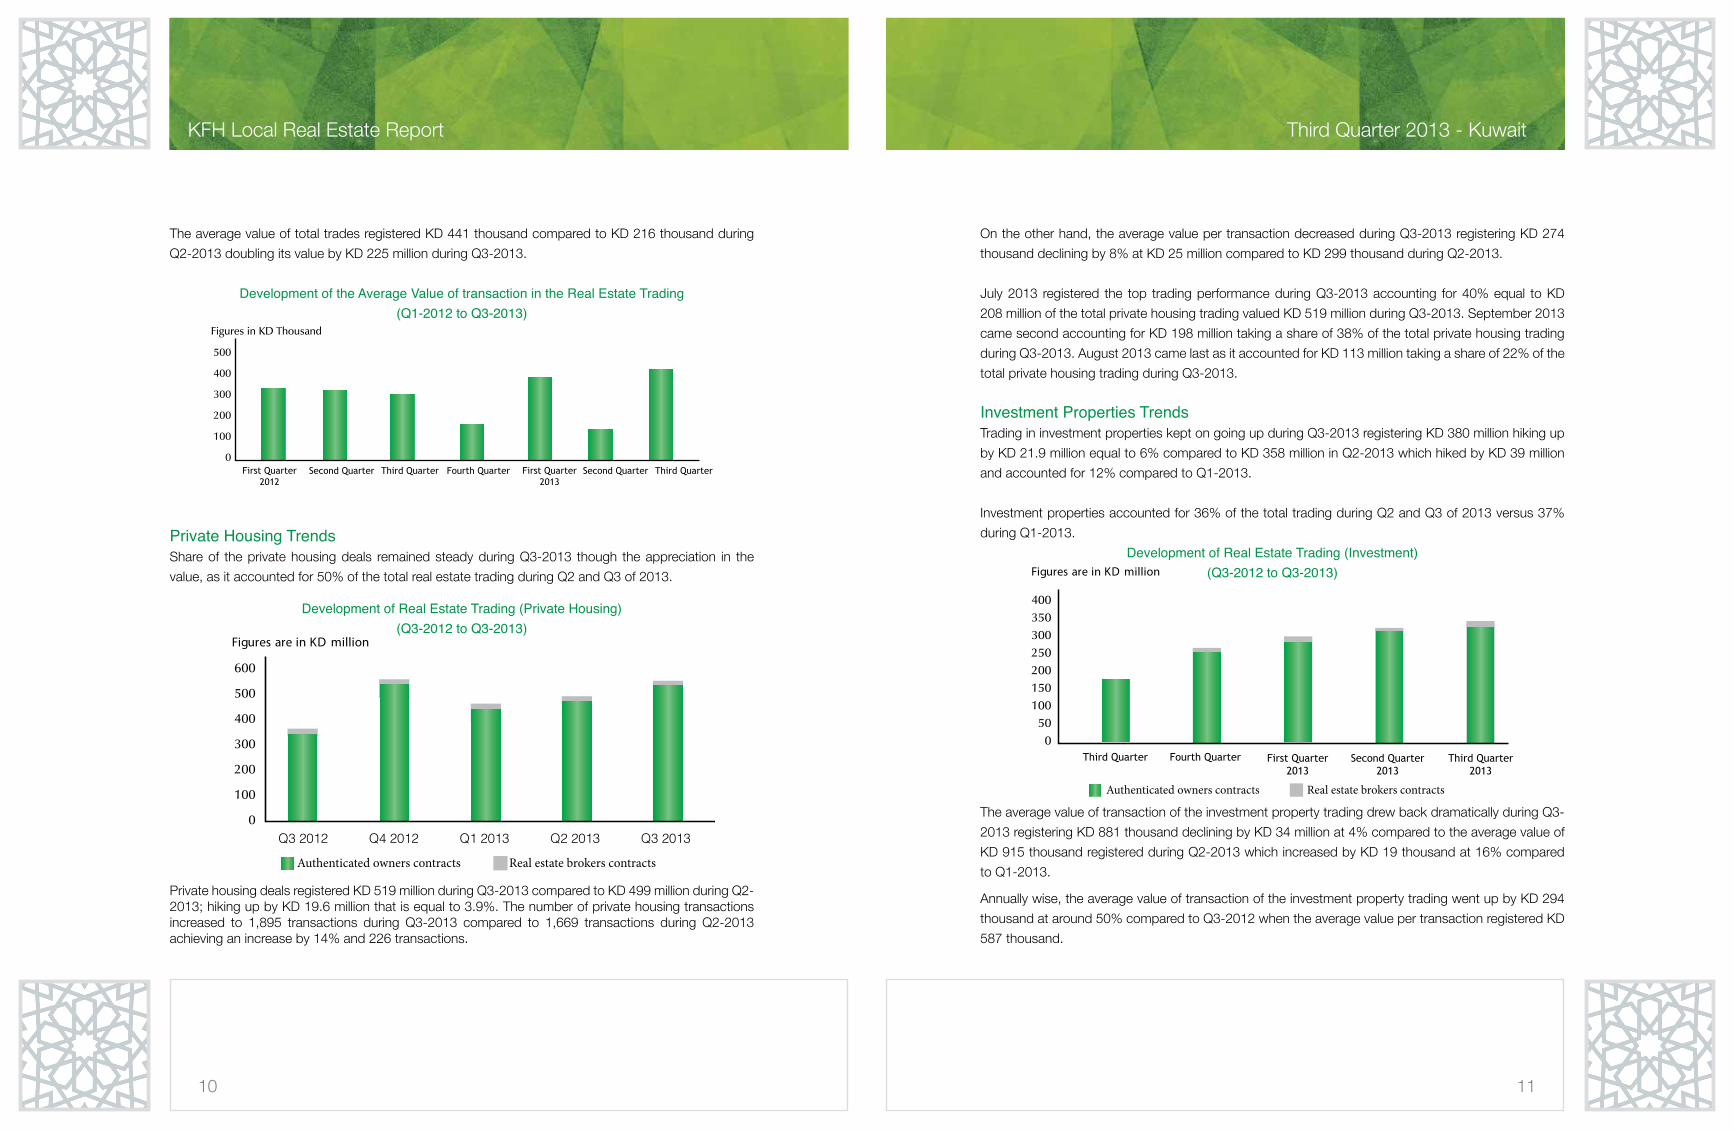
The average value of total trades registered KD 441 thousand compared to KD 216 thousand during
Q2-2013 doubling its value by KD 225 million during Q3-2013.
Development of the Average Value of transaction in the Real Estate Trading(Q1-2012 to Q3-2013)
Private Housing TrendsShare of the private housing deals remained steady during Q3-2013 though the appreciation in the
value, as it accounted for 50% of the total real estate trading during Q2 and Q3 of 2013.
Development of Real Estate Trading (Private Housing)(Q3-2012 to Q3-2013)
Private housing deals registered KD 519 million during Q3-2013 compared to KD 499 million during Q2-2013; hiking up by KD 19.6 million that is equal to 3.9%. The number of private housing transactions increased to 1,895 transactions during Q3-2013 compared to 1,669 transactions during Q2-2013 achieving an increase by 14% and 226 transactions.
On the other hand, the average value per transaction decreased during Q3-2013 registering KD 274
thousand declining by 8% at KD 25 million compared to KD 299 thousand during Q2-2013.
July 2013 registered the top trading performance during Q3-2013 accounting for 40% equal to KD
208 million of the total private housing trading valued KD 519 million during Q3-2013. September 2013
came second accounting for KD 198 million taking a share of 38% of the total private housing trading
during Q3-2013. August 2013 came last as it accounted for KD 113 million taking a share of 22% of the
total private housing trading during Q3-2013.
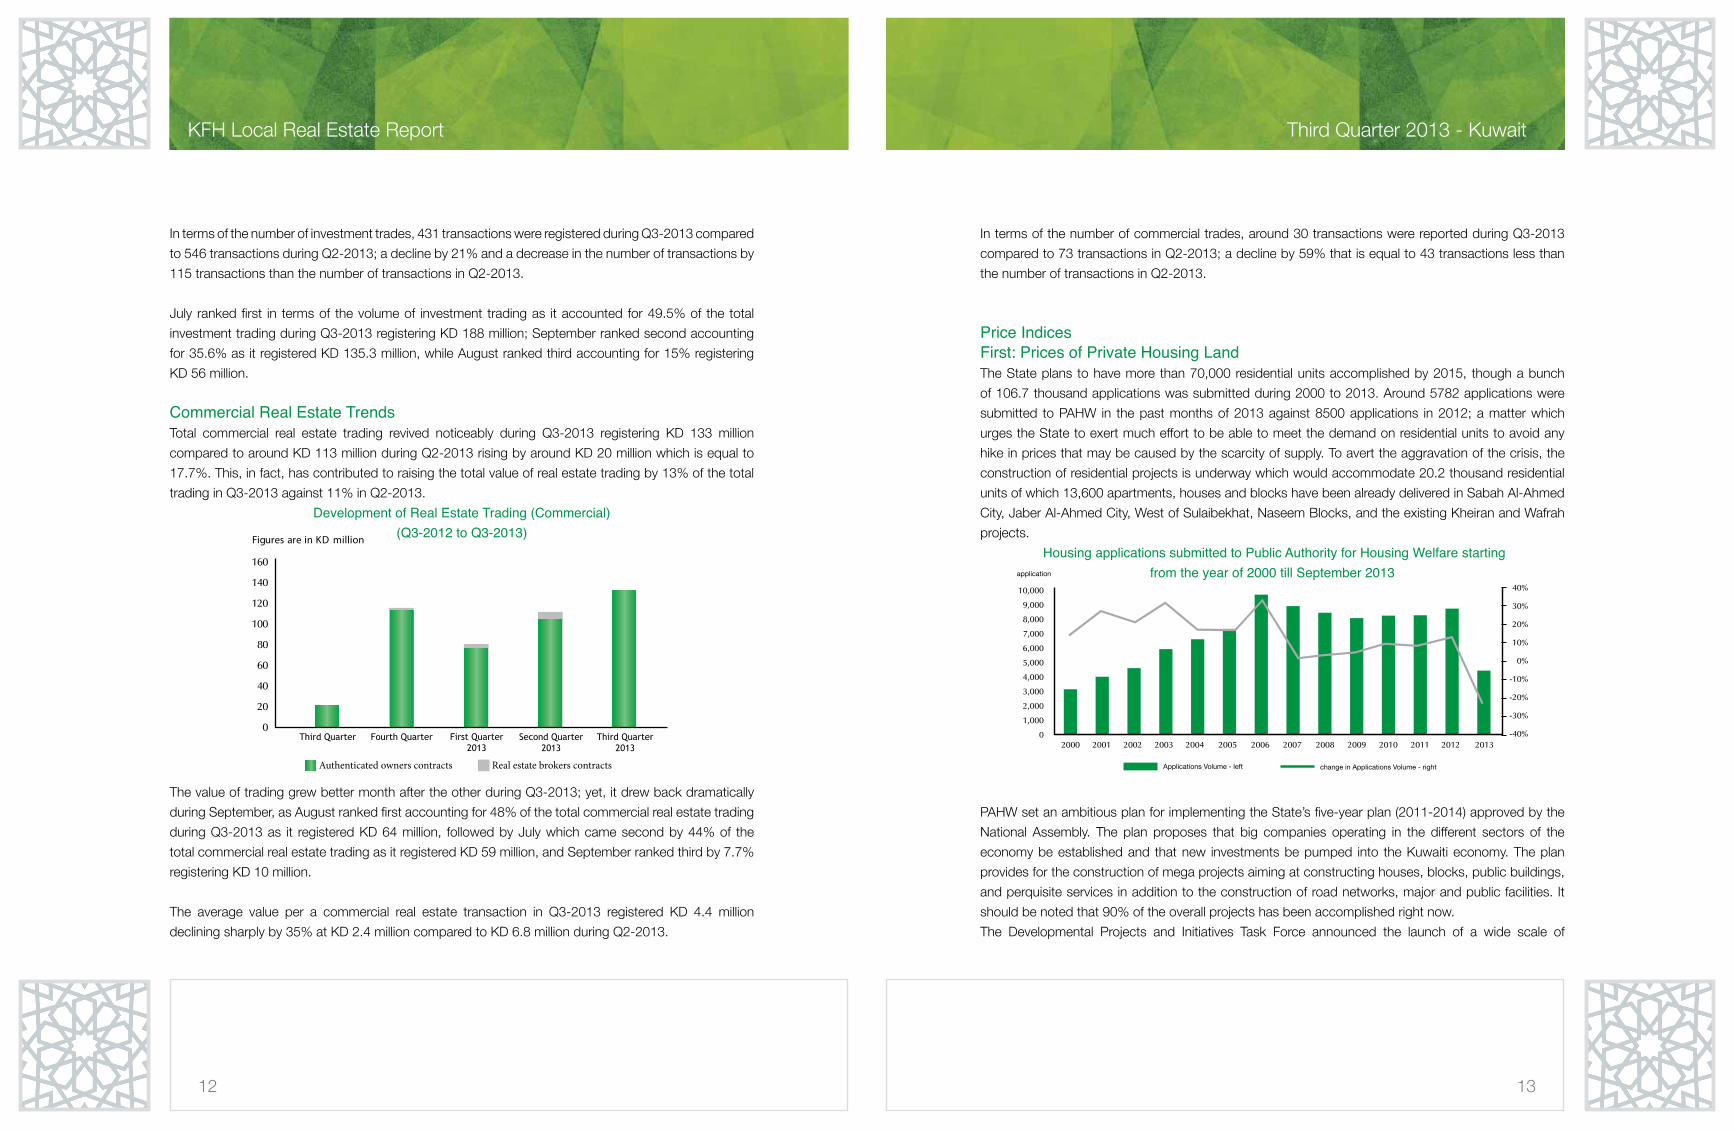
Investment Properties TrendsTrading in investment properties kept on going up during Q3-2013 registering KD 380 million hiking up
by KD 21.9 million equal to 6% compared to KD 358 million in Q2-2013 which hiked by KD 39 million
and accounted for 12% compared to Q1-2013.
Investment properties accounted for 36% of the total trading during Q2 and Q3 of 2013 versus 37%
during Q1-2013.
Development of Real Estate Trading (Investment)(Q3-2012 to Q3-2013)
The average value of transaction of the investment property trading drew back dramatically during Q3-
2013 registering KD 881 thousand declining by KD 34 million at 4% compared to the average value of
KD 915 thousand registered during Q2-2013 which increased by KD 19 thousand at 16% compared
to Q1-2013.
Annually wise, the average value of transaction of the investment property trading went up by KD 294
thousand at around 50% compared to Q3-2012 when the average value per transaction registered KD
587 thousand.
Q3 2012 Q4 2012 Q1 2013 Q2 2013 Q3 2013
600
500
400
300
200
100
0
Real estate brokers contractsAuthenticated owners contracts
Third Quarter2013
Second Quarter2013
First Quarter2013
Real estate brokers contractsAuthenticated owners contracts
500
400
300
200
100
0
Figures in KD Thousand
12
KFH Local Real Estate Report
13
Third Quarter 2013 - Kuwait
In terms of the number of investment trades, 431 transactions were registered during Q3-2013 compared
to 546 transactions during Q2-2013; a decline by 21% and a decrease in the number of transactions by
115 transactions than the number of transactions in Q2-2013.
July ranked first in terms of the volume of investment trading as it accounted for 49.5% of the total
investment trading during Q3-2013 registering KD 188 million; September ranked second accounting
for 35.6% as it registered KD 135.3 million, while August ranked third accounting for 15% registering
KD 56 million.
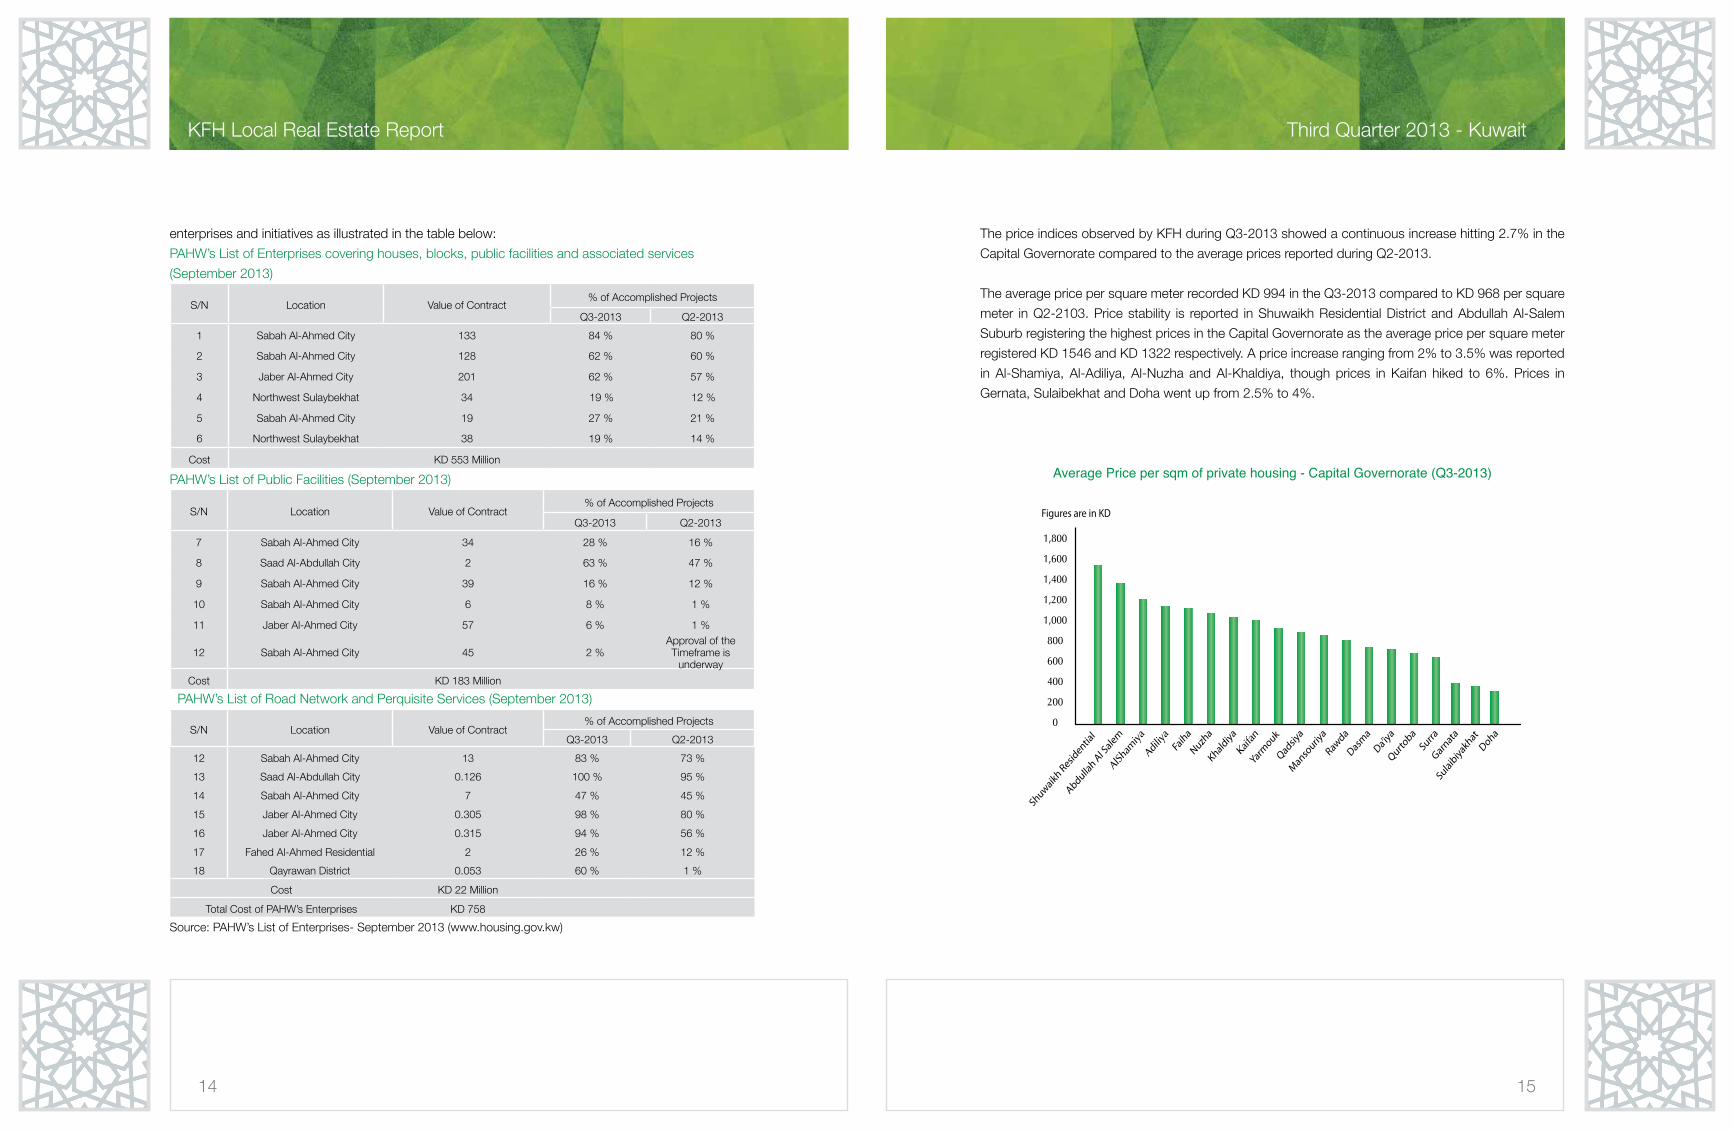
Commercial Real Estate TrendsTotal commercial real estate trading revived noticeably during Q3-2013 registering KD 133 million
compared to around KD 113 million during Q2-2013 rising by around KD 20 million which is equal to
17.7%. This, in fact, has contributed to raising the total value of real estate trading by 13% of the total
trading in Q3-2013 against 11% in Q2-2013.
Development of Real Estate Trading (Commercial)(Q3-2012 to Q3-2013)
The value of trading grew better month after the other during Q3-2013; yet, it drew back dramatically
during September, as August ranked first accounting for 48% of the total commercial real estate trading
during Q3-2013 as it registered KD 64 million, followed by July which came second by 44% of the
total commercial real estate trading as it registered KD 59 million, and September ranked third by 7.7%
registering KD 10 million.
The average value per a commercial real estate transaction in Q3-2013 registered KD 4.4 million
declining sharply by 35% at KD 2.4 million compared to KD 6.8 million during Q2-2013.
In terms of the number of commercial trades, around 30 transactions were reported during Q3-2013
compared to 73 transactions in Q2-2013; a decline by 59% that is equal to 43 transactions less than
the number of transactions in Q2-2013.
Price IndicesFirst: Prices of Private Housing LandThe State plans to have more than 70,000 residential units accomplished by 2015, though a bunch
of 106.7 thousand applications was submitted during 2000 to 2013. Around 5782 applications were
submitted to PAHW in the past months of 2013 against 8500 applications in 2012; a matter which
urges the State to exert much effort to be able to meet the demand on residential units to avoid any
hike in prices that may be caused by the scarcity of supply. To avert the aggravation of the crisis, the
construction of residential projects is underway which would accommodate 20.2 thousand residential
units of which 13,600 apartments, houses and blocks have been already delivered in Sabah Al-Ahmed
City, Jaber Al-Ahmed City, West of Sulaibekhat, Naseem Blocks, and the existing Kheiran and Wafrah
projects.
Housing applications submitted to Public Authority for Housing Welfare starting from the year of 2000 till September 2013
PAHW set an ambitious plan for implementing the State’s five-year plan (2011-2014) approved by the
National Assembly. The plan proposes that big companies operating in the different sectors of the
economy be established and that new investments be pumped into the Kuwaiti economy. The plan
provides for the construction of mega projects aiming at constructing houses, blocks, public buildings,
and perquisite services in addition to the construction of road networks, major and public facilities. It
should be noted that 90% of the overall projects has been accomplished right now.
The Developmental Projects and Initiatives Task Force announced the launch of a wide scale of
10,000
9,000
8,000
7,000
6,000
5,000
4,000
3,000
2,000
1,000
02000 2001 2002 2003 2004 2005 2006 2007 2008 2009 2010 2011 2012 2013
40%
30%
20%
10%
0%
-10%
-20%
-30%
-40%
change in Applications Volume - rightApplications Volume - left
application
160
140
120
100
80
60
40
20
0
Real estate brokers contractsAuthenticated owners contracts
14
KFH Local Real Estate Report
15
Third Quarter 2013 - Kuwait
enterprises and initiatives as illustrated in the table below:
PAHW’s List of Enterprises covering houses, blocks, public facilities and associated services
(September 2013)
S/N Location Value of Contract% of Accomplished Projects
Q3-2013 Q2-2013
1 Sabah Al-Ahmed City 133 84 % 80 %
2 Sabah Al-Ahmed City 128 62 % 60 %
3 Jaber Al-Ahmed City 201 62 % 57 %
4 Northwest Sulaybekhat 34 19 % 12 %
5 Sabah Al-Ahmed City 19 27 % 21 %
6 Northwest Sulaybekhat 38 19 % 14 %
Cost KD 553 Million
PAHW’s List of Public Facilities (September 2013)
S/N Location Value of Contract% of Accomplished Projects
Q3-2013 Q2-2013
7 Sabah Al-Ahmed City 34 28 % 16 %
8 Saad Al-Abdullah City 2 63 % 47 %
9 Sabah Al-Ahmed City 39 16 % 12 %
10 Sabah Al-Ahmed City 6 8 % 1 %
11 Jaber Al-Ahmed City 57 6 % 1 %
12 Sabah Al-Ahmed City 45 2 %Approval of the Timeframe is
underway
Cost KD 183 Million
PAHW’s List of Road Network and Perquisite Services (September 2013)
S/N Location Value of Contract% of Accomplished Projects
Q3-2013 Q2-2013
12 Sabah Al-Ahmed City 13 83 % 73 %
13 Saad Al-Abdullah City 0.126 100 % 95 %
14 Sabah Al-Ahmed City 7 47 % 45 %
15 Jaber Al-Ahmed City 0.305 98 % 80 %
16 Jaber Al-Ahmed City 0.315 94 % 56 %
17 Fahed Al-Ahmed Residential 2 26 % 12 %
18 Qayrawan District 0.053 60 % 1 %
Cost KD 22 Million
Total Cost of PAHW’s Enterprises KD 758
Source: PAHW’s List of Enterprises- September 2013 (www.housing.gov.kw)
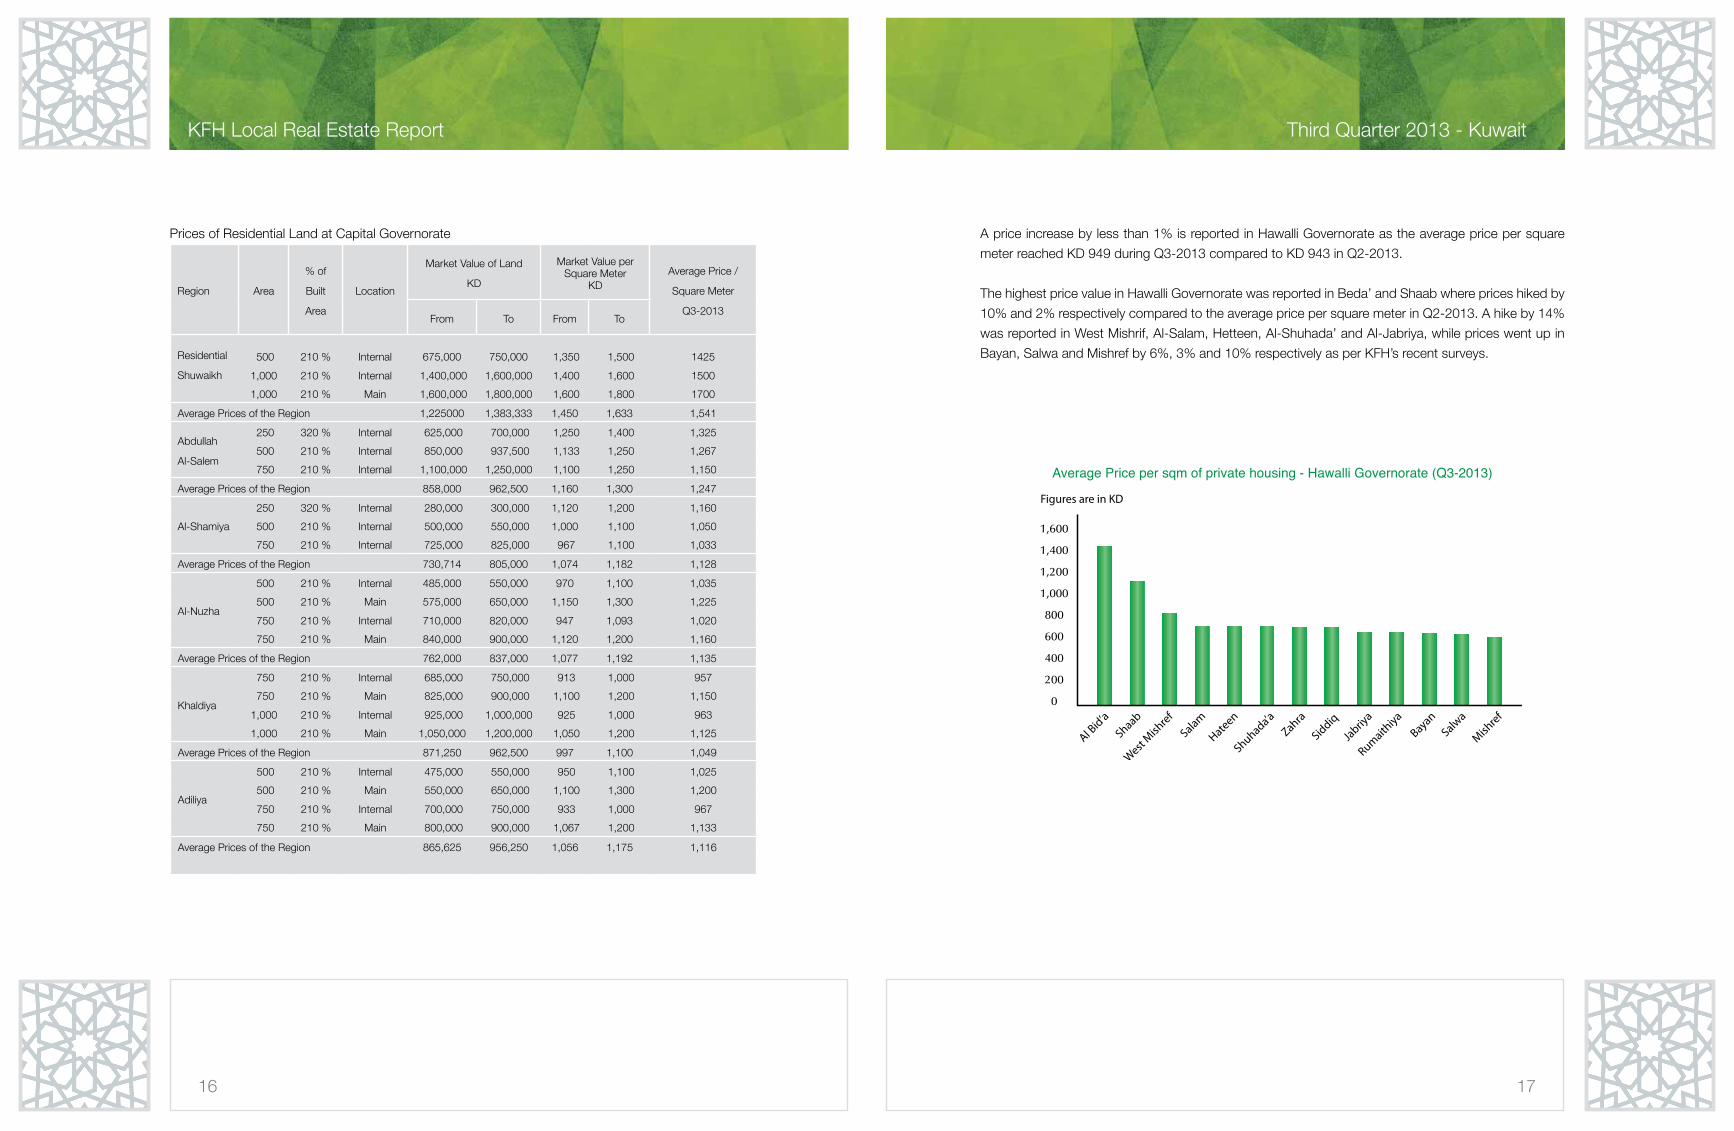
The price indices observed by KFH during Q3-2013 showed a continuous increase hitting 2.7% in the
Capital Governorate compared to the average prices reported during Q2-2013.
The average price per square meter recorded KD 994 in the Q3-2013 compared to KD 968 per square
meter in Q2-2103. Price stability is reported in Shuwaikh Residential District and Abdullah Al-Salem
Suburb registering the highest prices in the Capital Governorate as the average price per square meter
registered KD 1546 and KD 1322 respectively. A price increase ranging from 2% to 3.5% was reported
in Al-Shamiya, Al-Adiliya, Al-Nuzha and Al-Khaldiya, though prices in Kaifan hiked to 6%. Prices in
Gernata, Sulaibekhat and Doha went up from 2.5% to 4%.
Average Price per sqm of private housing - Capital Governorate (Q3-2013)
16
KFH Local Real Estate Report
17
Third Quarter 2013 - Kuwait
Prices of Residential Land at Capital Governorate
Region Area
% of
Built
Area
Location
Market Value of Land
KD
Market Value per Square Meter
KDAverage Price /
Square Meter
Q3-2013From To From To
Residential
Shuwaikh
500 210 % Internal 675,000 750,000 1,350 1,500 1425
1,000 210 % Internal 1,400,000 1,600,000 1,400 1,600 1500
1,000 210 % Main 1,600,000 1,800,000 1,600 1,800 1700
Average Prices of the Region 1,225000 1,383,333 1,450 1,633 1,541
Abdullah
Al-Salem
250 320 % Internal 625,000 700,000 1,250 1,400 1,325
500 210 % Internal 850,000 937,500 1,133 1,250 1,267
750 210 % Internal 1,100,000 1,250,000 1,100 1,250 1,150
Average Prices of the Region 858,000 962,500 1,160 1,300 1,247
Al-Shamiya
250 320 % Internal 280,000 300,000 1,120 1,200 1,160
500 210 % Internal 500,000 550,000 1,000 1,100 1,050
750 210 % Internal 725,000 825,000 967 1,100 1,033
Average Prices of the Region 730,714 805,000 1,074 1,182 1,128
Al-Nuzha
500 210 % Internal 485,000 550,000 970 1,100 1,035
500 210 % Main 575,000 650,000 1,150 1,300 1,225
750 210 % Internal 710,000 820,000 947 1,093 1,020
750 210 % Main 840,000 900,000 1,120 1,200 1,160
Average Prices of the Region 762,000 837,000 1,077 1,192 1,135
Khaldiya
750 210 % Internal 685,000 750,000 913 1,000 957
750 210 % Main 825,000 900,000 1,100 1,200 1,150
1,000 210 % Internal 925,000 1,000,000 925 1,000 963
1,000 210 % Main 1,050,000 1,200,000 1,050 1,200 1,125
Average Prices of the Region 871,250 962,500 997 1,100 1,049
Adiliya
500 210 % Internal 475,000 550,000 950 1,100 1,025
500 210 % Main 550,000 650,000 1,100 1,300 1,200
750 210 % Internal 700,000 750,000 933 1,000 967
750 210 % Main 800,000 900,000 1,067 1,200 1,133
Average Prices of the Region 865,625 956,250 1,056 1,175 1,116
A price increase by less than 1% is reported in Hawalli Governorate as the average price per square
meter reached KD 949 during Q3-2013 compared to KD 943 in Q2-2013.
The highest price value in Hawalli Governorate was reported in Beda’ and Shaab where prices hiked by
10% and 2% respectively compared to the average price per square meter in Q2-2013. A hike by 14%
was reported in West Mishrif, Al-Salam, Hetteen, Al-Shuhada’ and Al-Jabriya, while prices went up in
Bayan, Salwa and Mishref by 6%, 3% and 10% respectively as per KFH’s recent surveys.
Average Price per sqm of private housing - Hawalli Governorate (Q3-2013)
1,600
1,400
1,200
1,000
800
600
400
200
0
18
KFH Local Real Estate Report
19
Third Quarter 2013 - Kuwait
Prices of Residential Land at Hawalli Governorate
Region % of Built
Area
Area Location
Market Value of Land
KD
Market Value per Square Meter
KDAverage Price /
Square Meter
Q3-2013From To From To
Shaab
210 % 400 Internal 400,000 440,000 1,000 1,100 1050
210 % 400 Main 440,000 465,000 1,100 1,163 1131
210 % 500 Internal 450,000 480,000 900 960 930
Average Price of the Region 524,167 553,333 1,000 1,074 1,037
Jabriya210 % 400 Internal 340,000 385,200 850 963 906.5
210 % 400 Main 380,000 420,000 950 1,050 1,000
Average Price of the Region 360,000 402,600 900 1006.5 953,3
Rumaythyyah
210 % 400 Internal 330,000 360,000 825 900 862.5
210 % 400 Main 380,000 420,000 950 1050 1,000
210 % 500 Internal 380,000 440,000 760 880 820
Average Price of the Region 363,333 406,666 845 943 894.2
Salwa210 % 500 Internal 325,000 350,000 650 700 675
210 % 500 Main 380,000 400,000 760 800 780
Average Price of the Region 602,857 642,857 752 802 777
Al-Salam210 % 400 Internal 350,000 385,000 875 963 919
210 % 400 Main 425,000 450,000 1,063 1,125 1094
Average Price of the Region 412,500 446,250 922 997 959
Hetten210 % 500 Internal 400,000 450,000 800 900 850
210 % 500 Main 475,000 500,000 950 1,000 975
Average Price of the Region 412,500 446,250 922 997 959
Al-Shuhada210 % 400 Main 425,000 450,000 1,063 1,125 1094
210 % 500 Internal 400,000 450,000 800 900 850
Average Price of the Region 412,500 446,250 922 997 959
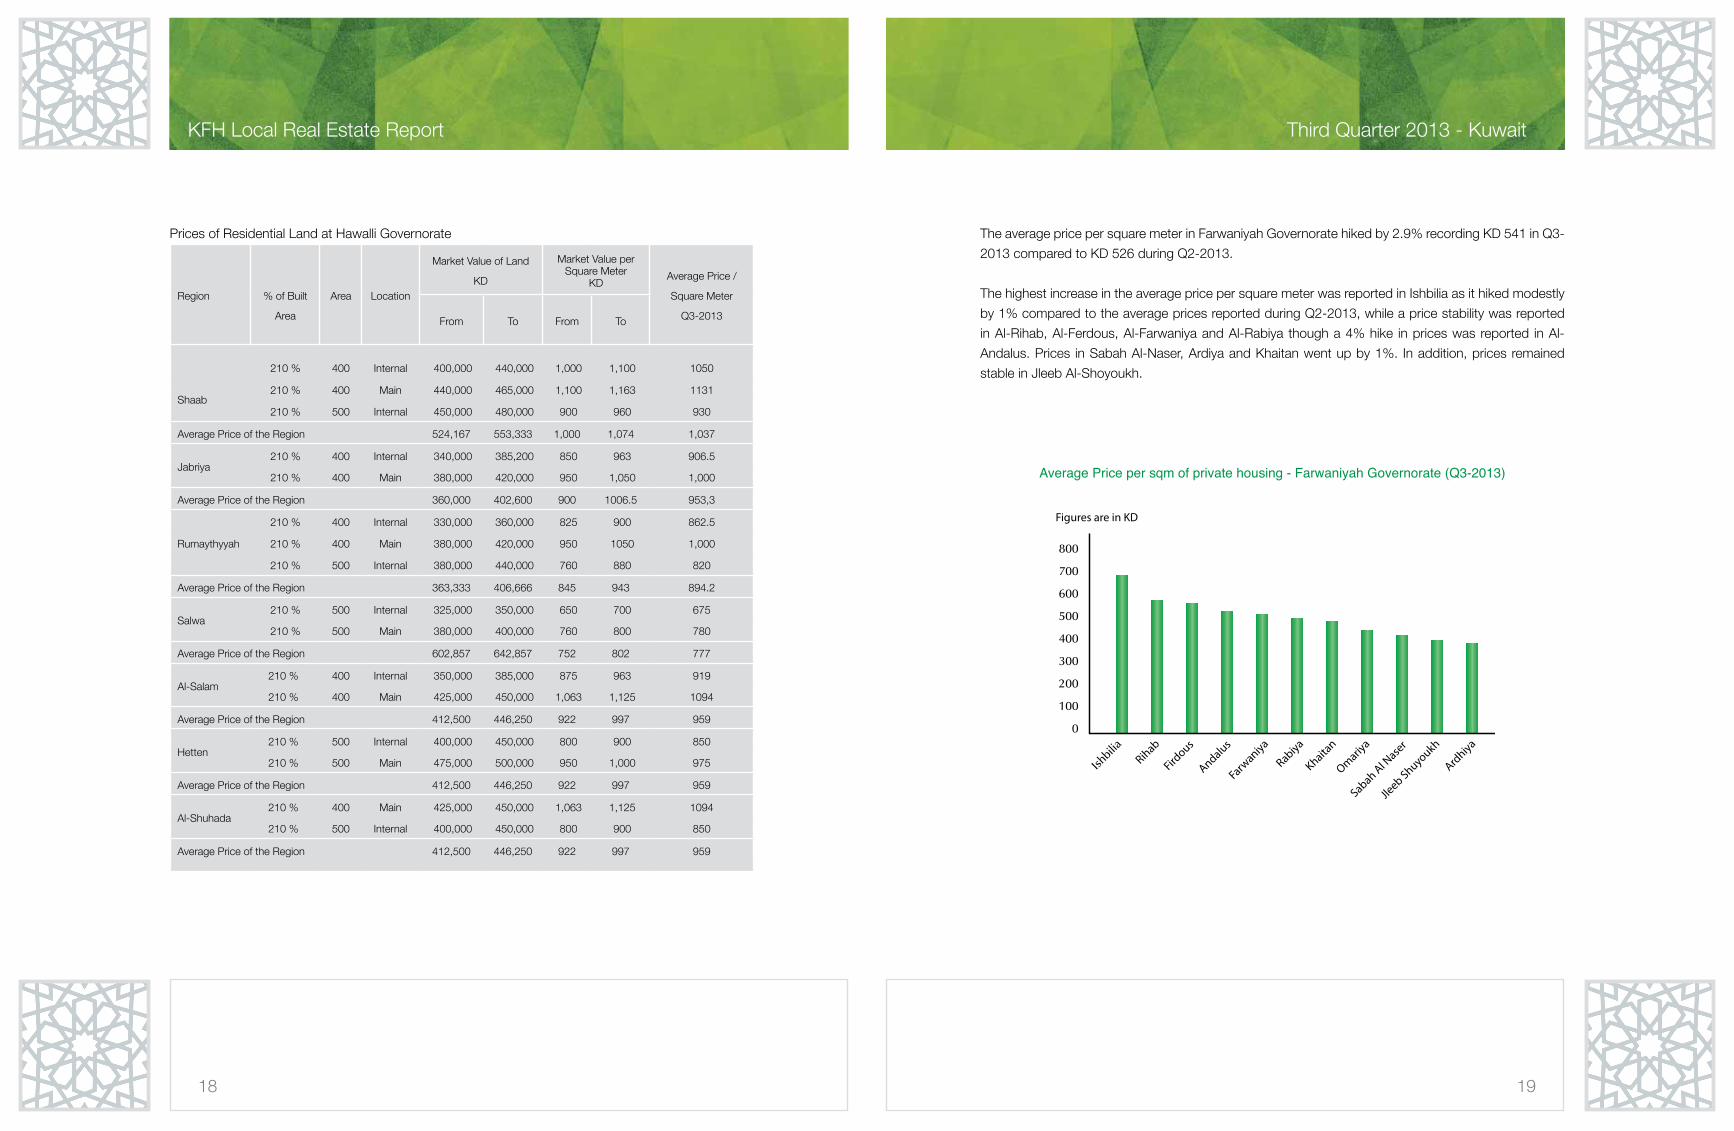
The average price per square meter in Farwaniyah Governorate hiked by 2.9% recording KD 541 in Q3-
2013 compared to KD 526 during Q2-2013.
The highest increase in the average price per square meter was reported in Ishbilia as it hiked modestly
by 1% compared to the average prices reported during Q2-2013, while a price stability was reported
in Al-Rihab, Al-Ferdous, Al-Farwaniya and Al-Rabiya though a 4% hike in prices was reported in Al-
Andalus. Prices in Sabah Al-Naser, Ardiya and Khaitan went up by 1%. In addition, prices remained
stable in Jleeb Al-Shoyoukh.
Average Price per sqm of private housing - Farwaniyah Governorate (Q3-2013)
800
700
600
500
400
300
200
100
0
20
KFH Local Real Estate Report
21
Third Quarter 2013 - Kuwait
Prices of Residential Land at Farwaneyyah Governorate
Region % of Built
Area
Area Location Street
Market Value of Land
KD
Market Value per Square
MeterKD
Average
Price /
Square
Meter
Q3-2013From To From To
Andalus210 % 500 Internal 280,000 340,000 560 680 620
210 % 500 Main 300,000 360,000 600 720 660
Average Price of the Region 290,000 350,000 580 700 640
Rabiya
(Existing House)
210 % 500 Internal 270,000 320,000 540 640 590
210 % 500 Main 320,000 350,000 640 700 670
Average Price of the Region 295,000 335,000 590 670 630
Ishbilia210 % 400 Internal 255,000 275,000 680 733 707
210 % 400 Main 285,000 310,000 760 827 793
Average Price of the Region 297,500 316,667 703 750 726
Farwanyyah210 % 500 Internal 280,000 300,000 560 600 625
210 % 500 Main 320,000 350,000 640 700 670
Average Price of the Region 300,000 325,000 600 650 647.5
Khaitan (Behind
Khaitan Clup)210 % 400 Internal 240,000 280,000 600 700 650
Khaitan 210 % 1000 Faisal
Motorway 480,000 500,000 480 500 490
Average Price of the Region 360,000 390,000 540 600 570
Jleeb Al-Shoyukh 210 % 750 Internal 320,000 360,000 426.7 480 453.7
Average Price of the Region 320,000 360,000 426.7 480 453.7
Ardiya210 % 750 Internal 280,000 340,000 373.4 453.4 413.4
210 % 750 Main 340,000 380,000 453.4 506.7 480.1
Average Price of the Region 310,000 360,000 413.4 480.1 446.8
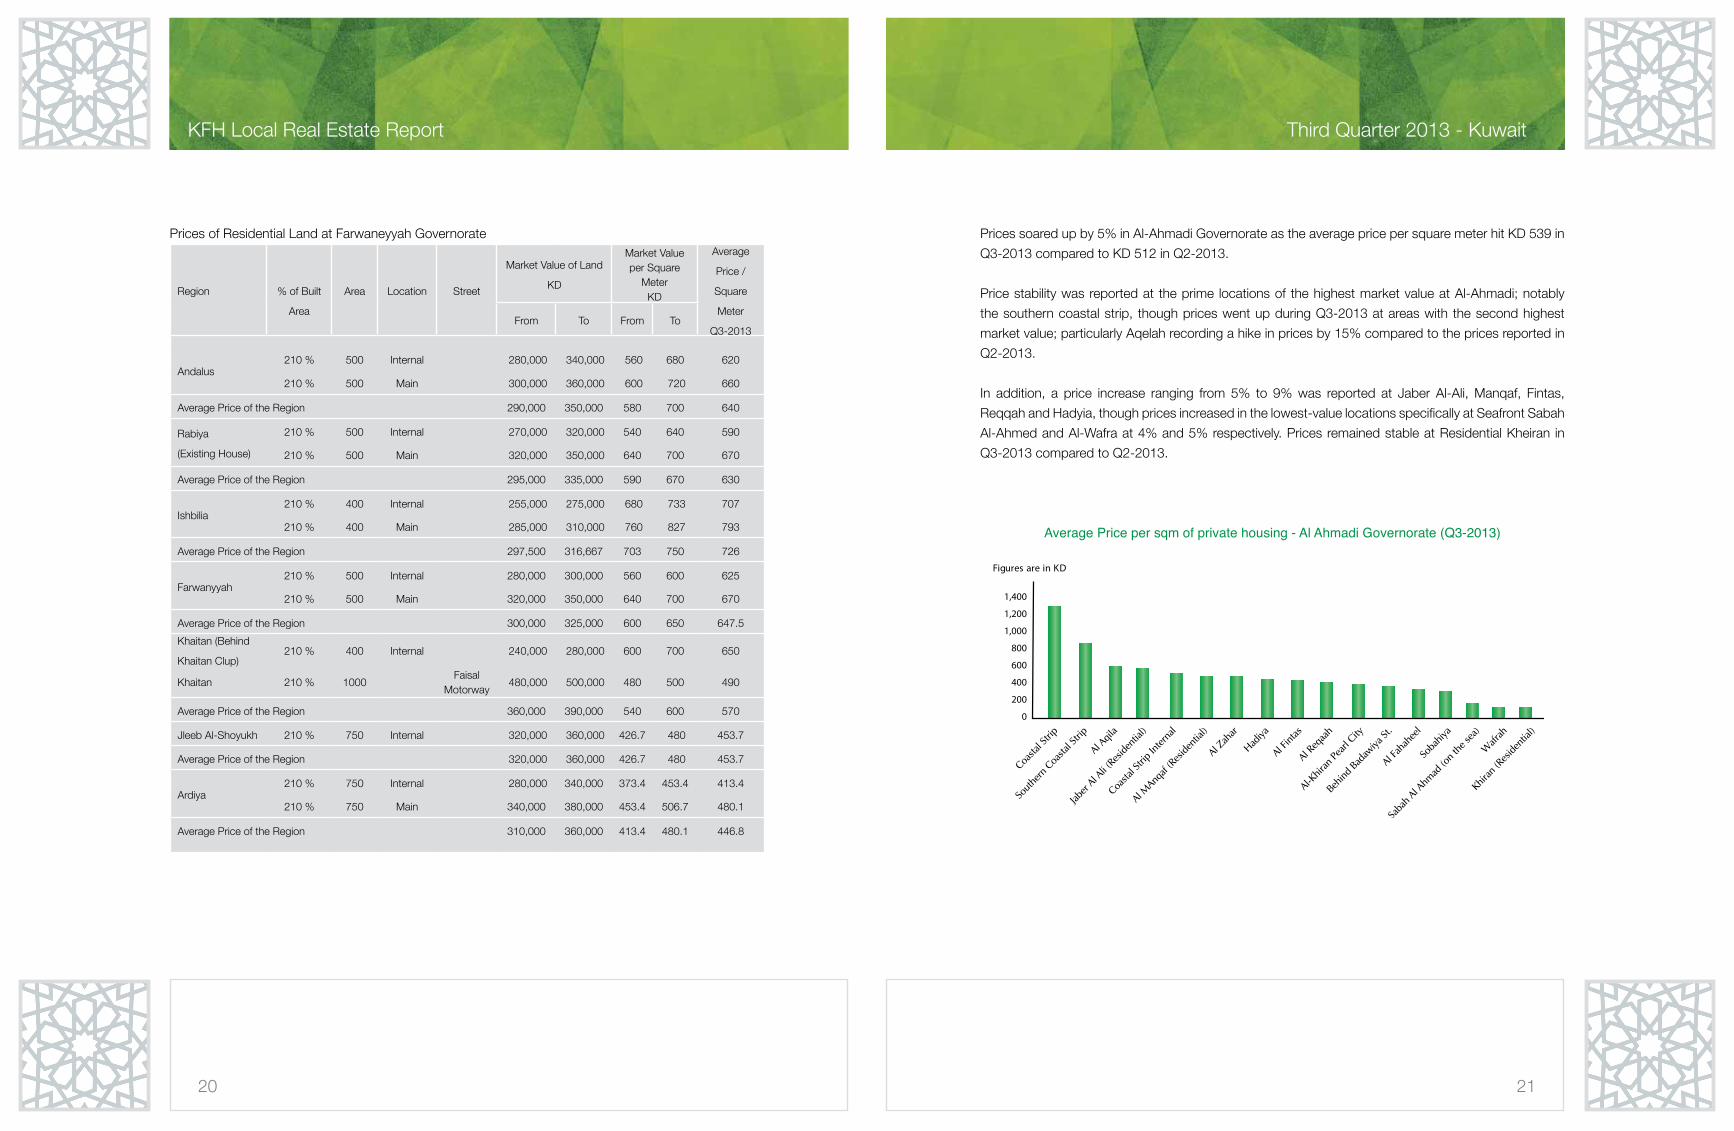
Prices soared up by 5% in Al-Ahmadi Governorate as the average price per square meter hit KD 539 in
Q3-2013 compared to KD 512 in Q2-2013.
Price stability was reported at the prime locations of the highest market value at Al-Ahmadi; notably
the southern coastal strip, though prices went up during Q3-2013 at areas with the second highest
market value; particularly Aqelah recording a hike in prices by 15% compared to the prices reported in
Q2-2013.
In addition, a price increase ranging from 5% to 9% was reported at Jaber Al-Ali, Manqaf, Fintas,
Reqqah and Hadyia, though prices increased in the lowest-value locations specifically at Seafront Sabah
Al-Ahmed and Al-Wafra at 4% and 5% respectively. Prices remained stable at Residential Kheiran in
Q3-2013 compared to Q2-2013.
Average Price per sqm of private housing - Al Ahmadi Governorate (Q3-2013)
22
KFH Local Real Estate Report
23
Third Quarter 2013 - Kuwait
Prices of Residential Land at Al-Ahmadi Governorate
Region% of Built
AreaArea Location
Market Value of Land
KD
Market Value per Square
MeterKD
Average Price
/ Square
Meter
Q3-2013From To From To
Fintas Agricultural 210 % 1000 Internal 430,000 450,000 430 450 440
210 % 1000 Main 520,000 550,000 520 550 535
Hadiya 210 % 750 Internal 320,000 360,000 427 480 453
210 % 750 Main 385,000 425,000 513 567 540
Aqeelah
210 % 400 Internal 250,000 280,000 625 700 663
210 % 400 Main 300,000 320,000 750 800 775
210 % 500 Internal 280,000 330,000 560 660 610
210 % 500 Main 370,000 400,000 740 800 770
Coastal Strip C – Seafront 150 % 750 Main 1,000,000 1,050,000 1,333 1,400 1367
Coastal Strip C – Main Street 150 % 750 Main 750,000 800,000 1,000 1,067 1033
Coastal Strip C – Internal Streets 150 % 750 Internal 450,000 500,000 600 667 633
Kheiran Residential City 210 % 400 Internal 65,000 80,000 163 200 181
Sabah Al-Ahmed A1 - Seafront 210 % 1200 Seafront 255,000 265,000 213 221 217
Sabah Al-Ahmed A2 - Seafront 210 % 1200 Seafront 285,000 300,000 238 250 244
Loloat Kheiran CityA3 – Seafront 210 % 640 Seafront 260,000 300,000 406 469 438
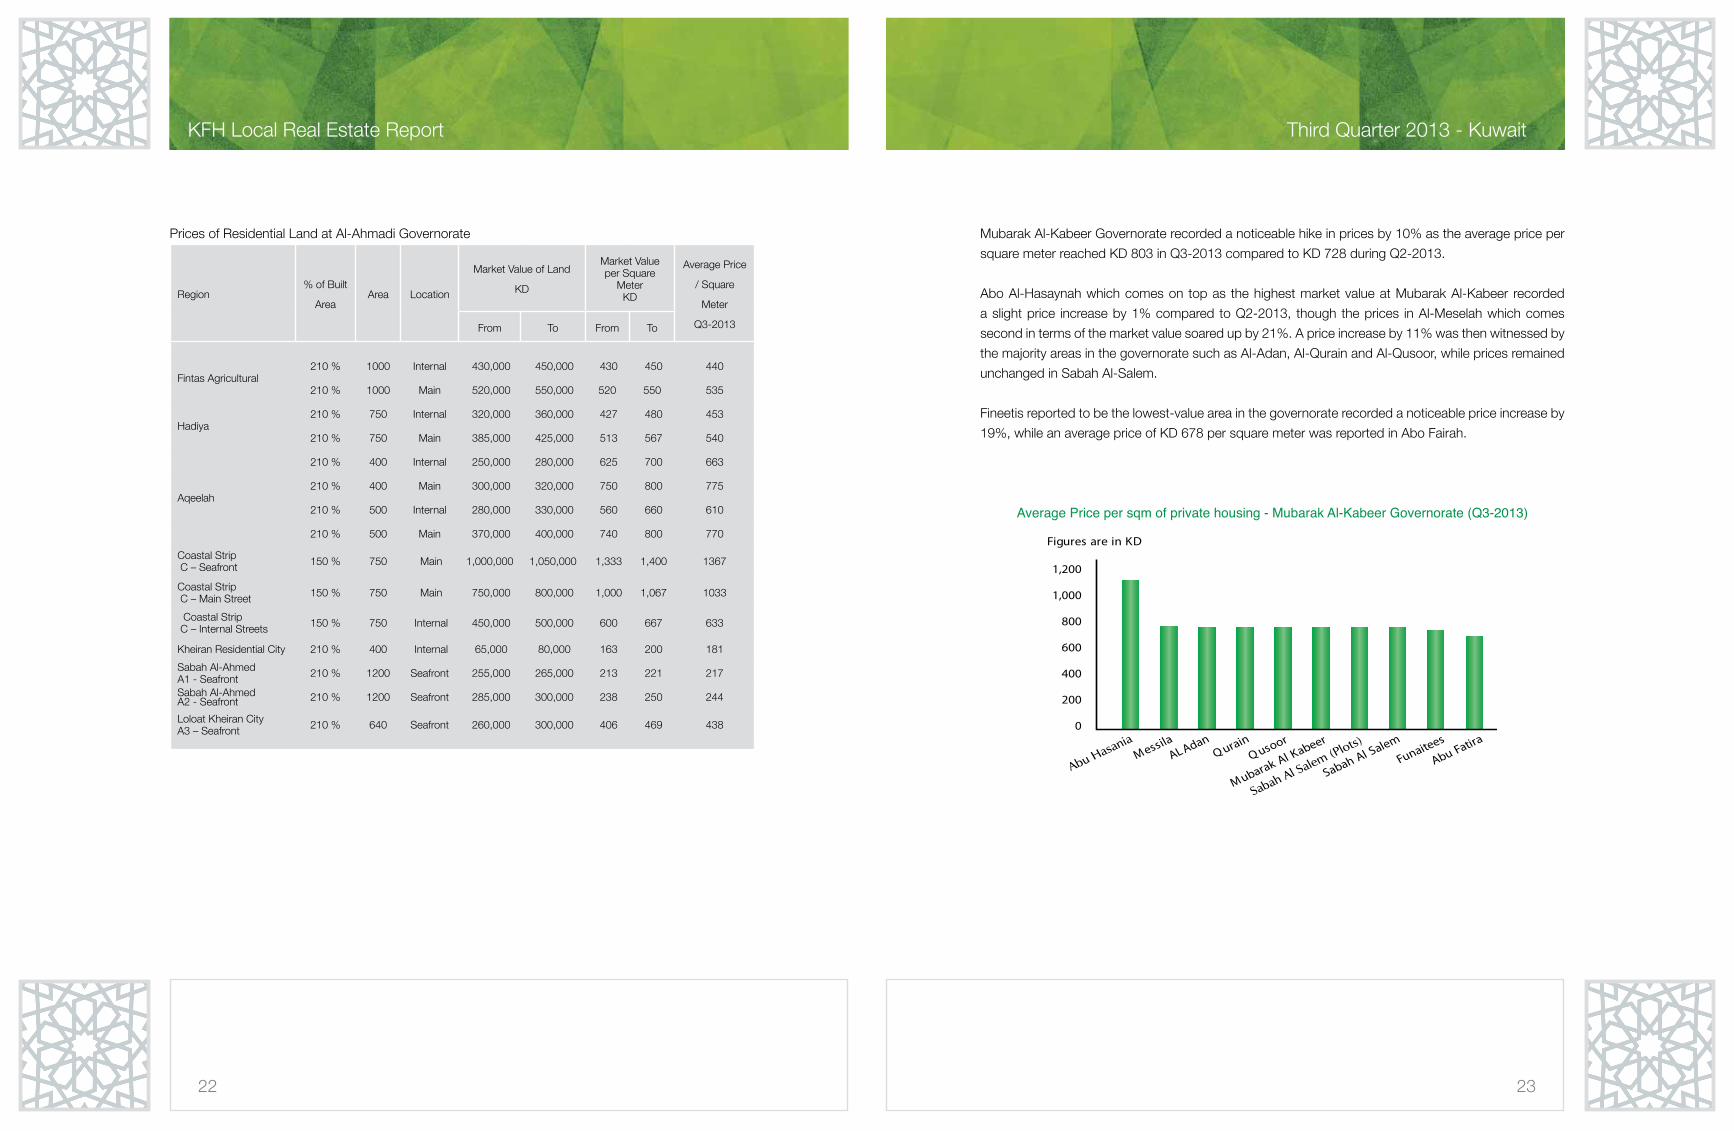
Mubarak Al-Kabeer Governorate recorded a noticeable hike in prices by 10% as the average price per
square meter reached KD 803 in Q3-2013 compared to KD 728 during Q2-2013.
Abo Al-Hasaynah which comes on top as the highest market value at Mubarak Al-Kabeer recorded
a slight price increase by 1% compared to Q2-2013, though the prices in Al-Meselah which comes
second in terms of the market value soared up by 21%. A price increase by 11% was then witnessed by
the majority areas in the governorate such as Al-Adan, Al-Qurain and Al-Qusoor, while prices remained
unchanged in Sabah Al-Salem.
Fineetis reported to be the lowest-value area in the governorate recorded a noticeable price increase by
19%, while an average price of KD 678 per square meter was reported in Abo Fairah.
Average Price per sqm of private housing - Mubarak Al-Kabeer Governorate (Q3-2013)
1,200
1,000
800
600
400
200
0
24
KFH Local Real Estate Report
25
Third Quarter 2013 - Kuwait
Prices of Residential Land at Mubarak Al-Kabeer Governorate
Region% of Built
AreaArea Location
Market Value of Land
KD
Market Value per
Square Meter
KD
Average Price
/ Square Meter
Q3-2013From To From To
Abo Al-Hasynah
150 % 750 Internal 560,000 680,000 700 850 775
150 % 750 800,000 880,000 1,000 1,100 1050
150 % 750 Seafront 1,600,000 1,700,000 1,600 1,700 1650
Average Price of the Region 986,667 1,086,667 1,100 1,217 1158
Al-Meseelah
210 % 400 Internal 270,000 330,000 675 825 750
210 % 400 Main 360,000 380,000 900 950 925
210 % 500 Internal 320,000 360,000 640 720 680
210 % 500 Main 400,000 430,000 800 860 830
Average Price of the Region 337,500 375,000 754 839 796
Abo Fatirah
Residential
210 % 400 Internal 235,000 275,000 588 688 638
210 % 400 Main 290,000 320,000 725 800 763
210 % 500 Internal 260,000 310,000 520 620 620
210 % 500 Main 330,000 360,000 660 720 690
Average Price of the Region 278,750 316,250 623 707 678
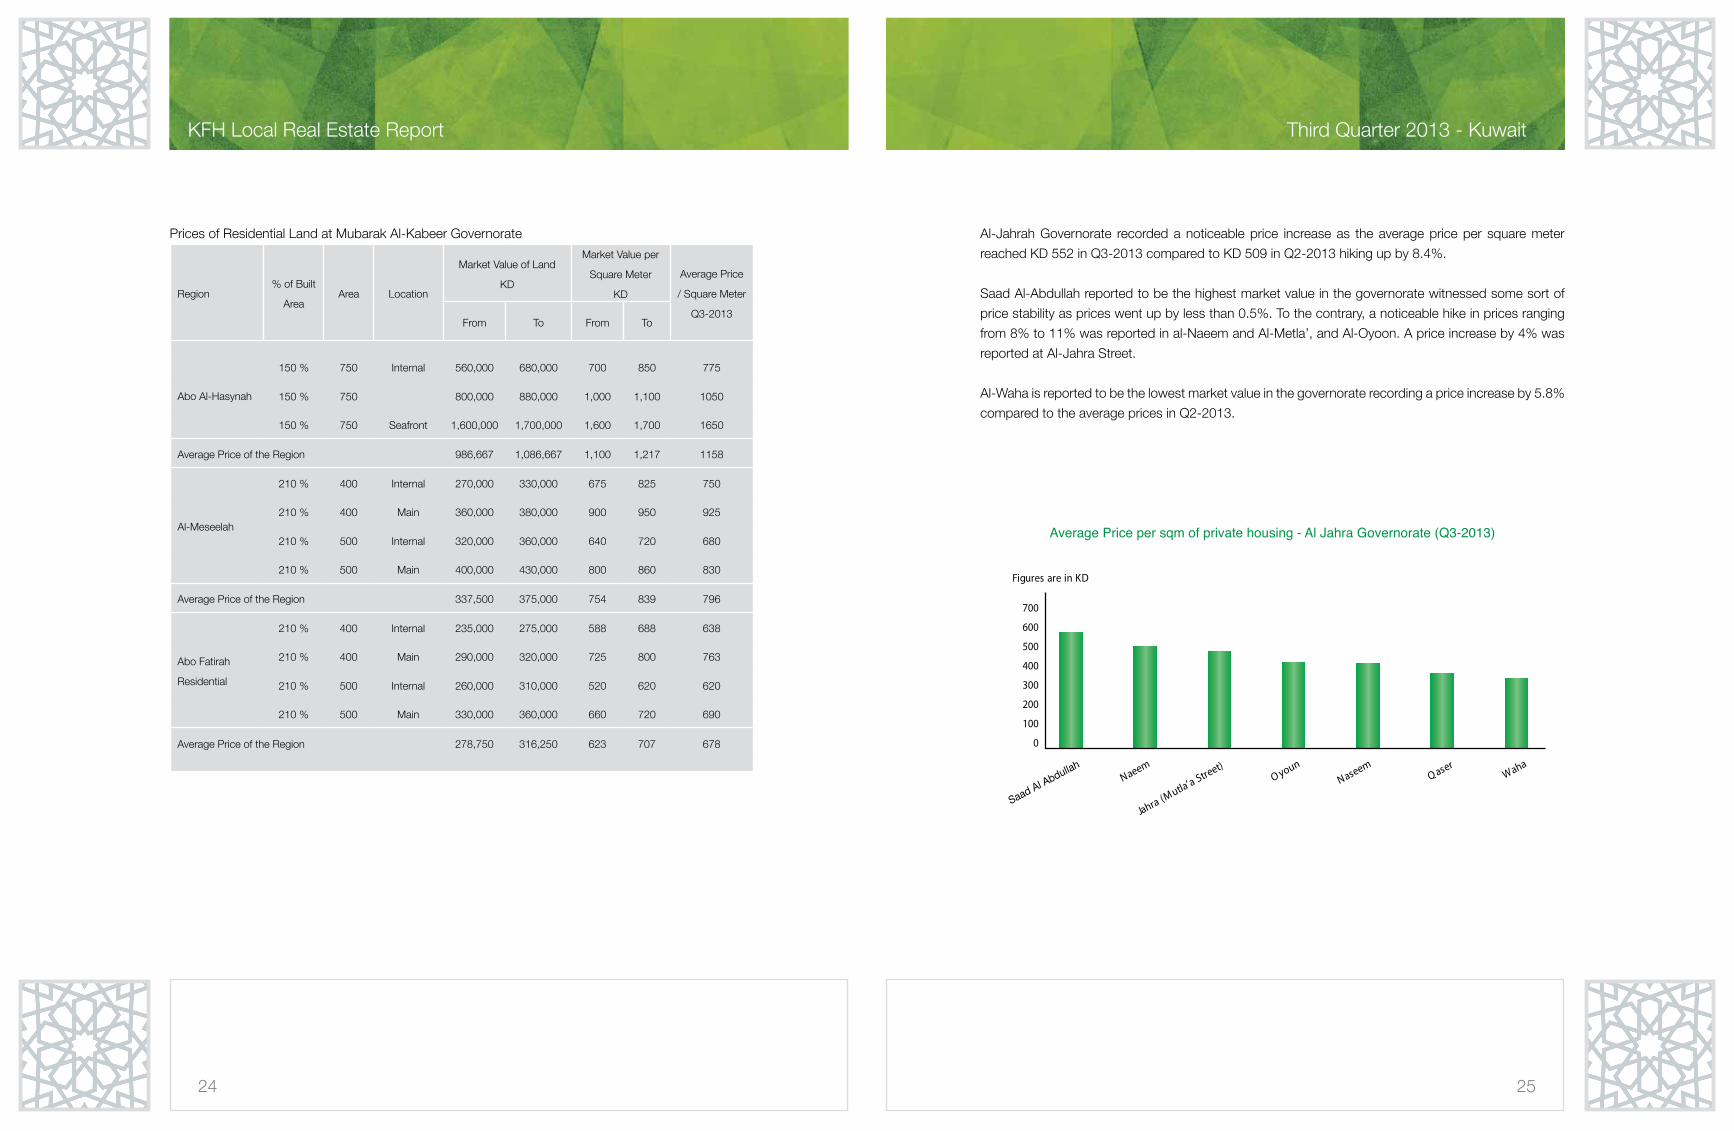
Al-Jahrah Governorate recorded a noticeable price increase as the average price per square meter
reached KD 552 in Q3-2013 compared to KD 509 in Q2-2013 hiking up by 8.4%.
Saad Al-Abdullah reported to be the highest market value in the governorate witnessed some sort of
price stability as prices went up by less than 0.5%. To the contrary, a noticeable hike in prices ranging
from 8% to 11% was reported in al-Naeem and Al-Metla’, and Al-Oyoon. A price increase by 4% was
reported at Al-Jahra Street.
Al-Waha is reported to be the lowest market value in the governorate recording a price increase by 5.8%
compared to the average prices in Q2-2013.
Average Price per sqm of private housing - Al Jahra Governorate (Q3-2013)
700
600
500
400
300
200
100
0
26
KFH Local Real Estate Report
27
Third Quarter 2013 - Kuwait
Prices of Residential Land at Al-Jahra Governorate
Region% of Built
AreaArea
Market Value of Land
KD
Market Value per
Square Meter
KDAverage Price /
Square Meter
Q3-2013From To From To
Al-Qasr 210 % 750 320,000 350,000 427 467 447
Al-Qasr Club Street 210 % 1000 500,000 550,000 500 550 525
Al-QasrExisting House 210 % 600 280,000 320,000 467 533 500
Al-JahraAl-Metla Street 210 % 400 270,000 300,000 540 600 570
Al-OyounGov. House 210 % 400 200,000 230,000 500 575 538
Al-Naeem Blocks 210 % 400 235,000 265,000 588 663 625
Al-NaeemGov. House 210 % 400 200,000 230,000 500 575 538
Al-WahaExisting House
Up to 800m2 300 125,000 150,000 417 500 458
Al-NaseemGov. House 210 % 400 200,000 230,000 500 575 538
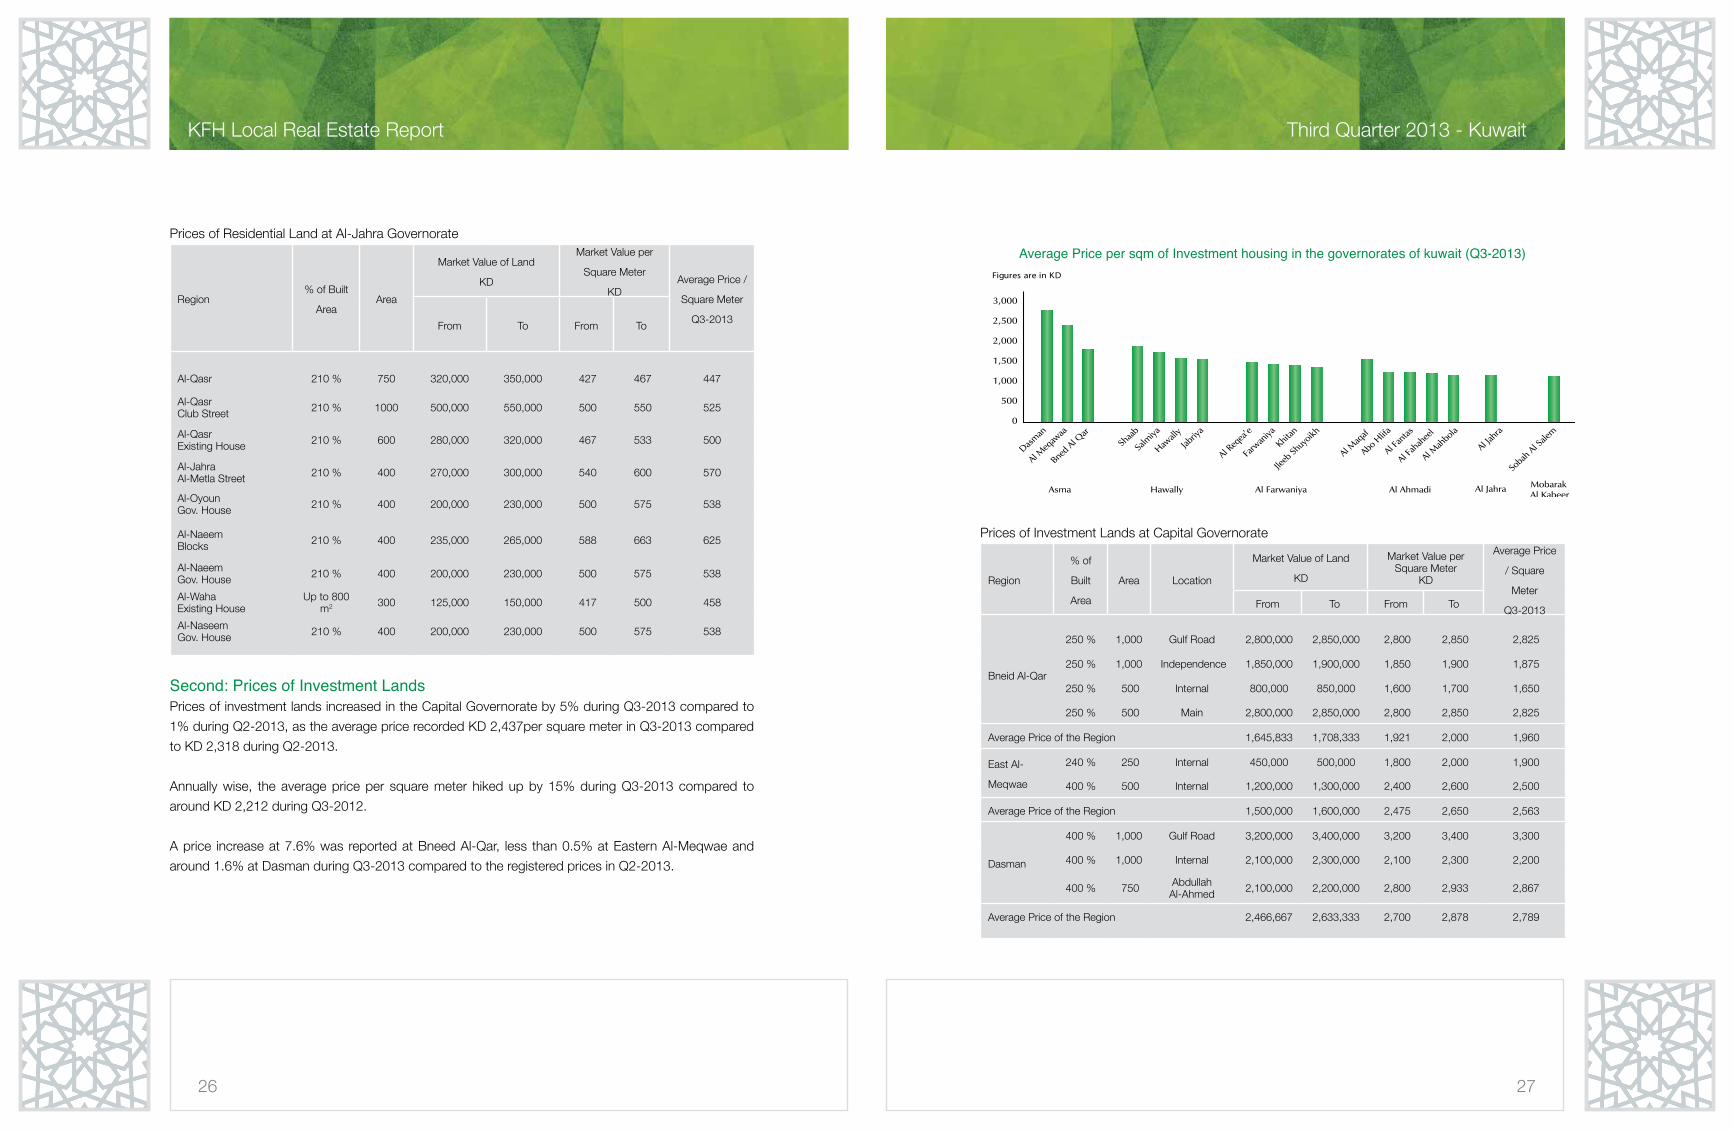
Second: Prices of Investment LandsPrices of investment lands increased in the Capital Governorate by 5% during Q3-2013 compared to
1% during Q2-2013, as the average price recorded KD 2,437per square meter in Q3-2013 compared
to KD 2,318 during Q2-2013.
Annually wise, the average price per square meter hiked up by 15% during Q3-2013 compared to
around KD 2,212 during Q3-2012.
A price increase at 7.6% was reported at Bneed Al-Qar, less than 0.5% at Eastern Al-Meqwae and
around 1.6% at Dasman during Q3-2013 compared to the registered prices in Q2-2013.
Average Price per sqm of Investment housing in the governorates of kuwait (Q3-2013)
Prices of Investment Lands at Capital Governorate
Region
% of
Built
Area
Area Location
Market Value of Land
KD
Market Value per Square Meter
KD
Average Price
/ Square
Meter
Q3-2013From To From To
Bneid Al-Qar
250 % 1,000 Gulf Road 2,800,000 2,850,000 2,800 2,850 2,825
250 % 1,000 Independence 1,850,000 1,900,000 1,850 1,900 1,875
250 % 500 Internal 800,000 850,000 1,600 1,700 1,650
250 % 500 Main 2,800,000 2,850,000 2,800 2,850 2,825
Average Price of the Region 1,645,833 1,708,333 1,921 2,000 1,960
East Al-
Meqwae
240 % 250 Internal 450,000 500,000 1,800 2,000 1,900
400 % 500 Internal 1,200,000 1,300,000 2,400 2,600 2,500
Average Price of the Region 1,500,000 1,600,000 2,475 2,650 2,563
Dasman
400 % 1,000 Gulf Road 3,200,000 3,400,000 3,200 3,400 3,300
400 % 1,000 Internal 2,100,000 2,300,000 2,100 2,300 2,200
400 % 750 Abdullah Al-Ahmed 2,100,000 2,200,000 2,800 2,933 2,867
Average Price of the Region 2,466,667 2,633,333 2,700 2,878 2,789
28
KFH Local Real Estate Report
29
Third Quarter 2013 - Kuwait
Al-Farwanyyah Governorate recorded KD 1,492 for the average square meter during Q3-2013
compared to KD 1,426 in Q2-2013, as the Governorate registered a price increase by 5% during Q3-
2013 compared to 4% during Q2-2013.
A price increase by 3% was reported at Farwaneyyah City, 6% at Kheitan, and 2% at Al-Reqei. The
highest price increase was reported at Jleeb Al-Shoyoukh which hit 7% compared to the average price
per square meter during Q2-2013.
Prices of Investment Lands at Farwaneyyah Governorate
Region
% of
Built
Area
Area Location
Market Value of Land
KD
Market Value per Square Meter
KD
Average Price / Square Meter
Q3-2013From To From To
Farwaneyyah
250 % 1,000 Airport 1,580,000 1,625,000 1,580 1,625 1,603
250 % 1,000 6th Ring Road 1,550,000 1,580,000 1,550 1,580 1,565
250 % 1,000 Main 1,500,000 1,550,000 1,500 1,550 1,525
250 % 1,000 Internal 1,375,000 1,425,000 1,375 1,425 1,400
Average Price of the Region 1,288,333 1,334,167 1,459 1,516 1,488
Kheitan
250 % 750 Airport 1,220,000 1,275,000 1,627 1,700 1,663
250 % 750 Main 1,175,000 1,250,000 1,567 1,667 1,617
250 % 750 Internal 1,000,000 1,050,000 1,333 1,400 1,367
Average Price of the Region 974,000 1,030,000 1,442 1,527 1,484
Jleeb Al-
Shoyoukh
250 % 750 6th Ring Road 1,150,000 1,200,000 1,533 1,600 1,567
250 % 750 Police Station Str. 1,175,000 1,225,000 1,567 1,633 1,600
Average Price of the Region 983,571 1,046,429 1,441 1,533 1,487
Al-Reqei 250 % 750 4th Ring Road 1,200,000 1,250,000 1,600 1,667 1,633
250 % 750 5th Ring Road 1,175,000 1,200,000 1,567 1,600 1,583
Average Price of the Region 1,166,667 1,212,500 1,476 1,538 1,507
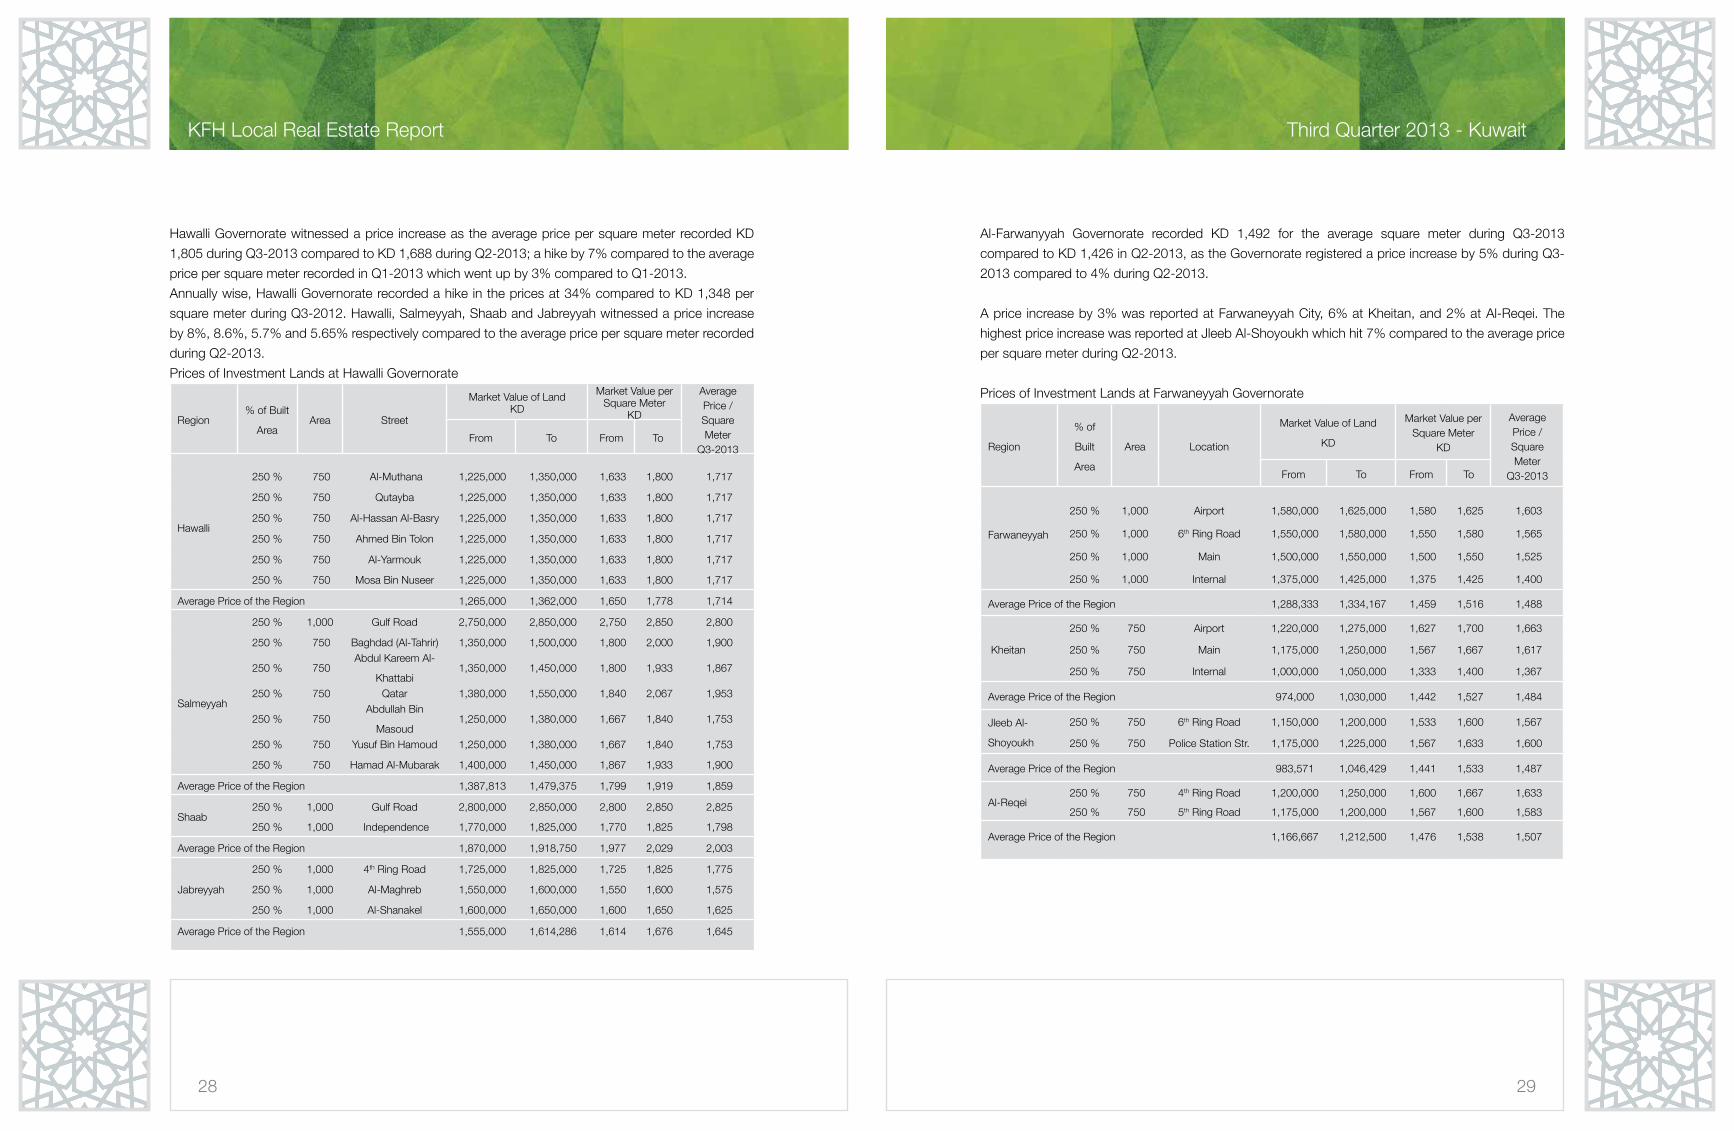
Hawalli Governorate witnessed a price increase as the average price per square meter recorded KD
1,805 during Q3-2013 compared to KD 1,688 during Q2-2013; a hike by 7% compared to the average
price per square meter recorded in Q1-2013 which went up by 3% compared to Q1-2013.
Annually wise, Hawalli Governorate recorded a hike in the prices at 34% compared to KD 1,348 per
square meter during Q3-2012. Hawalli, Salmeyyah, Shaab and Jabreyyah witnessed a price increase
by 8%, 8.6%, 5.7% and 5.65% respectively compared to the average price per square meter recorded
during Q2-2013.
Prices of Investment Lands at Hawalli Governorate
Region% of Built
AreaArea Street
Market Value of LandKD
Market Value per Square Meter
KD
Average Price / Square Meter
Q3-2013From To From To
Hawalli
250 % 750 Al-Muthana 1,225,000 1,350,000 1,633 1,800 1,717
250 % 750 Qutayba 1,225,000 1,350,000 1,633 1,800 1,717
250 % 750 Al-Hassan Al-Basry 1,225,000 1,350,000 1,633 1,800 1,717
250 % 750 Ahmed Bin Tolon 1,225,000 1,350,000 1,633 1,800 1,717
250 % 750 Al-Yarmouk 1,225,000 1,350,000 1,633 1,800 1,717
250 % 750 Mosa Bin Nuseer 1,225,000 1,350,000 1,633 1,800 1,717
Average Price of the Region 1,265,000 1,362,000 1,650 1,778 1,714
Salmeyyah
250 % 1,000 Gulf Road 2,750,000 2,850,000 2,750 2,850 2,800
250 % 750 Baghdad (Al-Tahrir) 1,350,000 1,500,000 1,800 2,000 1,900
250 % 750 Abdul Kareem Al-
Khattabi 1,350,000 1,450,000 1,800 1,933 1,867
250 % 750 Qatar 1,380,000 1,550,000 1,840 2,067 1,953
250 % 750 Abdullah Bin
Masoud 1,250,000 1,380,000 1,667 1,840 1,753
250 % 750 Yusuf Bin Hamoud 1,250,000 1,380,000 1,667 1,840 1,753
250 % 750 Hamad Al-Mubarak 1,400,000 1,450,000 1,867 1,933 1,900
Average Price of the Region 1,387,813 1,479,375 1,799 1,919 1,859
Shaab 250 % 1,000 Gulf Road 2,800,000 2,850,000 2,800 2,850 2,825
250 % 1,000 Independence 1,770,000 1,825,000 1,770 1,825 1,798
Average Price of the Region 1,870,000 1,918,750 1,977 2,029 2,003
Jabreyyah
250 % 1,000 4th Ring Road 1,725,000 1,825,000 1,725 1,825 1,775
250 % 1,000 Al-Maghreb 1,550,000 1,600,000 1,550 1,600 1,575
250 % 1,000 Al-Shanakel 1,600,000 1,650,000 1,600 1,650 1,625
Average Price of the Region 1,555,000 1,614,286 1,614 1,676 1,645

30
KFH Local Real Estate Report
31
Third Quarter 2013 - Kuwait
Al-Ahmadi Governorate recorded a price increase by 4% in Q3-2013 compared to 12% in Q2-2013, as
the average price per square meter recorded KD 1,345 in Q3-2013 compared to KD 1,296 in Q2-2013.
Annually wise, the Governorate recorded a price increase at 31% compared to an average price of KD
1,027 per square meter in Q3-2012.
Prices of Investment Lands at Al-Ahmadi Governorate
Region
% of
Built
Area
Area Location
Market Value of Land
KD
Market Value per Square Meter
KD
Price / Square Meter
Q3-2013From To From To
Fintas
250 % 500 Main 920,000 1,000,000 1,227 1,333 1,280
250 % 750 Fahaheel 975,000 1,000,000 1,300 1,333 1,317
250 % 1,000 Coastal Strip 1,600,000 1,700,000 1,600 1,700 1,650
Average Price of the Region 966,000 1,050,000 1,255 1,373 1,314
Abo Helifa250% 750 Internal 800,000 900,000 1,067 1,200 1,133
250% 750 Main 975,000 1,000,000 1,300 1,333 1,317
Average Price of the Region 981,250 1,062,500 1,267 1,383 1,325
Al-Manqaf 250% 750 Internal 800,000 900,000 1,067 1,200 1,133
250% 750 Water Station Street 985,000 1,025,000 1,313 1,367 1,340
Average Price of the Region 1,177,000 1,265,000 1,536 1,660 1,598
Mahboulah 250 % 500 Internal 725,000 775,000 967 1,033 1,000
250 % 750 Main 835,000 900,000 1,113 1,200 1,157
Average Price of the Region 917,000 978,000 1,186 1,267 1,227
Fahaheel
250 % 500 Internal 770,000 865,000 1,027 1,153 1,090
250 % 750 Main 925,000 975,000 1,233 1,300 1,267
250 % 1,000 Mecca 1,350,000 1,400,000 1,350 1,400 1,375
250 % 750 Al-Badwyah 925,000 975,000 1,233 1,300 1,267
Average Price of the Region 865,833 927,500 1,216 1,309 1,262
Al-Jahra Governorate recorded an average price increase by 3% in Q3-2013 as the average price hit
KD 1,204 compared to the same percentage reported during Q2-2013 when the average square meter
recorded KD 1,167.
Prices of Investment Lands at Al-Jahrah Governorate
Region
% of
Built
Area
Area Location
Market Value of Land
KD
Market Value per Square Meter
KDAverage Price
/ Square Meter
Q3-2013From To From To
Al-Jahrah
250 % 1,000 Internal 1,000,000 1,150,000 1,000 1,150 1,075
250 % 1,000 Main 1,200,000 1,250,000 1,200 1,250 1,225
250 % 800 Al-Khazami 1,150,000 1,200,000 1,438 1,500 1,469
250 % 500 Internal 500,000 550,000 1,000 1,100 1,050
250 % 500 Main 575,000 625,000 1,150 1,250 1,200
Average Price of the Region 885,000 955,000 1,158 1,250 1,204
Mubarak Al-Kabeer Governorate recorded a price increase in almost all places in the Governorate by
3% as the price per square meter reached KD 1,189 during Q3-2013 compared to a price increase by
9% and KD 1,156 in Q2-2013.
Prices of Investment Lands at Mubarak Al-Kabeer Governorate
Region
% of
Built
Area
Area Location
Market Value of Land
KD
Market Value per Square Meter
KDAverage Price / Square Meter
Q3-2013From To From To
Sabah Al-
Salem
250 % 750 Internal 825,000 950,000 1,100 1,266.7 1,183.4
250 % 750 Main 950,000 1,100,000 1,267 1,466 1,366.5
250 % 1,000 Internal 1,050,000 1,300,000 1,050 1,300 1,175
250 % 1,000 Main 1,250,000 1,400,000 1,250 1,400 1,325
250 % 1,000 Fahaheel 1,350,000 1,400,000 1,350 1,500 1,425
Average Price of the Region 1,085,000 1,230,000 1,203.4 1,378.6 1,295
32
KFH Local Real Estate Report
33
Third Quarter 2013 - Kuwait
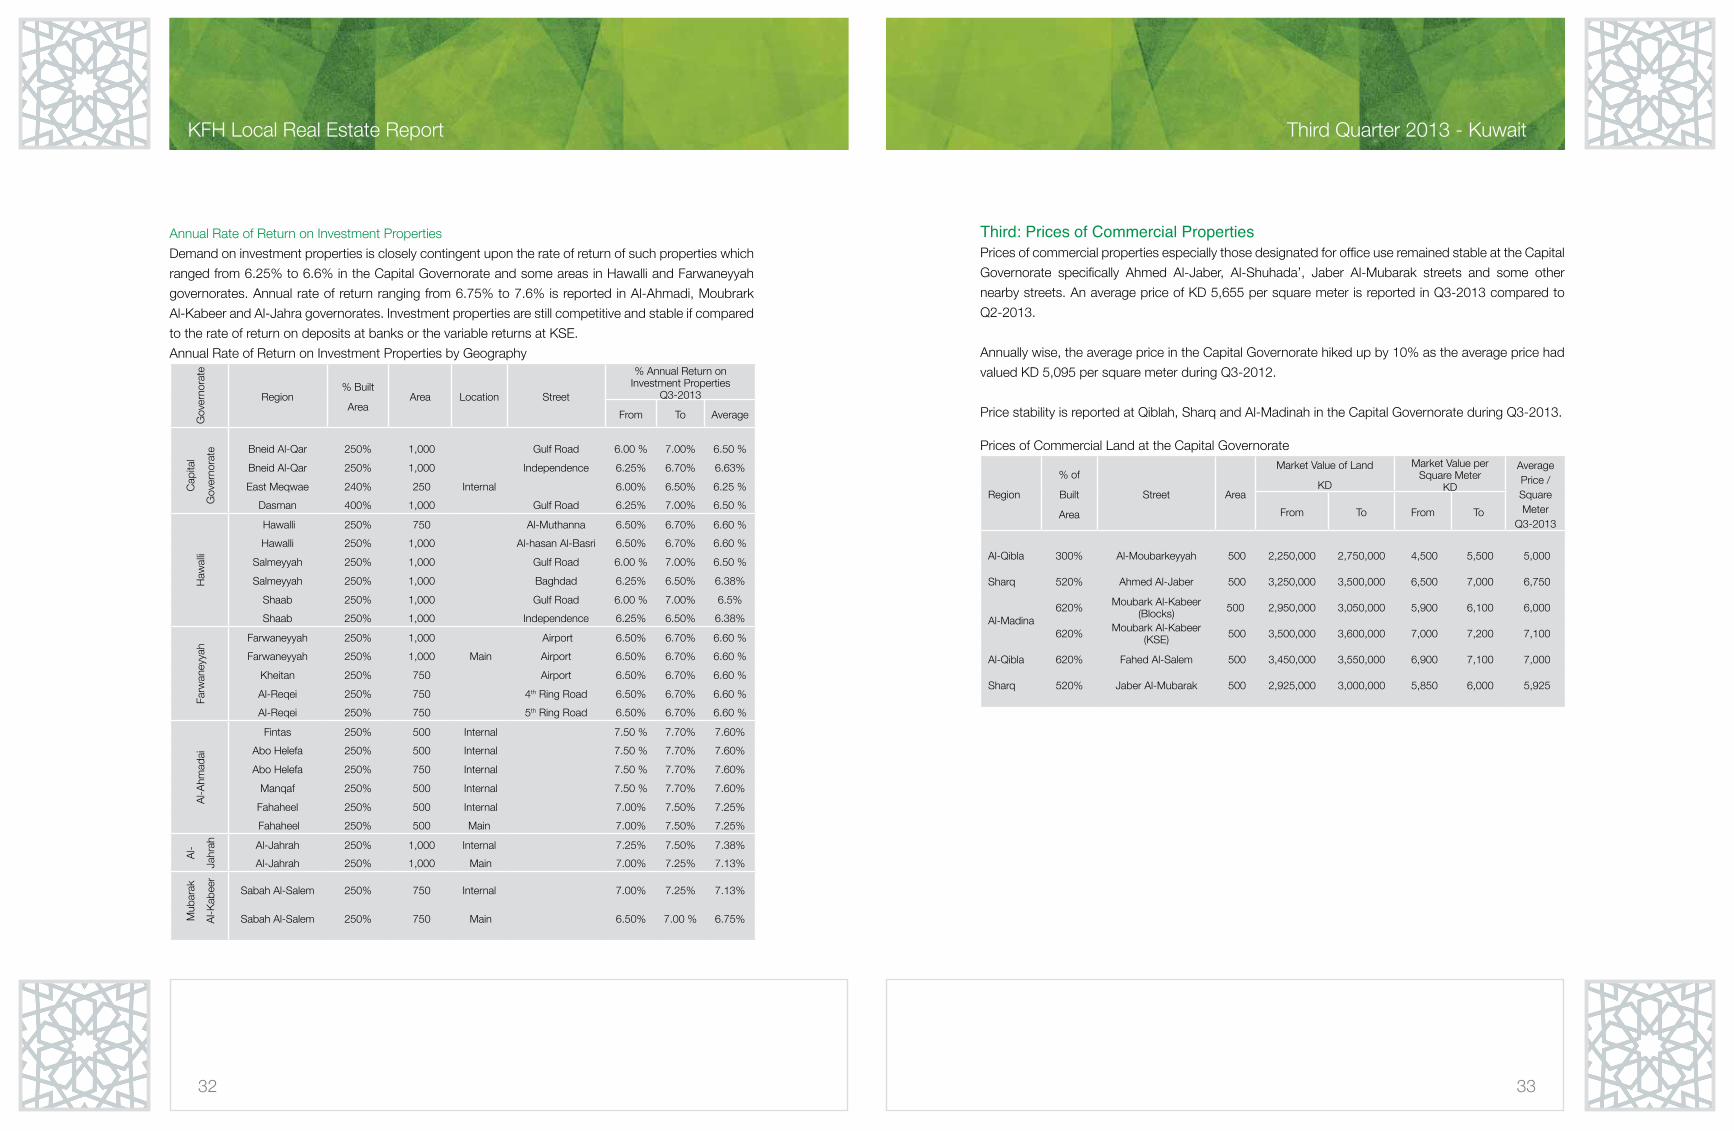
Annual Rate of Return on Investment Properties
Demand on investment properties is closely contingent upon the rate of return of such properties which
ranged from 6.25% to 6.6% in the Capital Governorate and some areas in Hawalli and Farwaneyyah
governorates. Annual rate of return ranging from 6.75% to 7.6% is reported in Al-Ahmadi, Moubrark
Al-Kabeer and Al-Jahra governorates. Investment properties are still competitive and stable if compared
to the rate of return on deposits at banks or the variable returns at KSE.
Annual Rate of Return on Investment Properties by Geography
Gov
erno
rate
Region % Built
AreaArea Location Street
% Annual Return on Investment Properties
Q3-2013
From To Average
Cap
ital
Gov
erno
rate Bneid Al-Qar 250% 1,000 Gulf Road 6.00 % 7.00% 6.50 %
Bneid Al-Qar 250% 1,000 Independence 6.25% 6.70% 6.63%
East Meqwae 240% 250 Internal 6.00% 6.50% 6.25 %
Dasman 400% 1,000 Gulf Road 6.25% 7.00% 6.50 %
Haw
alli
Hawalli 250% 750 Al-Muthanna 6.50% 6.70% 6.60 %
Hawalli 250% 1,000 Al-hasan Al-Basri 6.50% 6.70% 6.60 %
Salmeyyah 250% 1,000 Gulf Road 6.00 % 7.00% 6.50 %
Salmeyyah 250% 1,000 Baghdad 6.25% 6.50% 6.38%
Shaab 250% 1,000 Gulf Road 6.00 % 7.00% 6.5%
Shaab 250% 1,000 Independence 6.25% 6.50% 6.38%
Farw
aney
yah
Farwaneyyah 250% 1,000 Airport 6.50% 6.70% 6.60 %
Farwaneyyah 250% 1,000 Main Airport 6.50% 6.70% 6.60 %
Kheitan 250% 750 Airport 6.50% 6.70% 6.60 %
Al-Reqei 250% 750 4th Ring Road 6.50% 6.70% 6.60 %
Al-Reqei 250% 750 5th Ring Road 6.50% 6.70% 6.60 %
Al-A
hmad
ai
Fintas 250% 500 Internal 7.50 % 7.70% 7.60%
Abo Helefa 250% 500 Internal 7.50 % 7.70% 7.60%
Abo Helefa 250% 750 Internal 7.50 % 7.70% 7.60%
Manqaf 250% 500 Internal 7.50 % 7.70% 7.60%
Fahaheel 250% 500 Internal 7.00% 7.50% 7.25%
Fahaheel 250% 500 Main 7.00% 7.50% 7.25%
Al-
Jahr
ah Al-Jahrah 250% 1,000 Internal 7.25% 7.50% 7.38%
Al-Jahrah 250% 1,000 Main 7.00% 7.25% 7.13%
Mub
arak
Al-K
abee
r
Sabah Al-Salem 250% 750 Internal 7.00% 7.25% 7.13%
Sabah Al-Salem 250% 750 Main 6.50% 7.00 % 6.75%
Third: Prices of Commercial PropertiesPrices of commercial properties especially those designated for office use remained stable at the Capital
Governorate specifically Ahmed Al-Jaber, Al-Shuhada’, Jaber Al-Mubarak streets and some other
nearby streets. An average price of KD 5,655 per square meter is reported in Q3-2013 compared to
Q2-2013.
Annually wise, the average price in the Capital Governorate hiked up by 10% as the average price had
valued KD 5,095 per square meter during Q3-2012.
Price stability is reported at Qiblah, Sharq and Al-Madinah in the Capital Governorate during Q3-2013.
Prices of Commercial Land at the Capital Governorate
Region
% of
Built
Area
Street Area
Market Value of Land
KD
Market Value per Square Meter
KD
Average Price / Square Meter
Q3-2013From To From To
Al-Qibla 300% Al-Moubarkeyyah 500 2,250,000 2,750,000 4,500 5,500 5,000
Sharq 520% Ahmed Al-Jaber 500 3,250,000 3,500,000 6,500 7,000 6,750
Al-Madina620% Moubark Al-Kabeer
(Blocks) 500 2,950,000 3,050,000 5,900 6,100 6,000
620% Moubark Al-Kabeer (KSE) 500 3,500,000 3,600,000 7,000 7,200 7,100
Al-Qibla 620% Fahed Al-Salem 500 3,450,000 3,550,000 6,900 7,100 7,000
Sharq 520% Jaber Al-Mubarak 500 2,925,000 3,000,000 5,850 6,000 5,925
34
KFH Local Real Estate Report
35
Third Quarter 2013 - Kuwait
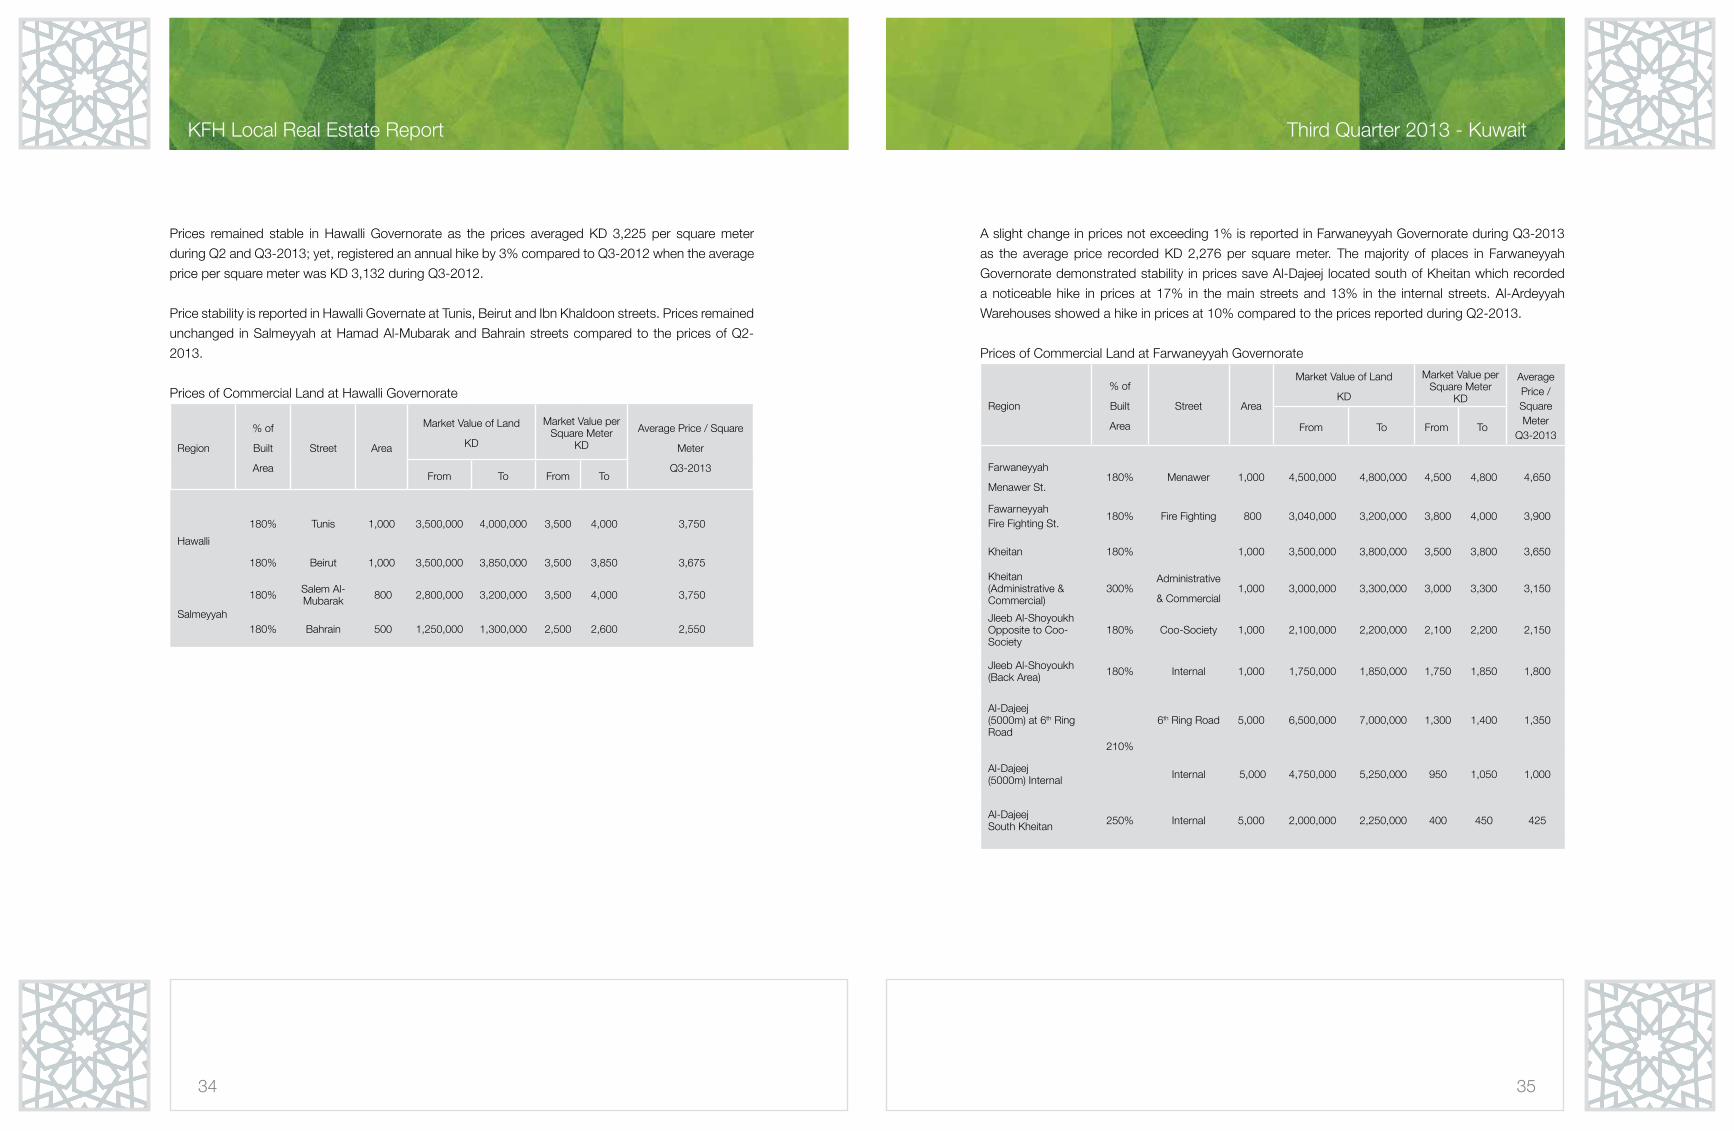
Prices remained stable in Hawalli Governorate as the prices averaged KD 3,225 per square meter
during Q2 and Q3-2013; yet, registered an annual hike by 3% compared to Q3-2012 when the average
price per square meter was KD 3,132 during Q3-2012.
Price stability is reported in Hawalli Governate at Tunis, Beirut and Ibn Khaldoon streets. Prices remained
unchanged in Salmeyyah at Hamad Al-Mubarak and Bahrain streets compared to the prices of Q2-
2013.
Prices of Commercial Land at Hawalli Governorate
Region
% of
Built
Area
Street Area
Market Value of Land
KD
Market Value per Square Meter
KD
Average Price / Square
Meter
Q3-2013From To From To
Hawalli
180% Tunis 1,000 3,500,000 4,000,000 3,500 4,000 3,750
180% Beirut 1,000 3,500,000 3,850,000 3,500 3,850 3,675
Salmeyyah
180% Salem Al-Mubarak 800 2,800,000 3,200,000 3,500 4,000 3,750
180% Bahrain 500 1,250,000 1,300,000 2,500 2,600 2,550
A slight change in prices not exceeding 1% is reported in Farwaneyyah Governorate during Q3-2013
as the average price recorded KD 2,276 per square meter. The majority of places in Farwaneyyah
Governorate demonstrated stability in prices save Al-Dajeej located south of Kheitan which recorded
a noticeable hike in prices at 17% in the main streets and 13% in the internal streets. Al-Ardeyyah
Warehouses showed a hike in prices at 10% compared to the prices reported during Q2-2013.
Prices of Commercial Land at Farwaneyyah Governorate
Region
% of
Built
Area
Street Area
Market Value of Land
KD
Market Value per Square Meter
KD
Average Price / Square Meter
Q3-2013From To From To
Farwaneyyah
Menawer St.180% Menawer 1,000 4,500,000 4,800,000 4,500 4,800 4,650
FawarneyyahFire Fighting St.
180% Fire Fighting 800 3,040,000 3,200,000 3,800 4,000 3,900
Kheitan 180% 1,000 3,500,000 3,800,000 3,500 3,800 3,650
Kheitan (Administrative & Commercial)
300%Administrative
& Commercial1,000 3,000,000 3,300,000 3,000 3,300 3,150
Jleeb Al-Shoyoukh Opposite to Coo-Society
180% Coo-Society 1,000 2,100,000 2,200,000 2,100 2,200 2,150
Jleeb Al-Shoyoukh (Back Area) 180% Internal 1,000 1,750,000 1,850,000 1,750 1,850 1,800
Al-Dajeej(5000m) at 6th Ring Road
210%
6th Ring Road 5,000 6,500,000 7,000,000 1,300 1,400 1,350
Al-Dajeej(5000m) Internal Internal 5,000 4,750,000 5,250,000 950 1,050 1,000
Al-DajeejSouth Kheitan 250% Internal 5,000 2,000,000 2,250,000 400 450 425
36
KFH Local Real Estate Report
37
Third Quarter 2013 - Kuwait
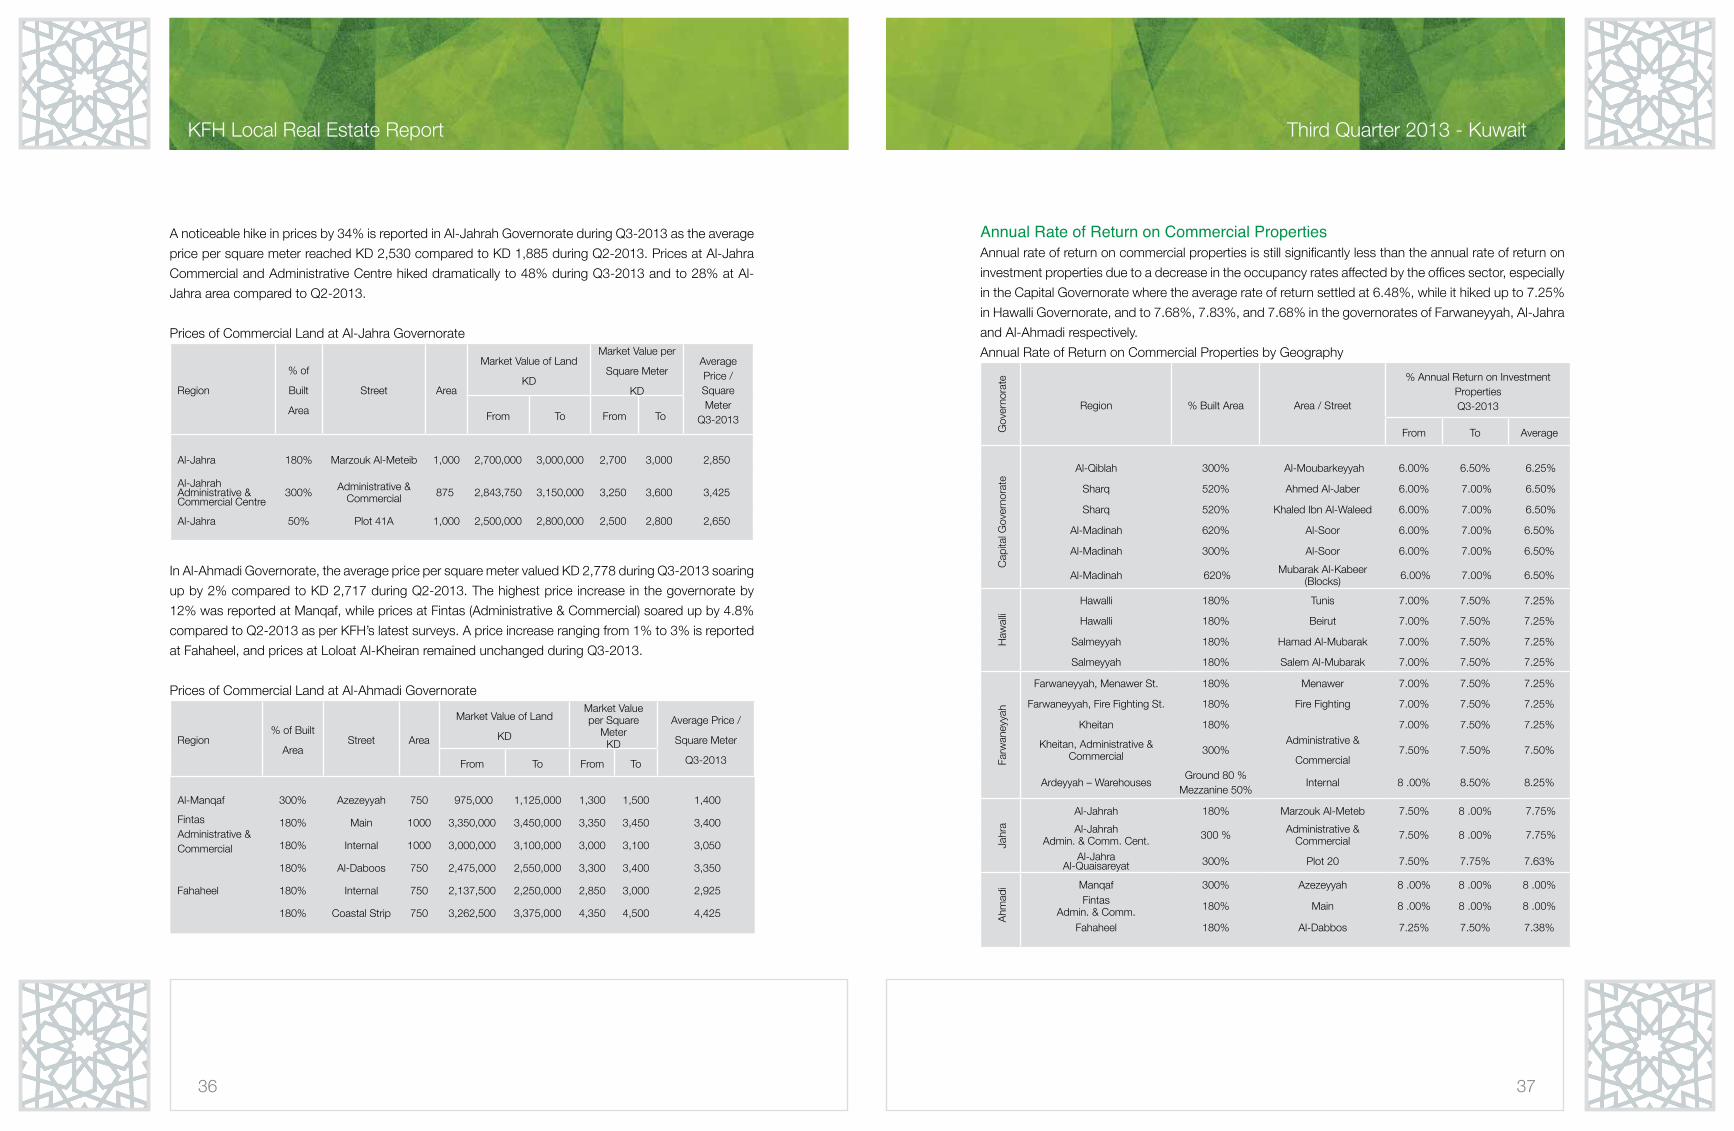
A noticeable hike in prices by 34% is reported in Al-Jahrah Governorate during Q3-2013 as the average
price per square meter reached KD 2,530 compared to KD 1,885 during Q2-2013. Prices at Al-Jahra
Commercial and Administrative Centre hiked dramatically to 48% during Q3-2013 and to 28% at Al-
Jahra area compared to Q2-2013.
Prices of Commercial Land at Al-Jahra Governorate
Region
% of
Built
Area
Street Area
Market Value of Land
KD
Market Value per
Square Meter
KD
Average Price / Square Meter
Q3-2013From To From To
Al-Jahra 180% Marzouk Al-Meteib 1,000 2,700,000 3,000,000 2,700 3,000 2,850
Al-JahrahAdministrative & Commercial Centre
300% Administrative & Commercial 875 2,843,750 3,150,000 3,250 3,600 3,425
Al-Jahra 50% Plot 41A 1,000 2,500,000 2,800,000 2,500 2,800 2,650
In Al-Ahmadi Governorate, the average price per square meter valued KD 2,778 during Q3-2013 soaring
up by 2% compared to KD 2,717 during Q2-2013. The highest price increase in the governorate by
12% was reported at Manqaf, while prices at Fintas (Administrative & Commercial) soared up by 4.8%
compared to Q2-2013 as per KFH’s latest surveys. A price increase ranging from 1% to 3% is reported
at Fahaheel, and prices at Loloat Al-Kheiran remained unchanged during Q3-2013.
Prices of Commercial Land at Al-Ahmadi Governorate
Region% of Built
AreaStreet Area
Market Value of Land
KD
Market Value per Square
MeterKD
Average Price /
Square Meter
Q3-2013From To From To
Al-Manqaf 300% Azezeyyah 750 975,000 1,125,000 1,300 1,500 1,400
Fintas Administrative & Commercial
180% Main 1000 3,350,000 3,450,000 3,350 3,450 3,400
180% Internal 1000 3,000,000 3,100,000 3,000 3,100 3,050
Fahaheel
180% Al-Daboos 750 2,475,000 2,550,000 3,300 3,400 3,350
180% Internal 750 2,137,500 2,250,000 2,850 3,000 2,925
180% Coastal Strip 750 3,262,500 3,375,000 4,350 4,500 4,425
Annual Rate of Return on Commercial Properties Annual rate of return on commercial properties is still significantly less than the annual rate of return on
investment properties due to a decrease in the occupancy rates affected by the offices sector, especially
in the Capital Governorate where the average rate of return settled at 6.48%, while it hiked up to 7.25%
in Hawalli Governorate, and to 7.68%, 7.83%, and 7.68% in the governorates of Farwaneyyah, Al-Jahra
and Al-Ahmadi respectively.
Annual Rate of Return on Commercial Properties by Geography
Gov
erno
rate
Region % Built Area Area / Street
% Annual Return on Investment PropertiesQ3-2013
From To Average
Cap
ital G
over
nora
te
Al-Qiblah 300% Al-Moubarkeyyah 6.00% 6.50% 6.25%
Sharq 520% Ahmed Al-Jaber 6.00% 7.00% 6.50%
Sharq 520% Khaled Ibn Al-Waleed 6.00% 7.00% 6.50%
Al-Madinah 620% Al-Soor 6.00% 7.00% 6.50%
Al-Madinah 300% Al-Soor 6.00% 7.00% 6.50%
Al-Madinah 620% Mubarak Al-Kabeer (Blocks) 6.00% 7.00% 6.50%
Haw
alli
Hawalli 180% Tunis 7.00% 7.50% 7.25%
Hawalli 180% Beirut 7.00% 7.50% 7.25%
Salmeyyah 180% Hamad Al-Mubarak 7.00% 7.50% 7.25%
Salmeyyah 180% Salem Al-Mubarak 7.00% 7.50% 7.25%
Farw
aney
yah
Farwaneyyah, Menawer St. 180% Menawer 7.00% 7.50% 7.25%
Farwaneyyah, Fire Fighting St. 180% Fire Fighting 7.00% 7.50% 7.25%
Kheitan 180% 7.00% 7.50% 7.25%
Kheitan, Administrative & Commercial 300%
Administrative &
Commercial7.50% 7.50% 7.50%
Ardeyyah – WarehousesGround 80 %
Mezzanine 50%Internal 8 .00% 8.50% 8.25%
Jahr
a
Al-Jahrah 180% Marzouk Al-Meteb 7.50% 8 .00% 7.75%
Al-JahrahAdmin. & Comm. Cent. 300 % Administrative &
Commercial 7.50% 8 .00% 7.75%
Al-JahraAl-Quaisareyat 300% Plot 20 7.50% 7.75% 7.63%
Ahm
adi Manqaf 300% Azezeyyah 8 .00% 8 .00% 8 .00%
FintasAdmin. & Comm. 180% Main 8 .00% 8 .00% 8 .00%
Fahaheel 180% Al-Dabbos 7.25% 7.50% 7.38%
38
KFH Local Real Estate Report
39
Third Quarter 2013 - Kuwait
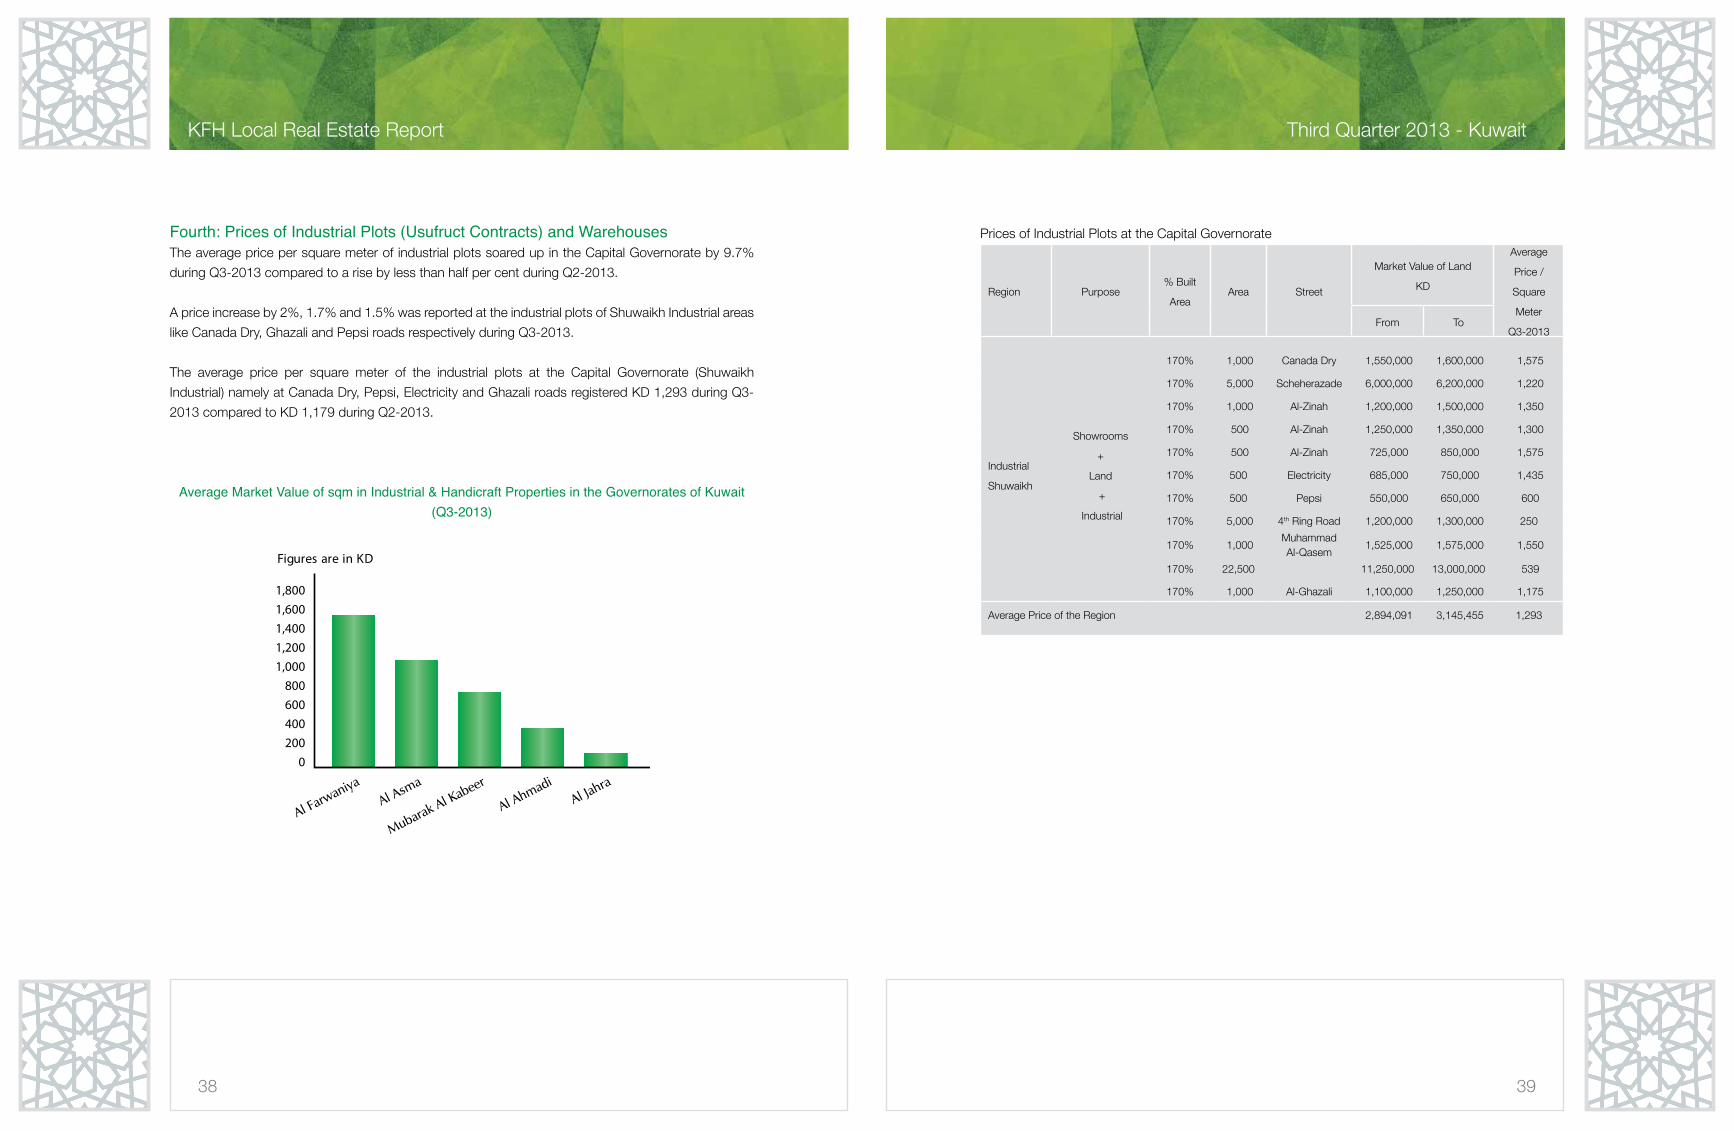
Fourth: Prices of Industrial Plots (Usufruct Contracts) and Warehouses The average price per square meter of industrial plots soared up in the Capital Governorate by 9.7%
during Q3-2013 compared to a rise by less than half per cent during Q2-2013.
A price increase by 2%, 1.7% and 1.5% was reported at the industrial plots of Shuwaikh Industrial areas
like Canada Dry, Ghazali and Pepsi roads respectively during Q3-2013.
The average price per square meter of the industrial plots at the Capital Governorate (Shuwaikh
Industrial) namely at Canada Dry, Pepsi, Electricity and Ghazali roads registered KD 1,293 during Q3-
2013 compared to KD 1,179 during Q2-2013.
Average Market Value of sqm in Industrial & Handicraft Properties in the Governorates of Kuwait (Q3-2013)
Prices of Industrial Plots at the Capital Governorate
Region Purpose% Built
AreaArea Street
Market Value of Land
KD
Average
Price /
Square
Meter
Q3-2013From To
Industrial
Shuwaikh
Showrooms
+
Land
+
Industrial
170% 1,000 Canada Dry 1,550,000 1,600,000 1,575
170% 5,000 Scheherazade 6,000,000 6,200,000 1,220
170% 1,000 Al-Zinah 1,200,000 1,500,000 1,350
170% 500 Al-Zinah 1,250,000 1,350,000 1,300
170% 500 Al-Zinah 725,000 850,000 1,575
170% 500 Electricity 685,000 750,000 1,435
170% 500 Pepsi 550,000 650,000 600
170% 5,000 4th Ring Road 1,200,000 1,300,000 250
170% 1,000 Muhammad Al-Qasem
1,525,000 1,575,000 1,550
170% 22,500 11,250,000 13,000,000 539
170% 1,000 Al-Ghazali 1,100,000 1,250,000 1,175
Average Price of the Region 2,894,091 3,145,455 1,293
1,8001,6001,4001,2001,000
800600400200
0
40
KFH Local Real Estate Report
41
Third Quarter 2013 - Kuwait
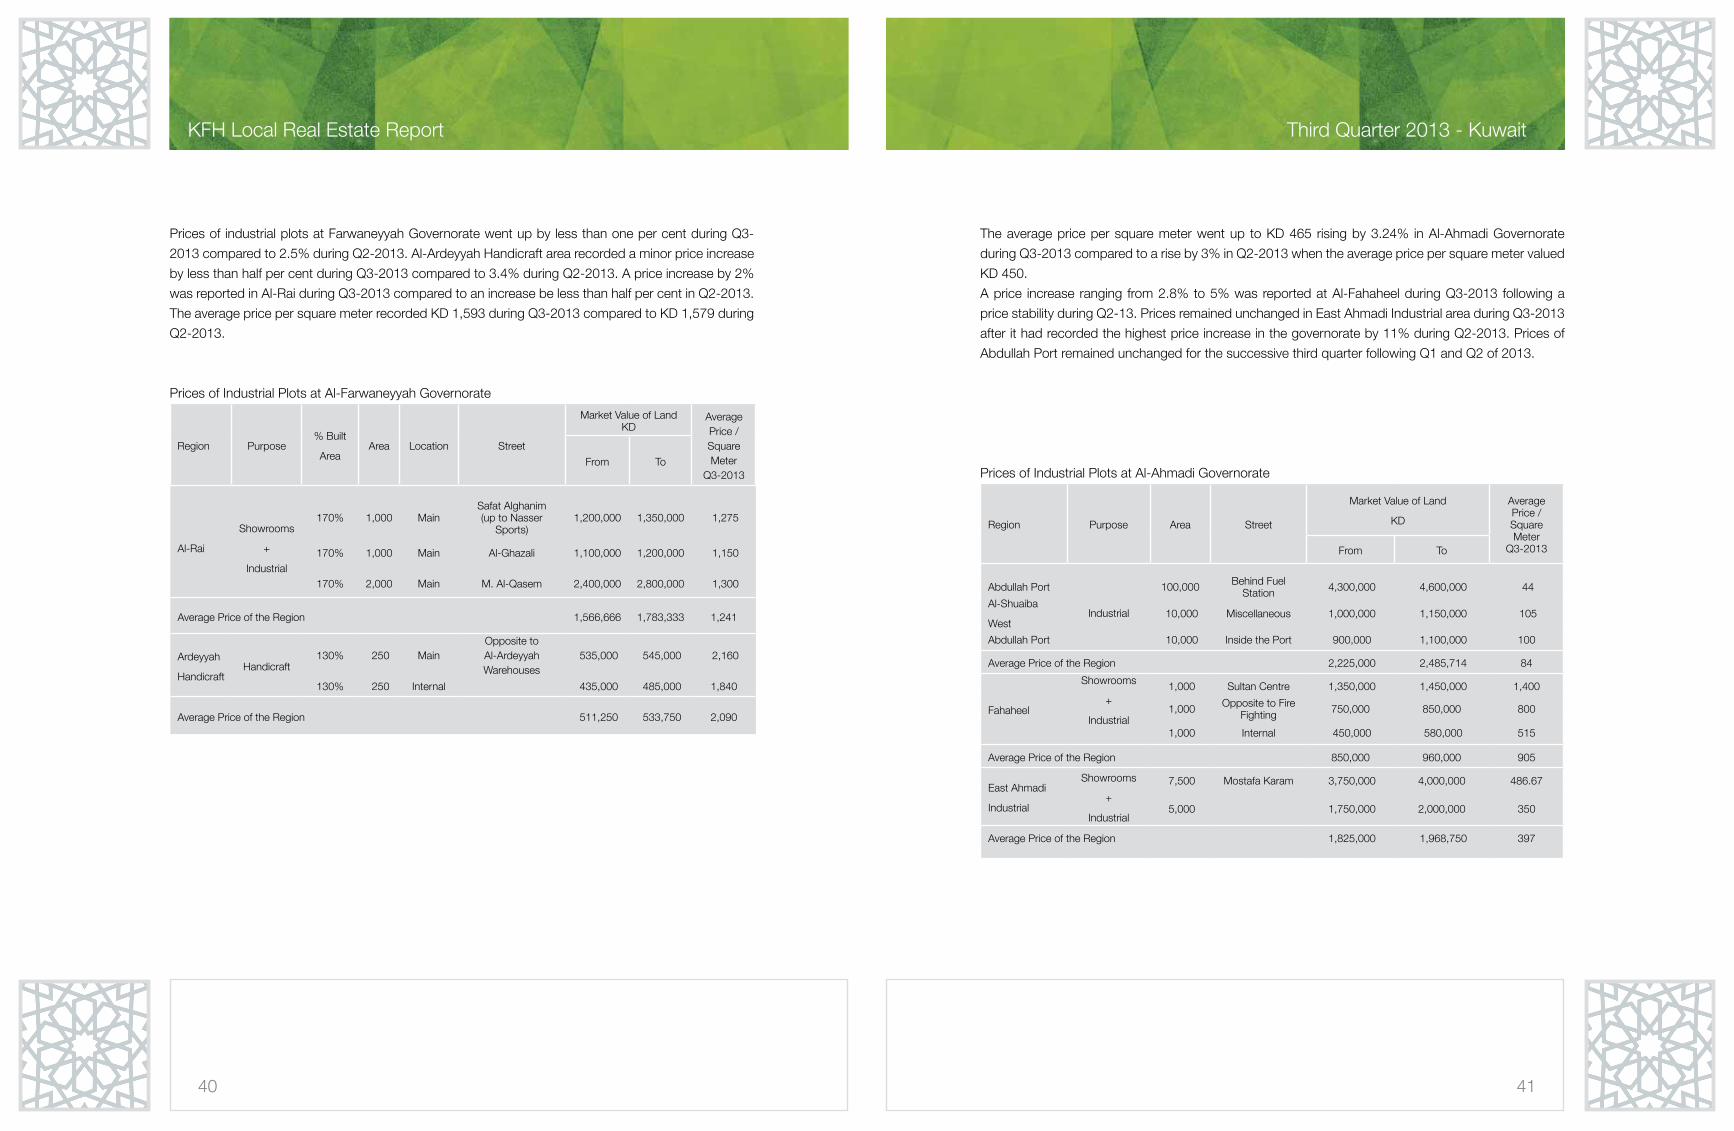
The average price per square meter went up to KD 465 rising by 3.24% in Al-Ahmadi Governorate
during Q3-2013 compared to a rise by 3% in Q2-2013 when the average price per square meter valued
KD 450.
A price increase ranging from 2.8% to 5% was reported at Al-Fahaheel during Q3-2013 following a
price stability during Q2-13. Prices remained unchanged in East Ahmadi Industrial area during Q3-2013
after it had recorded the highest price increase in the governorate by 11% during Q2-2013. Prices of
Abdullah Port remained unchanged for the successive third quarter following Q1 and Q2 of 2013.
Prices of Industrial Plots at Al-Ahmadi Governorate
Region Purpose Area Street
Market Value of Land
KD
Average Price / Square Meter
Q3-2013From To
Abdullah Port
Industrial
100,000 Behind Fuel Station 4,300,000 4,600,000 44
Al-Shuaiba
West 10,000 Miscellaneous 1,000,000 1,150,000 105
Abdullah Port 10,000 Inside the Port 900,000 1,100,000 100
Average Price of the Region 2,225,000 2,485,714 84
Fahaheel
Showrooms
+
Industrial
1,000 Sultan Centre 1,350,000 1,450,000 1,400
1,000 Opposite to Fire Fighting 750,000 850,000 800
1,000 Internal 450,000 580,000 515
Average Price of the Region 850,000 960,000 905
East Ahmadi
Industrial
Showrooms
+
Industrial
7,500 Mostafa Karam 3,750,000 4,000,000 486.67
5,000 1,750,000 2,000,000 350
Average Price of the Region 1,825,000 1,968,750 397
Prices of industrial plots at Farwaneyyah Governorate went up by less than one per cent during Q3-
2013 compared to 2.5% during Q2-2013. Al-Ardeyyah Handicraft area recorded a minor price increase
by less than half per cent during Q3-2013 compared to 3.4% during Q2-2013. A price increase by 2%
was reported in Al-Rai during Q3-2013 compared to an increase be less than half per cent in Q2-2013.
The average price per square meter recorded KD 1,593 during Q3-2013 compared to KD 1,579 during
Q2-2013.
Prices of Industrial Plots at Al-Farwaneyyah Governorate
Region Purpose% Built
AreaArea Location Street
Market Value of LandKD
Average Price / Square Meter
Q3-2013From To
Al-Rai
Showrooms
+
Industrial
170% 1,000 Main Safat Alghanim(up to Nasser
Sports)1,200,000 1,350,000 1,275
170% 1,000 Main Al-Ghazali 1,100,000 1,200,000 1,150
170% 2,000 Main M. Al-Qasem 2,400,000 2,800,000 1,300
Average Price of the Region 1,566,666 1,783,333 1,241
Ardeyyah
HandicraftHandicraft
130% 250 Main Opposite to Al-Ardeyyah Warehouses
535,000 545,000 2,160
130% 250 Internal 435,000 485,000 1,840
Average Price of the Region 511,250 533,750 2,090

42
KFH Local Real Estate Report
43
Third Quarter 2013 - Kuwait
Prices of Industrial Plots at Mubarak Al-Kabeer Governorate
Region Purpose Area Street
Market Value of Land
KD
Average Price
/ Square
Meter
Q3-2013From From
Abo FatirahHandicraft Showrooms 1,000 Main 1,650,000 1,750,000 1,700
Abo FatirahHandicraft Showrooms 1,000 Main 1,200,000 1,400,000 1,300
Average Price of the Region 975,000 1,087,500 1,313
Sabhan Industrial
1,000 Main 500,000 600,000 550.0
1,000 Pepsi 620,000 700,000 660.0
5,000 Pepsi 2,350,000 2,500,000 485.0
Average Price of the Region 1,190,000 1,354,167 472
Prices of Industrial Plots at Al-Jahrah Governorate
Region Purpose Area Street
Market Value of Land
KDAverage Price / Square
MeterQ3-2013From From
AmgharahMajor
Contractors
10,000 Internal 1,350,000 1,400,000 138
10,000 Main 1,550,000 1,650,000 160
Average Price of the Region 649,444 690,556 144
Al-Jahra Handicraft 500 Internal 130,000 150,000 280
500 Main 180,000 200,000 380
Average Price of the Region 156,250 177,500 434
Al-Doha Ship Repair 1,000 Main 120,000 180,000 150
Average Price of the Region 120,000 180,000 150
Fifth: Prices of Farms and PalesA noticeable price increase was reported at the pales and stables area at Al-Ahmadi, as the price of
square meter soared up to more than two thirds registering KD 74.4 during Q3-2013 hiking up by 76% if
compared to the prices reported during Q2-2013 which went up by 33% registering KD 42.3 per square
meter. Prices at the stables areas of Al-Ahmadi skyrocketed by 163% during Q3-2013 compared to a
13% price increase in Q2-2013.
Price stability was reported in Al-Wafra Agricultural during Q3-2013 compared to Q2-2013 when prices
rose up slightly, as the average price per square meter recorded KD 4 during Q3 and Q2-2013 compared
to KD 3.75 during Q1-2013.
Price stability was also reported in most of the cattle farms at Salebeyyah except for one area where
prices hiked up by 10% registering an average price of KD 12 per square meter during Q3-2013
compared to a slight price increase of less than one per cent during Q2-2013. An average price of KD
3.75 per square meter was reported at another area of the cattle farms during Q3-2013 compared to
KD 3.25 during Q2-2013.
The price per square meter at Al-Jahra Agriculture area and Abdali area settled at KD 2.75 compared to
a price increase by 9% during Q2-2013.
Avarege Price per sqm of pals and stables at Al Ahmadi during Q2-2013 compared to Q3-2013
Quarter 2 - 2013Quarter 3 - 2013
Kabad Pals Camel Pales Stables Wafrah Pales
90
80
70
60
50
40
30
20
10
0
44
KFH Local Real Estate Report
45
Third Quarter 2013 - Kuwait
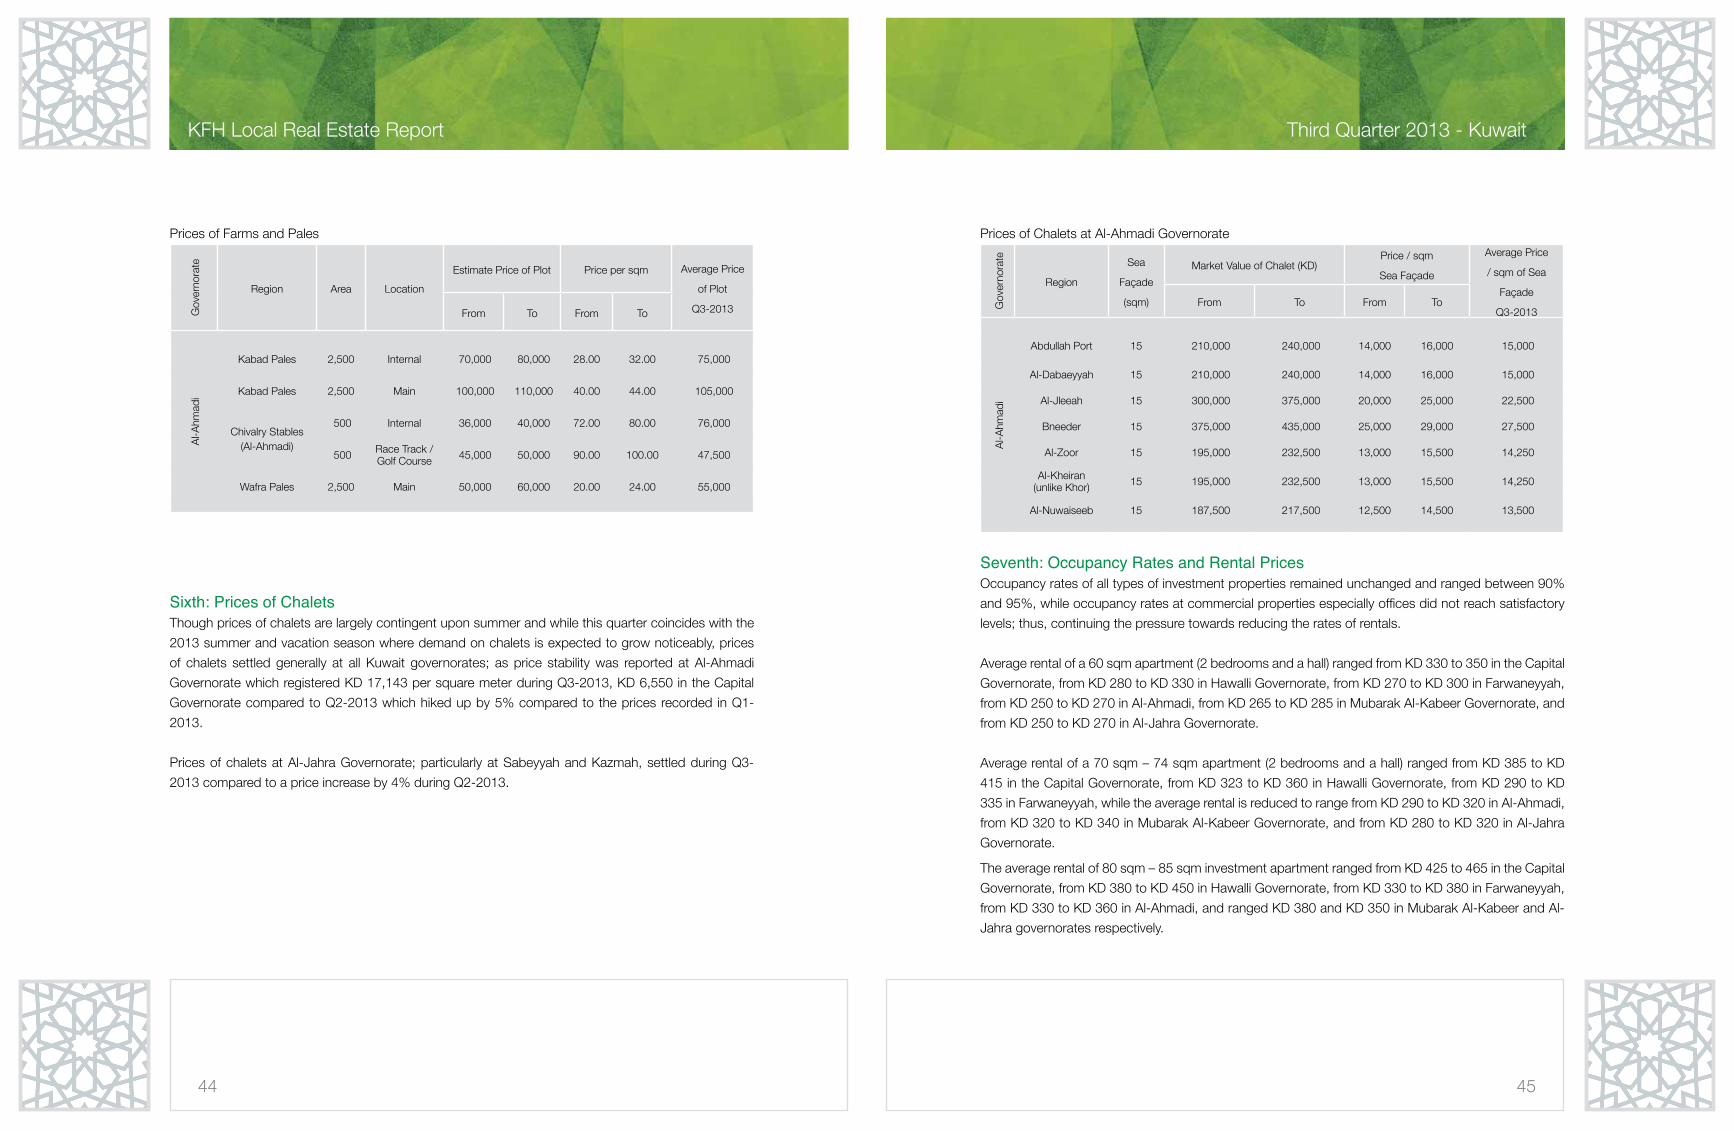
Prices of Farms and Pales
Gov
erno
rate
Region Area Location
Estimate Price of Plot Price per sqm Average Price
of Plot
Q3-2013From To From To
Al-A
hmad
i
Kabad Pales 2,500 Internal 70,000 80,000 28.00 32.00 75,000
Kabad Pales 2,500 Main 100,000 110,000 40.00 44.00 105,000
Chivalry Stables(Al-Ahmadi)
500 Internal 36,000 40,000 72.00 80.00 76,000
500 Race Track / Golf Course 45,000 50,000 90.00 100.00 47,500
Wafra Pales 2,500 Main 50,000 60,000 20.00 24.00 55,000
Sixth: Prices of Chalets Though prices of chalets are largely contingent upon summer and while this quarter coincides with the
2013 summer and vacation season where demand on chalets is expected to grow noticeably, prices
of chalets settled generally at all Kuwait governorates; as price stability was reported at Al-Ahmadi
Governorate which registered KD 17,143 per square meter during Q3-2013, KD 6,550 in the Capital
Governorate compared to Q2-2013 which hiked up by 5% compared to the prices recorded in Q1-
2013.
Prices of chalets at Al-Jahra Governorate; particularly at Sabeyyah and Kazmah, settled during Q3-
2013 compared to a price increase by 4% during Q2-2013.
Prices of Chalets at Al-Ahmadi Governorate
Gov
erno
rate
Region
Sea
Façade
(sqm)
Market Value of Chalet (KD)Price / sqm
Sea Façade
Average Price
/ sqm of Sea
Façade
Q3-2013From To From To
Al-A
hmad
i
Abdullah Port 15 210,000 240,000 14,000 16,000 15,000
Al-Dabaeyyah 15 210,000 240,000 14,000 16,000 15,000
Al-Jleeah 15 300,000 375,000 20,000 25,000 22,500
Bneeder 15 375,000 435,000 25,000 29,000 27,500
Al-Zoor 15 195,000 232,500 13,000 15,500 14,250
Al-Kheiran(unlike Khor) 15 195,000 232,500 13,000 15,500 14,250
Al-Nuwaiseeb 15 187,500 217,500 12,500 14,500 13,500
Seventh: Occupancy Rates and Rental PricesOccupancy rates of all types of investment properties remained unchanged and ranged between 90%
and 95%, while occupancy rates at commercial properties especially offices did not reach satisfactory
levels; thus, continuing the pressure towards reducing the rates of rentals.
Average rental of a 60 sqm apartment (2 bedrooms and a hall) ranged from KD 330 to 350 in the Capital
Governorate, from KD 280 to KD 330 in Hawalli Governorate, from KD 270 to KD 300 in Farwaneyyah,
from KD 250 to KD 270 in Al-Ahmadi, from KD 265 to KD 285 in Mubarak Al-Kabeer Governorate, and
from KD 250 to KD 270 in Al-Jahra Governorate.
Average rental of a 70 sqm – 74 sqm apartment (2 bedrooms and a hall) ranged from KD 385 to KD
415 in the Capital Governorate, from KD 323 to KD 360 in Hawalli Governorate, from KD 290 to KD
335 in Farwaneyyah, while the average rental is reduced to range from KD 290 to KD 320 in Al-Ahmadi,
from KD 320 to KD 340 in Mubarak Al-Kabeer Governorate, and from KD 280 to KD 320 in Al-Jahra
Governorate.
The average rental of 80 sqm – 85 sqm investment apartment ranged from KD 425 to 465 in the Capital
Governorate, from KD 380 to KD 450 in Hawalli Governorate, from KD 330 to KD 380 in Farwaneyyah,
from KD 330 to KD 360 in Al-Ahmadi, and ranged KD 380 and KD 350 in Mubarak Al-Kabeer and Al-
Jahra governorates respectively.
46
KFH Local Real Estate Report
47
Third Quarter 2013 - Kuwait
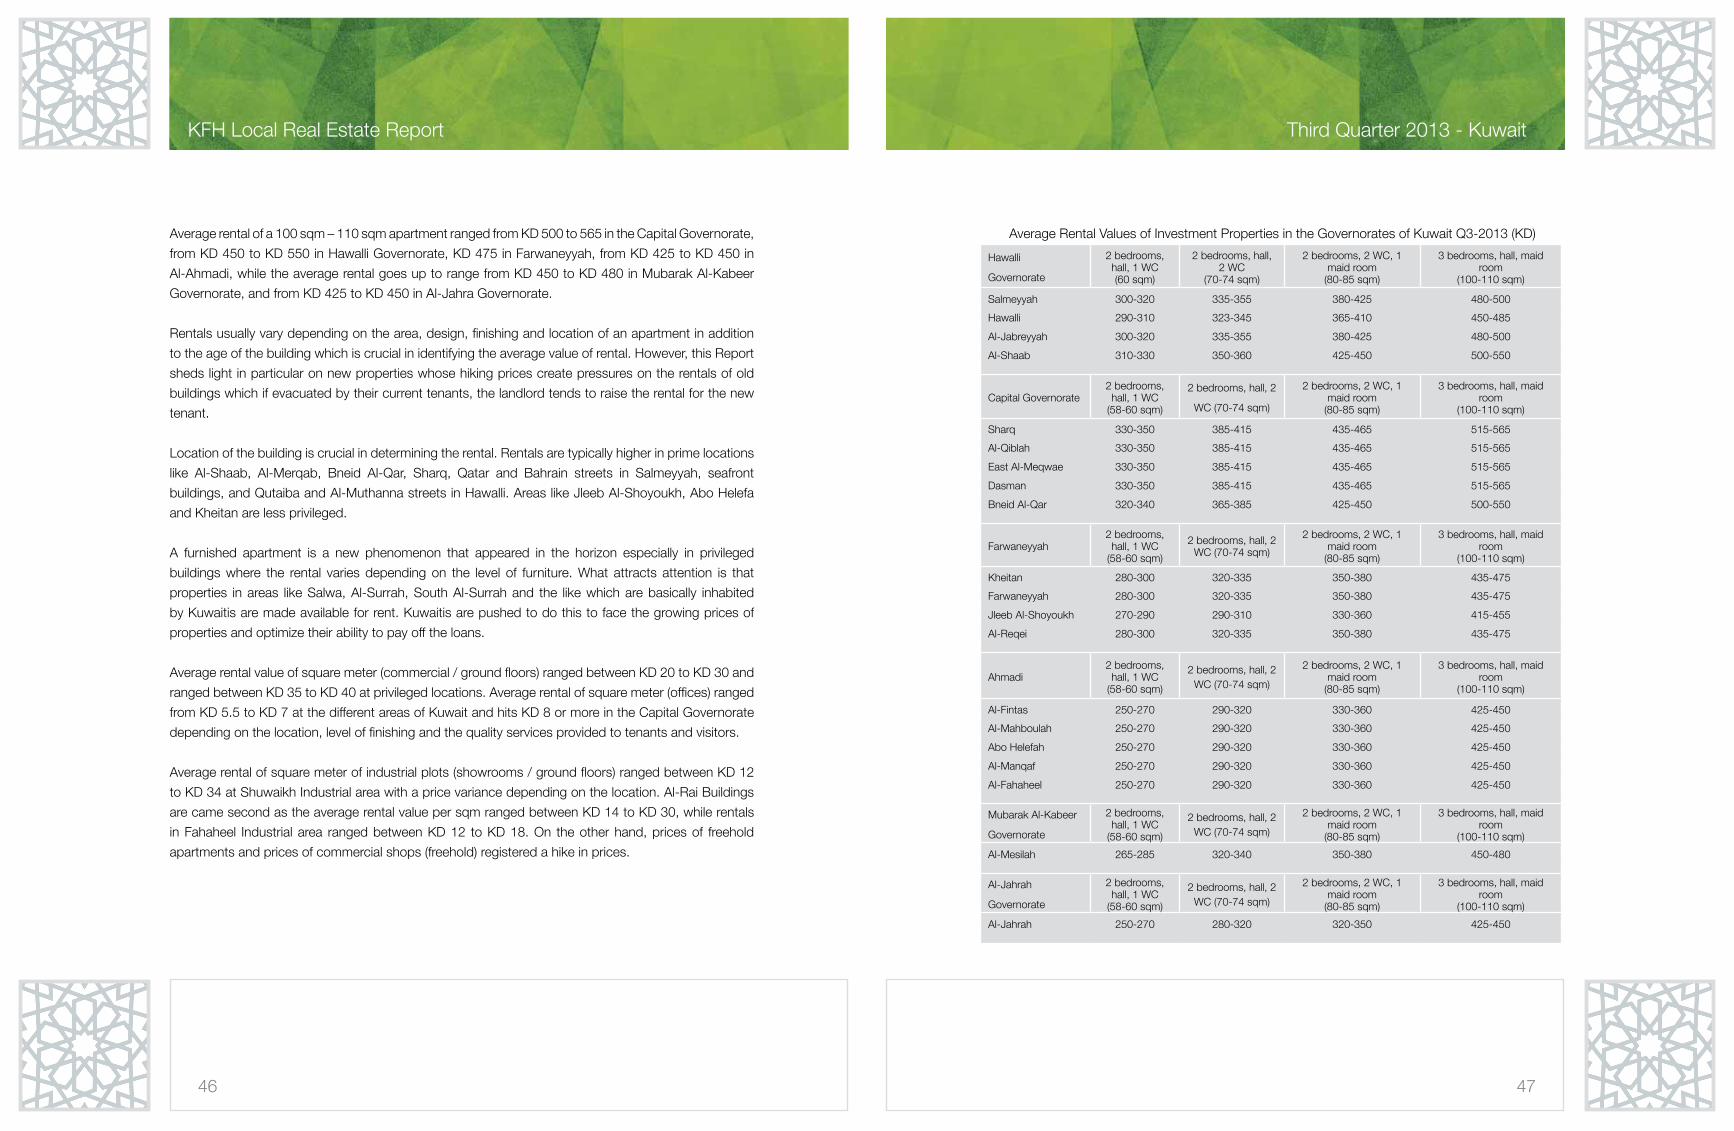
Average rental of a 100 sqm – 110 sqm apartment ranged from KD 500 to 565 in the Capital Governorate,
from KD 450 to KD 550 in Hawalli Governorate, KD 475 in Farwaneyyah, from KD 425 to KD 450 in
Al-Ahmadi, while the average rental goes up to range from KD 450 to KD 480 in Mubarak Al-Kabeer
Governorate, and from KD 425 to KD 450 in Al-Jahra Governorate.
Rentals usually vary depending on the area, design, finishing and location of an apartment in addition
to the age of the building which is crucial in identifying the average value of rental. However, this Report
sheds light in particular on new properties whose hiking prices create pressures on the rentals of old
buildings which if evacuated by their current tenants, the landlord tends to raise the rental for the new
tenant.
Location of the building is crucial in determining the rental. Rentals are typically higher in prime locations
like Al-Shaab, Al-Merqab, Bneid Al-Qar, Sharq, Qatar and Bahrain streets in Salmeyyah, seafront
buildings, and Qutaiba and Al-Muthanna streets in Hawalli. Areas like Jleeb Al-Shoyoukh, Abo Helefa
and Kheitan are less privileged.
A furnished apartment is a new phenomenon that appeared in the horizon especially in privileged
buildings where the rental varies depending on the level of furniture. What attracts attention is that
properties in areas like Salwa, Al-Surrah, South Al-Surrah and the like which are basically inhabited
by Kuwaitis are made available for rent. Kuwaitis are pushed to do this to face the growing prices of
properties and optimize their ability to pay off the loans.
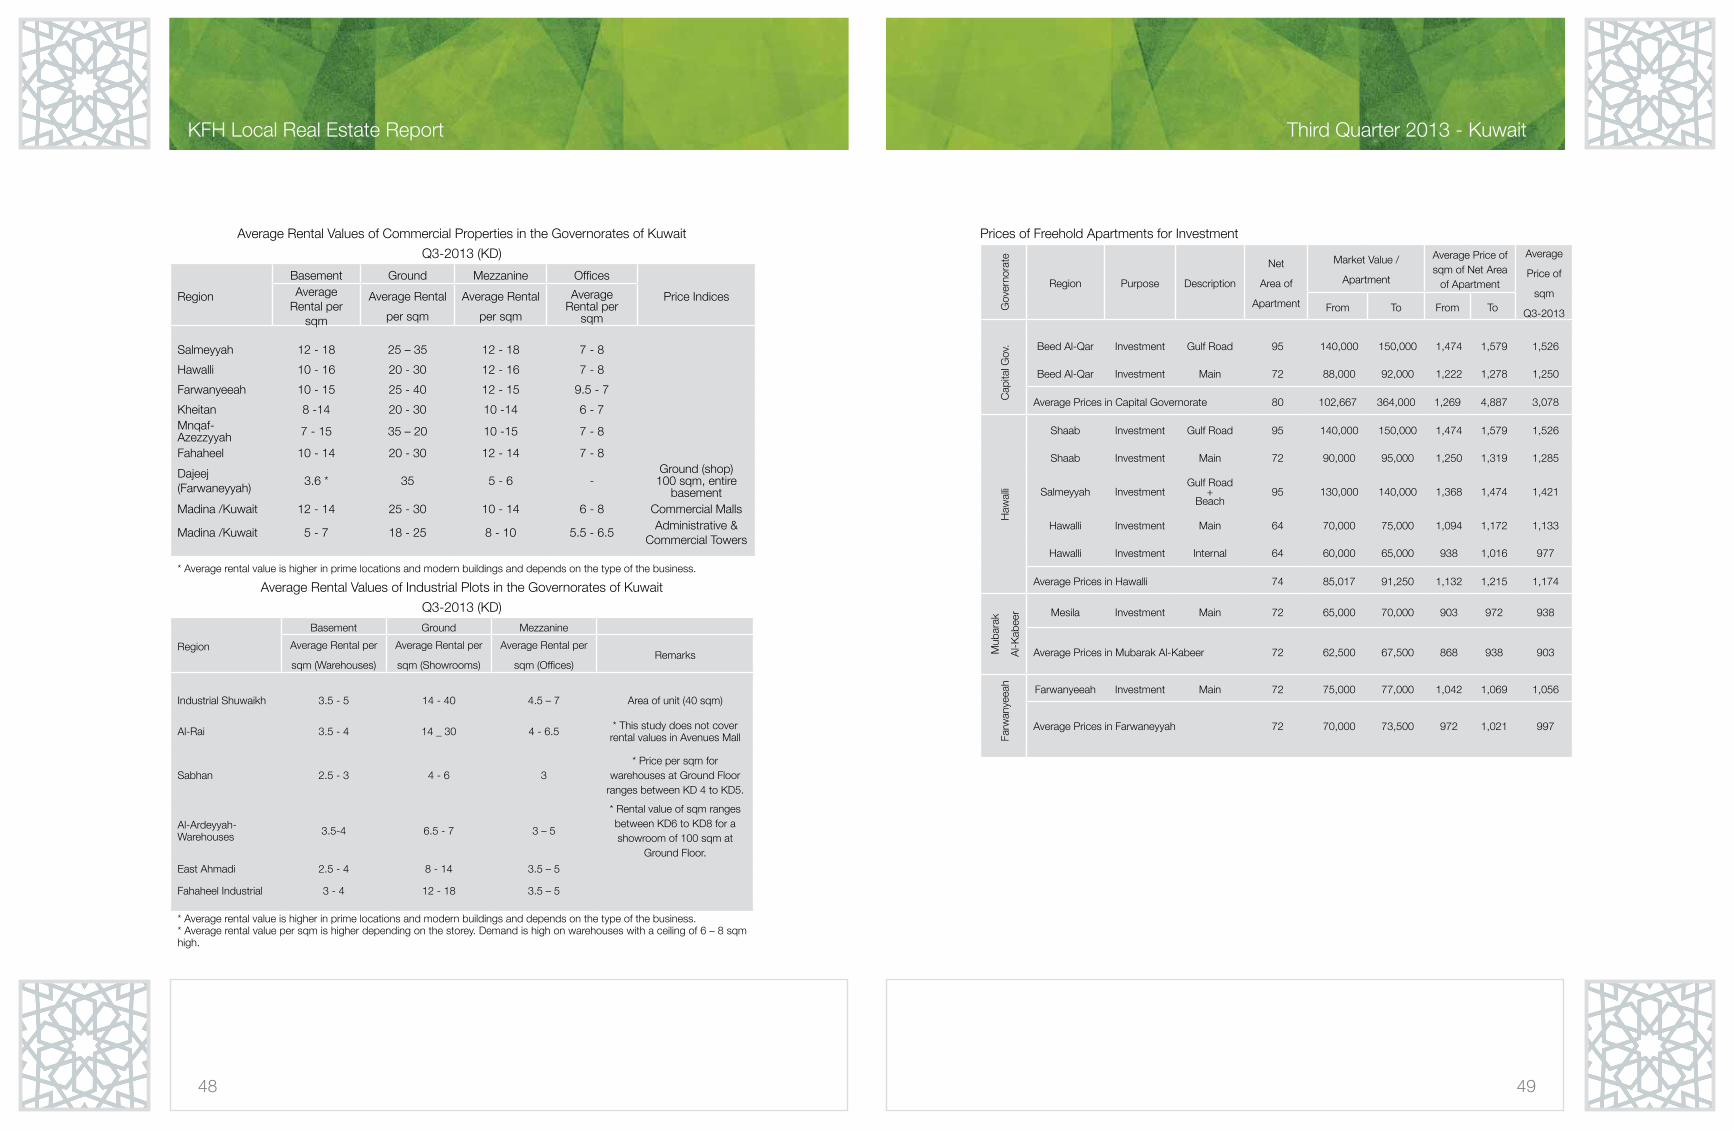
Average rental value of square meter (commercial / ground floors) ranged between KD 20 to KD 30 and
ranged between KD 35 to KD 40 at privileged locations. Average rental of square meter (offices) ranged
from KD 5.5 to KD 7 at the different areas of Kuwait and hits KD 8 or more in the Capital Governorate
depending on the location, level of finishing and the quality services provided to tenants and visitors.
Average rental of square meter of industrial plots (showrooms / ground floors) ranged between KD 12
to KD 34 at Shuwaikh Industrial area with a price variance depending on the location. Al-Rai Buildings
are came second as the average rental value per sqm ranged between KD 14 to KD 30, while rentals
in Fahaheel Industrial area ranged between KD 12 to KD 18. On the other hand, prices of freehold
apartments and prices of commercial shops (freehold) registered a hike in prices.
Average Rental Values of Investment Properties in the Governorates of Kuwait Q3-2013 (KD)
Hawalli
Governorate
2 bedrooms, hall, 1 WC (60 sqm)
2 bedrooms, hall, 2 WC
(70-74 sqm)
2 bedrooms, 2 WC, 1 maid room
(80-85 sqm)
3 bedrooms, hall, maid room
(100-110 sqm)
Salmeyyah 300-320 335-355 380-425 480-500
Hawalli 290-310 323-345 365-410 450-485
Al-Jabreyyah 300-320 335-355 380-425 480-500
Al-Shaab 310-330 350-360 425-450 500-550
Capital Governorate2 bedrooms, hall, 1 WC
(58-60 sqm)
2 bedrooms, hall, 2
WC (70-74 sqm)
2 bedrooms, 2 WC, 1 maid room
(80-85 sqm)
3 bedrooms, hall, maid room
(100-110 sqm)
Sharq 330-350 385-415 435-465 515-565
Al-Qiblah 330-350 385-415 435-465 515-565
East Al-Meqwae 330-350 385-415 435-465 515-565
Dasman 330-350 385-415 435-465 515-565
Bneid Al-Qar 320-340 365-385 425-450 500-550
Farwaneyyah2 bedrooms, hall, 1 WC
(58-60 sqm)
2 bedrooms, hall, 2 WC (70-74 sqm)
2 bedrooms, 2 WC, 1 maid room
(80-85 sqm)
3 bedrooms, hall, maid room
(100-110 sqm)
Kheitan 280-300 320-335 350-380 435-475
Farwaneyyah 280-300 320-335 350-380 435-475
Jleeb Al-Shoyoukh 270-290 290-310 330-360 415-455
Al-Reqei 280-300 320-335 350-380 435-475
Ahmadi2 bedrooms, hall, 1 WC
(58-60 sqm)
2 bedrooms, hall, 2 WC (70-74 sqm)
2 bedrooms, 2 WC, 1 maid room
(80-85 sqm)
3 bedrooms, hall, maid room
(100-110 sqm)
Al-Fintas 250-270 290-320 330-360 425-450
Al-Mahboulah 250-270 290-320 330-360 425-450
Abo Helefah 250-270 290-320 330-360 425-450
Al-Manqaf 250-270 290-320 330-360 425-450
Al-Fahaheel 250-270 290-320 330-360 425-450
Mubarak Al-Kabeer
Governorate
2 bedrooms, hall, 1 WC
(58-60 sqm)
2 bedrooms, hall, 2 WC (70-74 sqm)
2 bedrooms, 2 WC, 1 maid room
(80-85 sqm)
3 bedrooms, hall, maid room
(100-110 sqm)
Al-Mesilah 265-285 320-340 350-380 450-480
Al-Jahrah
Governorate
2 bedrooms, hall, 1 WC
(58-60 sqm)
2 bedrooms, hall, 2 WC (70-74 sqm)
2 bedrooms, 2 WC, 1 maid room
(80-85 sqm)
3 bedrooms, hall, maid room
(100-110 sqm)
Al-Jahrah 250-270 280-320 320-350 425-450
48
KFH Local Real Estate Report
49
Third Quarter 2013 - Kuwait
Average Rental Values of Commercial Properties in the Governorates of Kuwait
Q3-2013 (KD)
Region
Basement Ground Mezzanine Offices
Price IndicesAverage Rental per
sqm
Average Rental
per sqm
Average Rental
per sqm
Average Rental per
sqm
Salmeyyah 12 - 18 25 – 35 12 - 18 7 - 8
Hawalli 10 - 16 20 - 30 12 - 16 7 - 8
Farwanyeeah 10 - 15 25 - 40 12 - 15 9.5 - 7
Kheitan 8 -14 20 - 30 10 -14 6 - 7 Mnqaf-Azezzyyah 7 - 15 35 – 20 10 -15 7 - 8
Fahaheel 10 - 14 20 - 30 12 - 14 7 - 8
Dajeej (Farwaneyyah)
3.6 * 35 5 - 6 -Ground (shop)
100 sqm, entire basement
Madina /Kuwait 12 - 14 25 - 30 10 - 14 6 - 8 Commercial Malls
Madina /Kuwait 5 - 7 18 - 25 8 - 10 5.5 - 6.5Administrative &
Commercial Towers
* Average rental value is higher in prime locations and modern buildings and depends on the type of the business.
Average Rental Values of Industrial Plots in the Governorates of Kuwait
Q3-2013 (KD)
Region
Basement Ground Mezzanine
Average Rental per
sqm (Warehouses)
Average Rental per
sqm (Showrooms)
Average Rental per
sqm (Offices)Remarks
Industrial Shuwaikh 3.5 - 5 14 - 40 4.5 – 7 Area of unit (40 sqm)
Al-Rai 3.5 - 4 14 _ 30 4 - 6.5 * This study does not cover rental values in Avenues Mall
Sabhan 2.5 - 3 4 - 6 3* Price per sqm for
warehouses at Ground Floor ranges between KD 4 to KD5.
Al-Ardeyyah-Warehouses 3.5-4 6.5 - 7 3 – 5
* Rental value of sqm ranges between KD6 to KD8 for a showroom of 100 sqm at
Ground Floor.
East Ahmadi 2.5 - 4 8 - 14 3.5 – 5
Fahaheel Industrial 3 - 4 12 - 18 3.5 – 5
* Average rental value is higher in prime locations and modern buildings and depends on the type of the business.* Average rental value per sqm is higher depending on the storey. Demand is high on warehouses with a ceiling of 6 – 8 sqm high.
Prices of Freehold Apartments for Investment
Gov
erno
rate
Region Purpose Description
Net
Area of
Apartment
Market Value /
Apartment
Average Price of sqm of Net Area
of Apartment
Average
Price of
sqm
Q3-2013From To From To
Cap
ital G
ov. Beed Al-Qar Investment Gulf Road 95 140,000 150,000 1,474 1,579 1,526
Beed Al-Qar Investment Main 72 88,000 92,000 1,222 1,278 1,250
Average Prices in Capital Governorate 80 102,667 364,000 1,269 4,887 3,078
Haw
alli
Shaab Investment Gulf Road 95 140,000 150,000 1,474 1,579 1,526
Shaab Investment Main 72 90,000 95,000 1,250 1,319 1,285
Salmeyyah InvestmentGulf Road
+ Beach
95 130,000 140,000 1,368 1,474 1,421
Hawalli Investment Main 64 70,000 75,000 1,094 1,172 1,133
Hawalli Investment Internal 64 60,000 65,000 938 1,016 977
Average Prices in Hawalli 74 85,017 91,250 1,132 1,215 1,174
Mub
arak
Al-K
abee
r Mesila Investment Main 72 65,000 70,000 903 972 938
Average Prices in Mubarak Al-Kabeer 72 62,500 67,500 868 938 903
Farw
anye
eah
Farwanyeeah Investment Main 72 75,000 77,000 1,042 1,069 1,056
Average Prices in Farwaneyyah 72 70,000 73,500 972 1,021 997
50
KFH Local Real Estate Report
51
Third Quarter 2013 - Kuwait
Gov
erno
rate
Region Purpose DescriptionNet Area of
Apartment
Market Value /
Apartment
Average Price of
sqm of Net Area
of Apartment
Average
Price of
sqm
Q2-2013From To From To
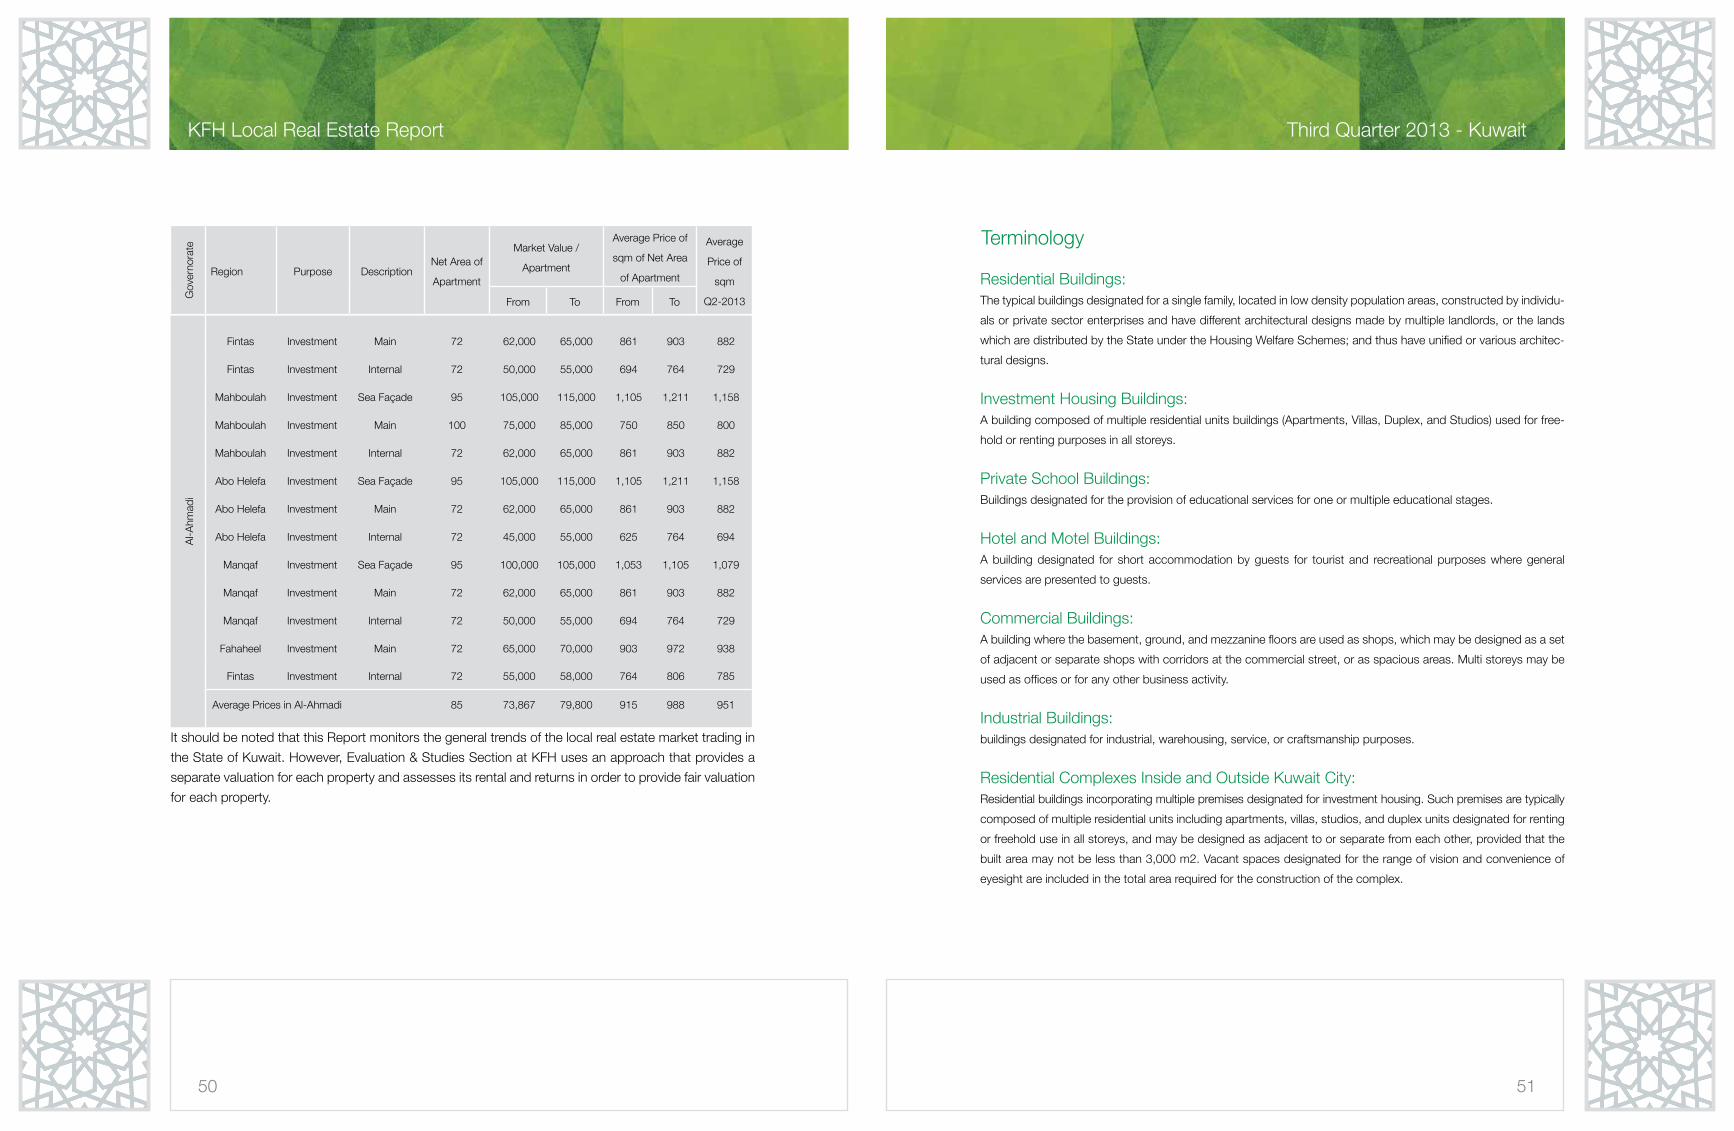
Al-A
hmad
i
Fintas Investment Main 72 62,000 65,000 861 903 882
Fintas Investment Internal 72 50,000 55,000 694 764 729
Mahboulah Investment Sea Façade 95 105,000 115,000 1,105 1,211 1,158
Mahboulah Investment Main 100 75,000 85,000 750 850 800
Mahboulah Investment Internal 72 62,000 65,000 861 903 882
Abo Helefa Investment Sea Façade 95 105,000 115,000 1,105 1,211 1,158
Abo Helefa Investment Main 72 62,000 65,000 861 903 882
Abo Helefa Investment Internal 72 45,000 55,000 625 764 694
Manqaf Investment Sea Façade 95 100,000 105,000 1,053 1,105 1,079
Manqaf Investment Main 72 62,000 65,000 861 903 882
Manqaf Investment Internal 72 50,000 55,000 694 764 729
Fahaheel Investment Main 72 65,000 70,000 903 972 938
Fintas Investment Internal 72 55,000 58,000 764 806 785
Average Prices in Al-Ahmadi 85 73,867 79,800 915 988 951
It should be noted that this Report monitors the general trends of the local real estate market trading in
the State of Kuwait. However, Evaluation & Studies Section at KFH uses an approach that provides a
separate valuation for each property and assesses its rental and returns in order to provide fair valuation
for each property.
Terminology
Residential Buildings:The typical buildings designated for a single family, located in low density population areas, constructed by individu-
als or private sector enterprises and have different architectural designs made by multiple landlords, or the lands
which are distributed by the State under the Housing Welfare Schemes; and thus have unified or various architec-
tural designs.
Investment Housing Buildings:A building composed of multiple residential units buildings (Apartments, Villas, Duplex, and Studios) used for free-
hold or renting purposes in all storeys.
Private School Buildings:Buildings designated for the provision of educational services for one or multiple educational stages.
Hotel and Motel Buildings:A building designated for short accommodation by guests for tourist and recreational purposes where general
services are presented to guests.
Commercial Buildings:A building where the basement, ground, and mezzanine floors are used as shops, which may be designed as a set
of adjacent or separate shops with corridors at the commercial street, or as spacious areas. Multi storeys may be
used as offices or for any other business activity.
Industrial Buildings:buildings designated for industrial, warehousing, service, or craftsmanship purposes.
Residential Complexes Inside and Outside Kuwait City:Residential buildings incorporating multiple premises designated for investment housing. Such premises are typically
composed of multiple residential units including apartments, villas, studios, and duplex units designated for renting
or freehold use in all storeys, and may be designed as adjacent to or separate from each other, provided that the
built area may not be less than 3,000 m2. Vacant spaces designated for the range of vision and convenience of
eyesight are included in the total area required for the construction of the complex.
52
KFH Local Real Estate Report
53
Third Quarter 2013 - Kuwait
Coastal Strip Buildings:Buildings built by individuals on their own land extended throughout the coastline.
Buildings for Horticulture Activities:Buildings designated for the cultivation, care, show, and sale of flora and flowers of different types, care of gardens
and agricultural products, inventory of seeds and agricultural needs, and office spaces.
Private Chalets:Buildings or facilities established outside public order under leasing contracts for the lease of the State owned
properties for recreational and entertainment purposes.
Private Hospitals:Premises designated for the provision of general or specialized medical services (Outpatient clinics, operating theat-
ers, laboratories, patient rooms and wards).
Measurement Units:
Length• Meter is the International Standard Unit for linear measure.
• 1M = 10 cm = 1000 millimeter.
• Yard = 3 feet = 0.9144 m.
• Foot = 12 inches = 30.48 cm = 0.3048 m.
• Inch = 2.54 cm = 0.0254 m.
• Km = 0.6214 mile = 1000 m.
• Land Mile = 1.6093 Km = 1609.0 m.
• Nautical Mile = 6080 feet = 1.853 km = 1853 m.
• League = 3 Miles = 4.8281 Km = 4828 m.
• Al Bou = approximately 2 m.
• Fathom = 182.88 cm = 1.8288 m.
• Cubit = 51 cm = 0.51 m.
• Span = 22.86 cm = 0.0229 m.
• 1 M = 1.0936 Yard = 3.2808 Feet = 39.37 Inches.
Area• Square Meter is the International Standard Unit of area.
• Hectare = 10 Donum = 2.471 Feddan = 10,000 m2.
• Feddan / Acre = 4046.8 m2.
• Donum = 1000 m2.
• Square Meter = 10,764 square feet.