third annual study on exchanging cyber threat intelligence ... · ponemon institute: private &...
TRANSCRIPT
Third Annual Study on Exchanging Cyber Threat Intelligence: There Has to Be a Better Way
Ponemon Institute© Research Report
Sponsored by Infoblox Independently conducted by Ponemon Institute LLC Publication Date: January 2018
Ponemon Institute: Private & Confidential Report 1
Third Annual Study on Exchanging Cyber Threat Intelligence: There Has to Be a Better Way
January 2018 Part 1. Introduction
In a world of increasingly stealthy and sophisticated cyber criminals, it is difficult, costly and ineffective for companies to defend themselves against these threats alone. As revealed in The Third Annual Study on Exchanging Cyber Threat Intelligence: There Has to Be a Better Way, more companies are reaching out to their peers and other sources for threat intelligence data. Sponsored by Infoblox, the study provides evidence that participating in initiatives or programs for exchanging threat intelligence with peers, industry groups, IT vendors and government results in a stronger security posture.
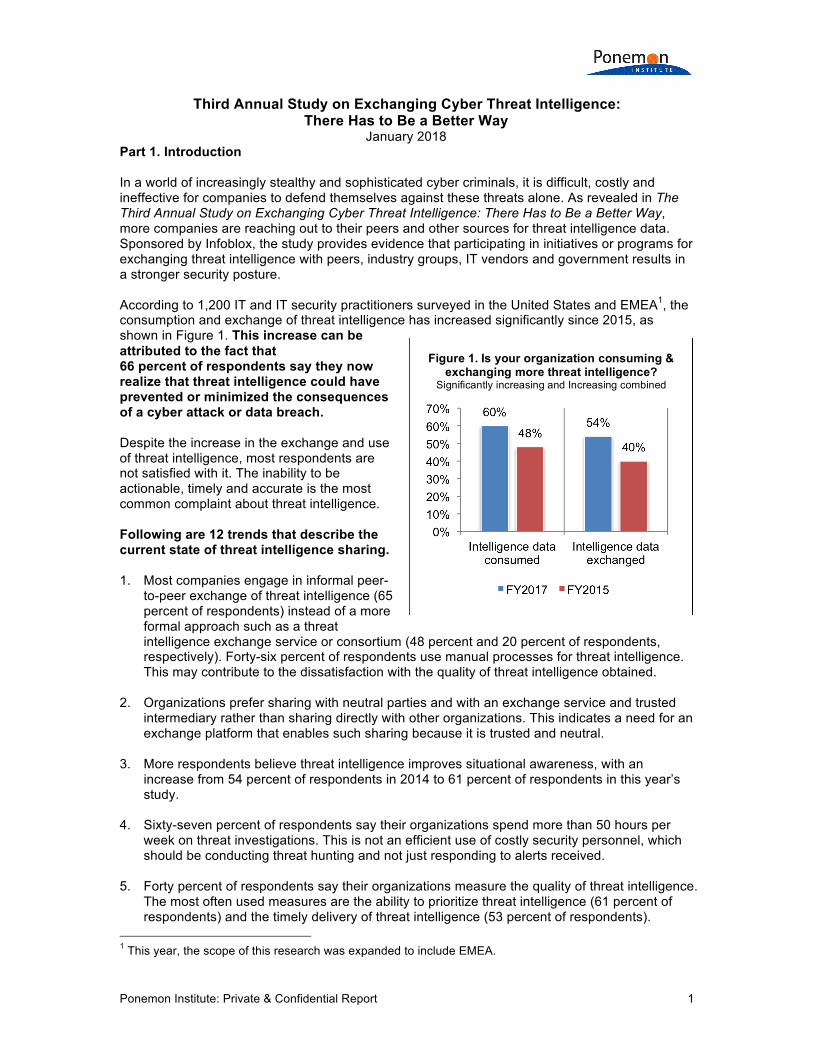
According to 1,200 IT and IT security practitioners surveyed in the United States and EMEA1, the consumption and exchange of threat intelligence has increased significantly since 2015, as shown in Figure 1. This increase can be attributed to the fact that 66 percent of respondents say they now realize that threat intelligence could have prevented or minimized the consequences of a cyber attack or data breach.
Despite the increase in the exchange and use of threat intelligence, most respondents are not satisfied with it. The inability to be actionable, timely and accurate is the most common complaint about threat intelligence.
Following are 12 trends that describe the current state of threat intelligence sharing.
1. Most companies engage in informal peer-to-peer exchange of threat intelligence (65percent of respondents) instead of a moreformal approach such as a threatintelligence exchange service or consortium (48 percent and 20 percent of respondents,respectively). Forty-six percent of respondents use manual processes for threat intelligence.This may contribute to the dissatisfaction with the quality of threat intelligence obtained.
2. Organizations prefer sharing with neutral parties and with an exchange service and trustedintermediary rather than sharing directly with other organizations. This indicates a need for anexchange platform that enables such sharing because it is trusted and neutral.
3. More respondents believe threat intelligence improves situational awareness, with anincrease from 54 percent of respondents in 2014 to 61 percent of respondents in this year’sstudy.
4. Sixty-seven percent of respondents say their organizations spend more than 50 hours perweek on threat investigations. This is not an efficient use of costly security personnel, whichshould be conducting threat hunting and not just responding to alerts received.
5. Forty percent of respondents say their organizations measure the quality of threat intelligence.The most often used measures are the ability to prioritize threat intelligence (61 percent ofrespondents) and the timely delivery of threat intelligence (53 percent of respondents).
1 This year, the scope of this research was expanded to include EMEA.
Figure 1. Is your organization consuming & exchanging more threat intelligence?
Significantly increasing and Increasing combined

Ponemon Institute: Private & Confidential Report 2
6. Respondents continue to be concerned about the accuracy, timeliness and ability to be
actionable of the threat intelligence they receive. Specifically, more than 60 percent of respondents are only somewhat satisfied (32 percent) or not satisfied (28 percent) with the quality of threat intelligence obtained. However, this is a significant decrease from 70 percent in 2014, which indicates some improvement as the market matures. Concerns about how threat intelligence is obtained persist because information is not timely and is too complicated, according to 66 percent and 41 percent of respondents, respectively.
7. Companies are paying for threat intelligence because it is considered better than free threat
intelligence. Fifty-nine percent of respondents also believe it has proven effective in stopping security incidents.
8. Seventy-three percent of respondents say they use threat indicators and that the most
valuable types of information are indicators of malicious IP addresses and malicious URLs. 9. The value of threat intelligence is considered to decline within minutes. However, only 24
percent of respondents say they receive threat intelligence in real time (9 percent) or hourly (15 percent).
10. Forty-five percent of respondents say they use their threat intelligence program to define and
rank levels of risk of not being able to prevent or mitigate threats. The primary indicators of risk are uncertainty about the accuracy of threat intelligence and an overall decline in the quality of the provider’s services (66 percent of respondents and 62 percent of respondents).
11. Many respondents say their organizations are using threat intelligence in a non-security
platform, such as DNS. The implication is that there is a blurring of lines in relation to what are considered pure networking tools and what are considered security tools. Security means defense-in-depth, plugging all gaps and covering all products.
12. Seventy-two percent of respondents are using or plan to use multiple sources of threat
intelligence. However, 59 percent of respondents have a lack of qualified staff and, therefore, consolidate threat intelligence manually.
Ponemon Institute: Private & Confidential Report 3
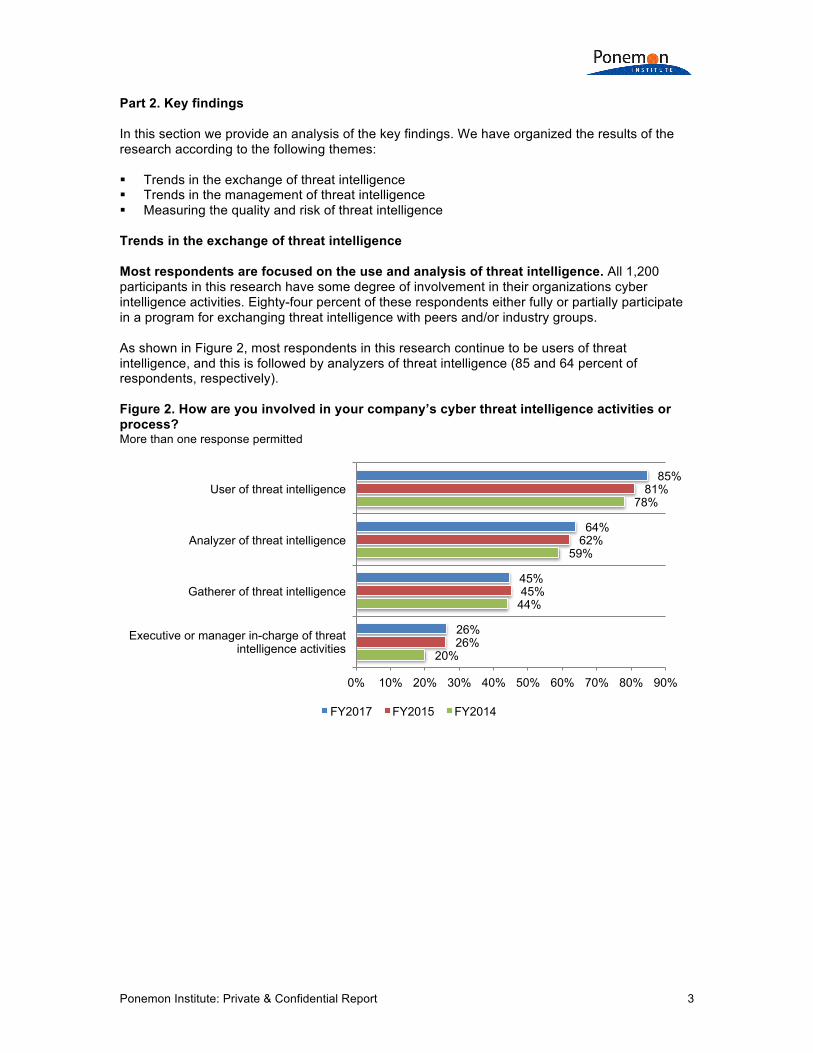
Part 2. Key findings In this section we provide an analysis of the key findings. We have organized the results of the research according to the following themes: ! Trends in the exchange of threat intelligence ! Trends in the management of threat intelligence ! Measuring the quality and risk of threat intelligence Trends in the exchange of threat intelligence Most respondents are focused on the use and analysis of threat intelligence. All 1,200 participants in this research have some degree of involvement in their organizations cyber intelligence activities. Eighty-four percent of these respondents either fully or partially participate in a program for exchanging threat intelligence with peers and/or industry groups. As shown in Figure 2, most respondents in this research continue to be users of threat intelligence, and this is followed by analyzers of threat intelligence (85 and 64 percent of respondents, respectively). Figure 2. How are you involved in your company’s cyber threat intelligence activities or process? More than one response permitted
20%
44%
59%
78%
26%
45%
62%
81%
26%
45%
64%
85%
0% 10% 20% 30% 40% 50% 60% 70% 80% 90%
Executive or manager in-charge of threat intelligence activities
Gatherer of threat intelligence
Analyzer of threat intelligence
User of threat intelligence
FY2017 FY2015 FY2014

Ponemon Institute: Private & Confidential Report 4
Threat intelligence sharing is believed to improve the security posture of organizations and the nation’s critical infrastructure. Eighty-four percent of organizations represented in this research either fully participate or partially participate in an initiative or program for exchanging threat intelligence with peers and/or industry groups. While not many respondents believe the exchange of threat intelligence makes threat data more actionable and timely, respondents do believe it has a positive effect on their security posture and the nation’s critical infrastructure, as shown in Figure 3. Since 2014 more respondents see the exchange of threat intelligence as improving the security posture of the organization (76 percent of respondents this year vs. 71 percent of respondents in 2014). The perceived benefit of improving situational awareness has increased since 2014 (54 percent of respondents vs. 61 percent of respondents). Figure 3. Reasons for full participation in a program for exchanging threat intelligence More than one response permitted
16%
21%
24%
51%
54%
64%
71%
11%
22%
21%
48%
60%
63%
75%
12%
20%
22%
42%
61%
66%
76%
0% 10% 20% 30% 40% 50% 60% 70% 80% 90%
Enhances the timeliness of threat data
Reduces the cost of detecting and preventing cyber attacks
Makes threat data more actionable
Fosters collaboration among peers and industry groups
Improves situational awareness
Improves the security posture of the nation’s critical infrastructure
Improves the security posture of my organization
FY2017 FY2015 FY2014

Ponemon Institute: Private & Confidential Report 5
As in last year’s study, potential liability and the lack of trustworthiness of intelligence providers keep some organizations from fully participating. Last year 62 percent of respondents said the potential liability of sharing keeps their companies from only partially participating in a threat intelligence exchange program and this decreased slightly to 58 percent of respondents. Lack of trust in the sources of intelligence decreased from 60 percent of respondents last year to 57 percent of respondents this year. However, more respondents do see the exchange of threat intelligence as beneficial. Last year, 29 percent of respondents did not see these programs as a benefit. That has decreased to 26 percent of respondents in this years study. Figure 4. Reasons for only partial participation in the exchange of threat intelligence More than one response permitted
12%
18%
40%
30%
39%
53%
51%
55%
10%
14%
29%
30%
43%
60%
52%
62%
11%
17%
26%
28%
44%
57%
58%
58%
0% 10% 20% 30% 40% 50% 60% 70%
Cost
Lack of incentives
No perceived benefit to my organization
Anti-competitive concerns
Slow, manual sharing processes
Lack of trust in the sources of intelligence
Lack of resources
Potential liability of sharing
FY2017 FY2015 FY2014
Ponemon Institute: Private & Confidential Report 6
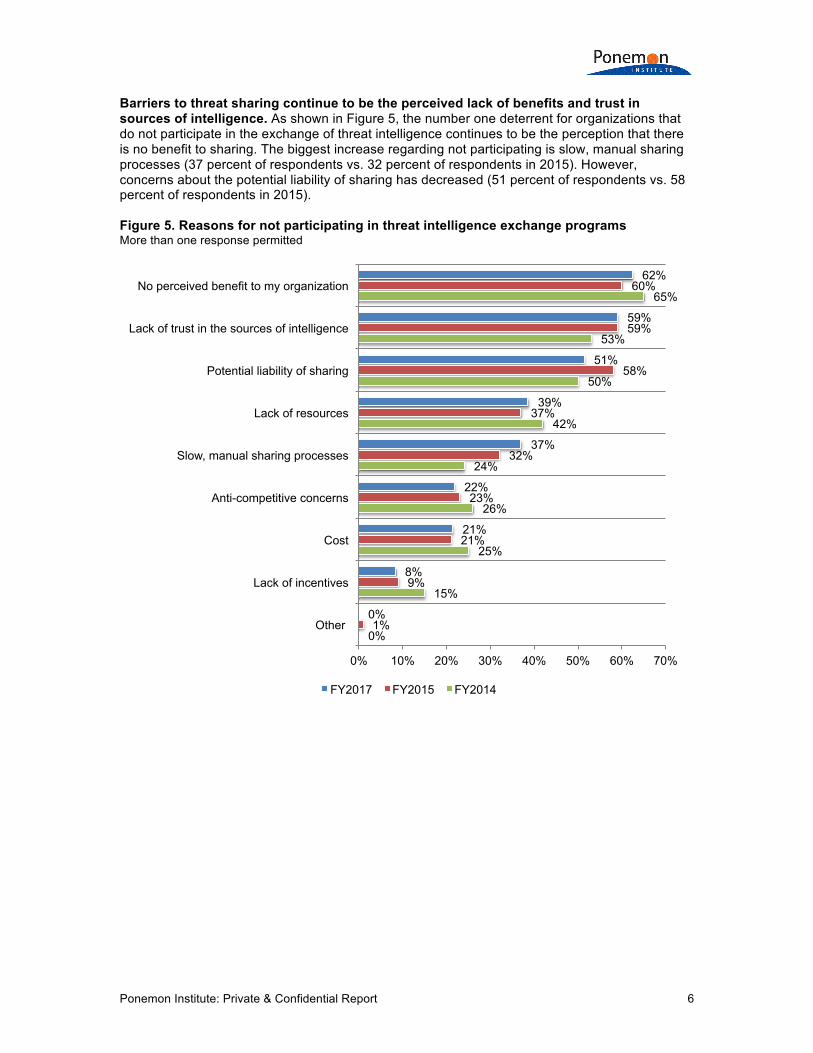
Barriers to threat sharing continue to be the perceived lack of benefits and trust in sources of intelligence. As shown in Figure 5, the number one deterrent for organizations that do not participate in the exchange of threat intelligence continues to be the perception that there is no benefit to sharing. The biggest increase regarding not participating is slow, manual sharing processes (37 percent of respondents vs. 32 percent of respondents in 2015). However, concerns about the potential liability of sharing has decreased (51 percent of respondents vs. 58 percent of respondents in 2015). Figure 5. Reasons for not participating in threat intelligence exchange programs More than one response permitted
0%
15%
25%
26%
24%
42%
50%
53%
65%
1%
9%
21%
23%
32%
37%
58%
59%
60%
0%
8%
21%
22%
37%
39%
51%
59%
62%
0% 10% 20% 30% 40% 50% 60% 70%
Other
Lack of incentives
Cost
Anti-competitive concerns
Slow, manual sharing processes
Lack of resources
Potential liability of sharing
Lack of trust in the sources of intelligence
No perceived benefit to my organization
FY2017 FY2015 FY2014
Ponemon Institute: Private & Confidential Report 7
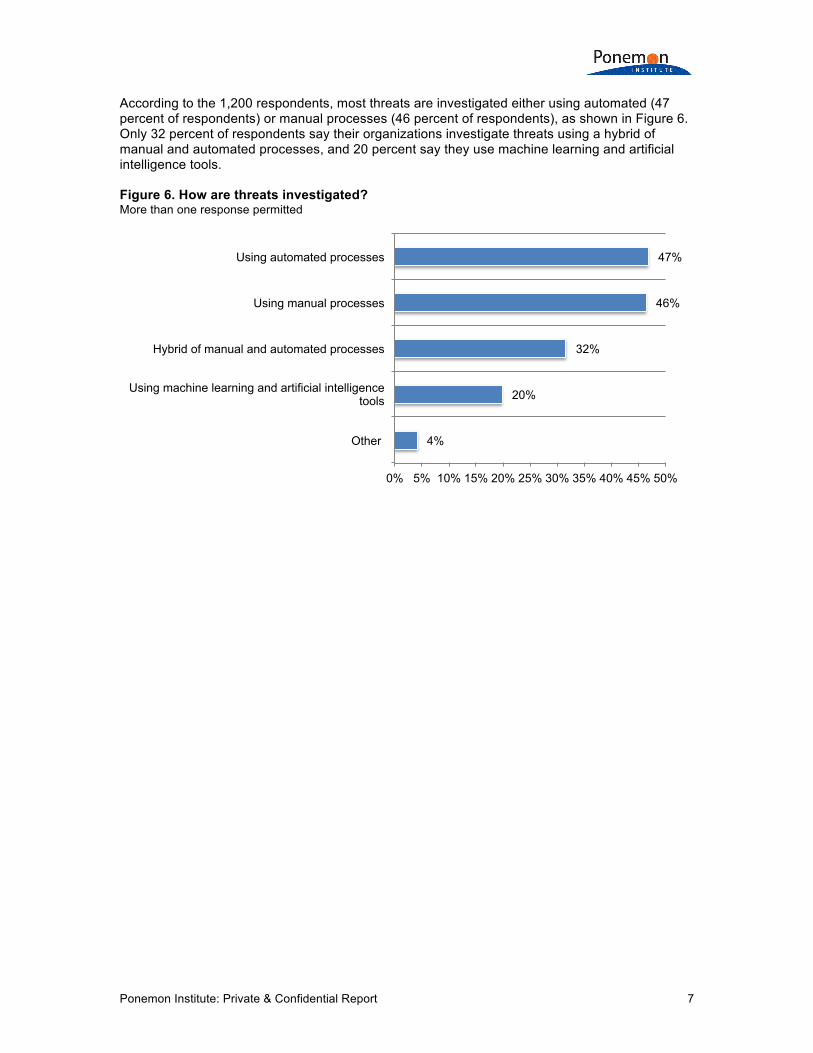
According to the 1,200 respondents, most threats are investigated either using automated (47 percent of respondents) or manual processes (46 percent of respondents), as shown in Figure 6. Only 32 percent of respondents say their organizations investigate threats using a hybrid of manual and automated processes, and 20 percent say they use machine learning and artificial intelligence tools. Figure 6. How are threats investigated? More than one response permitted
4%
20%
32%
46%
47%
0% 5% 10% 15% 20% 25% 30% 35% 40% 45% 50%
Other
Using machine learning and artificial intelligence tools
Hybrid of manual and automated processes
Using manual processes
Using automated processes
Ponemon Institute: Private & Confidential Report 8
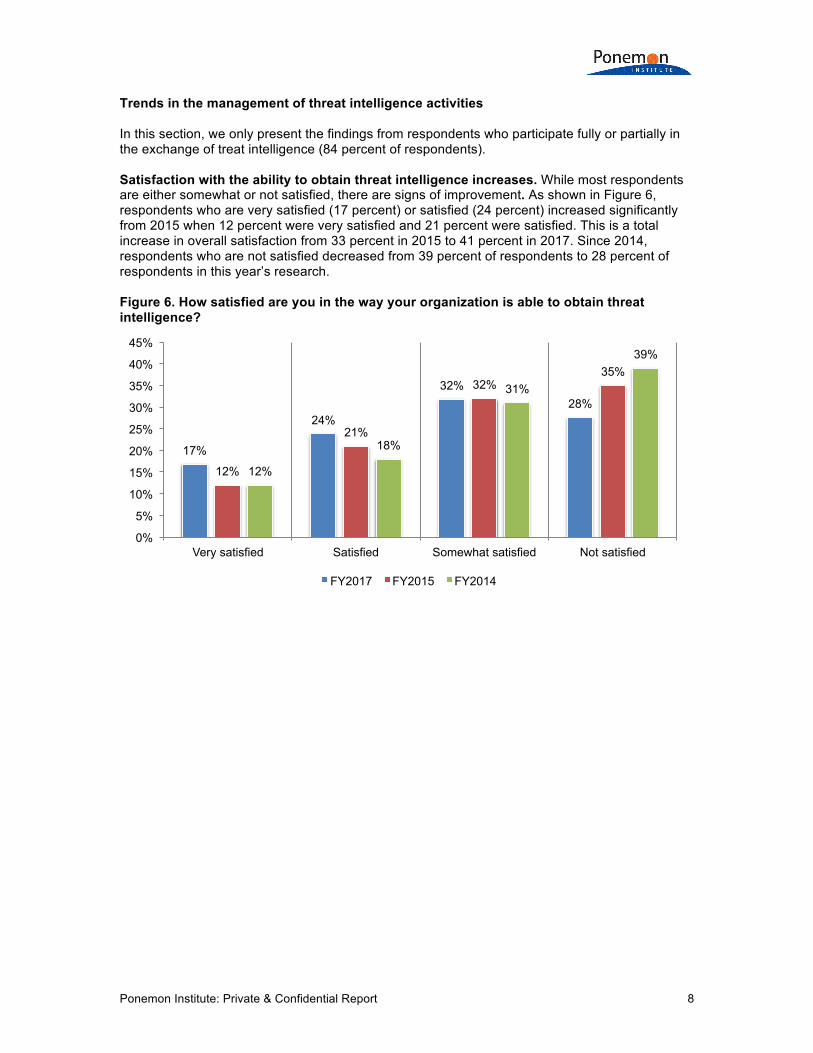
Trends in the management of threat intelligence activities In this section, we only present the findings from respondents who participate fully or partially in the exchange of treat intelligence (84 percent of respondents). Satisfaction with the ability to obtain threat intelligence increases. While most respondents are either somewhat or not satisfied, there are signs of improvement. As shown in Figure 6, respondents who are very satisfied (17 percent) or satisfied (24 percent) increased significantly from 2015 when 12 percent were very satisfied and 21 percent were satisfied. This is a total increase in overall satisfaction from 33 percent in 2015 to 41 percent in 2017. Since 2014, respondents who are not satisfied decreased from 39 percent of respondents to 28 percent of respondents in this year’s research. Figure 6. How satisfied are you in the way your organization is able to obtain threat intelligence?
17%
24%
32% 28%
12%
21%
32% 35%
12%
18%
31%
39%
0%
5%
10%
15%
20%
25%
30%
35%
40%
45%
Very satisfied Satisfied Somewhat satisfied Not satisfied
FY2017 FY2015 FY2014
Ponemon Institute: Private & Confidential Report 9
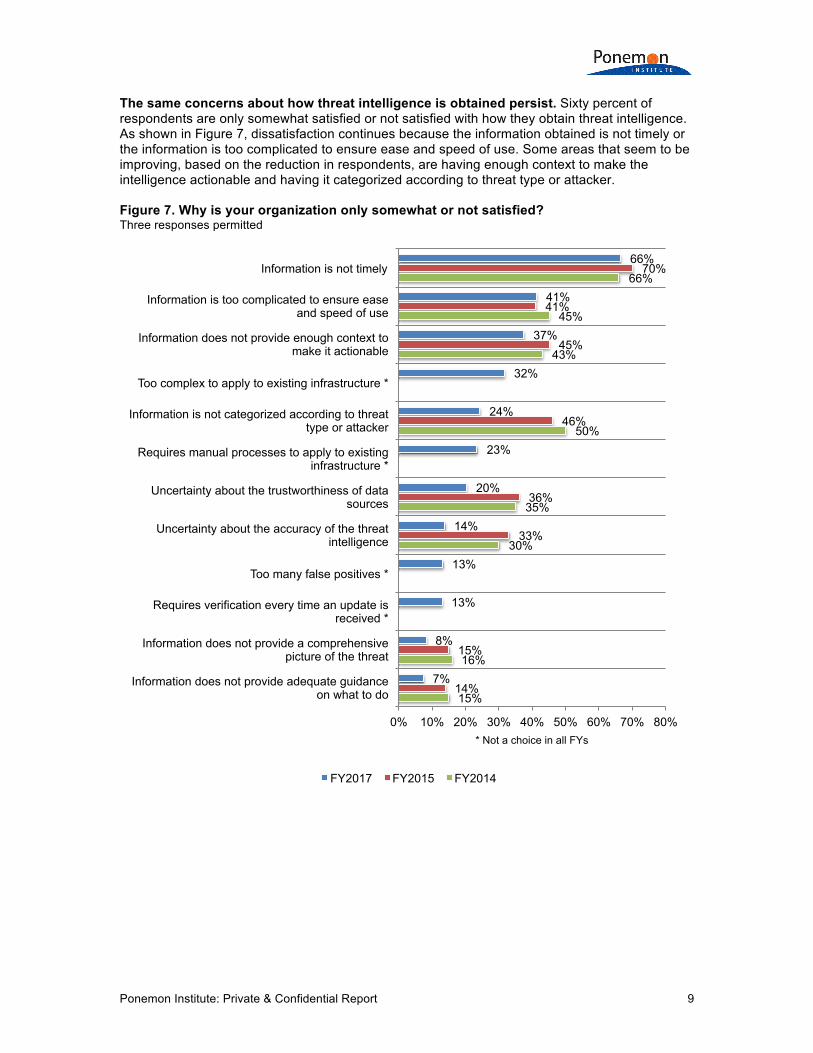
The same concerns about how threat intelligence is obtained persist. Sixty percent of respondents are only somewhat satisfied or not satisfied with how they obtain threat intelligence. As shown in Figure 7, dissatisfaction continues because the information obtained is not timely or the information is too complicated to ensure ease and speed of use. Some areas that seem to be improving, based on the reduction in respondents, are having enough context to make the intelligence actionable and having it categorized according to threat type or attacker. Figure 7. Why is your organization only somewhat or not satisfied? Three responses permitted
15%
16%
30%
35%
50%
43%
45%
66%
14%
15%
33%
36%
46%
45%
41%
70%
7%
8%
13%
13%
14%
20%
23%
24%
32%
37%
41%
66%
0% 10% 20% 30% 40% 50% 60% 70% 80%
Information does not provide adequate guidance on what to do
Information does not provide a comprehensive picture of the threat
Requires verification every time an update is received *
Too many false positives *
Uncertainty about the accuracy of the threat intelligence
Uncertainty about the trustworthiness of data sources
Requires manual processes to apply to existing infrastructure *
Information is not categorized according to threat type or attacker
Too complex to apply to existing infrastructure *
Information does not provide enough context to make it actionable
Information is too complicated to ensure ease and speed of use
Information is not timely
* Not a choice in all FYs
FY2017 FY2015 FY2014

Ponemon Institute: Private & Confidential Report 10
Threat intelligence that is paid for is considered better. Most of the respondents (67 percent) say their organizations are using a combination of paid and free sources (35 percent of respondents) and mostly paid subscriptions (32 percent of respondents). According to Figure 8, companies are using fee-based threat intelligence because they think it is better (79 percent of respondents), it has proven effective in stopping security incidents (59 percent of respondents) and they do not have confidence in free sources of intelligence (44 percent of respondents). Figure 8. Why does your organization pay for threat intelligence? More than one response permitted
Companies represented in this study have 11 separate subscriptions. As shown in Figure 9, most of the received threat intelligence feeds IDS/IPS and firewalls. Figure 9. The threat intelligence that we receive feeds the following security technologies in our organization More than one response permitted
2%
46%
35%
39%
68%
77%
1%
30%
33%
44%
59%
79%
0% 10% 20% 30% 40% 50% 60% 70% 80% 90%
Other
Free sources have not enabled our organization to prioritize threats
Free sources have not been able to provide a comprehensive picture of the threat
We don’t have confidence in free sources of threat intelligence
It has proven effective in stopping security incidents
Fee-based threat intelligence is better than free threat intelligence
FY2017 FY2015
68% 65%
48%
38% 37%
1% 0%
10%
20%
30%
40%
50%
60%
70%
80%
IDS/IPS Firewall SIEM DLP WAF Other

Ponemon Institute: Private & Confidential Report 11
More threat intelligence is being consumed but is the information effective in dealing with cyber threats? As discussed previously, over the past 12 months, 60 percent of respondents say the amount of threat intelligence their organizations have consumed has increased. When asked to rate the effectiveness of the threat intelligence received on a scale of 1 = low effectiveness to 10 = high effectiveness, very few believe it is effective in preventing cyber attacks. As shown in Figure 10, only 35 percent of respondents (31 percent last year) rate the intelligence as very effective in terms of accuracy, and only 24 percent of respondents say its real-time effectiveness is very high. Similarly, only 31 percent of respondents say threat intelligence is actionable. Figure 10. How effective is the accuracy, timeliness and ability to be actionable of threat intelligence? 1 = low effectiveness to 10 = high effectiveness, 7+ responses reported
28%
30%
21%
34%
31%
24%
31%
35%
0% 5% 10% 15% 20% 25% 30% 35% 40%
How timely is the intelligence received by your organization? *
How actionable is the intelligence received by your organization?
How accurate is the intelligence received by your organization?
* Not a response in FY2014
FY2017 FY2015 FY2014 *

Ponemon Institute: Private & Confidential Report 12
Threat indicators provide valuable intelligence. Seventy-three percent of respondents say they use threat indicators, and they consider the most valuable types of information, as shown in Figure 11, to be indicators of malicious IP addresses (69 percent of respondents) and indicators of malicious URLs (60 percent of respondents). Indicators of compromise decreased in its value since last year (56 percent of respondents vs. 66 percent of respondents). Figure 11. If your organization uses threat indicators, what information is most valuable? More than one response permitted
7%
39%
48%
47%
59%
66%
55%
64%
6%
27%
38%
46%
47%
48%
56%
56%
58%
60%
69%
0% 10% 20% 30% 40% 50% 60% 70% 80%
Other
Newly observed domains *
Malicious mobile apps
Malicious files
Malicious host names *
Suspicious phishing and spoofing sites
Malicious malware
Indicators of compromise
Malicious domains *
Malicious URLs
Malicious IP addresses
* Not a response in FY2015
FY2017 FY2015

Ponemon Institute: Private & Confidential Report 13
The management of threat intelligence continues to be more centralized and controlled by a dedicated team. According to respondents, the most important goals for a threat intelligence program are to enhance overall security posture, improve incident response and quickly detect attacks. As shown in Figure 12, centralized control by a dedicated team has continued to increase since 2014. Figure 12. What statement best describes how threat intelligence is managed within your organization? Only one response permitted
1%
9%
11%
21%
30%
28%
0%
9%
8%
21%
27%
35%
0%
6%
6%
22%
27%
39%
0% 5% 10% 15% 20% 25% 30% 35% 40% 45%
Other
Decentralized control by a dedicated team
Centralized control within non-IT business function
Decentralized control within the line of business
Centralized control within IT
Centralized control by a dedicated team
FY2017 FY2015 FY2014
Ponemon Institute: Private & Confidential Report 14
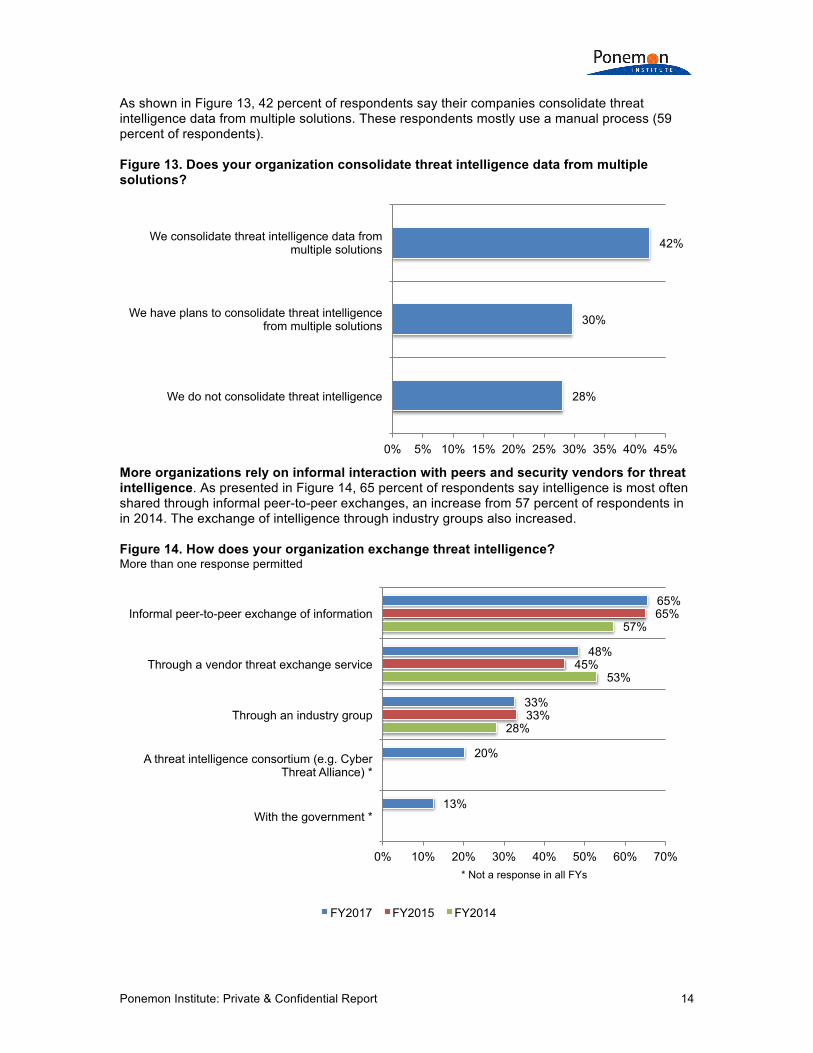
As shown in Figure 13, 42 percent of respondents say their companies consolidate threat intelligence data from multiple solutions. These respondents mostly use a manual process (59 percent of respondents). Figure 13. Does your organization consolidate threat intelligence data from multiple solutions?
More organizations rely on informal interaction with peers and security vendors for threat intelligence. As presented in Figure 14, 65 percent of respondents say intelligence is most often shared through informal peer-to-peer exchanges, an increase from 57 percent of respondents in in 2014. The exchange of intelligence through industry groups also increased. Figure 14. How does your organization exchange threat intelligence? More than one response permitted
28%
30%
42%
0% 5% 10% 15% 20% 25% 30% 35% 40% 45%
We do not consolidate threat intelligence
We have plans to consolidate threat intelligence from multiple solutions
We consolidate threat intelligence data from multiple solutions
28%
53%
57%
33%
45%
65%
13%
20%
33%
48%
65%
0% 10% 20% 30% 40% 50% 60% 70%
With the government *
A threat intelligence consortium (e.g. Cyber Threat Alliance) *
Through an industry group
Through a vendor threat exchange service
Informal peer-to-peer exchange of information
* Not a response in all FYs
FY2017 FY2015 FY2014
Ponemon Institute: Private & Confidential Report 15
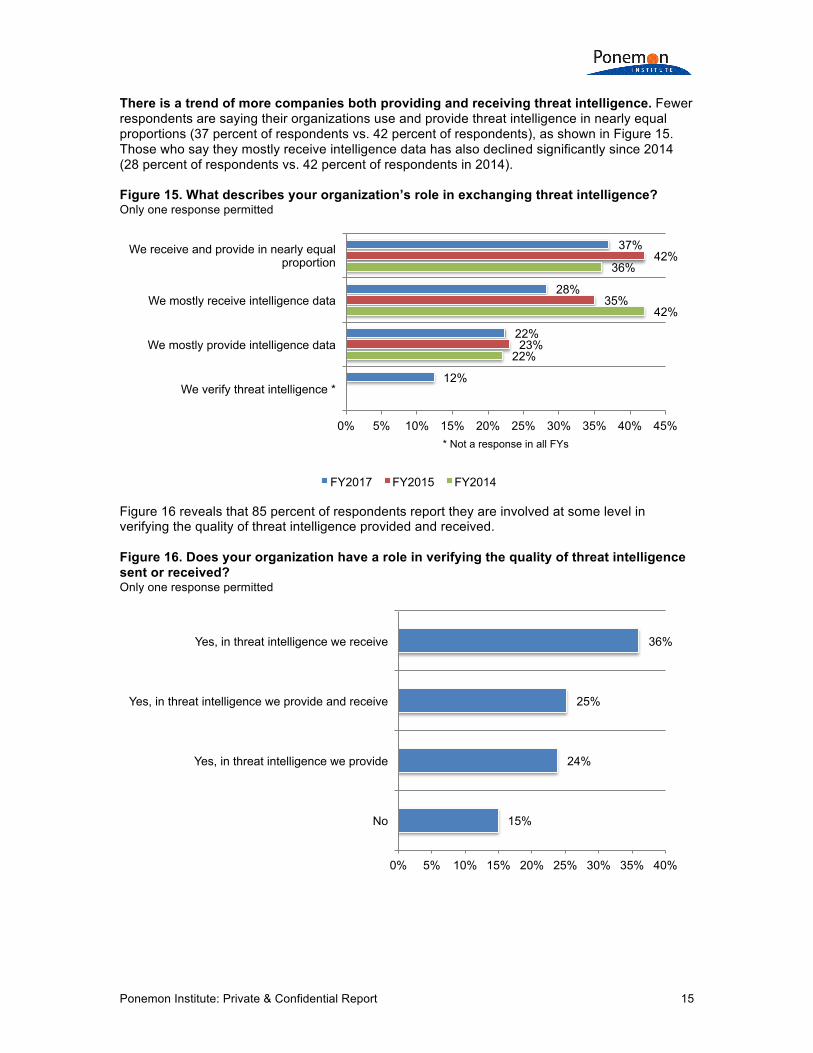
There is a trend of more companies both providing and receiving threat intelligence. Fewer respondents are saying their organizations use and provide threat intelligence in nearly equal proportions (37 percent of respondents vs. 42 percent of respondents), as shown in Figure 15. Those who say they mostly receive intelligence data has also declined significantly since 2014 (28 percent of respondents vs. 42 percent of respondents in 2014). Figure 15. What describes your organization’s role in exchanging threat intelligence? Only one response permitted
Figure 16 reveals that 85 percent of respondents report they are involved at some level in verifying the quality of threat intelligence provided and received. Figure 16. Does your organization have a role in verifying the quality of threat intelligence sent or received? Only one response permitted
22%
42%
36%
23%
35%
42%
12%
22%
28%
37%
0% 5% 10% 15% 20% 25% 30% 35% 40% 45%
We verify threat intelligence *
We mostly provide intelligence data
We mostly receive intelligence data
We receive and provide in nearly equal proportion
* Not a response in all FYs
FY2017 FY2015 FY2014
15%
24%
25%
36%
0% 5% 10% 15% 20% 25% 30% 35% 40%
No
Yes, in threat intelligence we provide
Yes, in threat intelligence we provide and receive
Yes, in threat intelligence we receive
Ponemon Institute: Private & Confidential Report 16
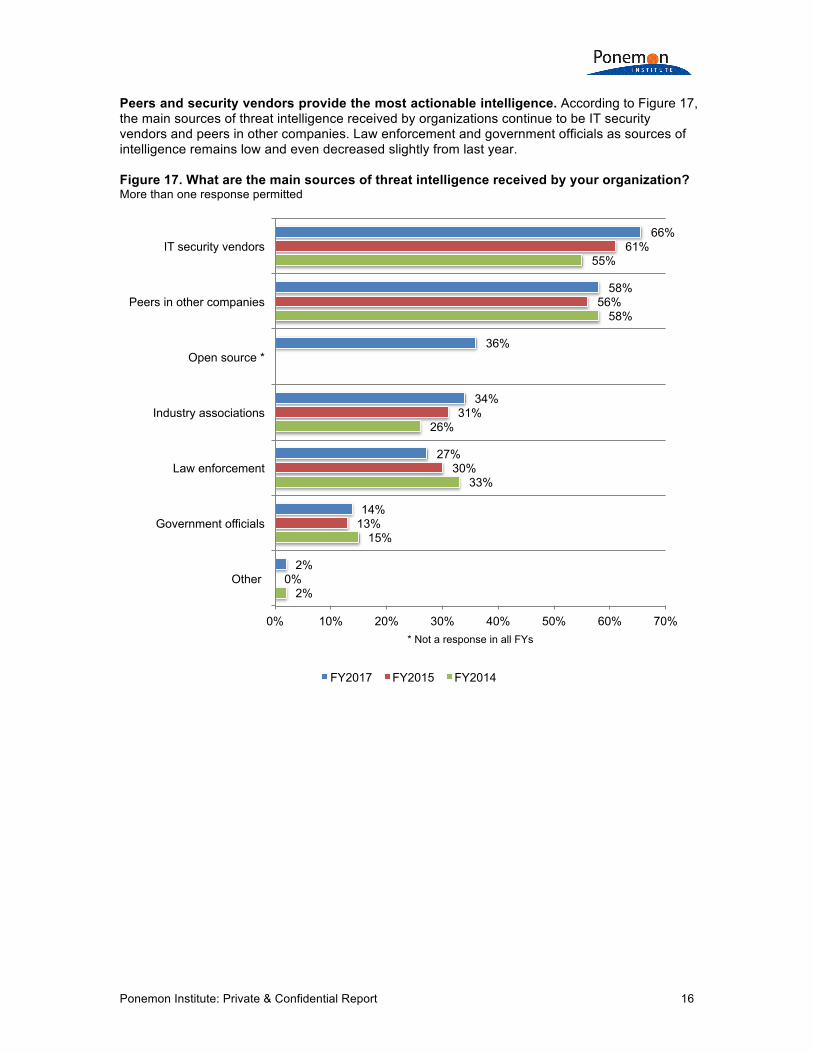
Peers and security vendors provide the most actionable intelligence. According to Figure 17, the main sources of threat intelligence received by organizations continue to be IT security vendors and peers in other companies. Law enforcement and government officials as sources of intelligence remains low and even decreased slightly from last year. Figure 17. What are the main sources of threat intelligence received by your organization? More than one response permitted
2%
15%
33%
26%
58%
55%
0%
13%
30%
31%
56%
61%
2%
14%
27%
34%
36%
58%
66%
0% 10% 20% 30% 40% 50% 60% 70%
Other
Government officials
Law enforcement
Industry associations
Open source *
Peers in other companies
IT security vendors
* Not a response in all FYs
FY2017 FY2015 FY2014

Ponemon Institute: Private & Confidential Report 17
To disseminate threat intelligence through the network, the majority of respondents use alerts to feed the security infrastructure. According to Figure 18, most respondents say threat intelligence is disseminated internally through alerts and IDS. Security analysts (79 percent of respondents), threat intelligence teams (72 percent of respondents) and security operations (65 percent of respondents) are mostly using threat intelligence. Figure 18. What best describes how threat intelligence is being used and disseminated in the network? More than one response permitted
4%
27%
31%
32%
38%
50%
55%
57%
70%
0% 10% 20% 30% 40% 50% 60% 70% 80%
Other
UTM
Web portal
NGFW
DNS/RPZ
SIEM
IPS
IDS
Alerts

Ponemon Institute: Private & Confidential Report 18
According to the research, more respondents this year (68 percent vs. 61 percent in 2015) say the information contained in intelligence reports are threat indicators such as suspicious hostnames, IP addresses and file hashes, as shown in Figure 19. Software vulnerability patch updates have increased significantly since 2014 (56 percent of respondents vs. 48 percent of respondents). Figure 19. What information is contained in threat intelligence reports? More than one response permitted
As presented in Figure 20, data feeds are the most common way to receive threat intelligence (65 percent of respondents) followed by the exchange of threat intelligence with other companies (61 percent of respondents). Figure 20. How is threat intelligence received by their organization? More than one response permitted
3%
22%
36%
48%
55%
1%
20%
28%
35%
53%
61%
2%
23%
31%
40%
56%
68%
0% 10% 20% 30% 40% 50% 60% 70% 80%
Other
Results of cybercrime investigations and prosecutions
Tactics, Techniques & Procedure Reports (TTP)*
Incident response information
Software vulnerability patch updates
Threat indicators such as suspicious hostnames, IP addresses, file hashes
* Not a response in FY2014
FY2017 FY2015 FY2014
32%
38%
49%
49%
51%
61%
65%
0% 10% 20% 30% 40% 50% 60% 70%
Text files
API to a cloud-based service
Threat advisories
STIX/TAXI
Internal collection and analysis
Exchange of threat intelligence with other companies
Data feeds from external sources
Ponemon Institute: Private & Confidential Report 19
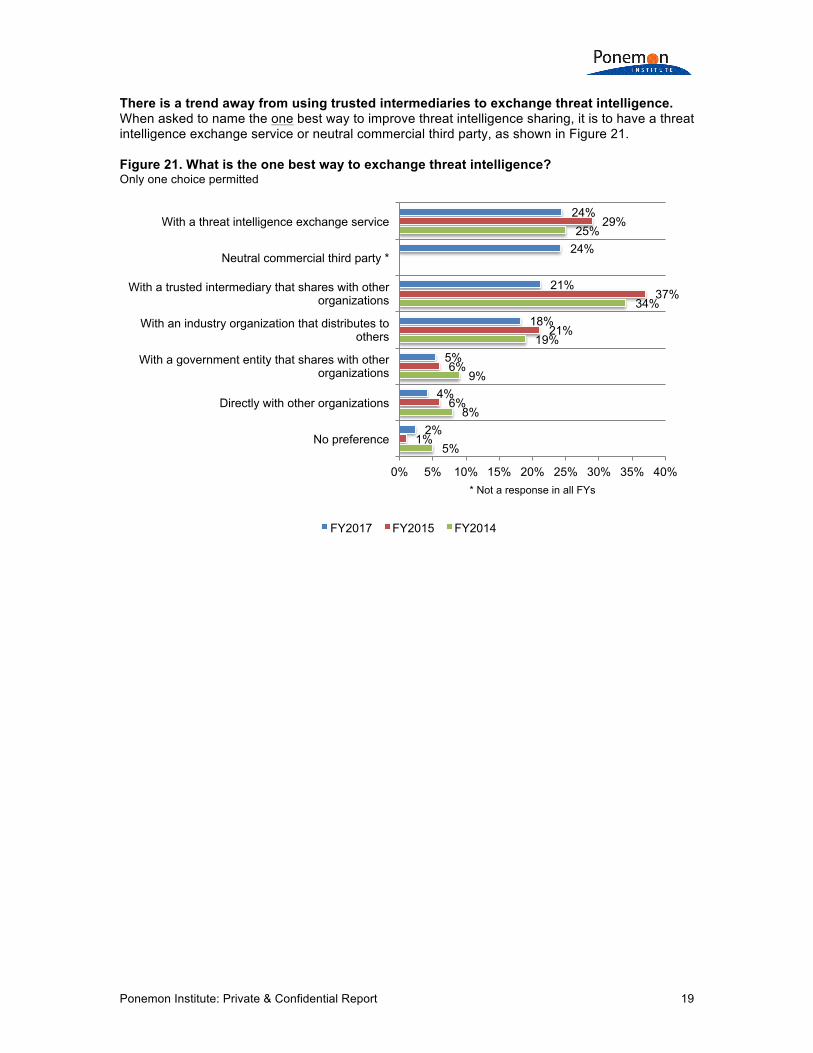
There is a trend away from using trusted intermediaries to exchange threat intelligence. When asked to name the one best way to improve threat intelligence sharing, it is to have a threat intelligence exchange service or neutral commercial third party, as shown in Figure 21. Figure 21. What is the one best way to exchange threat intelligence? Only one choice permitted
5%
8%
9%
19%
34%
25%
1%
6%
6%
21%
37%
29%
2%
4%
5%
18%
21%
24%
24%
0% 5% 10% 15% 20% 25% 30% 35% 40%
No preference
Directly with other organizations
With a government entity that shares with other organizations
With an industry organization that distributes to others
With a trusted intermediary that shares with other organizations
Neutral commercial third party *
With a threat intelligence exchange service
* Not a response in all FYs
FY2017 FY2015 FY2014

Ponemon Institute: Private & Confidential Report 20
Internal silos prevent more effective collaboration in the exchange of threat intelligence. Only 33 percent of respondents say the collaboration between their organization and other companies in the exchange of threat intelligence is either very effective or effective. The biggest barrier to the exchange of threat intelligence is the existence of silos among IT departments and lines of business, as shown in Figure 22. This finding indicates the importance of a centralized program controlled by a dedicated team. Figure 22. Why is collaboration in exchanging threat intelligence with other organizations not effective? More than one response permitted
2%
29%
49%
50%
55%
68%
1%
27%
44%
52%
49%
69%
2%
19%
21%
22%
27%
30%
46%
49%
55%
65%
0% 10% 20% 30% 40% 50% 60% 70% 80%
Other
Concerns about liability *
Concerns about risk *
Concerns about regulations *
Concerns about threat information becoming public *
Lack of leadership in overseeing collaboration
Insufficient resources
Concerns about trust
Lack of technologies or tools
Silos among IT departments and lines of business
* Not a response in all FYs
FY2017 FY2015 FY2014

Ponemon Institute: Private & Confidential Report 21
An effective defense against cyber attacks declines because of the lack of actionable intelligence. Respondents were asked to rate the effectiveness of their organization’s process for using actionable intelligence from both internal and external sources on a scale of 1 = low effectiveness to 10 = high effectiveness. As shown in Figure 23, only 31 percent rate their companies’ defense against cyber attacks as highly effective. Even worse, only 27 percent of respondents rate their process of using internal sources (such as configuration log activities) as highly effective. However, more respondents since last year rate the process for using actionable intelligence from external sources (such as vendor-supplied threat feeds) to predict malicious activities as highly effective (30 percent of respondents vs. 21 percent of respondents). Figure 23. How effective is your organization’s cyber defense and how effective are your processes for using threat intelligence from internal and external sources? 1 = low effectiveness to 10 = high effectiveness, 7+ responses reported
23%
21%
38%
27%
30%
31%
0% 5% 10% 15% 20% 25% 30% 35% 40%
Effectiveness of process for using actionable intelligence from internal sources to predict
malicious activities
Effectiveness of process for using actionable intelligence from external sources to predict
malicious activities
Effectiveness of defense against cyber attacks
FY2017 FY2015
Ponemon Institute: Private & Confidential Report 22
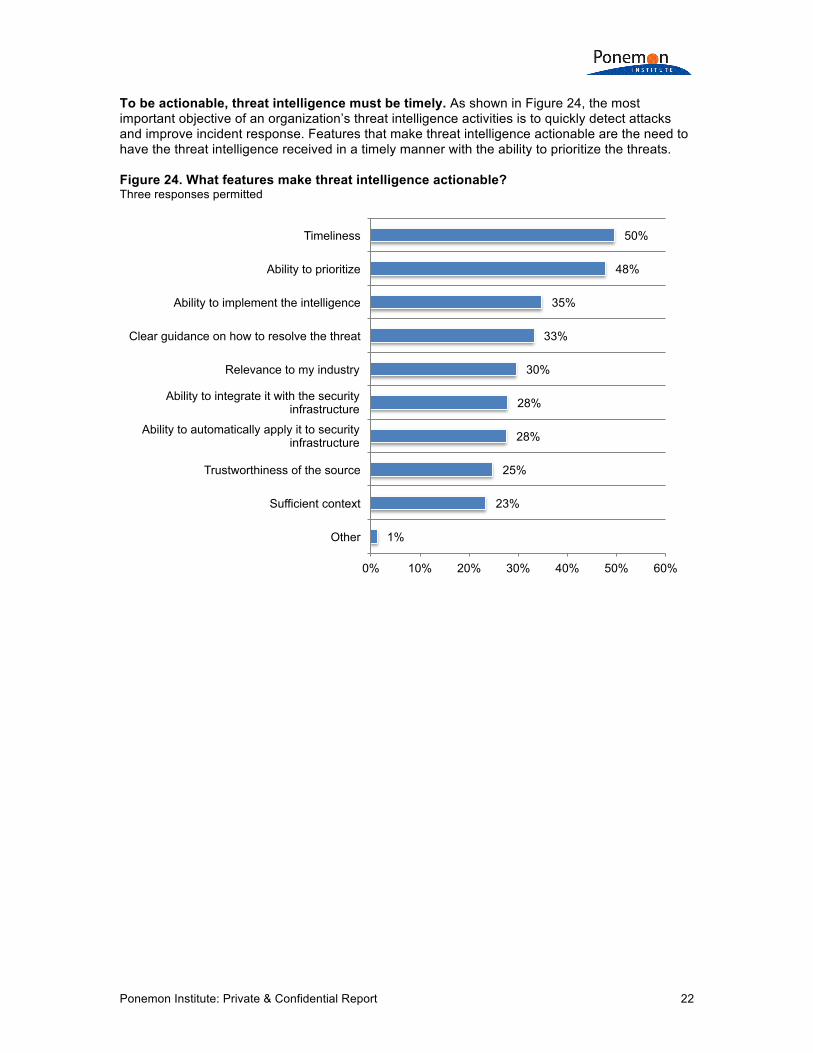
To be actionable, threat intelligence must be timely. As shown in Figure 24, the most important objective of an organization’s threat intelligence activities is to quickly detect attacks and improve incident response. Features that make threat intelligence actionable are the need to have the threat intelligence received in a timely manner with the ability to prioritize the threats. Figure 24. What features make threat intelligence actionable? Three responses permitted
1%
23%
25%
28%
28%
30%
33%
35%
48%
50%
0% 10% 20% 30% 40% 50% 60%
Other
Sufficient context
Trustworthiness of the source
Ability to automatically apply it to security infrastructure
Ability to integrate it with the security infrastructure
Relevance to my industry
Clear guidance on how to resolve the threat
Ability to implement the intelligence
Ability to prioritize
Timeliness
Ponemon Institute: Private & Confidential Report 23
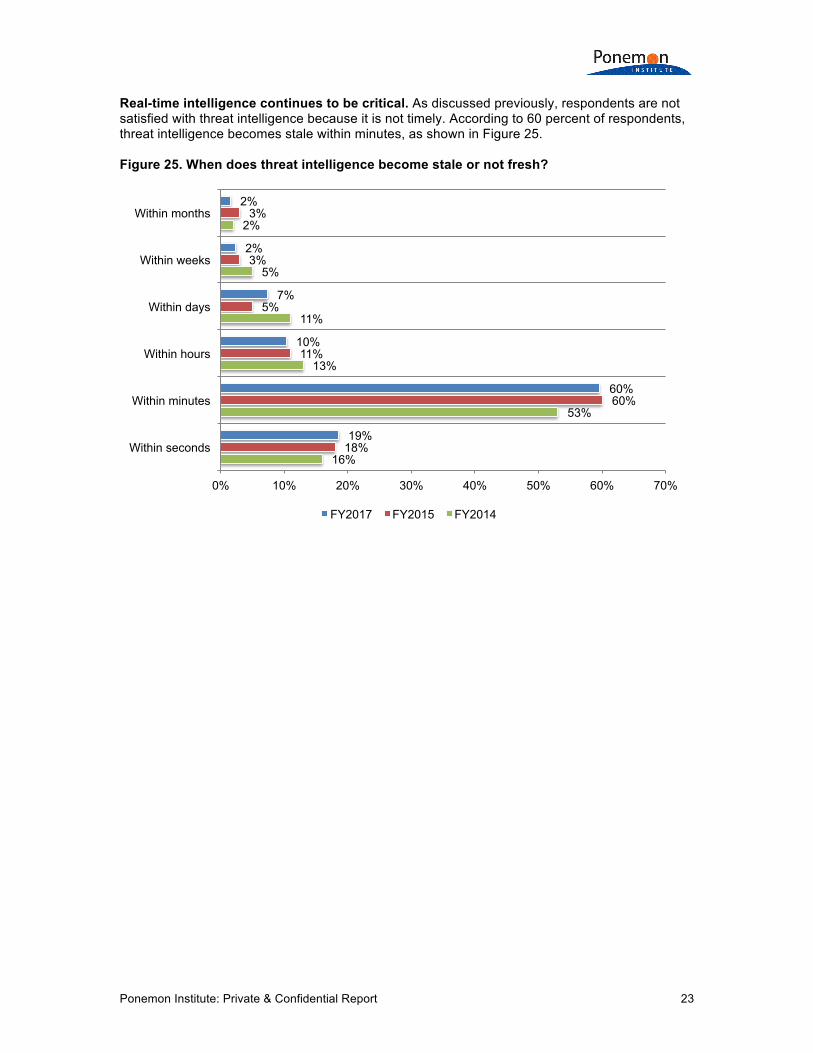
Real-time intelligence continues to be critical. As discussed previously, respondents are not satisfied with threat intelligence because it is not timely. According to 60 percent of respondents, threat intelligence becomes stale within minutes, as shown in Figure 25. Figure 25. When does threat intelligence become stale or not fresh?
16%
53%
13%
11%
5%
2%
18%
60%
11%
5%
3%
3%
19%
60%
10%
7%
2%
2%
0% 10% 20% 30% 40% 50% 60% 70%
Within seconds
Within minutes
Within hours
Within days
Within weeks
Within months
FY2017 FY2015 FY2014
Ponemon Institute: Private & Confidential Report 24
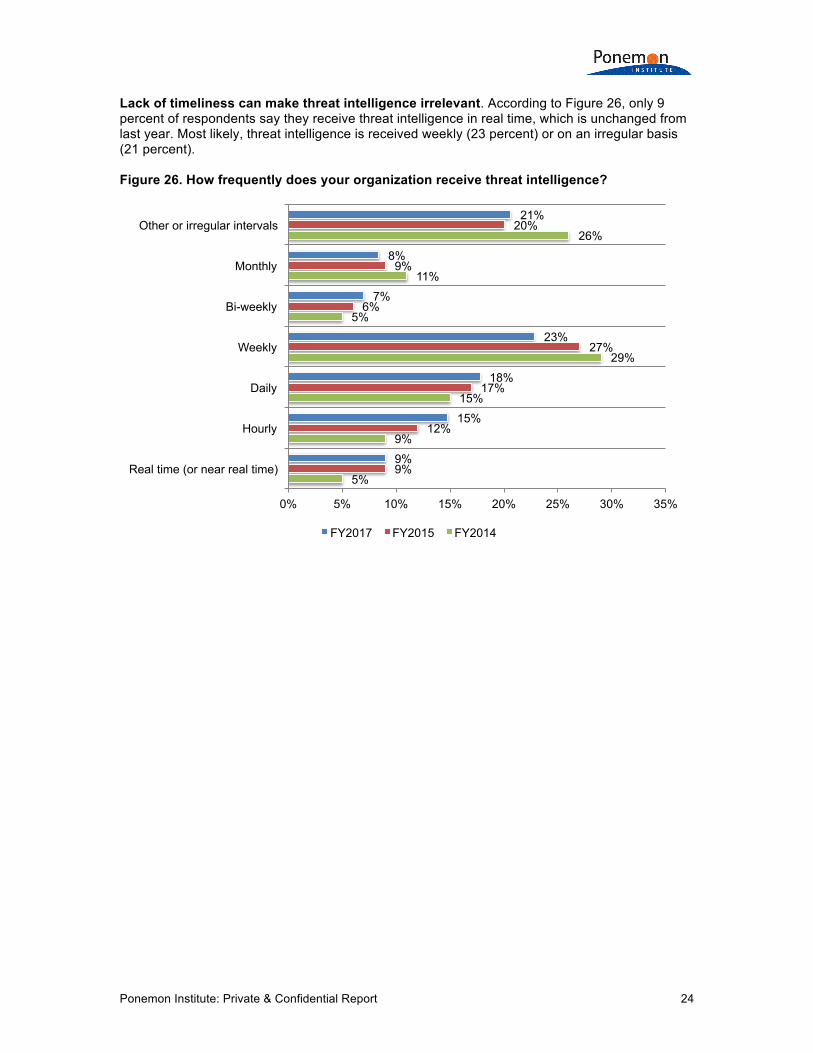
Lack of timeliness can make threat intelligence irrelevant. According to Figure 26, only 9 percent of respondents say they receive threat intelligence in real time, which is unchanged from last year. Most likely, threat intelligence is received weekly (23 percent) or on an irregular basis (21 percent). Figure 26. How frequently does your organization receive threat intelligence?
5%
9%
15%
29%
5%
11%
26%
9%
12%
17%
27%
6%
9%
20%
9%
15%
18%
23%
7%
8%
21%
0% 5% 10% 15% 20% 25% 30% 35%
Real time (or near real time)
Hourly
Daily
Weekly
Bi-weekly
Monthly
Other or irregular intervals
FY2017 FY2015 FY2014

Ponemon Institute: Private & Confidential Report 25
Measuring the quality and risk of threat intelligence Only 41 percent of respondents say their organizations evaluate the quality of the threat intelligence provider and the information received. Companies that do such an evaluation rely on certain metrics presented in Figure 27. These are the ability to prioritize threat intelligence and timely delivery of threat intelligence (61 percent of respondents and 53 percent of respondents, respectively). Figure 27. What metrics do you use to evaluate the quality of the threat intelligence provider and the information received? More than one response permitted
3%
20%
24%
25%
27%
30%
39%
49%
49%
53%
61%
0% 10% 20% 30% 40% 50% 60% 70%
Other
Trustworthiness of the source of threat intelligence
Clear guidance on how to resolve the threat
Relevance of threat intelligence to my industry
Provides sufficient context
Ability to automatically apply threat intelligence to security infrastructure
Consolidates threat intelligence on a single platform
Minimum number of false positives
Ability to implement the intelligence
Timely delivery of threat intelligence
Ability to prioritize threat intelligence
Ponemon Institute: Private & Confidential Report 26
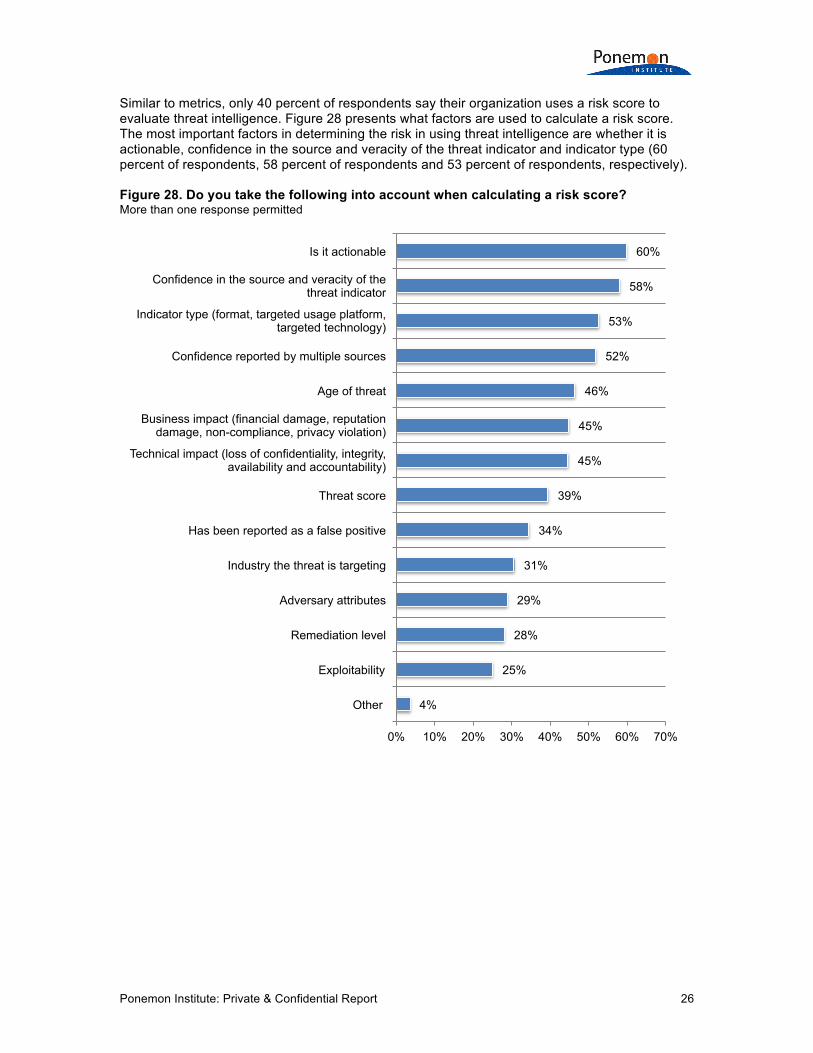
Similar to metrics, only 40 percent of respondents say their organization uses a risk score to evaluate threat intelligence. Figure 28 presents what factors are used to calculate a risk score. The most important factors in determining the risk in using threat intelligence are whether it is actionable, confidence in the source and veracity of the threat indicator and indicator type (60 percent of respondents, 58 percent of respondents and 53 percent of respondents, respectively). Figure 28. Do you take the following into account when calculating a risk score? More than one response permitted
4%
25%
28%
29%
31%
34%
39%
45%
45%
46%
52%
53%
58%
60%
0% 10% 20% 30% 40% 50% 60% 70%
Other
Exploitability
Remediation level
Adversary attributes
Industry the threat is targeting
Has been reported as a false positive
Threat score
Technical impact (loss of confidentiality, integrity, availability and accountability)
Business impact (financial damage, reputation damage, non-compliance, privacy violation)
Age of threat
Confidence reported by multiple sources
Indicator type (format, targeted usage platform, targeted technology)
Confidence in the source and veracity of the threat indicator
Is it actionable

Ponemon Institute: Private & Confidential Report 27
Forty-five percent of respondents say their organizations are using their threat intelligence program to define and rank levels of risk. As shown in Figure 29, the primary indicators of risk are uncertainty about the accuracy of threat intelligence and overall decline in the quality of providers’ services. Figure 29. What are indicators of risk? More than one response permitted
5%
35%
38%
43%
47%
51%
62%
66%
0% 10% 20% 30% 40% 50% 60% 70%
Other
Poor decisions because of complications
Discovery that the provider is using a subcontractor that has access to our company’s
information
Turnover of the vendor’s key personnel
Poor decisions because of the lack of trustworthiness
Poor decisions because of accuracy of the threat intelligence
Overall decline in the quality of the provider’s services
Uncertainty about the accuracy of threat intelligence

Ponemon Institute: Private & Confidential Report 28
Part 3. Methods This year’s research included respondents from EMEA. A sampling frame of 31,646 experienced IT and IT security practitioners located in the United States and EMEA were selected as participants to this survey. To ensure knowledgeable responses, all participants in this research are familiar and involved in their company’s cyber threat intelligence activities or process. Table 1 shows 1,345 total returns. Screening and reliability checks required the removal of 145 surveys. Our final sample consisted of 1,200 surveys (3.8 percent response rate). Table 1. Sample response FY2017 FY2015 FY2014 Total sampling frame 31,646 18,705 19,915 Total returns 1,345 785 808 Rejected or screened surveys 145 93 107 Final sample 1,200 692 701 Response rate 3.8% 3.7% 3.5%
Pie Chart 1 reports the respondent’s organizational level within participating organizations. By design, more than half of respondents (57 percent) are at or above the supervisory levels. Pie Chart 1. Current position within the organization
Pie Chart 2 reports that 50 percent of respondents reported their job function as being located within corporate IT. Twenty percent are located within the line of business. Pie Chart 2. Department or function that best describes where respondents are located
3% 2%
14%
22%
16%
34%
7% 2%
Senior Executive
Vice President
Director
Manager
Supervisor
Technician
Staff
Contractor
50%
20%
17%
7% 2% 2% 2%
Corporate IT
Line of business
Security (CSO & CISO)
Risk management
General management
Legal & compliance
Other

Ponemon Institute: Private & Confidential Report 29
Pie Chart 3 reports the industry focus of respondents’ organizations. This chart identifies financial services (17 percent) as the largest segment, followed by public sector (12 percent). Pie Chart 3. Industry focus of respondents’ organizations
Fifty-three percent of respondents are from organizations with a global headcount of more than 1,000 employees, as shown in Pie Chart 4.
Pie Chart 4. Worldwide headcount of the organization
17%
12%
10%
10% 10%
9%
8%
5%
5%
3% 3%
2% 2% 5% Financial services Public sector Services Industrial Health & pharmaceuticals Retail Technology & software Consumer products Energy & utilities Hospitality Communications Education & research Transportation Other
10%
15%
22%
23%
11%
9%
4% 6%
Less than 250
250 to 500
501 to 1,000
1,001 to 5,000
5,001 to 25,000
25,001 to 50,000
50,001 to 75,000
More than 75,000

Ponemon Institute: Private & Confidential Report 30
When asked where the employees are located, 89 percent of respondents indicated Europe, and 82 percent indicated the United States. Figure 30. Location of employees More than one response permitted
89% 82%
68% 64%
54% 52%
0%
10%
20%
30%
40%
50%
60%
70%
80%
90%
100%
Europe United States Canada Asia-Pacific Latin America (including Mexico)
Middle east & Africa

Ponemon Institute: Private & Confidential Report 31
Part 4. Caveats to this study There are inherent limitations to survey research that need to be carefully considered before drawing inferences from findings. The following items are specific limitations that are germane to most Web-based surveys. ! Non-response bias: The current findings are based on a sample of survey returns. We sent
surveys to a representative sample of individuals, resulting in a large number of usable returned responses. Despite non-response tests, it is always possible that individuals who did not participate are substantially different in terms of underlying beliefs from those who completed the instrument.
! Sampling-frame bias: The accuracy is based on contact information and the degree to which
the list is representative of individuals who are IT or IT security practitioners. We also acknowledge that the results may be biased by external events such as media coverage. Finally, because we used a Web-based collection method, it is possible that non-Web responses by mailed survey or telephone call would result in a different pattern of findings.
! Self-reported results: The quality of survey research is based on the integrity of confidential
responses received from subjects. While certain checks and balances can be incorporated into the survey process, there is always the possibility that a subject did not provide accurate responses.
Ponemon Institute: Private & Confidential Report 32
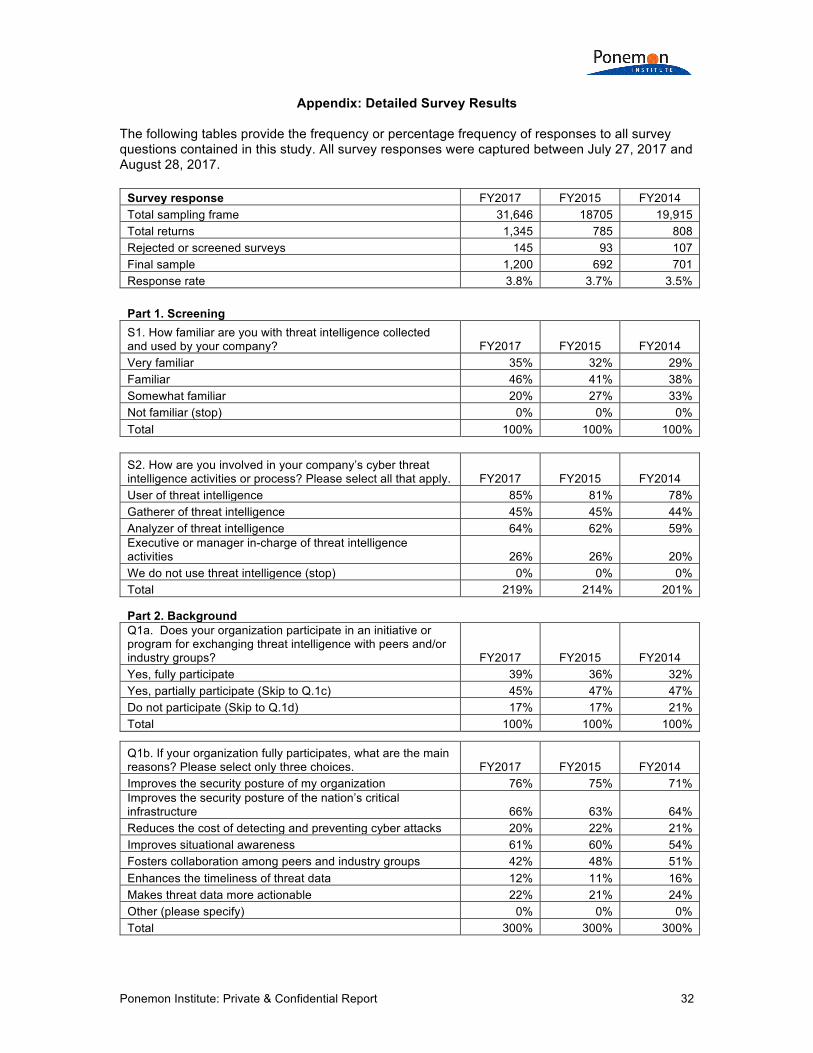
Appendix: Detailed Survey Results
The following tables provide the frequency or percentage frequency of responses to all survey questions contained in this study. All survey responses were captured between July 27, 2017 and August 28, 2017.
Survey response FY2017 FY2015 FY2014 Total sampling frame 31,646 18705 19,915 Total returns 1,345 785 808 Rejected or screened surveys 145 93 107 Final sample 1,200 692 701 Response rate 3.8% 3.7% 3.5%
Part 1. Screening S1. How familiar are you with threat intelligence collected
and used by your company? FY2017 FY2015 FY2014 Very familiar 35% 32% 29% Familiar 46% 41% 38% Somewhat familiar 20% 27% 33% Not familiar (stop) 0% 0% 0% Total 100% 100% 100%
S2. How are you involved in your company’s cyber threat intelligence activities or process? Please select all that apply. FY2017 FY2015 FY2014 User of threat intelligence 85% 81% 78% Gatherer of threat intelligence 45% 45% 44% Analyzer of threat intelligence 64% 62% 59% Executive or manager in-charge of threat intelligence activities 26% 26% 20% We do not use threat intelligence (stop) 0% 0% 0% Total 219% 214% 201%
Part 2. Background Q1a. Does your organization participate in an initiative or
program for exchanging threat intelligence with peers and/or industry groups? FY2017 FY2015 FY2014 Yes, fully participate 39% 36% 32% Yes, partially participate (Skip to Q.1c) 45% 47% 47% Do not participate (Skip to Q.1d) 17% 17% 21% Total 100% 100% 100%
Q1b. If your organization fully participates, what are the main reasons? Please select only three choices. FY2017 FY2015 FY2014 Improves the security posture of my organization 76% 75% 71% Improves the security posture of the nation’s critical infrastructure 66% 63% 64% Reduces the cost of detecting and preventing cyber attacks 20% 22% 21% Improves situational awareness 61% 60% 54% Fosters collaboration among peers and industry groups 42% 48% 51% Enhances the timeliness of threat data 12% 11% 16% Makes threat data more actionable 22% 21% 24% Other (please specify) 0% 0% 0% Total 300% 300% 300%

Ponemon Institute: Private & Confidential Report 33
Q1c. If your organization only partially participates in such an initiative, what are the main reasons keeping you from full participation? Please select only three choices. FY2017 FY2015 FY2014 Cost 11% 10% 12% Potential liability of sharing 58% 62% 55% Anti-competitive concerns 28% 30% 30% Lack of resources 58% 52% 51% Lack of incentives 17% 14% 18% No perceived benefit to my organization 26% 29% 40% Slow, manual sharing processes 44% 43% 39% Lack of trust in the sources of intelligence 57% 60% 53% Other (please specify) 0% 0% 2% Total 300% 300% 300%
Q1d. If your organization does not participate, what are the main reasons? Please select only three choices. FY2017 FY2015 FY2014 Cost 21% 21% 25% Potential liability of sharing 51% 58% 50% Anti-competitive concerns 22% 23% 26% Lack of resources 39% 37% 42% Lack of incentives 8% 9% 15% No perceived benefit to my organization 62% 60% 65% Slow, manual sharing processes 37% 32% 24% Lack of trust in the sources of intelligence 59% 59% 53% Other (please specify) 0% 1% 0% Total 300% 300% 300% (Proceed to Part 5)
Q2. Please check one statement that best describes how threat intelligence is managed within your organization. FY2017 FY2015 FY2014 Centralized control within IT 27% 27% 30% Centralized control within non-IT business function 6% 8% 11% Centralized control by a dedicated team 39% 35% 28% Decentralized control by a dedicated team 6% 9% 9% Decentralized control within the line of business 22% 21% 21% Other (please specify) 0% 0% 1% Total 100% 100% 100%
Q3a. Does your organization consolidate threat intelligence data from multiple solutions? FY2017
We consolidate threat intelligence data from multiple solutions 42%
We have plans to consolidate threat intelligence from multiple solutions 30%
We do not consolidate threat intelligence 28% Total 100%
Ponemon Institute: Private & Confidential Report 34
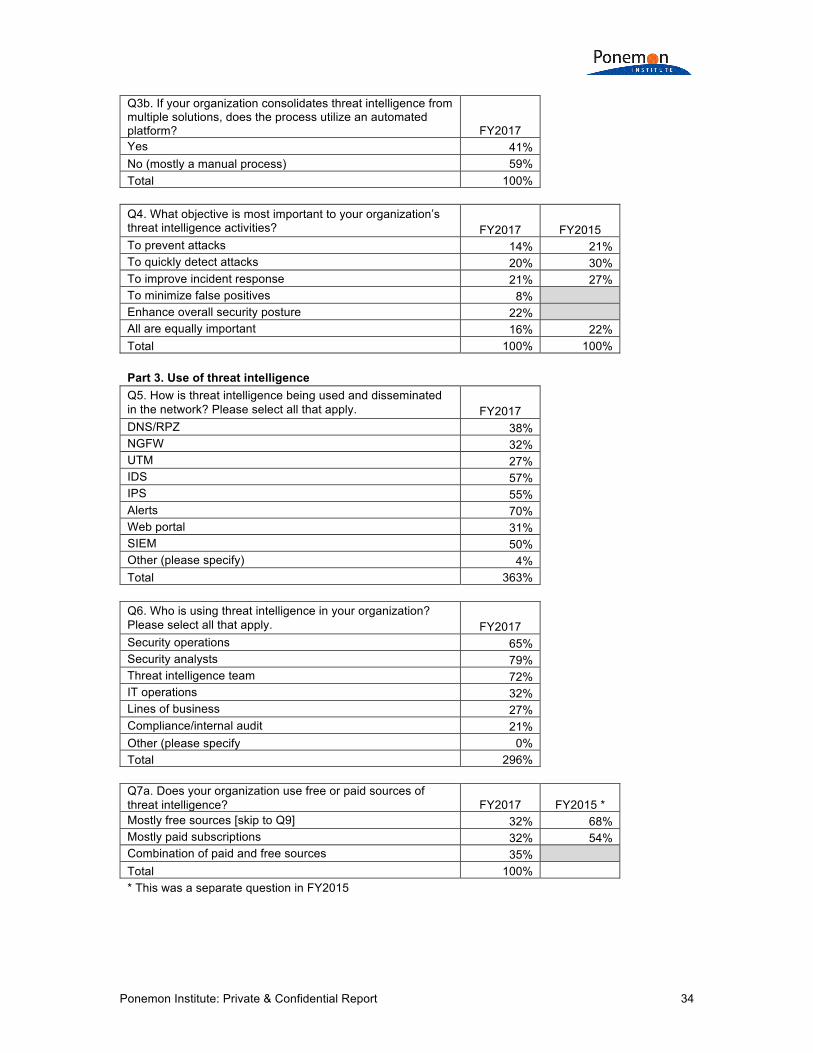
Q3b. If your organization consolidates threat intelligence from multiple solutions, does the process utilize an automated platform? FY2017
Yes 41% No (mostly a manual process) 59% Total 100%
Q4. What objective is most important to your organization’s threat intelligence activities? FY2017 FY2015
To prevent attacks 14% 21% To quickly detect attacks 20% 30% To improve incident response 21% 27% To minimize false positives 8%
Enhance overall security posture 22% All are equally important 16% 22%
Total 100% 100%
Part 3. Use of threat intelligence Q5. How is threat intelligence being used and disseminated
in the network? Please select all that apply. FY2017 DNS/RPZ 38%
NGFW 32% UTM 27% IDS 57% IPS 55% Alerts 70% Web portal 31% SIEM 50% Other (please specify) 4% Total 363%
Q6. Who is using threat intelligence in your organization? Please select all that apply. FY2017
Security operations 65% Security analysts 79% Threat intelligence team 72% IT operations 32% Lines of business 27% Compliance/internal audit 21% Other (please specify 0% Total 296%
Q7a. Does your organization use free or paid sources of threat intelligence? FY2017 FY2015 *
Mostly free sources [skip to Q9] 32% 68% Mostly paid subscriptions 32% 54% Combination of paid and free sources 35%
Total 100% * This was a separate question in FY2015
Ponemon Institute: Private & Confidential Report 35
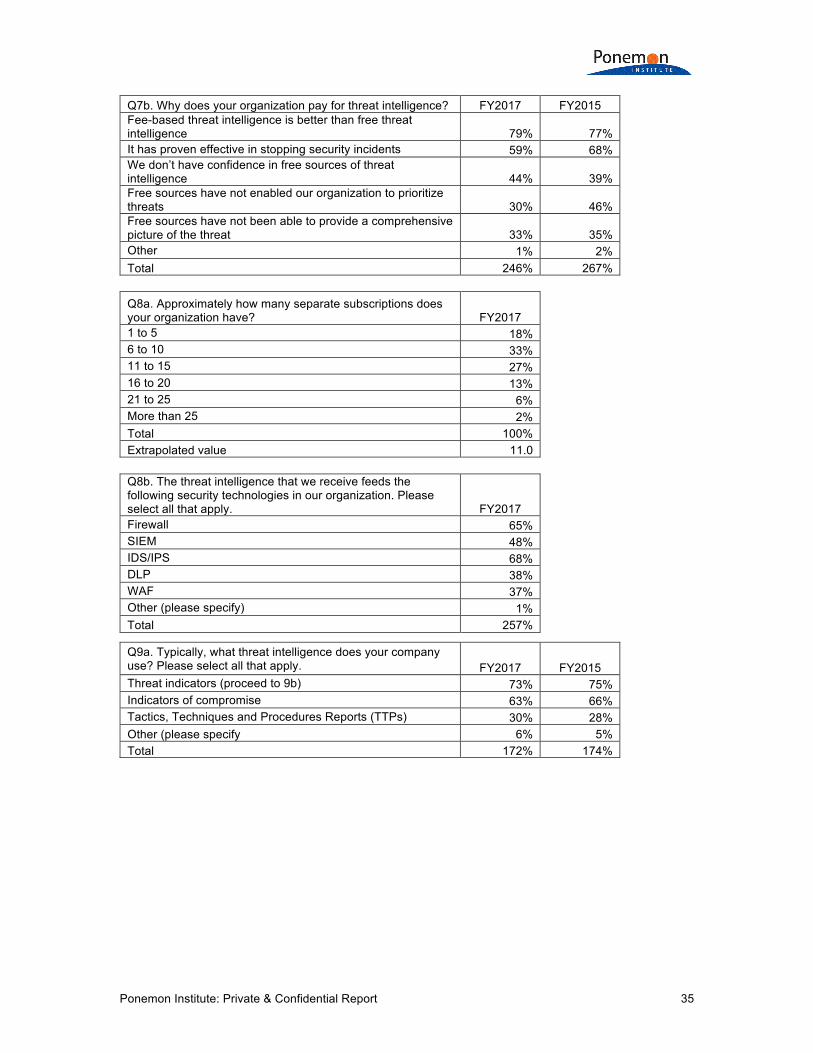
Q7b. Why does your organization pay for threat intelligence? FY2017 FY2015 Fee-based threat intelligence is better than free threat
intelligence 79% 77% It has proven effective in stopping security incidents 59% 68% We don’t have confidence in free sources of threat
intelligence 44% 39% Free sources have not enabled our organization to prioritize
threats 30% 46% Free sources have not been able to provide a comprehensive
picture of the threat 33% 35% Other 1% 2% Total 246% 267%
Q8a. Approximately how many separate subscriptions does your organization have? FY2017
1 to 5 18% 6 to 10 33% 11 to 15 27% 16 to 20 13% 21 to 25 6% More than 25 2% Total 100% Extrapolated value 11.0
Q8b. The threat intelligence that we receive feeds the following security technologies in our organization. Please select all that apply. FY2017
Firewall 65% SIEM 48% IDS/IPS 68% DLP 38% WAF 37% Other (please specify) 1% Total 257%
Q9a. Typically, what threat intelligence does your company use? Please select all that apply. FY2017 FY2015
Threat indicators (proceed to 9b) 73% 75% Indicators of compromise 63% 66% Tactics, Techniques and Procedures Reports (TTPs) 30% 28% Other (please specify 6% 5% Total 172% 174%

Ponemon Institute: Private & Confidential Report 36
Q9b. If you are using threat indicators, which threat indicators provide the most valuable information? Please select all that apply. FY2017 FY2015
Malicious IP addresses 69% 64% Malicious domains 58%
Malicious host names 47% Malicious malware 56% 59%
Malicious URLs 60% 55% Malicious files 46% 48% Malicious mobile apps 38% 39% Suspicious phishing and spoofing sites 48% 47% Indicators of compromise 56% 66% Newly observed domains 27%
Other (please specify) 6% 7% Total 511% 385%
Q10. Who is most responsible for deciding what threat intelligence sources are used? FY2017 FY2015
Chief Information Officer 27% 34% Chief Technology Officer 4% 6% Chief Financial Officer 0% 1% Chief Information Security Officer 15% 16% Chief Risk Officer 6% 7% Lines of business 13% 21% Chief Security Officer 3%
Leader of threat intelligence team 19% No one function is most responsible 14% Other (please specify) 0% 0%
Shared responsibility 15% Total 100% 100%
Q11. Typically, how is threat intelligence received by your organization? Please select all that apply. FY2017 FY2015 FY2014 Data feeds from external sources 65% 63% 57% Threat advisories 49% 51% 49% Internal collection and analysis 51% Exchange of threat intelligence with other companies 61% API to a cloud-based service 38% STIX/TAXI 49% Text files 32% Other (please specify) 0% 1% 4% Intelligence briefs 32% 33% Peer group discussion via phone, email or in-person 59% 54% Total 345% 206% 197%

Ponemon Institute: Private & Confidential Report 37
Q12. What are the main sources of threat intelligence received by your organization? Please select all that apply. FY2017 FY2015 FY2014 Peers in other companies 58% 56% 58% IT security vendors 66% 61% 55% Open source 36% Law enforcement 27% 30% 33% Government officials 14% 13% 15% Industry associations 34% 31% 26% Other (please specify) 2% 0% 2% Total 237% 191% 189%
Q13. How would you describe the trend in the amount of intelligence data your organization has consumed over the past 12 months? FY2017 FY2015
Significantly increasing 24% Increasing 36% 48%
Staying the same 35% 32% Decreasing 4% 7% Significantly decreasing 0%
Unable to determine 13% Total 100% 100%
Q14. Typically, what information is contained in threat intelligence reports? Please select all that apply. FY2017 FY2015 FY2014 Threat indicators such as suspicious hostnames, IP addresses, file hashes 68% 61% 55% Software vulnerability patch updates 56% 53% 48% Incident response information 40% 35% 36% Results of cybercrime investigations and prosecutions 23% 20% 22% Tactics, Techniques & Procedure Reports (TTP) 31% 28% Other (please specify) 2% 1% 3% Total 220% 198% 164%
Q15. Which vendors of threat intelligence do you consider industry leaders? Please select all that apply. FY2017
LookingGlass 31% Anomali 43% NCA 4% Symantec 51% ThreatStop 27% ThreatConnect 30% ThreatQuotient 19% CiscoTalos 48% Cisco OpenDNS 26% Infoblox 43% Other (please specify) 10% Total 332%
Ponemon Institute: Private & Confidential Report 38
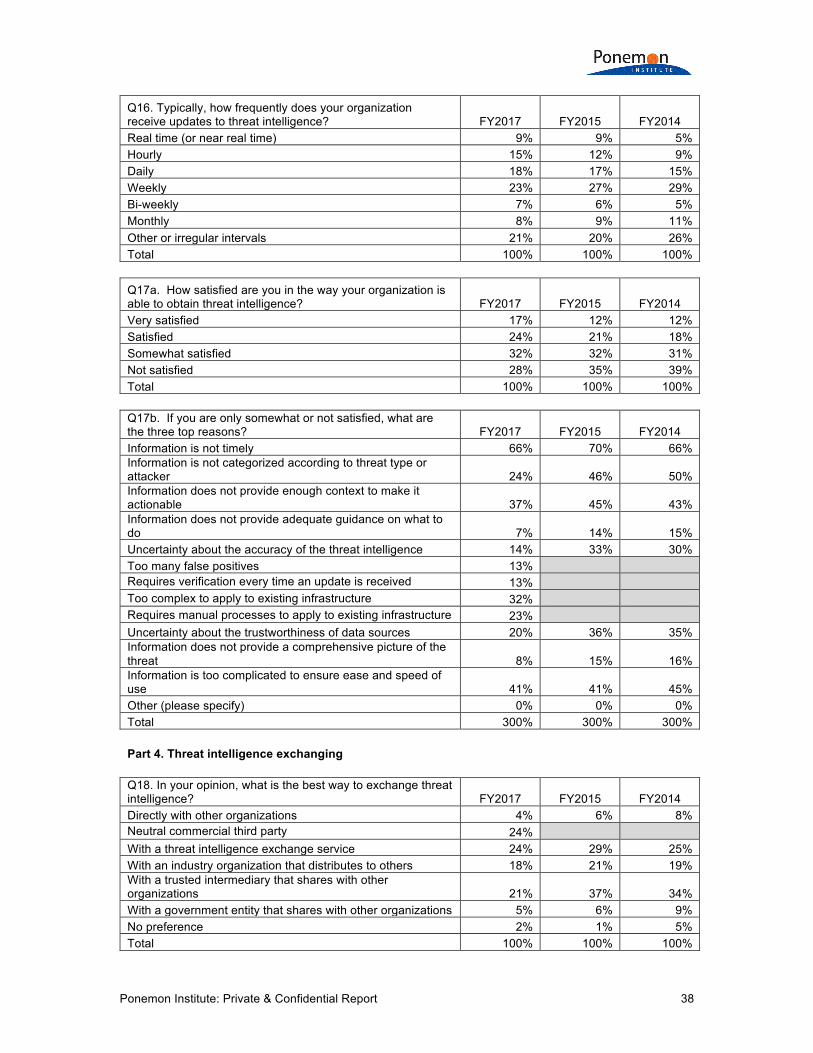
Q16. Typically, how frequently does your organization receive updates to threat intelligence? FY2017 FY2015 FY2014 Real time (or near real time) 9% 9% 5% Hourly 15% 12% 9% Daily 18% 17% 15% Weekly 23% 27% 29% Bi-weekly 7% 6% 5% Monthly 8% 9% 11% Other or irregular intervals 21% 20% 26% Total 100% 100% 100%
Q17a. How satisfied are you in the way your organization is able to obtain threat intelligence? FY2017 FY2015 FY2014 Very satisfied 17% 12% 12% Satisfied 24% 21% 18% Somewhat satisfied 32% 32% 31% Not satisfied 28% 35% 39% Total 100% 100% 100%
Q17b. If you are only somewhat or not satisfied, what are the three top reasons? FY2017 FY2015 FY2014 Information is not timely 66% 70% 66% Information is not categorized according to threat type or attacker 24% 46% 50% Information does not provide enough context to make it actionable 37% 45% 43% Information does not provide adequate guidance on what to do 7% 14% 15% Uncertainty about the accuracy of the threat intelligence 14% 33% 30% Too many false positives 13% Requires verification every time an update is received 13% Too complex to apply to existing infrastructure 32% Requires manual processes to apply to existing infrastructure 23% Uncertainty about the trustworthiness of data sources 20% 36% 35% Information does not provide a comprehensive picture of the threat 8% 15% 16% Information is too complicated to ensure ease and speed of use 41% 41% 45% Other (please specify) 0% 0% 0% Total 300% 300% 300%
Part 4. Threat intelligence exchanging Q18. In your opinion, what is the best way to exchange threat
intelligence? FY2017 FY2015 FY2014 Directly with other organizations 4% 6% 8% Neutral commercial third party 24% With a threat intelligence exchange service 24% 29% 25% With an industry organization that distributes to others 18% 21% 19% With a trusted intermediary that shares with other organizations 21% 37% 34% With a government entity that shares with other organizations 5% 6% 9% No preference 2% 1% 5% Total 100% 100% 100%

Ponemon Institute: Private & Confidential Report 39
Q19. How would you describe the trend in the amount of intelligence data your organization has exchanged over the past 12 months? FY2017 FY2015 FY2014 Significantly increasing 24% Increasing 30% 40% 34% Staying the same 40% 41% 42% Decreasing 5% 9% 11% Significantly decreasing 0% Unable to determine 10% 13% Total 100% 100% 100%
Q20. Approximately, when does threat intelligence become stale or not fresh? (Your best guess is welcome) FY2017 FY2015 FY2014 Within seconds 19% 18% 16% Within minutes 60% 60% 53% Within hours 10% 11% 13% Within days 7% 5% 11% Within weeks 2% 3% 5% Within months 2% 3% 2% Other (please specify) 0% 0% 0% Total 100% 100% 100%
Q21. How does your organization exchange threat intelligence? Please select all that apply. FY2017 FY2015 FY2014 Through an industry group 33% 33% 28% A threat intelligence consortium (e.g. Cyber Threat Alliance) 20% Through a vendor threat exchange service 48% 45% 53% Informal peer-to-peer exchange of information 65% 65% 57% With the government 13% Total 179% 143% 138%
Q22. What best describes your organization’s role in exchanging threat intelligence? FY2017 FY2015 FY2014 We mostly receive intelligence data 28% 35% 42% We mostly provide intelligence data 22% 23% 22% We verify threat intelligence 12% We receive and provide in nearly equal proportion 37% 42% 36% Total 100% 100% 100%
Q23. Does your organization have a role in verifying the quality of threat intelligence sent or received? FY2017
Yes, in threat intelligence we provide 24% Yes, in threat intelligence we receive 36% Yes, in threat intelligence we provide and receive 25% No 15% Total 100%

Ponemon Institute: Private & Confidential Report 40
Q24a. How effective is the collaboration between your organization and others in the exchange of threat intelligence? FY2017 FY2015 FY2014 Very effective 15% 15% 15% Effective 18% 19% 18% Somewhat effective 37% 37% 35% Not effective 30% 29% 32% Total 100% 100% 100%
Q24b. If not very effective or effective, why is the collaboration not effective? Please select all that apply. FY2017 FY2015 FY2014 Insufficient resources 46% 44% 49% Lack of technologies or tools 55% 49% 55% Concerns about trust 49% 52% 50% Concerns about liability 19% Concerns about risk 21% Concerns about threat information becoming public 27% Concerns about regulations 22% Lack of leadership in overseeing collaboration 30% 27% 29% Silos among IT departments and lines of business 65% 69% 68% Other (please specify) 2% 1% 2% Total 336% 242% 253%
Part 5. Measuring Quality of Threat Intelligence Q25. How effective is your company’s defense against cyber
attacks? Please use the following scale from 1 = low effectiveness to 10 = high effectiveness. FY2017 FY2015
1 to 2 10% 11% 3 to 4 16% 15% 5 to 6 33% 36% 7 to 8 23% 23% 9 to 10 18% 15% Total 100% 100% Extrapolated value 5.98 5.82
Q26. How effective is your company’s process for using actionable intelligence from internal sources (such as configuration log activities) to predict malicious activities? Please use the following scale from 1 = low effectiveness to 10 = high effectiveness. FY2017 FY2015
1 to 2 18% 21% 3 to 4 19% 21% 5 to 6 35% 35% 7 to 8 19% 13% 9 to 10 8% 10% Total 100% 100% Extrapolated value 5.22 4.90

Ponemon Institute: Private & Confidential Report 41
Q27. How effective is your company’s process for using actionable intelligence from external sources (such as vendor-supplied threat feeds) to predict malicious activities? Please use the following scale from 1 = low effectiveness to 10 = high effectiveness. FY2017 FY2015
1 to 2 15% 23% 3 to 4 25% 25% 5 to 6 31% 31% 7 to 8 16% 13% 9 to 10 14% 8% Total 100% 100% Extrapolated value 5.28 4.66
Q28. How accurate is the intelligence received by your organization? Please use the following scale from 1 = not accurate to 10 = very accurate. FY2017 FY2015 FY2014 * 1 to 2 11% 13% 16% 3 to 4 19% 24% 25% 5 to 6 34% 32% 29% 7 to 8 25% 19% 21% 9 to 10 10% 12% 9% Total 100% 100% 100% Extrapolated value 5.60 5.36 5.14
Q29. How timely is the intelligence received by your organization? Please use the following scale from 1 = slow to 10 = fast (real time). FY2017 FY2015
1 to 2 21% 33% 3 to 4 23% 23% 5 to 6 31% 23% 7 to 8 15% 12% 9 to 10 9% 9% Total 100% 100% Extrapolated value 4.84 4.32
Q30. How actionable is the intelligence received by your organization? Please use the following scale from 1 = not actionable to 10 = very actionable. FY2017 FY2015 FY2014 * 1 to 2 15% 19% 21% 3 to 4 20% 23% 27% 5 to 6 33% 25% 24% 7 to 8 18% 23% 20% 9 to 10 13% 11% 8% Total 100% 100% 100% Extrapolated value 5.392 5.24 4.84
Ponemon Institute: Private & Confidential Report 42
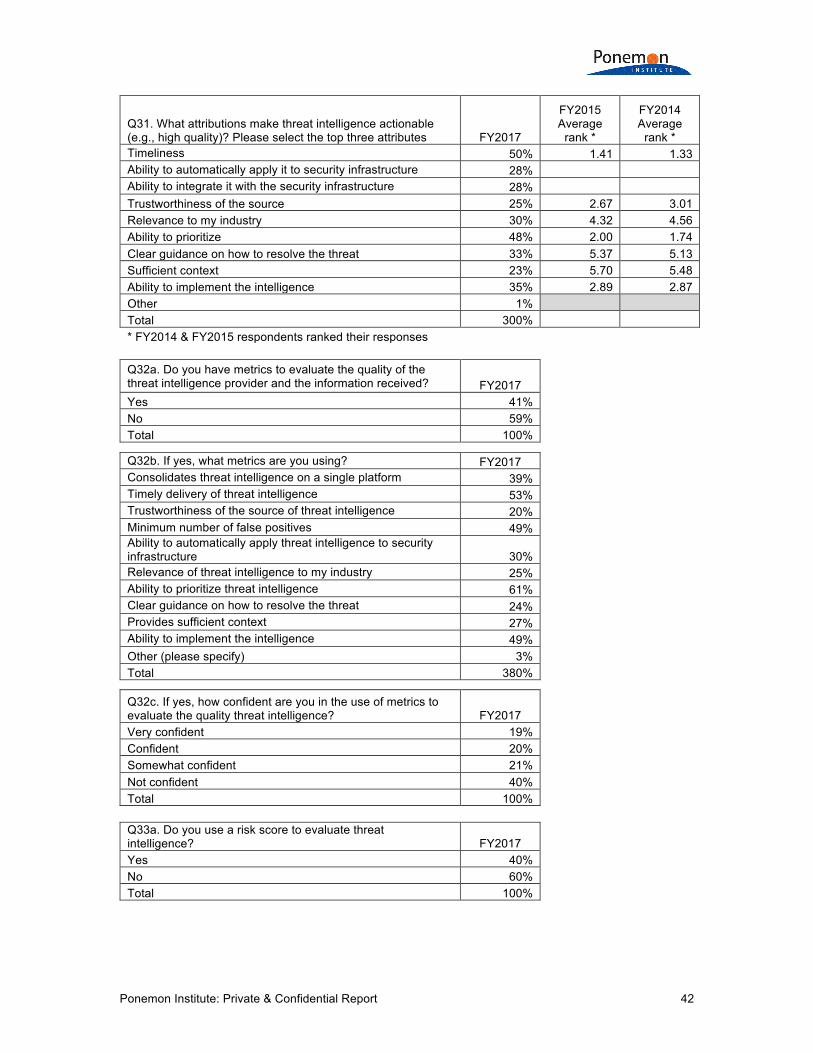
Q31. What attributions make threat intelligence actionable (e.g., high quality)? Please select the top three attributes FY2017
FY2015 Average
rank *
FY2014 Average
rank * Timeliness 50% 1.41 1.33 Ability to automatically apply it to security infrastructure 28% Ability to integrate it with the security infrastructure 28% Trustworthiness of the source 25% 2.67 3.01 Relevance to my industry 30% 4.32 4.56 Ability to prioritize 48% 2.00 1.74 Clear guidance on how to resolve the threat 33% 5.37 5.13 Sufficient context 23% 5.70 5.48 Ability to implement the intelligence 35% 2.89 2.87 Other 1% Total 300% * FY2014 & FY2015 respondents ranked their responses
Q32a. Do you have metrics to evaluate the quality of the
threat intelligence provider and the information received? FY2017 Yes 41%
No 59% Total 100%
Q32b. If yes, what metrics are you using? FY2017 Consolidates threat intelligence on a single platform 39%
Timely delivery of threat intelligence 53% Trustworthiness of the source of threat intelligence 20% Minimum number of false positives 49% Ability to automatically apply threat intelligence to security
infrastructure 30% Relevance of threat intelligence to my industry 25% Ability to prioritize threat intelligence 61% Clear guidance on how to resolve the threat 24% Provides sufficient context 27% Ability to implement the intelligence 49% Other (please specify) 3% Total 380%
Q32c. If yes, how confident are you in the use of metrics to evaluate the quality threat intelligence? FY2017
Very confident 19% Confident 20% Somewhat confident 21% Not confident 40% Total 100%
Q33a. Do you use a risk score to evaluate threat intelligence? FY2017
Yes 40% No 60% Total 100%

Ponemon Institute: Private & Confidential Report 43
Q33b. If yes, are you taking the following into account when doing the calculation? Please check all that apply. FY2017
Confidence in the source and veracity of the threat indicator 58% Indicator type (format, targeted usage platform, targeted
technology) 53% Adversary attributes 29% Industry the threat is targeting 31% Age of threat 46% Technical impact (loss of confidentiality, integrity, availability
and accountability) 45% Business impact (financial damage, reputation damage, non-
compliance, privacy violation) 45% Is it actionable 60% Confidence reported by multiple sources 52% Threat score 39% Has been reported as a false positive 34% Exploitability 25% Remediation level 28% Other (please specify) 4% Total 548%
Q34a. Does your threat intelligence program define and rank levels of risk? FY2017
Yes 45% No 55% Total
Q34b. If yes, what are indicators of risk? Please check all that apply. FY2017
Overall decline in the quality of the provider’s services 62% Discovery that the provider is using a subcontractor that has
access to our company’s information 38% Uncertainty about the accuracy of threat intelligence 66% Poor decisions because of accuracy of the threat intelligence 51% Poor decisions because of the lack of trustworthiness 47% Poor decisions because of complications 35% Turnover of the vendor’s key personnel 43% Other (please specify) 5% Total
Q34c. If yes, how often are the risk levels updated? FY2017
Bi-weekly Monthly Quarterly Every six months Annually Every two years As needed Never Total

Ponemon Institute: Private & Confidential Report 44
Part 6. Investigation of threats Q35a. Did your company have a material security breach in
the past 24 months? FY2017 FY2015 Yes 50% 47%
No 47% 49% Unsure 3% 4% Total
100%
Q35b. If yes, do you believe that threat intelligence could have prevented or minimized the consequences of the attack? FY2017 FY2015 FY2014 * Yes 66% 65% 61% No 34% 18% 19% Unsure 0% 17% 20% Total 100% 100% 100% * This was not a two part question in FY2014 Q3 & Q4
Q36. How are threats investigated? FY2017
Using manual processes 46% Using automated processes 47% Using machine learning and artificial intelligence tools 20% Hybrid of manual and automated processes 32% Other (please specify) 4% Total 149%
Q37. Approximately, how many hours each week are spent investigating threats? Please estimate the aggregate hours of the IT and IT security (SecOps) team. FY2017
Less than 5 1% 5 to 10 6% 11 to 25 13% 26 to 50 14% 51 to 100 22% 101 to 250 9% 251 to 500 9% More than 500 27% Total 100% Extrapolated value 233.30
Part 7. Role and organizational characteristics D1. What organizational level best describes your current
position? FY2017 FY2015 FY2014 Senior Executive 3% 2% 2% Vice President 2% 2% 1% Director 14% 17% 16% Manager 22% 21% 23% Supervisor 16% 15% 16% Technician 34% 34% 35% Staff 7% 6% 5% Contractor 2% 3% 2% Other 0% Total 100% 100% 100%

Ponemon Institute: Private & Confidential Report 45
D2. Check the department or function that best describes where you are located in your organization. FY2017 FY2015 FY2014 General management 2% 3% 2% Finance & accounting 1% 1% 0% Legal & compliance 2% 2% 2% Corporate IT 50% 53% 56% Line of business 20% 21% 20% Human resources 0% 0% 0% Risk management 7% 6% 5% Security (CSO & CISO) 17% 14% 15% Other 1% Total 100% 100% 100%
D3. What industry best describes your organization’s industry focus? FY2017 FY2015 FY2014 Agriculture & food service 1% 0% 1% Communications 3% 2% 3% Consumer products 5% 5% 4% Defense & aerospace 1% 1% 1% Education & research 2% 2% 2% Energy & utilities 5% 5% 5% Entertainment & media 1% 1% 2% Financial services 17% 19% 20% Health & pharmaceuticals 10% 12% 11% Hospitality 3% 4% 3% Industrial 10% 9% 7% Public sector 12% 12% 14% Retail 9% 9% 9% Services 10% 8% 8% Technology & Software 8% 8% 6% Transportation 2% 2% 3% Other 2% 1% 1% Total 100% 100% 100%
D4. Where are your employees located? Please choose all that apply. FY2017 FY2015 FY2014 United States 82% 100% 100% Canada 68% 84% 87% Europe 89% 80% 78% Middle east & Africa 52% 55% 56% Asia-Pacific 64% 69% 69% Latin America (including Mexico) 54% 64% 65%

Ponemon Institute: Private & Confidential Report 46
D5. What is the worldwide headcount of your organization? FY2017 FY2015 FY2014 Less than 250 10% 10% 11% 250 to 500 15% 16% 15% 501 to 1,000 22% 20% 21% 1,001 to 5,000 23% 23% 22% 5,001 to 25,000 11% 14% 15% 25,001 to 50,000 9% 9% 8% 50,001 to 75,000 4% 4% 3% More than 75,000 6% 4% 5% Total 100% 100% 100%
Please contact [email protected] or call us at 800.887.3118 if you have any questions.
Ponemon Institute Advancing Responsible Information Management
Ponemon Institute is dedicated to independent research and education that advances responsible information and privacy management practices within business and government. Our mission is to conduct high quality, empirical studies on critical issues affecting the management and security of sensitive information about people and organizations. We uphold strict data confidentiality, privacy and ethical research standards. We do not collect any personally identifiable information from individuals (or company identifiable information in our business research). Furthermore, we have strict quality standards to ensure that subjects are not asked extraneous, irrelevant or improper questions.