thinkmoney 2014 fall
TRANSCRIPT

•random musings for traders at TD AmeritradeFall 2014
thinkMoney/25
10/SLAYYOURTRADINGMONSTERS18/HOW TO WIN AT LOSING
26/GETTINGSKEWED WITHVOLATILITY
STOCK-PICKING FOCUS
32/MASTERING THE UNIVERSE
Stock
Broke
rs.co
mlov
es us.
TD Ameritra
degets
#1 online broke
r...ag
ain!
(See page 9 fo
r det
ails)
tm25_Cover_rd2.qxd:pages.layout 2014-08-22 9:09 AM Page 1

Options involve risk and are not suitable for all investors. Prior to buying or selling an option, a person must receive a copy of Characteristics and Risks of Standardized Options. Copies are available from your broker, by calling 1-888-OPTIONS, or at www.theocc.com. Futures trading is not suitable for all investors, and involves risk of loss. Futures and options on CBOE’s volatility indexes have several unique features that distinguish them from most equity and index options, and investors are strongly encouraged to closely read and understand the ODD and the VIX options FAQ at http://ww-w.cboe.com/micro/vix/vixoptionfaq.aspx and other informational material before investing. No statement within this ad should be construed as a recommendation to buy or sell a security or futures contract or to provide investment advice. CBOE® and Chicago Board Options Exchange® are registered trademarks and Execute SuccessSM, CBOE Short-Term Volatility IndexSM and VXSTSM are service marks of Chicago Board Options Exchange, Incorporated (CBOE). S&P and S&P 500® are registered trademarks of Standard & Poor’s Financial Services, LLC and are licensed for use by CBOE and CBOE Futures Exchange, LLC. S&P does not sponsor, endorse, sell, or promote any S&P index-based investment product. © 2014 CBOE. All Rights Reserved.
Introducing CBOE Short-Term Volatility IndexSM (VXSTSM) options and futures, with weekly expirations.
By tracking 9-day expected volatility, Short-Term VIX is particularly reactive to
moves in the S&P 500® Index. So now you have the opportunity to capture more
risk premium with weekly expirations. Capitalize on sudden market events. Better
manage near-term risk. And help take advantage of volatility for the here and now.
Download the Short-Term VIX quick reference guide at ShortTermVIX.comTweet with dollar-sign tag $VXST
tm25_Pages2to9_rd2.qxd:pages.layout 2014-08-22 12:34 PM Page 2

Kyle S.thinkorswim® user
Nicole “The Suit” Sherrod@TDANSherrod
Managing Director, Trading
Explore thinkorswim sharing:
tdameritrade.com/shareyourtos
myTrade is a service of myTrade, Inc., a separate but af iated rm. TD Ameritrade is not responsible for the services of myTrade, or content shared through the service.
TD Ameritrade, Inc., member FINRA/SIPC/NFA. TD Ameritrade is a trademark jointly owned by TD Ameritrade IP Company, Inc. and The Toronto-Dominion Bank. © 2014 TD Ameritrade IP Company, Inc. All rights reserved. Used with permission.
Access granted.With the new sharing feature in thinkorswim, you’ll discover how our experts use the platform and
which tools they rely on most. You can also generate new ideas and share your platform setup with
friends, followers, and the myTrade® community.
Get an exclusive look into how “The Suit” uses thinkorswim.
tm25_Pages2to9_rd2.qxd:pages.layout 2014-08-22 12:34 PM Page 3

thinkMoney/25•
04•Contents•Photograph byFredrik Brodén
•tdameritrade.com
tm25_Pages2to9_rd2.qxd:pages.layout 2014-08-22 12:35 PM Page 4

How To Slay Your MonstersTrading fears are as normal as a child’s fear of monsters. But left unattended, they cancripple your potential as atrader. Here are three big trading monsters and a fewtips on how to slay them.
p. 10
tm25_Pages2to9_rd2.qxd:pages.layout 2014-08-22 12:35 PM Page 5

WWW.NASDAQOMX.COM
AVAILABLE CURRENCIES
THE SPOT
XDA XDB XDC XDE XDN XDS XDZAUSTRALIAN
DOLLARBRITISH POUND
CANADIAN DOLLAR EURO JAPANESE
YENSWISS FRANC
NEW ZEALAND DOLLAR
T R A D E S P O T F X O P T I O N S
MARKS
©2014, THE NASDAQ OMX GROUP, INC. ALL RIGHTS RESERVED.
tm25_Pages2to9_rd2.qxd:pages.layout 2014-08-22 12:35 PM Page 6

thinkMoney/25•
07•Contents•Cover photograph byFredrik Brodén
•tdameritrade.com
Miscellaneous
Features
10/ How To Slay Your MonstersThe persistent childhood fears of monstersunder the bed or in the closet are now keepingyou from trading options effectively as an adult.The problem, of course, is more likely in yourhead, but the fears are real. Let’s expose threebig monsters and how to slay them.
18/ How To Lose A TradeIn trading, losses are inevitable. So learningwhat to do when facing them is as importantto a sound strategy as, well, winning. The nexttime you’re facing a loss, what choices do youhave? Quite a few, actually.
26/Getting Skewed and Liking ItThere’s more to volatility than numbers. Look-ing at skew—different volatilities from oneoption to the next—can tell you a lot aboutwhat the market is thinking, even when theheadlines are vague. And you don’t have to bean options trader to “get it.”
08/A Quick Howdy
15/Love Notes
16/News + ViewsHow Google’s split ischanging the face ofcorporate gover-nance, the latestgadgets on thinkor-swim, and morepearls of wisdomfrom the Suit.
25/Ask the Trader GuyOur resident trading guruunlocks the mystery ofcarrying costs on indexes,explains the lesser-knowngreeks, and pontificateson the awesomeness ofSriracha.
Columns
40/The TokenGlossary
32/ Special Focus: Stock Selection BRAIN, MEET BRAWNFinding good trades is about making good use of your head and your tools to sift through the universe of symbols for the few that aretrade-worthy. Now, while we can’t help youwith your head, thinkorswim® has you coveredon the tools.
PLUS: HOW TO “HACK” A STOCK LIST
TD Ameritrade Contact Info You Could UseClient Services Representative: 800-669-3900New Accounts: 800-454-9272
•thinkorswim Support: [email protected] Feedback:[email protected] Support:[email protected] paperMoney Support:[email protected] all other inquiries:tdameritrade.com/contact-us
•General Mailing Address200 S. 108th AveOmaha, NE 68154
•
Follow TD Ameritrade
31 /Futures 4 FunThe CBOE VIX isn’t acrystal ball, but whencombined withlonger-term VIXfutures, it might helpyou find market bot-toms.
And follow thinkorswim on Twitter, too: @thinkorswim
BACK ISSUES OF THINKMONEY!To view past issues of thinkMoney, hop on over totdameritrade.com/thinkmoney. You'll be glad you did.
22/Option MonkeyTrading CalendarAll the important 2015option trading dates ina single view—nosmartphonesattached. Pull it outand pin it up. Justdon’t hurt yourself.
13 14 1615
42/The Back PageLong on delta, shorton time this Thanks-giving? Here’s atrader’s holiday menuwith recipes to have atthe ready when you’recalled on to host thisyear’s holiday reunion.
39/Cool ScriptsBollinger bands onvolatility? Whoa. Thisslick little indicatorhelps signal potentialtrades. You’ll have towrite the script your-self, but don’t worry,we gotcha covered.
cont.
tm25_Pages2to9_rd2.qxd:pages.layout 2014-08-22 12:36 PM Page 7

your head and slay the biggesttrading monsters for good.
Once you’ve overcome yourfears, to win at trading, you mustlearn how to lose. That’s right,accepting loss as a natural part ofa winning strategy can be animportant part of your learningcurve as a trader. There’s a logi-cal approach to take when facinga loss, with the goal being thatno single trade should wipe youout. And none of your lossesshould be the result of compla-cency. By learning to absorblosses smartly, you’re more likelyto make better choices in thefuture. “How to Lose a Trade” onpage 18 provides a few pointerson just how to land softly.
And finally, while we’re onthe subject of logical approachesto trading, when was the lasttime you took a step back toassess your stock-pickingmethod? Whether you’re in aslump, or just looking for newideas, our special focus on stockselection on page 32 will walkyou through a few ideas for navi-gating the maze of choices.
There may be no such thingas monsters, but the fear of los-ing is real. No matter how big orsmall your account size is, therules are always the same—makesmart, informed choices,doggedly guard your capital, anduse your tools wherever yourhead can make a mess of things.If you can accomplish these,soon you’ll be kissing those mon-sters goodnight instead of run-ning from them.
Happy trading!
Kevin Lund, Editor-in-Chief, thinkMoney
thinkMoney/25
•
08•A Quick Howdy•tdameritrade.com
thinkMoney®
EDITOR-IN-CHIEFKevin Lund
EDITORThomas Preston
ASSISTANT EDITOREileen Sutton
ART DIRECTORTom Brown
DESIGNERJennifer Roberts
•
CONTRIBUTING WRITERSNicole SherrodJohn BrodemusRachel Koning BealsGreg LoehrDavid Kier
CHIEF PHOTOGRAPHERFredrik Brodén
CONTRIBUTING ILLUSTRATORJoe Morse
•PUBLISHERT3 CustomEmail: [email protected]
PHO
TOG
RA
PH: F
RED
RIK
BR
OD
ÉN
Maybe pop stars can make peacewith the monsters in their heads,but options traders are a differentbreed. When your P/L is at stake,all kinds of trading boogeymencome out from under the bedand can muck things up. Tomake peace with them, you’llhave to do more than sing. Youmay have to dance, too.
Not really, but while there arevolumes of books written abouttrading psychology and propermindset, not much has beendirected at aspiring optionstraders. In our cover story, “Howto Tame Your Monsters” on page10, we’ll give you some pointerson how to assuage the fears in
Friends With the Monster
edit
GOT FEEDBACK?Talk to us aboutthinkMoney! Take our survey and you’ll qualifyfor infinite brownie points. tdameritrade.com/tmsurvey or write to usat [email protected]
tm25_Pages2to9_rd2.qxd:pages.layout 2014-08-22 12:36 PM Page 8

• The information presented in this publication doesnot consider your personal investment objectives orfinancial situation; therefore, this publication does notmake personalized recommendations. This informationshould not be construed as an offer to sell or a solicita-tion to buy any security. The investment strategies orthe securities may not be suitable for you. Any and allopinions expressed in this publication are subject tochange without notice.
• Options transactions involve complex tax considera-tions that should be carefully reviewed prior to enteringinto any transaction.• The risk of loss in trading securities, options, futuresand forex can be substantial. Clients must consider allrelevant risk factors, including their own personal finan-cial situations, before trading. Options involve risk andare not suitable for all investors. See the Options Disclo-sure Document: Characteristics and Risks of Standard-ized Options. A copy accompanies this magazine if youhave not previously received one. Additional copies canbe obtained at tdameritrade.com or by contacting us. • Trading foreign exchange on margin carries a high levelof risk, as well as its own unique risk factors. Before con-sidering trading this product, please read the Forex RiskDisclosure, available at http://www.nfa.futures.org/NFA-investor-information/publication-library/forex.pdf. • A forex dealer can be compensated via commissionand/or spread on forex trades. TD Ameritrade is subse-quently compensated by the forex dealer.• Futures and forex accounts are not protected by theSecurities Investor Protection Corporation (SIPC).
TD Ameritrade, Inc. Member SIPC FINRA
TD Ameritrade is a trademark jointly owned by TD Ameritrade IP Company, Inc. and The Toronto-Dominion Bank. ©2014 TD Ameritrade IP Company, Inc. All rights reserved. Used with permis-sion. Product and company names mentioned hereinmay be trademarks and/or registered trademarks oftheir respective companies.
thinkMoney/25•
09•Disclaimers•tdameritrade.com
• Neither Investools® norits educational sub-sidiaries nor any of theirrespective officers, person-nel, representatives,agents or independentcontractors are, in suchcapacities, licensed finan-cial advisors, registeredinvestment advisors or reg-istered broker/dealers.Neither Investools norsuch educational sub-sidiaries provide invest-
ment or financial adviceor make investment rec-ommendations, nor arethey in the business oftransacting trades, nor dothey direct client futuresaccounts nor give futurestrading advice tailored toany particula r client’s sit-uation. Nothing containedin this communicationconstitutes a solicitation,recommendation, promotion, endorsementor offer by Investools or others described herein, of any particular security,transaction, or invest-ment. Investools Inc. and TD Ameritrade, Inc.are separate but affiliatedcompanies that are not responsible foreach other’s services orpolicies.
important
info
Transaction costs (commissions andother fees) are important factors andshould be considered when evaluat-
ing any options trade. For simplicity, the examples in these articles do not include transaction costs. At TD Ameritrade, the standard commission for onlineequity orders is $9.99, online option orders are $9.99+ $0.75 per contract. Orders placed by other meanswill have higher transaction costs. Options exercisesand assignments will incur a $19.99 commission.
TD Ameritrade was ranked #1 out of 17 online brokers evaluated in the Stock-Brokers.com Online Broker Review 2014.
Read the full article at www.stockbrokers.com/2014-online-broker-review.html.
34
tm25_Pages2to9_rd2.qxd:pages.layout 2014-08-22 12:36 PM Page 9

thinkMoney/25
•
10•Overcoming Fear•tdameritrade.com
AS A KID, MONSTERS WERE EVERYWHERE—IN CLOSETS, UNDER BEDS, YOU NAME IT. AND NOW THEY SEEM TOBE KEEPING YOU FROM TRADING OPTIONS EFFECTIVELY. THE PROBLEM, OF COURSE, IS MORE LIKELY IN YOUR HEAD.BUT IN CASE YOU STILL SEE SCARY THINGS THAT GO BUMP IN THE NIGHT, LET’S FIGURE OUT HOW TO SLAY THEM.
HOW TO SLAY YOUR
tm25_Monsters_f1_rd2.qxd:pages.layout 2014-08-22 11:57 AM Page 10

WORDS BY MARK AMBROSE PHOTOGRAPH BY FREDRIK BRODÉN
tm25_Monsters_f1_rd2.qxd:pages.layout 2014-08-22 11:57 AM Page 11
thinkMoney/25
•
12•Overcoming Fear
•Photograph by Fredrik Brodén
•tdameritrade.com
But quiet little monsters in the adult mind are dif-ferent. Childhood phantoms disappear when you turnon the closet light. They disappear when you’re oldenough to know that 500-foot dragons can’t fit underthe bed. The same is true of trading monsters. Shine alight on them, and poof—they disappear. The bestpart? You don’t have to vanquish them alone. Lots ofhandy tools and financial resources can help get youthrough the most grueling of battles. So strap on yourcolander helmet and grab your pillow shield. Thereare some trading monsters that need defeating!
Monster #1: I’ll Go BrokeI’ll admit it: not having mortgage, rent, food, or retire-ment money can seem pretty scary. And when somepeople think of options trading, those fears are first toappear.
Defeating the “I’llgo broke” monsterrequires using strate-gies that have definedrisk built into them.What does that mean?Risk is how much youmight potentially loseon a trade. Definedrisk is knowing exactlyhow much you couldlose no matter what.Some strategies entail
potential undefined losses—you don’t know how largethe loss might be if the stock or market moves againstyou. Others, like long or short verticals, carry definedrisk. You’ll know your maximum loss if the stock dropsto $0, or rises infinitely high.
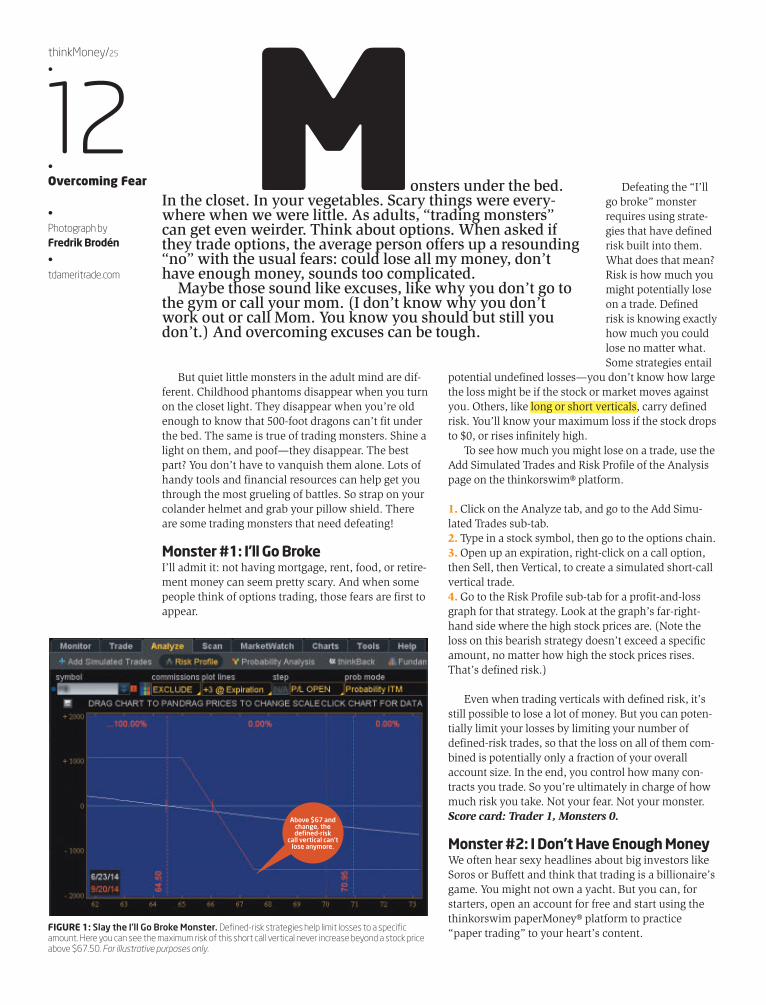
To see how much you might lose on a trade, use theAdd Simulated Trades and Risk Profile of the Analysispage on the thinkorswim® platform.
1. Click on the Analyze tab, and go to the Add Simu-lated Trades sub-tab.2. Type in a stock symbol, then go to the options chain.3. Open up an expiration, right-click on a call option,then Sell, then Vertical, to create a simulated short-callvertical trade.4. Go to the Risk Profile sub-tab for a profit-and-lossgraph for that strategy. Look at the graph’s far-right-hand side where the high stock prices are. (Note theloss on this bearish strategy doesn’t exceed a specificamount, no matter how high the stock prices rises.That’s defined risk.)
Even when trading verticals with defined risk, it’sstill possible to lose a lot of money. But you can poten-tially limit your losses by limiting your number ofdefined-risk trades, so that the loss on all of them com-bined is potentially only a fraction of your overallaccount size. In the end, you control how many con-tracts you trade. So you’re ultimately in charge of howmuch risk you take. Not your fear. Not your monster. Score card: Trader 1, Monsters 0.
Monster #2: I Don’t Have Enough MoneyWe often hear sexy headlines about big investors likeSoros or Buffett and think that trading is a billionaire’sgame. You might not own a yacht. But you can, forstarters, open an account for free and start using thethinkorswim paperMoney® platform to practice“paper trading” to your heart’s content. FIGURE 1: Slay the I’ll Go Broke Monster. Defined-risk strategies help limit losses to a specific
amount. Here you can see the maximum risk of this short call vertical never increase beyond a stock priceabove $67.50. For illustrative purposes only.
onsters under the bed.In the closet. In your vegetables. Scary things were every-where when we were little. As adults, “trading monsters”can get even weirder. Think about options. When asked ifthey trade options, the average person offers up a resounding“no” with the usual fears: could lose all my money, don’thave enough money, sounds too complicated.
Maybe those sound like excuses, like why you don’t go tothe gym or call your mom. (I don’t know why you don’twork out or call Mom. You know you should but still youdon’t.) And overcoming excuses can be tough.
M
Above $67 andchange, thedefined-risk
call vertical can’tlose anymore.
tm25_Monsters_f1_rd2.qxd:pages.layout 2014-08-22 11:57 AM Page 12

As you know, stocks can get pricey. For example,100 shares of a $30 stock would cost you a hefty$3,000. But remember those defined-risk strategieswe employed to slay Monster #1? Contrary to scaryrumors, in reality those strategies may not require asubstantial investment. You could for instance put up10 vertical trades in different stocks for a relativelymodest amount—typically between 10-20% of thecost of the stock. As well, mini-options on some high-priced stocks that control only 10 shares (versus 100)
of the underlying stock at a time, canmake for a low-cost alternative. Tostart, these are two good reasons whyoption strategies can in fact make sensefor new options traders on a learningcurve with limited budgets.
The fine print on risk? Go slow is theanswer. You could be an active optionstrader and put but half of a $2,000account in play (hard to do withstocks). For example, using $1,000 ofyour working capital, you could trade avertical, an iron condor, a calendar, andmaybe even a short put in a low-pricedstock and easily slay Monster #2. Score card: Trader 2, Monsters 0.
Monster #3: I’m Not SmartEnoughOK, there’s a certain amount of jargonthat may sound strange and intimidat-ing. We’ve all been there. No onesprings from the womb a full-blownoptions trader. It takes time. Each trade,each expiration, is potentially a newlesson that makes you smarter. Andsure, a lot of the formulas that calculatethe numbers you see for options—likethe “greeks” and probability num-bers—can get complex. In theory,you’d need to be pretty good at math tocome up with those kinds of formulas.Luckily thinkorswim does the math foryou. You don’t need to decipher the for-mulas to understand what those num-bers mean, or more importantly, howto use them.
It’s also easy to get turned aroundwith the names of the various strategies.Straddles and strangles. Condors and cal-endars. Butterflies and back spreads. But
these strategies are more similar than different, and byspending a little time with thinkorswim’s educationalresources, all the strategies and lingo will start to makesense. In fact, you can get started today with a live train-ing session right on the platform.
In the upper-right-hand corner, click on Support/Chat to open up the Chat window. Click on either theSeminars tab for archives, or the Chat Rooms tab forlive shows like Swim Lessons where you’ll learn howto use the platform, get tips on picking a smart strategyfor the current market environment, and more. Score card: Trader 3, Monsters 0.
SO NOW YOU KNOW HOW TO BEAT THE THREEbiggest monsters that keep most people from tradingoptions. Just remember, whether its gargoyles orthree-headed imps that haunt your dreams and danceon your strategies, it’s the ones in your head that mat-ter most, even if you’re still checking under the bed.
Options are not suitable for all investors. Options trading is subject to TD Ameritrade review and approval. Not all account owners will qualify.Spreads, Straddles, and other multiple-leg option strategies can entail substantialtransaction costs, including multiple commissions, which may impact any potential return. These are advanced option strategies and often involve greaterrisk, and more complex risk, than basic options trades
Important Information
SEE GLOSSARYPAGE 40
tm25_Monsters_f1_rd2.qxd:pages.layout 2014-08-22 11:57 AM Page 13

FROM OUR EXPERTS TO YOUR INBOX: OPTION ADVICE YOU CAN ACTUALLY USE.
2 STRATEGIESFOR
2 MONTHS
Visit redoption.com andenter coupon code “think”**
When you subscribe, you can take advantage of:
Opening, adjusting, and closing trade recommendations based on your choice of nine risk-defi ned option trade strategies
An inside look at the step-by-step analytical methods that veteranfl oor traders apply when making trade recommendations
The free Autotrade* feature, available to TD Ameritrade clients, which allows TD Ameritrade to act on a third-party newsletter recommendation by placing a trade on your behalf to your designated account
To learn more about RED Option, call 877-733-6786 or visit redoption.com today.
*Autotrade is a service of TD Ameritrade, Inc., available to select TD Ameritrade accounts at no additional fee. All trades initiated via Autotrade are subject to your individual commission rates and fees as a TD Ameritrade client. Please contact a TD Ameritrade Option Specialist at 800-669-3900 for more information, including eligibility requirements.
**When the two free months have passed, keep the service for just $20 per strategy per month.
Options are not suitable for all investors as the special risks inherent to option trading may expose investors to potentially rapid and substantial losses. Option trading privileges in a TD Ameritrade account subject to TD Ameritrade review and approval. Before trading options, carefully read Characteristics and Risks of Standardized Options. Contact TD Ameritrade at 800-669-3900 or your broker for a copy. RED Option Advisors, Inc. and TD Ameritrade, Inc. (member FINRA/SIPC/NFA) are separate but affi liated fi rms. Advisory services are provided exclusively by RED Option Advisors, Inc., and brokerage services are provided exclusively by TD Ameritrade, Inc. A subscription to RED Option Advisors will include a monthly fee. Please contact RED Option at 877-733-6786 for more information, including eligibility requirements. © 2012 TD Ameritrade IP Company, Inc.
The RED Option advisory service applies your choice of
strategies to make option trade recommendations. We send
those recommendations to your inbox. You make the trade,
or if you are a qualifi ed TD Ameritrade client, you can elect
to have TD Ameritrade do it for you automatically. It’s easy—
and RED Option provides knowledgeable trade advice paired
with comprehensive option education.
*Autotrade is a service of TD Ameritrade, Inc., available to select TD Ameritrade accounts at no additional fee. All trades initiated via Autotrade are subject to your individual commission rates and fees as a TD Ameritrade client. Please contact a TD Ameritrade Option Specialist at 800-669-3900 for more information, including eligibility requirements.
**When the two free months have passed, keep the service for just $20 per strategy per month.
Options are not suitable for all investors as the special risks inherent to option trading may expose investors to potentially rapid and substantial losses. Option trading privileges in a TD Ameritrade account subject to TD Ameritrade review and approval. Before trading options, carefully read Characteristics and Risks of Standardized Options. Contact TD Ameritrade at 800-669-3900 or your broker for a copy. RED Option Advisors, Inc. and TD Ameritrade, Inc. (member FINRA/SIPC/NFA) are separate but affi liated fi rms. Advisory services are provided exclusively by RED Option Advisors, Inc., and brokerage services are provided exclusively by TD Ameritrade, Inc. A subscription to RED Option Advisors will include a monthly fee. Please contact RED Option at 877-733-6786 for more information, including eligibility requirements. © 2012 TD Ameritrade IP Company, Inc.
tm25_LoveNotes_final.qxd:pages.layout 2014-08-22 11:45 AM Page 14

• DAngelo Curtis @SargeCurtis1:54 PM - May 29, 2014@TDAmeritrade I was drunkin the bathroom of a karaokebar with I thought to look intoautomated bathroom supplymakers.
• Mommy, the coast guardcalled and they said they founddaddy’s iPod floating in the bayand it was still working andhad his [TD]Ameritradeaccount opened. Blog post from Wyo34
• Let those who do not careabout the bid/ask spread con-tinue to enrich those who do.David
• If I tweet in the woods and no bears hear it, will it registera post?Cindy
• I’m not a contrarian. I’m justbetting on a correction thatnever seems to come.Jake
• I thought air conditioningwould cool the planet.Damn…Theresa
• Do you have an alert to alertyou to a coming alert and oneafter you’ve been alerted?Spencer
• The VIX is so arbitraged byalgorithms now it is unable toexhibit fear.Trent
• I just committed accounticide. Joe
• I have three degrees, beenthrough law school, and I writeand publish books. None ofthat makes me a better trader.Thomas
• My magic 8-ball says I got outof the short too early. Damn,the 8-ball was right.Jackson
• Seasoned trader means youlost a lot of money but braggedabout your winners. Ric
• I survived the great bear mar-ket of 2013. It was the longestfour minutes of my life. Sam
• One from a semi-famousdudeLaw of Probability Dispersal:Whatever it is that hits the fanwill not be evenly distributed.Roger Angell
thinkMoney/25
•
15•Love Notes•Little quips from you to yours truly•Photograph byFredrik Brodén
Follow the “experts” onTwitter for all thingsmarkets, trading, andthinkorswim:@TDANSherrod@TDAJJKinahan@thinkorswim
Important InformationThese comments are excerptsfrom chat rooms, emails, and tweets submitted by TD Ameritrade clients, andtheir views and may notreflect those of TD Ameritrade.Testimonials may not be repre-sentative of the experience of other clients and are noguarantee of future perform-ance or success.
TD Ameritrade reserves theright to modify love notes forgrammar, consistency, andsimilar purposes.
lttrs.
tm25_LoveNotes_final.qxd:pages.layout 2014-08-22 11:46 AM Page 15

thinkMoney/25
•
16•News+Views•A hodgepodge of stuff we thought youshould know.
•Photograph byFredrik Brodén
•tdameritrade.com
Q: There are so many ways tofind trades in thinkorswim®. Arethere any features that you par-ticularly favor?A: Yes! But the one I like the most isas hard to find as a perfect pair ofstrappy Louboutins in the back-bot-tom shelf at a Barney’s sample sale.It’s called Trade Flash—a newwidget you can apply to your left-hand sidebar. Just click the “+”icon on the lower left-hand cornerof the left-hand sidebar and select“Trade Flash.”
The commentary you’ll see inTrade Flash comes from a groupcalled Hammerstone*. The dudesand dudettes at Hammerstone havebuilt a network of over 600 individ-uals, primarily institutional. Thesetraders communicate with oneanother to share ideas and interpretbreaking news. What you see inyour Trade Flash gadget reflectstheir immediate, collective thinking.But grammar mongers beware—these guys couldn’t give a flying
nws.
FOLLOW THE SUITRead more of Nicole’smusings on her own blog at tickertape-monthly.com/blog.
Follow Nicole on Twitter:@TDANSherrod
theta about punctuation. They’retoo busy pumping out perspectivein the here and now.
I like Trade Flash because itpulls my attention to names Imight not have been looking at. Atthe same time, the note is accom-panied with sharp perspective. Justthe other day they mentioned thata well-known trader had justentered the pit, who has a reputa-tion for buying in small incrementsso as to not call attention to theentirety of his gargantuan orders.And wouldn’t you know it, themarkets started spiking.
Q: What’s the best way to getstarted trading options?A: I recommend subscribing to RedOption**at www.redoption.comduring your learning curve. Thestrategists at Red Option will emailyou detailed trading ideas. They’llreveal their methodology behindthe trades, the risk/reward, andtheir exit strategy. Think of RedOption as training wheels for newoptions traders. Start by taking theirtrades and placing them in yourpaperMoney® account so you canlearn how the strategy reacts to liv-ing, breathing markets.
When you go to sign up, tellthem The Suit sent ya by usingcoupon code EXPLORE at thecheckout. You’ll getyour firstmonth free.
Q: Best trade ever?A: Ever? I shouldn’t kiss and tell.The best is yet to come…
Ask The
Suit•
A little Q&A withNicole Sherrod,Managing Director,Trader Group at TD Ameritrade
*TD Ameritrade, Inc. and Hammer-stone are separate, unaffiliated com-panies and are not responsible foreach other's policies or services.**Red Option Advisors, Inc. and TD Ameritrade, Inc. are separate butaffiliated firms. Advisory servicesare provided exclusively by RedOption Advisors, Inc. and brokerageservices are provided exclusively byTD Ameritrade, Inc.
Important Information
tm25_News&Views_rd2.qxd:pages.layout 2014-08-22 12:08 PM Page 16

Now that the fineprint of Google’s*stock split hascome into focus,the bigger take-away from theshare shuffle maybe what it revealsabout power in Sili-con Valley as techgiants square off togobble up start-ups.
Two years agoGoogle revealedwhat wouldbecome of one ofthe most followedand unusual stocksplits. The com-pany had tucked a“stock-dividendproposal” into itsQ1 2012 earningsreport and laterexplained it wasn’ta dividend buteffectively a stocksplit. Investorssoon realized itwasn’t really a tra-ditional stock spliteither. It was in facta form of tax-freedividend.
Common splitsare engineered tomake expensiveshare prices more
accessible to retailinvestors prone tosticker shock. Turnsout Google wasissuing a third classof “C” stock (underthe old tickerGOOG). This wasmeant to allow thefounders to boostcorporate controland keep theirlong-term vision ontrack. Class Ashares now tradeunder the symbolGOOGL, whileClass B shares,which are 56%controlled by thefounders, don’ttrade publicly.
Google’s splitgives it acquisitioncurrency at a timewhen competitionbetween the biggesttech companies hasintensified. IfGoogle or othershave to issue largeamounts of stock
for future acquisi-tions, each rolloutrisks diluting powerat the top.
Google’s movealso prompted anindex re-think. S&PDow Jones Indiceswill considerincluding secondpublicly- tradedshare classes thatS&P 500 companiesoffer between nowand September2015. Google insistsit’s making changes
because of a trendamong tech compa-nies offering multi-ple share classes.According to S&PDow Jones Indices,ignoring this trendwould lead to “dif-ficulty properly rep-resenting majormarket segmentswhile providingsufficient liquidityto accommodatetrading and neces-sary index adjust-ments,” thecompany said.
What does itmean for retailinvestors? Separatefrom a recent law-suit, Google’s moveshould stir debateabout shareholder
power and having asay. As power con-centrates at the top(meant to ward offactivist investors),it dilutes some-where at the bot-tom whereindividual investorssit. For now,investors anywherealong the foodchain may be reluc-tant to squawk—atleast when a stockis performing well.
*Symbols used forinformational pur-poses only. For moreinformation on therisk of investing, seepage 41, #1.
Important Information
GOOGLE’SSPLITGIVES ITACQUISITIONCURRENCY AT A TIMEWHEN COMPETITIONBETWEEN THE BIGGESTTECH COMPA-NIES HASINTENSIFIED.
Google’s PowerMove Matters(Maybe)Changing the rules of corporateshare issuance, one split at a time. •Words by Rachel Koning Beals
Illustration by Joe Morse
industryspotlight
toys
Toys for TradersA few of ourlatest trading faves
thinkorswim®
TRENDLINE LABELS If chart drawings aremore than pretty pic-tures to you, take agander at the newtrendline label func-tion available in theCharts tab. Theselabels, activated fromthe Drawing propertymenu, will illustrateyour chart drawings’length, slope, pricechange and more.They can be shownat all times or onhover over.
WATCHLIST SYN-CHRONIZATIONThis functionalityallows you to syn-chronize some or allof your watchlistsacross both Live andPaper trading—over-writing, renaming, ormerging lists withduplicate names. Toactivate it, go to theSystem section of theApplication Settingsmenu.
USER DEFINED PER-CENTAGE CHARTSWhen comparingapples to oranges (orAAPL to /OJ) it’shelpful to start fromsome commonground. This iswhere percentage-based charts come inhandy. Found in theCharts tab, thesecharts now have theability to set the 0%level at to any pointon the chart, ratherthan just the originpoint, so that per-centage changes canbe measured bothforward and back-ward in time.
tm25_News&Views_rd2.qxd:pages.layout 2014-08-22 12:08 PM Page 17

thinkMoney/25
•
18•Trade Management•tdameritrade.com
HOWTOA
TRADEIN TRADING, LOSSES ARE INEVITABLE. SO LEARNING WHAT TO DO
WHEN FACING THEM IS AS IMPORTANT TO A SOUND STRATEGY AS, WELL, WINNING. THE NEXT TIME YOU’RE FACING A LOSS, WHAT CHOICES DO YOU HAVE?
QUITE A FEW, ACTUALLY.WORDS BY GREG LOEHR PHOTOGRAPHS BY FREDRIK BRODÉN
tm25_HowToLose_f2_rd2.qxd:pages.layout 2014-08-22 11:39 AM Page 18

O
E
tm25_HowToLose_f2_rd2.qxd:pages.layout 2014-08-22 11:39 AM Page 19

thinkMoney/25
•
20•Trade Management•tdameritrade.com
If you’ve ever seen the hitTV Series ‘House, M.D.’, youunderstand the basic plot ofdoctors trying to narrow downthe correct diagnosis based onthe symptoms then providetreatment.
Trading is similar. You’re thepatient. Your symptoms caninclude anguish, lost money,
frustration. The diagnosis is clear: a trade is losing—perhaps is even on life support. But what’s the correctcourse of treatment? That’s the tough question.
When you’re facing a bad loss, the idea of ‘informedconsent’ becomes critical. Of course you could justclose a trade and move on. But where’s the fun in that?Let’s look at how to handle a losing trade in three ways,other than giving up, and what those decisions meanfor the health of your book.
EXPLORING THE “HOW”Let’s imagine a short-call spread is the patient. This is aspecific kind of trade, but these ideas will apply to lotsof other fancy trading moves such as calendars, ironcondors, and single-option positions.
Imagine that with stock MNKY at $345, you’re look-ing to sell a call vertical. You sell a 30-day 375/380 callspread for a $1.00 credit (that’s $4.00 maximum risk,and $1.00 reward, less transaction costs). Your tradeplan dictates that if the trade moves against you andrises to $2.00, you’ll buy the spread to close and limitthe loss to $1.00. Sounds reasonable.
However, the moment of reckoning has arrived. Inless than two weeks, the stock has jumped to $370, andwhile the spread is still out of the money (OTM), it’sworth $2.00 and therefore has a $1.00 loss. What doyou do now?
One: Holding The TradeWhy not? This involves sweating it out, lighting a fewcandles, and doing a funny dance around your com-puter while you wait for the trade to move back in yourfavor. In this example, with a short OTM-call spread,you hope for the stock price dropping, time passing, ora little of both. If neither happens, you may be lookingat losses far beyond what you expected. (Ugh.)
The very scary specter of unanticipated losses canhold tremendous implications for your next trade. Sure,in this one trade you might lose more than your plandictated. But as long as the risk is small and contained itwon’t get out of hand you think, right?
First, let’s hope not. Second, and more to the point,panic is not the best course of treatment. If you learn totolerate heavier losses on certain trades, you build yourwhite blood count. You’ll adjust your longer-term trad-ing to allow for both calmer reactions when you spike afever and have to manage downturns. And you’ll dis-cover a skill for leveraging potentially greater profitwhen your trades are robust.
One last consideration: if you were looking to putthis trade on at the moment of crisis, would you? Ifthere is no rational trading reason to stay in, then close.
On the other hand, if hitting the loss exit coincides withthe stock hitting a resistance point, you may considerholding the trade to see if resistance works and thestock reverses.
Pros & Cons of Holding the Trade:(+) Possibility of a trade reversing its losses.( – ) Possibility of greater losses affecting trading attitudes and internal emotional temperatures.
Two: Adjusting The TradeWhen you adjust a trade, you alter the existing positionby introducing a new option position. Alternatively, youcan take options away in order to make the trade new.In the latter case, you believe the trade has a higher like-lihood of recovering its losses, getting back tobreakeven, or even profiting. When considering adjust-ments, focus on three things:
1. Never make an adjustment that adds risk to thetrade. That’s just turpentine on a fire.
2. Understand the “adjusted” position is in fact anew position. What is its risk and reward? Sometimes the new position is worse. Would youput it on if you weren’t already in the trade?
3. Have a plan for the new position. When will youactually get out if the new one also fails?
With the vertical spread in our example, oneadjustment could include selling an OTM put spreadto turn the position into an iron condor. So you’d turnyour short-call spread into a short-iron condor by sell-ing the 350/345 OTM put spread for $1.00, minustransaction costs. The position now is a short345/350/375/380 iron condor, and the net credittotals $2.00, less transaction costs.
By the way, this adjustment adds $1.00 to thebreakeven level. It doubles the maximum profitpotential, while reducing the risk to $3.00 andincreases time decay. No-brainer, right?
FIGURE 1: “Adjusting” the Trade. By adding another short vertical(this time a put vertical) to the short call vertical, you can mitigate somerisk while amplifying the profit potential. For illustrative purposes only.
Paging Dr. House. Dr. Gregory House.
+
_
BREAKEVEN
STOCK PRICE
Iron Condor
Short Strike
Profit
Loss
LongStrike
Short Strike
LongStrike
Loss
tm25_HowToLose_f2_rd2.qxd:pages.layout 2014-08-22 11:39 AM Page 20

Not just yet. While the “total risk” of the positionhas decreased, there are now more places where maxi-mum risk can occur. Ask yourself: if the stock reverses,am I comfortable handling the losses the new positionmight introduce?
Pros and Cons of Adjusting the Trade(+) Gives you time for the trade to work by increasingtheta. Potentially reduces net risk.(–) Creates a theater of risk that didn’t before exist.
Three: Rolling The TradeRolling means different things to different traders. Butessentially it involves moving a trade from one place toanother. That is, closing the original position, thenopening a new position with different strikes, with a dif-ferent expiration, or both.
Consider three options for rolling our hypotheticalshort-call spread as the stock moves higher:
1. Roll higher in the same month (rolling up).2. Roll to the same strikes, but in further expiration
(rolling out).3. Do both (rolling up and out).
Trade One shows a simple roll higher. Notice the rolluses a long-call condor order—buying the lower spreadthen selling the higher spread which will usually tradefor a debit. Be aware: debit and commissions can eataway at credits. Rolling for a credit’s ideal, but generallyyou need to roll to a longer expiration.
Pros and Cons of Rolling Trade 1(+) Moves your trade further away from the stockwithout adding additional time to the trade.(–) Costs money.
Trade Two shows a roll out to the next month but keepsstrike prices the same. This is traded as a ‘vertical-roll’order and with current prices is traded for a small 20-cent credit added to the overall trade credit, less transac-tion costs.
Pros and Cons of Rolling Trade 2(+) Traded for a credit, which can reduce risk. Timemay be viewed as positive if stock backs off.(–) Time is a problem if stock continues higher andtheta starts to work against you.
Trade Three demonstrates a vertical rolling up in strikeprices and out in time. Depending on time to expiration,available strike prices, and how close the spread is tothe stock, this type of roll can trade for a credit, debit, oreven money.
Rolling can be costly as the spread approaches thestock price and then goes in the money. So if you’regoing to violate your trade plan, do it before you losethe chance to roll for a credit. The question to ask your-self: do you want to add time to a trade in exchange forbreathing room and a credit?
Pros and Cons of Rolling Trade 3(+) Moves your trade further away from the stock andmaybe brings a credit. (–) Moves the trade further from expiration.
ONLY HINDSIGHT WILL DICTATE THE BESTdecisions when your trades are facing a hacking coughand cold sweats. In the main, should you alter yourtrading plan, always look a few steps ahead. What does“a healed trade” look like? Understand the implicationsof the new course of treatment. In a nutshell, that’s your“informed consent.”
SEE GLOSSARYPAGE 40
For more information on the risks of trading andoptions, go to page 41, #1 and 2.
Important Information
For illustrative purposes only.
TRADE 2EXPIRATION ONE
EXPIRATION TWO
Position-1
+1
Trade+1
-1
Bid10.90
9.10
7.60
6.30
Ask11.00
9.20
7.70
6.40
Strike375
380
385
390
-1
+1
10.10
7.90
5.80
4.00
10.20
8.00
5.90
4.10
375
380
385
390
TRADE 3EXPIRATION ONE
EXPIRATION TWO
Position-1
+1
Trade+1
-1
Bid10.90
9.10
7.60
6.30
Ask11.00
9.20
7.70
6.40
Strike375
380
385
390
-1
+1
10.10
7.90
5.80
4.00
10.20
8.00
5.90
4.10
385
390
395
400TRADE 1
EXPIRATION ONE
Position-1
+1
Trade+1
-1
-1
Bid10.90
9.10
7.60
Ask11.00
9.20
7.70
6.40
Strike375
380
385
390
For illustrative purposes only.
For illustrative purposes only.
tm25_HowToLose_f2_rd2.qxd:pages.layout 2014-08-25 2:59 PM Page 21

thinkMoney/25
•
22
LEGEND
/ January 9Single New Year’s resolu-tion to avoid margin call in2015 officially broken.
/February 6Mary Leakey birthday. Discovered that tradingmonkeys were notdescended from wolves.
/March 17Possible arb between bookclub and trading club inMarch Madness pools.
/April 14Springtime allergies. Excel-lent reason to stay indoorsand trade.
/May 1International Workers’ Day.Invite hot socialist to givetrading a try.
/June 12Roll expiring June positionsahead of recovery timefrom season’s first full-body wax.
2015 WALL CALENDARFOROPTIONMONKEYS•When you’re living fromone expiration to thenext, it can be tough tosee the daiquiris for thebananas. This is howoption monkeys stay ontop of a busy 2015. Pin it up and be informed.
Equity, index, and cash-settled currency optionsEXPIRE [3rd Friday every month]
A.M.-settled index optionsSTOP TRADING
VIX optionsEXPIRE [3rd Wednesday every month, except July 22]
Quarterly optionsEXPIRE
ExchangesTAKE DAY-OFF
JANUARY
S M T W T F S
4
11
18
25
5
12
19
26
6
13
20
27
7
14
21
28
1
8
15
22
29
2
9
16
23
30
3
10
17
24
31
FEBRUARY
S M T W T
1
8
15
22
2
9
16
23
3
10
17
24
4
11
18
25
5
12
19
26
MAY
S M T W T F S
3
10
17
24
31
4
11
18
25
5
12
19
26
6
13
20
27
7
14
21
28
2
9
16
23
30
JUNE
S M T W T
7
14
21
28
1
8
15
22
29
2
9
16
23
30
3
10
17
24
4
11
18
25
SEPTEMBER
S M T W T F S
6
13
20
27
7
14
21
28
1
8
15
22
29
2
9
16
23
30
3
10
17
24
5
12
19
26
OCTOBER
S M T W T
4
11
18
25
6
13
20
27
7
14
21
28
1
8
15
22
29
1
8
15
22
29
5
12
19
26
4
11
18
25
tm25_Calender_rd2.qxd:pages.layout 2014-08-22 11:18 AM Page 22

/July 2Practice trading with ninefingers before nation’sbirthday.
/August 11Buy new laptop after dropping old one into poolwhile trading from inflat-able mattress.
/September 4At unofficial end of sum-mer, last chance to trade inSpeedo.
/October 19Bow head and turn offtrade-notification bell forone minute in honor of 28thanniversary of ’87 crash.
/November 20Nov expiry coincides withbelow-freezing temps tosend fleas into dormancy.
/December 26Hopeful shorts pray for post-Santa rally hang-over in social media stocks.
F S
7
14
21
28
APRIL
S M T W T F S
5
12
19
26
6
13
20
27
1
8
15
22
29
2
9
16
23
30
3
10
17
24
4
11
18
25
6
13
20
27
2
9
16
23
30
3
10
17
24
31
NOVEMBER
S M T W T F S
1
8
15
22
29
2
9
16
23
30
3
10
17
24
4
11
18
25
5
12
19
26
6
13
20
27
7
14
21
28
DECEMBER
S M T W T F S
6
13
20
27
7
14
21
28
1
8
15
22
29
2
9
16
23
30
3
10
17
24
31
4
11
18
25
F S
F S
6
13
20
27
MARCH
S M T W T F S
1
8
15
22
29
2
9
16
23
30
3
10
17
24
31
4
11
18
25
5
12
19
26
6
13
20
27
7
14
21
28
7
14
21
28
5
12
19
26
JULY
S M T W T F S
5
12
19
26
6
13
20
27
7
14
21
28
1
8
15
22
29
2
9
16
23
30
3
10
17
24
31
4
11
18
25
AUGUST
S M T W T F S
2
9
16
23
30
3
10
17
24
31
4
11
18
25
5
12
19
26
6
13
20
27
7
14
21
28
1
8
15
22
29
5
12
19
26
tm25_Calender_rd2.qxd:pages.layout 2014-08-22 11:18 AM Page 23

iShares Silver Trust ETF.
For traders with mettle.
For many traders, liquidity is an important part of an overall investment strategy. iShares Silver Trust ETF was created with that in mind. Unlike physical silver, it’s easier to buy and sell — making it an option for investors who seek to maximize returns over the short term. Plus, it’s low-cost, so like other iShares ETFs, it can help you keep more of what you earn.
For details, visit iShares.com/silver
ADVERTISEMENT
SLV iShares Silver Trust
Investing involves risk, including possible loss of principal. The iShares Silver Trust (SLV or the “Trust”) is not an investment company registered
under the Investment Company Act of 1940 or a commodity pool for purposes of the Commodity Exchange Act. Shares of SLV are not subject to the
same regulatory requirements as mutual funds. Because shares of SLV are intended to reflect the price of the silver held by the Trust, the market
price of the shares is subject to fluctuations similar to those affecting silver prices. SLV has filed a registration statement (including a prospectus)
with the SEC for the offering to which this communication relates. Before you invest, you should read the prospectus and other documents the
Trust has filed with the SEC for more complete information about the issuer and this offering. You may get these documents for free by visiting
www.iShares.com or EDGAR on the SEC website at www.sec.gov. Alternatively, the Trust will arrange to send you the prospectus if you request
it by calling toll-free 1-800-474-2737. There can be no assurance that an active trading market for shares of SLV will develop or be maintained. Buying and selling shares of ETFs will result in brokerage commissions. BlackRock Asset Management International Inc. (“BAMII”) is the sponsor of the Silver Trust. BlackRock Investments, LLC (“BRIL”), assists in the promotion of the Silver Trust. BAMII and BRIL are affiliates of BlackRock, Inc. (together with its affiliates, “BlackRock”). ©2014 BlackRock. All rights reserved. iSHARES and BLACKROCK are registered trademarks of BlackRock. All other marks are the property of their respective owners. iS-11612-0214
tm25_HeyTrader_rd2.qxd:pages.layout 2014-08-22 11:32 AM Page 24

Q: Why is there acost to carry builtinto cash indexoptions when youcan’t actually buythe index?
T: Options on thingsthat are cash-set-tled—like SPX,NDX, DJX, forexample—don’tdeliver stock at expi-ration, but still havea cost-to-carry com-ponent built intotheir prices. The rea-son is that you canactually go out andbuy the stocks thatcomprise the SPXand use them as ahedge for a shortSPX call. You’d needa lot of money to doit, but it’s possible.And if the SPXoptions didn’tinclude the cost ofcarrying a portfolio
of the underlying500 stocks, then theinstitutions that dohave the money tobuy the SPX portfo-lio would have risk-free profits.
Q: I’ve heard ofother greeks likevomma and vanna.Are they useful?
T: Option greeks arederivatives of theoption pricing for-mulas themselves,like Black Scholes.And if you have ahead for calculus,you can take the 2ndand 3rd derivativesof the formulas andcome up with someinteresting-soundingmetrics. Vomma, forexample, is howmuch vega changeswhen volatilitychanges. Vanna ishow much deltachanges whenvolatility changes.But most tradersnever look at thehigher-order greeksbecause there’s onlyso much you can dowith them. If you’rean institution with ahuge options portfo-lio, then maybe forexample thesehigher greeks canshow you how toreduce your marketexposure if volatility
rises. But to mosttraders, standardgreeks offer enoughinformation to man-age positions.Understanding howchanges in thestock, vol, and timeimpact on P/Lbecome moreimportant than theimpact on individ-ual greeks.
Q: So you’re goingto a desert islandfor a year and youcan only take acase of Sriracha orCholula. Which doyou choose?
T: Wow, tough call.Sriracha is more vis-cous with a peppery,vegetable heat.
Cholula is a bitsaltier with morepiquancy than heat.Both are supremelyversatile. You haveto think regionally.If the desert island isTahiti, I’m goingwith Sriracha. IslaMujeres, Cholula.
Q: How come at-the-money LEAPSoptions have a deltahigher than .50?
T: If you look atstock options acrossexpirations, youmight notice that thedelta of the at-the-money option maybe less than .50 innear-term expira-tions, and over .50in LEAPS options
with further expira-tions. Volatility andthe cost to carryimpact the delta, butthe main reason at-the-money LEAPShave deltas higherthan .50 is the log-normal distributionof stock prices. For astock, the lognormaldistribution isbounded by $0 onthe left-hand side,and infinitely highon the right-handside. That’s becausestocks can’t gobelow $0, but couldgo infinitely higher.Because there is aslightly higher prob-ability of higherstock prices over
time, and that fact ismore pronouncedthe further out youlook, the delta ofthose further-expira-tion options can beslightly higher thanoptions in nearerexpirations. Q: After I heardAAPL bought Beatsby Dre, I bought apair of Solo2 head-phones to supportthe company. ButI’m 85 years oldand the bass makesmy artificial hiprattle. Should Ibring this up at thenext shareholders’meeting?
T: I’m not sure if theAAPL board is quali-fied to offer medicaladvice. For a quickersolution, add oliveoil and deep friedfoods to your dietfor extra lubrication.
thinkMoney/25
•
25•Ask the Trader Guy•Rescuing traders, one question at a time.
•Photograph by Fredrik Brodén
Securities mentionedthroughout are foreducational purposesonly. This is not arecommendation totrade any specificsecurity.
Important Information
trdr.
SEE GLOSSARYPAGE 40
tm25_HeyTrader_rd2.qxd:pages.layout 2014-08-22 11:32 AM Page 25

tm25_VolSkew_f3_rd2.qxd:pages.layout 2014-08-22 12:57 PM Page 26

thinkMoney/25
•
27•Volatility Skew•tdameritrade.com
WORDS BY THOMAS PRESTON PHOTOGRAPH BY FREDRIK BRODÉN
THERE’S MORE TO VOLATILITY THAN NUMBERS.LOOKING AT SKEW—DIFFERENT VOLS FROM
ONE OPTION TO THE NEXT—CAN TELL YOU A LOTABOUT WHAT THE MARKET IS THINKING, EVEN
WHEN HEADLINES ARE VAGUE. AND YOU WON’T HAVE TO BE AN OPTIONS TRADER TO “GET IT.”
ANDLIKINGIT
GETTING
tm25_VolSkew_f3_rd2.qxd:pages.layout 2014-08-22 12:57 PM Page 27

WANT TO HEAR A RIDDLE? What makes optionssmile, traders frown, flattens when it’s quiet, andsteepens at expiration? Give up? Vol skew.
Okay, maybe it’s not that funny (what do you want,the Sphinx of Thebes?). But volatility skew is anoption geek’s favorite topic. All of it may sound com-plicated and it certainly can be. But it can also be sim-pler and ultimately more useful. Wanna get theoreticalwith skew? Get yourself a math degree and go to town.But if you want to know how skew works and howyou can use it as a trader, read on.
SKEWING THE MATH SPEAKDefinitions first. The “volatility” (vol) in volatilityskew refers to an option’s implied volatility. This is nothistorical vol, or vol based on price changes in anunderlying stock or index. When plugged into a theo-retical option-pricing model, implied vol makes theoption’s theoretical value equal to the option’s currentmarket price.
Something “skewed” can be asymmetrical ortwisted. Here, volatility skew refers to implied vols thatare different from one strike to the next, or from oneexpiration to the next. A vol skew doesn’t mean some-thing went wrong. The skew or asymmetry is really anartifact of the option-pricing models themselves, aswell as the market’s anticipation of what the stock orindex might do later on. And that’s some of the infor-mation you can glean from analyzing the skew.
More, “intra-month” skew refers to implied volsbetween individual options at different strike prices ina single expiration month. “Inter-month” skew refersto implied vols between different expirations—eitherat specific strike prices, or an overall estimate ofimplied vols across all options in a given expiration.For example, an intra-month skew describes the caseof the XYZ Dec 90 put with a 25% implied vol, and the
XYZ Dec 85 put with a 28% implied vol. Inter-monthskew describes the case of the XYZ Dec 90 put with a25% implied vol, and the XYZ Jan 90 put with a 30%implied vol.
VISUALIZE SKEWVol skew is how the market deals with discrepanciesbetween option prices from theoretical models, andthe market expectations of the magnitude of a stock orindex’s potential price changes. Collective supply anddemand and market activity determines an option’sfair value. That price equates to an implied vol. Theoption price moves freely, and implied vol moves upor down accordingly. So, implied vol is simply anotherway of seeing the market’s estimate of whether a stockor index might move enough to make that option in the money, and that’s what you can see when youlook at vol skew.
How do we see it? The thinkorswim® platformgives you two choices. The Trade page shows the skewnumerically, while the Product Depth shows the skewgraphically.
First, you’ll find skew under the Trade tab as in Figure 1.
1. From the All Products sub tab, click on the caret tothe left of one of the options expirations in the OptionChain.
2. Select “Impl Vol, Probability, OTM, Delta” from thedrop-down menus to see the implied vol of eachoption.
As you scan across those numbers, you’ll seethey’re not the same for each strike, and that theytend to increase, the further out of the money (OTM)the strike is. Implied option vols at the same strikecan also be different in the various expiration months.
thinkMoney/25
•
28•Volatility Skew•tdameritrade.com
SEE GLOSSARYPAGE 40
Inter-month Skew
FIGURE 1: Skew By The Numbers. If you’re a data geek, you can viewthe skews in thinkorswim® between strikes of the same expiration(intra-month) or strikes between those of two different expirations(inter-month) as shown here with the Aug/Sep options. For illustrative purposes only.
Intra-month Skew
tm25_VolSkew_f3_rd2.qxd:pages.layout 2014-08-22 1:06 PM Page 28

The second way to see skew is under the Charts tab asin Figure 2, right.
1. Click the Charts tab, then the Product Depth sub-tab.2. In the upper right, click the View drop-down menu
and select OTM. You’ll see a graph of OTM impliedvols for all expirations available for a given stock orindex.
Refine the graph by choosing certain expirations orstrikes in the Series and Strikes menus, also on theupper-right-hand side.
INTRA V. INTERWith intra-month skews, the lowestimplied vol is typically the at-the-moneystrike or near it. As Figure 2 also shows,implied vols slope upward and awayfrom the at-the-money, typical for stockand stock-index options. The slope forthe implied vols of the lower strikes (cor-responding to OTM puts) is also steeperthan for higher strikes (corresponding toOTM calls).
Here, the put slope’s steepness rela-tive to the call slope is the market’s wayof saying it sees larger potential downmoves—common for stocks. By contrast,given a fear of shortages and higherprices, commodities often have a steepercall vs. put skew. Generally, the steeperthe skew, the higher the implied vols ofOTM options. And the greater the likeli-hood the market sees the stock or indexreaching OTM strikes.
In equity and equity-index options,the intra-month skew tends to makeOTM calls cheaper than puts that areOTM by the same amount. That’s nor-mal. Selling naked puts on stocks you’rethinking of buying anyway can be a goodalternative to buying the stock outright ifyou’re willing to take on the risk. Theshape of equity skews also tends to giveOTM call verticals slightly higher pricesthan OTM put verticals. And selling callverticals on stocks on which you’re bear-ish can be an alternative to shorting thestock. These short premium strategies can be moreattractive when overall vol is slightly higher and theskew is steeper on the put vs. call side.
With inter-month skew, the same isalso true. If one expiration has a higher volthan another, the market may expect largerprice changes coming by the expirationwith the higher vol. One caveat: as expira-tion approaches option vega—the changein an option’s premium when volatilitychanges—decreases. The lower the vega,the larger the vol change required to makethe option price change. At expiration,when OTM options have low prices andlow vegas, their implied vols can be highand make the skew steep. This isn’t neces-sarily the market seeing large pricechanges at expiration (though it’s possi-ble), but rather the confluence of expira-tion and low vega.
Inter-month skew is often most pro-nounced on stocks that have upcomingearnings or news announcements. Optionsin expirations close to news tend to have ahigher implied vol because news eventscould induce stock-price changes. If youwant a short premium strategy regardless ofa news event, take advantage of higher volin the inter-month skew—which make cal-endar and diagonal spreads more attractive.But remember that vol is higher for a rea-son. And the market anticipates larger pricechanges around news, which might bedetrimental to some option strategies.
ULTIMATELY, THINK OF LEVERAGINGskew like playing darts in the wind. To hitthe bull’s eye, you need to adjust how you
throw the dart to account for the strength of a marketbreeze. Skew is similar. It doesn’t necessarily changeyour bullish or bearish stock bias—you’re still lookingto hit the bull’s eye—but you can pick strategies thathelp you take advantage of skew’s influence on yourdart and aim for more successful trades.
FIGURE 2: Visualizing Skew. If pretty pictures are your thing, viewthe intra-month skews (each solid color line) or inter-month skews (samestrikes between colored lines) under the Product Depth page in theChart tab of thinkorswim.® For illustrative purposes only.
Spreads, Straddles, andother multiple-legoption strategies canentail substantialtransaction costs,including multiplecommissions, whichmay impact any poten-tial return. These areadvanced option strate-gies and often involvegreater risk, and morecomplex risk, thanbasic options trades.
The naked put strat-egy includes a high riskof purchasing the corre-sponding stock at thestrike price when themarket price of thestock will likely belower. Naked optionstrategies involve thehighest amount of riskand are only appropri-ate for traders with thehighest risk tolerance.
For more informa-tion on the risks ofinvesting in options,please see page 41, #1 & 2.
Important Information
Intra-month Skew
Inter-month Skew
tm25_VolSkew_f3_rd2.qxd:pages.layout 2014-08-22 12:57 PM Page 29

tm25_Futures4Fun2_rd2.qxd:pages.layout 2014-08-22 10:55 AM Page 30

• Going out on a limb here, but you’veprobably heard two things about the CBOEVIX lately. One, it’s a “fear index” thatgauges market sentiment. And two, that it’sbroken.
Broken? Certainly, the index must pro-vide some insight into market sentiment,right? But rather than get out-foxed byguessing where the VIX will peak or trough,let’s jump right in and talk about “termstructure” and backwardation—when theprice of a future is lower than the currentcash price (spot price) of an underlyingasset. Using the S&P 500 as the benchmark,when the market falls, VIX typically rises.As you’re watching for signs of capitulation(sellers washing out), you want to be look-ing for peaks in the VIX at prior highs, oreven higher. But will the peak be 18, 22, 30,or some greater value? When analyzing VIXfutures, you may find the greater concernisn’t about the overall level of the VIX at all.But rather the term structure.
THE MARKET’S MORSE CODEVIX futures (/VX) are made up of variousexpirations based on where the marketthinks the VIX will be at different points inthe future. These expirations move up anddown together, but generally not at thesame rate. As the VIX reaches extremehighs, you’ll typically find that the longerexpirations move up less, creating a situa-tion where the price of the front monthVIX contract may shoot higher than longerexpirations.
This type of structure is referred to as“backwardation.” Figure 1 is an example ofbackwardation taken on February 3, 2014using the “Product Depth” feature on thethinkorswim® platform (located in the sub-menu at the top of the Charts page). You’llnotice that the March contract was tradingat 18.59 (the first point on the left), which ishigher than both April and May which weretrading at 18.44 and 18.51, respectively.This indicates that the /VX market is inbackwardation and often times marks anear-term low in the market.
OK, so now we have a signal that themarket may bottom. The next challenge ishow to trade it. While there’s more than oneway to skin a fox, the leverage-and-rewardpotential that futures provide can be attrac-tive for some investors willing to assumethe risks. For example, consider a simpletrading system using the E-mini S&P 500Index Futures (/ES) as follows:
Entry1. /VX closing in a backwardation condition AND 2. /ES closes below previous day’s close by >1 x 14-day ATR
Exit1. Trailing stop set 1.5 x 14-day ATR2. Roll to next month with 10 days to expira-tion
On February 3, 2014 the fourteen-periodAverage True Range (ATR) was at 19.88.With the /VX closing in backwardation,and /ES having closed more than one timesthe ATR, or $44 lower than the previousday’s close at 1733, an entry was triggered.The trail stop would have been set $29.82(1.5 x ATR of 19.88) below the entry price.
Upon entry, the active contract would betraded and should be rolled to the nextmonth 10 days before expiration. The exitoccurred on March 3 when /ES had a cor-rection of more than $29.82 below the high-est priced reached—which triggered thestop and the trade was automaticallyclosed. Over the period from June 2013through June 2014, this strategy would haveproduced about five trades that would havelasted on average a little over a month.
THE VIX IS AN ENIGMATIC MARKET animal that many watch but few are reallyable to hear what it’s trying to tell them.The focus on level is part of the picture. Butwhen combined with the /VX term struc-ture you have a powerful tool that may helpyou stay calm when markets panic.
thinkMoney/25
•
31•Futures 4 Fun•Futures nuggets with thinkorswim
•Words byBrandon Chapman
•
What can VIX futures say aboutmarket bottoms? Apparently a lot.
Bottom’s Up
ftr.
For more information on the general risksof trading, options, and futures, please seepage 41, #1-3.
Important Information
FIGURE 1: Marking a bottom? Looking at distant VIX contracts relative to the current(shown here in thinkorswim) helps find possible bottoms. For illustrative purposes only.
MARCH 1418.59
APRIL 1418.44
MAY 1418.51
SEE GLOSSARYPAGE 40
Open a Future's AccountFor qualified accounts,you'll need Level 3 optionsapproval to trade Futures.Log in to your account attdameritrade.com. Underthe Trade tab, go toFutures & Forex for moreinformation.
tm25_Futures4Fun2_rd2.qxd:pages.layout 2014-08-22 10:55 AM Page 31

SPCLFOCUS
tm25_SpecialFocus_f4_rd2.qxd:pages.layout 2014-08-22 12:50 PM Page 32

FINDING GOOD TRADES ISN’T A CHEST-THUMPING EXERCISE. IT’S ABOUT MAKING GOOD USE OF YOUR HEAD AND YOUR TOOLS TO SIFT
THROUGH THE UNIVERSE OF SYMBOLS FOR THE FEW THAT ARE TRADE-WORTHY. WHILE WE CAN’T HELP YOU WITH YOUR HEAD, THINKORSWIM® HAS YOU COVERED ON THE TOOLS.
thinkMoney/25•
33•How to Pick a Stock•tdameritrade.com
WORDS BYTHOMAS PRESTON PHOTOGRAPH BYFREDRIK BRODÉN
tm25_SpecialFocus_f4_rd2.qxd:pages.layout 2014-08-22 12:50 PM Page 33

thinkMoney/25•
34•How to Pick a Stock•tdameritrade.com
I get that question from two types of traders. The firsttype is someone who’s just starting out, who’s learneda few strategies but doesn’t quite know in what stocksto employ them. The second is someone who’s beentrading for a while and who may feel like she’s in atrading rut with her current stocks or indices, or overallshe just isn’t finding enough opportunities.
MASTERING THE UNIVERSENaturally we strive to be democratic in life. But to mosttraders, stocks, ETFs, and indices are not createdequally. Among the thousands of choices, some under-lying products might present better opportunities orbenefits than others, and deserve more of our atten-tion. The trick is honing in on a ”custom” short list thatyou will trade. Finding good trading spots takes time.But focusing on a subset of symbols—what I like to calla “trading universe”—is a way of streamlining andmanaging the process so it’s less overwhelming.Instead of waking up every morning and looking atthousands of symbols, look first to the symbols in yourown trading universe—think home planet vs. galaxy.
The idea is to create a list of trading symbols youcan monitor without hav-ing to continuously searchfor new ones. If you’renew, maybe your universewill have 20 symbols. Aveteran trader might have200. Having a consistentset of symbols you observeday after day will also helpyou build greater knowl-edge of your preferredstocks and indices, howthey move in relation toeach other or the market asa whole, whether they’remore or less volatile than
other stocks, or react more or less to news events orgovernment data. Consider a few tips on building your own universe using the Market Watch tools on TD Ameritrade’s thinkorswim® platform.
Trading broad indices and sectors. When creatingyour own universe, you might look first in index prod-ucts and related ETFs. This can be especially useful fornew traders, though this may appear counterintuitivebecause indices sound big and volatile. But indices,particularly diversified ones like the S&P 500, Nasdaq100, Russell 2000, and the Dow Jones Industrial Aver-age are often less volatile than individual stocksbecause they have less unsystematic risk.
In finance, broadly, there are two types of risk—sys-tematic, the risk inherent to all stocks and which diver-sification can’t reduce; and unsystematic risk, the riskparticular to an individual stock and which diversifica-tion can help reduce. Also, some index ETFs have someof the most liquid and actively traded options, as wellas single points between strikes. This can help youuncover defined-risk strategies that have relatively littlerisk. How do you find these potential opportunities?
1— Refer to Figure 1. Go to the Market Watch page andthe Quotes sub-tab. 2—Click the dot next to the word Symbol in the upper-left-hand corner, and select Public from the drop-downmenu. This opens up a list of commonly used symbolwatch lists. 3—Click Indices to see symbols for index products, andAll ETFs to see their symbols. 4—If you’re looking at an ETFs list, click on the dot tothe left of the word Symbol again, and choose Cus-tomize. 5—Select Volume from the list of available columnheadings, and click the Add Item button to have it dis-played on the symbols list. You can click on the Volumecolumn heading to sort the symbols by volume. Thatwill let you see the most actively traded ETFs. Thereisn’t any volume for indices, though.
FIGURE 1: Scan for your universe of stocks using the Quotes page under the MarketWatch tab of thinkor-swim. Clicking the dot to the left of the word “Symbol” gives you access to all the public lists as well as lets youcustomize the different columns to the right of each symbol. For illustrative purposes only.
HOW DO YOU FIND AGOOD STOCK TO TRADE?
Click small dot to open menu of lists or to customize
tm25_SpecialFocus_f4_rd2.qxd:pages.layout 2014-08-22 12:50 PM Page 34

Trade what you know. The next stock set you mightconsider for your personal universe are those issued bycompanies whose products and services you know andlike. Consider the things you buy everyday—frombreakfast cereal to gas to jeans to staplers. You mayhave encountered this approach from famous investorslike Peter Lynch or Warren Buffet. But there’s anotherimportant step: make sure the stock and its options areactively traded. No matter how well you understand acompany, trading its stock and options is harder ifthose products are not liquid.
So what do you do if a stock you like isn’t liquid?Find a correlated liquid alternative—that is, they oftenmove up and down at the same time. Many stocks
share an industry group with others, and with whichthey may be correlated. If you’re bullish on one stockin a sector, you may likely be bullish on another. Sogiven a choice of a more or less liquid stock in the samesector, it might make sense to choose the more liquidone. How do you find them?
To find other stocks in the same industry as thecompany you’re considering, go to the Market Watchpage and the Quotes sub-tab.
1—Type in the stock symbol on a watch list. 2—Click the dot to the left of the word Symbol in theupper-left-hand corner, and select Customize. 3—Add the Industry Division, Industry Group, andIndustry Sector columns. That will show you theindustry classification and sector for your stock. Thenclick Add Item(s), then OK.4—To see other sector stocks, click on the dot to theleft of the word Symbol again and click on Industry inthe drop-down menu. 5—Find the industry sectors in which your stockappears and click on the final choice. This will showyou the other sector stocks.
Trade what’s hot. To round out your custom universe,how about the stocks on everyone’s lips? If you payclose attention to market news, you’ll have a good ideaof which stocks are “Wall Street darlings” in any given
year. (For example, 2013 was the year of electric cars, asolar redux, social media, and products that start with“i” in the name.)
“Hot” stocks can present interesting opportunities,though they can cool off just as fast. Hot stocks may
not always be solid long-term investment prospects,and may be suited toshorter-term swing tradesthat try to capture event-driven price changes. Liq-uidity is just as importantwith popular stocks. Butthere might not always be acorrelated sector alternative.Misleading star power?What makes a given stocknewsworthy can also makeit act less like the otherstocks in the sector.
Aside from watchingfinancial news, under the
Market Watch tab you can find stocks getting someattention.
Top 10. Under the Quotes sub-tab, click the dot nextto the word Symbol in the upper-left-hand corner andselect Top 10 from the drop-down menu. Here you’llfind some of the most actively traded stocks, or thosewith some of the largest daily gains or losses.
Sizzle Index. You can also look at the Top 10 Siz-zling Stocks. The “Sizzle Index” compares a givenday’s total option-trading volume to the previous fivedays’ daily average. A high Sizzle Index means a lot oftrading that day in the option, which can signal publicand institutional interest.
Trade Flash. Finally, there’s the Trade Flash gadgetto see market events as they happen in real time.Stocks connected to third-party analyst upgrades ordowngrades, to news or corporate events, or to largetrades pop up in Trade Flash. Click on the Plus icon inthe panel’s lower-left corner on the platform’s left sideand select Trade Flash from the menu.
HIGH VOL FOR THE PROA final stock category that can fit a custom universemay be more appealing to veteran traders. Stockswhose options have higher implied volatility can pres-ent opportunities to traders knowledgeable aboutstrategies that benefit from higher vol—such as shortputs, short verticals, short straddles, or iron condors.These strategies offer different risk-and-reward levelsand capital requirements, which is where experience
SEE GLOSSARYPAGE 40
FIGURE 2: Finding Generals Amongst Soldiers. By customizing columns in thinkorswim®, you can findother correlating stocks in the same sector that might be more liquid. For illustrative purposes only.
What's That Symbol Again? If you don’t know theticker symbol for a pub-licly- traded company,here's a quick shortcut:
1/ Type a “?” in the symbolfield in the upper-left-hand corner of the Tradepage. That opens the Sym-bol Table.
2/ Click on the Lookupsub-tab in the SymbolTable
3/ Type in the companyname in the field at thetop. You’ll then see a list ofcompanies that have thatname along with theirstock symbols.
1/Click dot tocustomizecolumns
2/Choose IndustryDivision, Group,
and Sector
3/ Add volume and sort
by highestvolume by
clickingcolumn
tm25_SpecialFocus_f4_rd2.qxd:pages.layout 2014-08-22 12:50 PM Page 35

thinkMoney/25•
36•How to Pick a Stock•tdameritrade.com
and knowledge kick in. In fact, yourability to apply these strategies tooptions can be more important than theactual stock. Liquidity is still para-mount even with these stocks, particu-larly when you’re using sophisticatedoption strategies. But what the com-pany itself does, or your bullish or bear-ish stock bias, becomes secondary toyour skill at applying the strategies.
Sometimes a stock has higherimplied vol because its price has beenbeaten down. And maybe that’s anopportunity to buy on the dip. Ormaybe that’s a chance to sell onmomentum. Either way, higher volatil-ity can be fleeting, and these stocksmay rotate in and out of your universeon a weekly or monthly basis.
To find these stocks in the Quotespage under the MarketWatch tab, addthe Vol Index column as you did previ-ously. (Click dot to the left of Sym-bolCustomizeselect VolIndexAdd Item(s)OK.) This showsa stock option’s overall implied volatil-ity. If you load a Watch List like theDow Jones Industrial Average you cansort by the Vol Index column to seewhich of the Dow stocks have optionswith the highest implied volatility. Youmight add those to your universe soyou can easily scan them as needed.
NOW GO OUT THERE AND BUILDa custom trading universe of symbols.Run your tools once a week to keepyour universe fresh. Finding stockswith the methods described here doesnot guarantee success. But a good per-sonal stock universe lets you quicklyscan the market, evaluate tradingopportunities more easily, and poten-tially save a lot of time.
The Scan Page is a pow-erful tool that searches
the data stream of stock and option pricesto find symbols that meet fundamental,technical, and option-based criteria ofyour own creation. To create your universeof symbols, just look at the Stock Hacker
sub-tab. Stock Hacker is a scanning toolthat by default looks at all stocks. But youcan narrow down the number by clickingthe “Scan In” drop-down menu andchoosing a Watch List.
You can also use the “Intersect With”menu to scan only for stocks common to
FIGURE 1: Hack Your Universe. In a few steps, Stock Hacker in thinkorswim will help you find a list of stocks totrade with all your criteria. For illustrative purpose only.
•
If you’re already trading equity options, you’re halfway there
HOW TO“HACK” ASTOCK LIST
STOCK
You can scan stockscommon totwo lists.
Then...1/ Click
to add stock,option, or
study filtersbelow
2/ Click to showdesired
number ofstocks
3/ Click to start scan
and viewresults below.
4/ Save your universe
tm25_SpecialFocus_f4_rd2.qxd:pages.layout 2014-08-25 3:07 PM Page 36

Q: What’s a good way tomeasure liquidity in astock or option?A: A way to measure stockand ETF liquidity is bytrading volume and thewidth of the bid/askspreads. The higher thevolume, and the narrowerthe bid/ask spread, themore liquid a stock. Optionliquidity can be measuredby volume and width of thebid/ask spread, too, as wellas by open interest. Thehigher the open interest,the more liquid an optionmay be.
Q: Should I have posi-tions in all the symbols ofmy trading universe?A: Not necessarily. First,you might not see a tradingopportunity in every sym-bol. Second, you may nothave enough capital to dotrades in every symbol.And third, you might notbe comfortable monitoringpositions in all the sym-bols. Strategy selection,position size, and risk toler-ance should drive tradingdecisions, rather than try-ing to have positions in alarger number of symbols.
Q: Can I share my uni-verse of symbols with oth-ers?A: Absolutely. If you’vesaved your universe ofsymbols in a Watch List,click on the dot next to theword Symbol in the upper-left-hand corner and selectShare from the drop-downmenu. Select the WatchList you want to share, thencreate the link to share via
email, Facebook, Twitter ormyTrade®.*
Q: How can I see whethertwo stocks are correlated? A: Go to the Charts pageand the Charts sub-tab, andload up your symbol’schart. Click on the Studiesbutton in the upper-right-hand corner, then AddStudy, then All Studies,then C-D. Choose Correla-tion from the drop-downmenu. By default, you’llsee the correlation betweenthe chart symbol and theSPX. Click on Edit Studies,and move your mouse overCorrelation. Click on thewrench icon, then changeSPX to the other stockagainst which you want tosee the correlation in theCorrelation with Securityfield. You’ll find a correla-tion in the lower part of theCharts page.
Q+A
STOCKCarefully consider the investment objec-tives, risks, charges, and expenses of anexchange traded fund before investing. Aprospectus, obtained by calling 800-669-3900, contains this and other importantinformation about an investment com-pany. Read carefully before investing.
Spreads, Straddles, and other multi-ple-leg option strategies can entail sub-stantial transaction costs, includingmultiple commissions, which mayimpact any potential return. These areadvanced option strategies and ofteninvolve greater risk, and more complexrisk, than basic options trades.
The naked put strategy includes ahigh risk of purchasing the correspon-ding stock at the strike price when themarket price of the stock will likely belower. Naked option strategies involvethe highest amount of risk and are onlyappropriate for traders with the highestrisk tolerance.
*myTrade is a service of myTrade, Inc.,a separate but affiliated firm. In order touse the service, you must create a myTradeprofile, and conform to the myTrade termsof use. Any content shared by usersthrough myTrade is neither endorsed norapproved by TD Ameritrade.
Important Information
two Watch Lists, like tech stocks in theS&P 500. You’ll also see drop downmenus for various criteria like price, netchange, or volume. From there:
1—Click on the Add Stock Filter, AddOption Filter, or Add Study Filter buttonsto create refined scans. The histogramshows you the number of symbols in-between minimum and maximum val-ues for a particular criterion.
2—Next, click on the Show drop-downmenu in the middle of the right-handside of the Stock Hacker tab to determinehow many symbols will be displayed.
3—Click the Scan button in the far-right-hand side to see results.
4—Finally, click the disk icon in the far-right-hand side of the scan results tosave the symbols in a Watch List.
tm25_SpecialFocus_f4_rd2.qxd:pages.layout 2014-08-25 3:07 PM Page 37

tm25_CoolScripts_rd2.qxd:pages.layout 2014-08-22 9:50 AM Page 38

• Volatility may not tell you which way is up, but it canpoint to possible trading signals. Let’s create athinkScript that uses Bollinger Bands to simultaneouslyanalyze price and implied volatility to generate possibletrading signals.
Our goal? Let’s have thinkorswim color a price bar adifferent color when the implied volatility of the under-lying is outside its own set of Bollinger bands—covering95% of volatility’s normal range of movement, or ingeek-speak, two standard deviations. The indicator isdesigned to point out time where a trader may want toget long (below the lower band), or short (above theupper band) volatility.
THE SCRIPT*Cut and paste each of the following lines into your Scripteditor. But be sure not to include the line numbers.1. #Hint: Bollinger Bands for IV2. declare lower;3. declare hide_on_intraday;4. input length = 10;5. input NumberofDevs = 2;6. def data = ImpVolatility();7. def up = close > open;8. def down = close < open;9. def offset = NumberofDevs * Stdev(data, length); 10. #The plots that will be drawn on the chart11. plot IV = data;12. plot MidLine = Average(data, length);13. plot UpperBand = MidLine + offset;14. plot LowerBand = MidLine - offset;15. #Changing the color of the chart to make it pop andsignificant time 16. AssignPriceColor(if data > upperBand and downthen Color.YELLOW else if data < lowerBand and upthen color.BLUE else color.current);
THE SKINNYLine 1. Recall that the hash tag “#” creates a note inyour script to create hints or to keep track of whatyou’re coding.
Line 2-3. Next, two declarations. Declaring somethingapplies to how the script can or should be used. In thiscase, we declare this a lower study, and also hide thison any intraday aggregation.Line 4. Length defines how many periods should beused to calculate average and standard deviation. Line 5. NumberofDevs defines the number of standarddeviation moves the band will be drawn away fromthe implied vol.Line 6. We’re defining our data as implied volatility.You can also define up-price bars and down-price barsto be used later. Lines 7-9. This is perhaps the most important piece ofthe script, the logic on which Bollinger Bands arebased.Lines 11-14. Here is where we tell the script what toplot. The Midline is simply the average of what wedefine as data (implied volatility) for our chosennumber of periods, then we add the upper and lowerbands of the Bollinger band. Line 16. The kicker. This line checks if the implied volis above or below the bands around the average. Italso monitors if significant moves are on down-pricemoves or up-price moves. If there’s an increase inimplied vol and the price moves up, the bar is paintedyellow. If implied volatility is above the upper bandon a down move, the bar is painted blue. This drawsyour attention to a point you can define as important.Normally, when a price moves down, implied volatil-ity increases. So an up move in price, above whenimplied volatility is out of its normal range, indicatesa price trend could be changing. This same idea trans-lates to a down move in price when implied volatilityremains lower than normal.
thinkMoney/25
•
39•Cool Scripts•When thinkorswim®
doesn't have it,thinkScript® it
•Words byDavid “Mr. Script”Kier
scr.
For general information, see page 41, #1.
OOPS. WE GOOFEDIn the “Cool Scripts” column in the last issue (Summer 2014), there was atypo in the sixth line of code. The code should read exactly as follows(including spacing of characters): ratio.AssignValueColor(if ratio >=ratio[1] then Color.UPTICK else Color.DOWNTICK);
SEE GLOSSARYPAGE 40
•
Finding trading signals whenvolatility hits extremes
Bollinger Band-ing Volatility
*SCRIPT SHARE! To skip the coding yourselfand download David’sthinkScript straight intothinkorswim, copy the following link to yourbrowser. http://bit.ly/volbollinger
For a refresher on howto use thinkScript, seeour Script-Writing Focus inissue 22, Winter 2014.
Important Information
FIGURE 1: Bollingers on Volatility. This cool script turns the first bars a customcolor after a breach of extreme volatility. For illustrative purposes only.
Hit the top of theband on an up dayindicating the beginning of a move.
Hit the bottom of theband on a down dayindicating the end ofthe move.
tm25_CoolScripts_rd2.qxd:pages.layout 2014-08-22 9:50 AM Page 39

thinkMoney/25
•
40•The Token Glossary•Terms you might stumble across in this issue.•tdameritrade.com
gls
IRON CONDOR• A defined-risk, short-
spread strategy, con-structed of a short-put
vertical and a short -call vertical. You
assume the underly-ing will stay within a
certain range(between the strikesof the short options).
The goal: As timepasses and/or volatil-ity drops, the spreads
can be bought backfor less than the credit
taken in, or expireworthless, resulting in
a profit. The risk istypically limited to the
largest differencebetween the adjacent
and long strikes,minus the total credit
received.
AVERAGE TRUE RANGE
• A measure of volatil-ity that takes into
account an equity'srange in prices
between its truehighs and lows versus
just its closing pricesover a period of time
(typically 14 days).
AT THEMONEY(ATM)• An option whosestrike is “at” the priceof the underlyingequity. Like out-of-the-money options,the premium of anat-the-money optionis all “time” value.
Short put (selling naked put)•A bullish, directional strategy withunlimited risk in which a put option issold for a credit, without another option(of a different strike or expiration) orinstrument used as a hedge. The strategyassumes that the stock will stay above thestrike sold; in which case, as time passesand/or volatility drops, the option can bebought back cheaper or expire worthless,resulting in a profit.
VERTICAL SPREAD(LONG AND SHORT)• A defined-risk, directional spreadstrategy, composed of a long and shortoption of the same type (i.e. calls orputs). Long verticals are purchased fora debit, while short verticals are soldfor a credit at the onset of the trade.Long-call and short-put verticals arebullish, whereas long-put and short-callverticals are bearish. The risk of a longvertical is typically limited to the debitof the trade, while the risk in the shortvertical is typically limited to the differ-ence between the short and longstrikes, less the credit.
THETA• A measure of an option’s sensitivity totime passing one calendar day. For exam-ple, if a long put has a theta of -.02, theoption premium will decrease by $2.
Implied volatility• The market’s perception of the future volatility of the underlying security,
directly reflected in an option’s premium. Implied volatility is an annualized numberexpressed in percent (such as 25%), is forward-looking, and can change.
39found on page:
Gamma• A MEASURE OF HOW MUCH ANOPTION’S DELTA IS EXPECTED TOCHANGE PER $1 MOVE IN THEUNDERLYING.
13
Standard deviations• A statistical measurement of the distribu-tion of a set of data from its mean. For pricecharts, this is the historical volatility, or the
average distance that the price of an assetmoves away (deviates) from its mean.
29
OUT OF THE MONEY(OTM)• An option whosepremium is not onlyall “time” value, butthe strike is awayfrom the underlyingequity. For calls, it’sany strike higher thanthe underlying. Forputs, it’s any strikethat’s lower.
12, 20 & 29
CBOE VOLATILITY INDEX (VIX)• The VIX measures the implied volatility(“vol”) of the S&P 500 index (SPX) options.
found on page:
39
IN THEMONEY(ITM)• An option whosepremium contains“real” value, i.e. notjust time value. Forcalls, it’s any strikelower than the priceof the underlyingequity. For puts, it’sany strike that’shigher.
found on page:
Delta• A measure of an option’s sensitivity to a$1 change in the underlying asset. All elsebeing equal, an option with a 50 delta (alsowritten as .50) for example, would gain a 50cents per $1 move up in the underlying.Long calls and short puts have positive (+)deltas, meaning they gain as the underlyinggains in value. Long puts and short callshave negative (–) deltas, meaning they gainas the underlying drops in value.
13 & 31
found on page:
VEGA• A measure of an option’s sensitivityto a 1% change in implied volatility. Forexample, if a long option has a vega of.04, a 1% increase in implied volatilitywill increase the option premium by $4on an option with a 100 multiplier.
13, 29 & 31
13 & 21
found on page:
found on page:
13 & 35
found on page:
found on page:
found on page:
21 & 2813 & 25
found on page:
found on page:
27found on page:
found on page:
25found on page:
12 & 35
tm25_Glossary&Disclaimer_rd2.xqd:pages.layout 2014-08-22 11:26 AM Page 40

Unleash more capital with portfolio margin.
Portfolio margin offers lower margin requirements and increased buying power so you can enhance your trading strategy.
Portfolio margin can give qualified investors significantly more leverage—up to three times more buying power than standard margin—by basing margin requirements on overall portfolio risk. If you want to free up more capital and you’re prepared to actively manage portfolio risk, portfolio margin may be the right move for you.
Portfolio margin is not suitable for all investors, and not all accounts will be approved. Increased leverage can magnify returns, but can also magnify losses.
Market volatility, volume, and system availability may delay account access and trade executions.
Portfolio margin will only be approved for accounts of qualified traders who can support the risks associated with greater leverage ability. Use of portfolio margin involves unique and significant risks, including increased leverage, which increases the amount of potential loss, and shortened and stricter time frames for meeting deficiencies, which increase the risk of involuntary liquidation. Client, account, and position eligibility requirements exist and approval is not guaranteed. Carefully read the Portfolio Margin Risk Disclosure Statement, Margin Handbook, and Margin Disclosure Document for more details.
TD Ameritrade, Inc., member FINRA/SIPC/NFA. This is not an offer or solicitation in any jurisdiction where we are not authorized to do business. TD Ameritrade is a trademark jointly owned by TD Ameritrade IP Company, Inc. and The Toronto-Dominion Bank. © 2014 TD Ameritrade IP Company, Inc. All rights reserved. Used with permission.
To learn more, go to: tdameritrade.com/portfoliomargin
gin cPortfolio marrggin—by basinmar
actively manage p
can give qualified investors significements on overall equirgin rg marrg
gin mayportfolio risk, portfolio mar
eee leverage—up to thrcantly morreee uportfolio risk. If you want to fr
y be the right move for you.
e buying power than ste times morreepare pre capital and you’rup mor
dtandared tor
Portfolio margin iscan also magnify l
s not suitable for all investors, and osses.
oved.not all accounts will be appr
n mo learTTotdameritr
eeased leverage can magnify rreIncr
e, go to:morrade.com/portfoliom
ns, butetur
margin
anvolume,,Market volatility
Portfolio margin will only beincluding increased leverag
and position eligibaccount,more details.
membeInc.,Ameritrade,TD Ameritrade IP CompanyTD
nd system availability may delay account access and
e approved for accounts of qualified traders who canandwhich increases the amount of potential loss,ge,
bility requirements exist and approval is not guarante
This is not an offer or solicitatioA.er FINRA/SIPC/NFATD © 2014 oronto-Dominion Bank.TThe and Inc.,
d trade executions.
agen support the risks associated with greater leverd shortened and stricter time frames for meeting deeed.
on in any jurisdiction where we are not authorized to Useved.All rights reserInc.,Ameritrade IP Company
Use of portfolio margin involves unique and .e abilityy liqwhich increase the risk of involuntareficiencies,
and Margin Discl Margin Handbook,
Ameritrade is a trademark jointly oTD do business.ed with permission.
significant risks,Client,uidation.
osure Document for
owned by
tm25_Glossary&Disclaimer_rd2.xqd:pages.layout 2014-08-22 11:36 AM Page 41

thinkMoney/25
•
42•The Back Page•tdameritrade.com
Turkey
YOU’LL BE PROUD TO SERVE THIS EASY-TO-CARVE BIRD AS THE CENTERPIECE OFYOUR THANKSGIVING FEAST.
Ingredients:10 packs turkey hot dogs (reserve two dogs)Mayonnaise
• Mash turkey dogs into shape of turkey bodyusing mayonnaise as needed to retain form. Carefully push the two turkey dogs into the bodywhere the legs would protrude. Cap legs with paper crowns if available.
HolidayMenu forTraders•Long on delta and short on time this Thanksgiving? That doesn’t mean you can’timpress your family andfriends while keepingyour hands on your key-board. After all, you’ve gotobligations to them, too.
These recipes are theclassics, reborn— thetrader’s “synthetic equivalent” of holidayfavorites. And best of all,they can be made in thepre- and post-markethours so cooking doesn’tinterrupt your trading.
Cranberry sauce
UH, IT’S CRANBERRY SAUCE. DOES ANYONE REALLY CARE IF IT’S HOMEMADE?DON’T FORGET THE CAN OPENER.
Ingredients:1 can cranberry sauceOptional: 1 jug orange juice
• Open can of cranberry sauce and serve. For bestpresentation, turn can over on a plate. Carefullylift can while preserving perfect cylindrical shape.Mash vigorously with fork. For a delightful, citrus-infused twist, pour orange juice reduction on topand stir into cranberry mixture.
Stuffing
THIS SWEET N’ SAVORY RECIPE IS SCALABLE SO YOU CAN MAKE ENOUGH FORYOUR HUNGRY CROWD.
Ingredients:5 loaves white bread5 loaves wheat bread2 bottles cola2 cans salted nuts
• Mix together white and wheat bread in mixing bowl. Mix in nuts. Moisten to taste with cola.
Apple pie
THIS THANKSGIVING FAVORITE WILL PROVIDETHE PIECE-DE-RESISTANCE TO YOUR MEAL.
Ingredients:20 Hostess fruit pies (apple flavor)1 box graham crackers1 can Ready Whip
• Arrange graham crackers on bottom and sides ofpie plate. Blend fruit pies in blender until evenlychunky. Pour pie mixture onto graham crackers inplate. Make decorative design on top with ReadyWhip. Alternate flavors: lemon and cherry.
eat.
WHAT’S YOURFAVORITE TRADER-HOLIDAY RECIPE?You know you have one.Share it by sending [email protected]
tm25_BackPg-Menus.rd2.qxd:pages.layout 2014-08-22 11:14 AM Page 42

2/ OPTIONS STRATEGIESTrading options involves unique risksand is not suitable for all investors.Mini-options do not reduce the pershare cost or price of options.
Spreads, condors, butterflies, strad-dles, and other complex, multiple-legoption strategies can entail substantialtransaction costs, including multiplecommissions, which may impact anypotential return. These are advancedoption strategies and often involvegreater risk, and more complex risk,than basic options trades. Be awarethat assignment on short option strate-gies discussed in this article could lead
to unwanted long or short positions onthe underlying security.
The naked put strategy includes ahigh risk of purchasing the correspon-ding stock at the strike price when themarket price of the stock will likely belower. Naked option strategies involvethe highest amount of risk and are onlyappropriate for traders with the highestrisk tolerance.
Naked option strategies involve thehighest amount of risk and are onlyappropriate for traders with the highestrisk tolerance.
The risk of loss on an uncovered calloption position is potentially unlimitedsince there is no limit to the priceincrease of the underlying security.
Option writing as an investmentstrategy is absolutely inappropriate foranyone who does not fully understandthe nature and extent of the risksinvolved.
A covered call strategy can limit theupside potential of the underlying
stock position, as the stock wouldlikely be called away in the event ofsubstantial stock price increase. Addi-tionally, any downside protection pro-vided to the related stock position islimited to the premium received. (Shortoptions can be assigned at any time upto expiration regardless of the in-the-money amount.)
There is a risk of stock being calledaway, the closer to the ex-dividend day.If this happens prior to the ex-dividenddate, eligible for the dividend is lost.Income generated is at risk should theposition moves against the investor, ifthe investor later buys the call back at ahigher price. The investor can also losethe stock position if assigned.
The maximum risk of a covered callposition is the cost of the stock, less thepremium received for the call, plus alltransaction costs.
Rolling strategies can entail sub-stantial transaction costs, includingmultiple commissions, which mayimpact any potential return. You areresponsible for all orders entered inyour self-directed account.
Supporting documentation for anyclaims, comparisons, statistics, or othertechnical data will be supplied uponrequest.
3/ FUTURESFutures trading is not suitable for allinvestors as the risk of loss in tradingfutures is substantial. Futures tradingprivileges are subject to TD Ameritradereview and approval. Not all accountowners will qualify. Futures accountsare not protected by the SecuritiesInvestor Protection Corporation (SIPC).Equity options trading involves risksand are not suitable for all investors.Spreads and other multiple-leg optionstrategies can entail substantial trans-action costs, including multiple com-missions, which may impact anypotential return.
Futures and futures options tradingis speculative, and is not suitable for all investors. Please read the Risk Disclosure for Futures and Optionsprior to trading futures products(https://www.tdameritrade.com/retailen_us/resources/pdf/TDA631.pdf).
Futures accounts are not protectedby the Securities Investor ProtectionCorporation (SIPC).
1/ GENERAL DISCLAIMERThe information contained in this article is notintended to be investment advice and is for illustrativepurposes only. Be sure to understand all risks involvedwith each strategy, including commission costs, beforeattempting to place any trade. Clients must considerall relevant risk factors, including their own personalfinancial situations, before trading. Past performanceof a security or strategy does not guarantee futureresults or success.
Transaction costs (commissions and other fees) areimportant factors and should be considered when eval-uating any options trade. Options involve risk and arenot suitable for all investors. Supporting documenta-tion for any claims, comparisons, statistics, or othertechnical data will be supplied upon request.
It is not possible to invest directly in an index.
thinkMoney/25
•
43 •ArticleDisclaimers•Important info thatyou need to know.•tdameritrade.com
•random musings for traders at TD AmeritradeFall 2014
thinkMoney/25
10/SLAYYOURTRADINGMONSTERS18/HOW TO WIN AT LOSING
26/GETTINGSKEWED WITHVOLATILITY
STOCK-PICKING FOCUS
32/MASTERING THE UNIVERSE
Stock
Broke
rs.co
mlov
es us.
TD Ameritra
degets
#1 online broke
r...ag
ain!
(See page 9 fo
r det
ails)
important
info
tm25_BackPg-Menus.rd2.qxd:pages.layout 2014-08-22 11:14 AM Page 43

Download Mobile Trader at tdameritrade.com/mobiletrader.
Market volatility, volume, and system availability may delay account access and trade executions.
TD Ameritrade, Inc., member FINRA/SIPC/NFA. TD Ameritrade is a trademark jointly owned by TD Ameritrade IP Company, Inc. and The Toronto-Dominion Bank. © 2014 TD Ameritrade IP Company, Inc. All rights reserved. Used with permission.
TD Ameritrade Mobile Trader: the app that delivers desktop power when you’re on the go.
trading platform.
top
woD
ardearTeliobMdaolwn
ta
n.osiismerphtiwdesUARNIr Febme, m.cn, IedartiremD AT
etsyd sn, aemulo, vytilitalot vekraM
nwy oltniok jramedars a te idartiremD A. TAFN/CPIS/A
exe edard tns asecct anuoccy aaley day mtilibaliavm ae
n
da
oroe Thd Tn. acn, IynapmoP Ce IdartiremD Ay Td ben
.snoituce
twoD
a
et
pmoP Ce IdartiremD A4 T10. © 2knan BoinimoD-otn
liobm/moc.dearitrema ardearTeliobMdaolwn
.
.
devreses rthgil rl. Acn, Iyn
rdearta
PRSRT STDUS PostagePaidTD Ameritrade
The risk of loss in trading securities, options, futures, and forex can be substantial. Clients must consider all relevant risk factors, including their own personal financial situations, before trading. Options involverisk and are not suitable for all investors. See the Options DisclosureDocument: Characteristics and Risks of Standardized Options. A copyaccompanies this magazine if you have not previously received one.Additional copies can be obtained at tdameritrade.com or by contactingus. Trading foreign exchange on margin carries a high level of risk, as well as its own unique risk factors. Please read the followingrisk disclosure before considering trading this product: Forex Risk Disclosure (www.nfa.futures.org/NFA-investor-information/publication-library/forex.pdf). A forex dealer can be compensated via commission and/or spread on forex trades. TD Ameritrade, Inc.,member FINRA/SIPC.TD Ameritrade is a trademark jointly owned by TDAmeritrade IP Company, Inc. and The Toronto-Dominion Bank.© 2014 TD Ameritrade IP Company, Inc. All rights reserved. Used with permission.
thinkMoney from TD Ameritrade200 S. 108th AveOmaha, NE 68154
TDA 2012 09/14
tm25_Backcover.qxd:pages.layout 2014-08-22 9:04 AM Page 44