thinking skills and admissions - cambridge assessment
TRANSCRIPT

Thinking Skills andAdmissions
A report on the Validity and Reliability
of the
TSA and MVAT/BMAT Assessments
Alan Willmott
September 2005

Contents
Section Contents Page
List of Tables iv
Overview vi
Note on References in this Report vii
1 Background 1
1.1 UCLES, Thinking Skills and MENO 11.2 A Growing Problem with Admissions 31.3 A Trial 31.4 A Further Development 4
2 The TSA Questions 5
2.1 The Six Skills of MENO 52.2 Other Developments 52.3 The TSA 6
3 Validity and Reliability 7
3.1 Some Properties of an Assessment 73.2 Validity 73.3 Reliability 83.4 Validity and Reliability 8
4 The Reliability of the TSA Tests 10
4.1 The Early Development of Thinking Skills 104.2 CTSC and CATS 104.3 TSA Pre-tests 114.4 TSA Tests 124.5 Other Uses of TSA 134.6 The Reliability of TSA 13
5 Issues of Validity 14
5.1 Some Early Findings 145.2 The Use of TSA 145.3 TSA Scores as Predictors of Achievement 145.4 Prediction by TSA Score Sub-scale 165.5 The Use of TSA in the Admissions Process 165.6 Some Comments from Users 185.7 Bias in TSA Questions 19
Thinking Skills and Admissions ii

Contents
Section Contents Page
6 Critical Thinking and Problem Solving: One Skill or Two? 20
6.1 The Two Sub-scales 206.2 Early Results 216.3 Results for TSA Analyses 216.4 Sub-scale Inter-Correlations 226.5 The CT and PS Sub-Scales 236.6 The Implications of the Findings 24
7 The MVAT and the BMAT 25
7.1 The Need for an Aid to Admissions in Medical Courses 257.2 The Reliability of the MVAT and BMAT Assessments 25
7.2.1 MVAT and BMAT Part 1 257.2.2 MVAT and BMAT Part 2 267.2.3 MVAT and BMAT Part 3 26
7.3 MVAT and BMAT Scores as Predictors of Performance 267.4 The Use of MVAT and BMAT in the Admissions Process 277.5 The MVAT and BMAT Sub-Scores 297.6 The Sub-Scale Inter-Correlations 307.7 The Implications of the Analyses 30
8 TSA and BMAT in the Future 31
8.1 Much Needs Doing 318.2 Some Comments and Conclusions 338.3 Suggestions for Further Work 33
Appendix A TSA Test Specification 34
Appendix B Areas for Further Work 35
References 36
Thinking Skills and Admissions iii

List of Tables
Table Number Content Page
1.1 Applications and Admissions for the 3University of Cambridge in 1973 and 2003
4.1 Reliability Estimates for CTSC and CATS 11Assessments – 1996-2003
4.2 TSA Pre-test Reliability Estimates 11
4.3 TSA Reliability Estimates 12
4.4 Reliability Estimates for Other Uses of TSA Tests 13
5.1 Correlations of TSA Scores with First-Year Results – 152001-3 and 2002-4
5.2 Correlations of CT and PS Scores with First Year Results – 162002-4
5.3 TSA Score by Application Decision – 2003 Cohort 17
5.4 TSA Score by Application Decision: 17Subject B Applicants – 2003 Cohort
5.5 Correlations between TSA Sub-scores and 18Application Outcome
6.1 Estimated Reliability of TSA Sub-scores – Early Results 21
6.2 Summary of Sub-Scale Analyses for TSA tests 22
6.3 Correlations between the Sub-Scales of TSA Tests 23
7.1 Reliability Estimates for Part 1 of the MVAT/BMAT Tests – 261999 - 2004
7.2 Reliability Estimates for Part 2 of the MVAT/BMAT Tests 26– 1999 - 2004
7.3 Predictive Validity of MVAT 2000 27
7.4 MVAT Scores by Application Decision – 2000 27
7.5 Correlations - MVAT Scores and Application 27Decisions – 2000
7.6 MVAT Scores by Application Decision – 2001 28
7.7 Correlations - MVAT Scores and Application 28Decisions – 2001
Thinking Skills and Admissions iv

List of Tables
Table Number Content Page
7.8 MVAT Scores by Application Decision – 2002 28
7.9 Correlations - MVAT Scores and Application 28Decisions – 2002
7.10 BMAT Scores by Application Decision – 2003 28
7.11 Correlations - BMAT Scores and Application 29Decisions – 2003
7.12 Summary of Sub-Scale Analyses for Part 1 of MVAT/BMAT 29
7.13 Correlations between the Sub-Scales 30of Part 1 MVAT and BMAT
Thinking Skills and Admissions v

Overview
This report provides some background details of the work by UCLES onThinking Skills since the late 1980s, and in so doing draws heavily on thereport by Joyce Chapman (Chapman, 2005) who was closely involved inthat work. Reference is made to project documents that were producedin those early days but unfortunately not all are still available now (seenote about the availability of references on page vii).
The report draws together much of the past and current work andevaluates both the TSA and part of the MVAT/BMAT tests used to dateand looks at the TSA as a predictor of university achievement.
Some new work has been undertaken but the aim has been to drawtogether the previous work on which these assessments are based andto review the TSA and BMAT assessments that have so far been used.
In essence both the TSA and BMAT (Parts 1 and 2) are found to bereasonably sound assessments. There is little predictive validityinformation available as yet but what there is does not offend and,indeed, could be taken to be cautiously optimistic about futuredevelopments.
There are many pointers to further work that is needed and the evidencepoints to the urgent need for a wider data set to be collected so thatdifferent analyses can be carried out to confirm the usefulness of thetests. A summary of these points can be found in Appendix B.
It is also clear that the current work to train new Question Writers andproduce new questions is very much due as there are signs that withoutcareful attention the development of the assessment of Thinking Skillsmay falter following the initial burst of activity with questions from thepast.
Finally, given the growing importance of Thinking Skills and the effectsthat can follow from the teaching of these skills, there is a need toconsider whether there is a need to produce support materials forteachers.
As with most reports of this kind, the author is grateful to others for workdone and suggestions made in enabling this report to come about bothby providing data and test information. Thanks are due in this regard toRobert Harding, Alec Fisher, Mark Shannon, Alf Massey and AlastairPollitt (who, as a true researcher, held onto data from early 1990 ‘in casethey were needed’). Thanks are also due to my wife, Marilena, withoutwhom this report could not have been produced in time.
Alan WillmottSeptember 2005
Thinking Skills and Admissions vi

Note on References in this Report
In preparing this report, a wide variety of documents has been drawn onincluding many old project documents, many of which are no longeravailable. The references in the text are provided as usual and each onefalls into one of four categories. The list of references in the Referencesindicates into which one of the following categories each reference falls.
Category AReference to an existing publication or document thatmay be obtained in the usual way (e.g. from libraries,bookshops, etc.).
Category BReference to a document held in electronic form, ineither Adobe pdf or MSWord format, which may bedownloaded from the Cambridge Assessment websiteunder the Research section listing publications,conference papers and other articles.http://www.cambridgeassessment.org.uk/research/confproceedingsetc/
Category CReference to a document held in electronic form, ineither Adobe pdf or MSWord format, and which may bedownloaded from the Cambridge Assessment websiteunder the Research section listing older (archive)documents of interest.http://www.cambridgeassessment.org.uk/research/historicaldocuments/
Category DReference to an old UCLES project document that is nolonger available.
Thinking Skills and Admissions vii

Thinking Skills and Admissions
1 Background
1.1 UCLES, Thinking Skills and MENO
The University of Cambridge Local Examinations Syndicate (UCLES) has beeninvolved with the development of assessments of ‘Thinking Skills’ since the late1980s. At that time, the numbers of people wishing to undertake Higher Educationwere growing rapidly and many of these people did not possess traditional entryqualifications. There was also a view that A-Levels were not necessarily the bestpredictors of success in Higher Education and UCLES established a research anddevelopment programme focussed on the provision of tests of academic aptitude.A detailed discussion of the work of UCLES in this period is given by Chapman(2005) and Fisher (2005) provides a discussion on how the concepts behind‘Thinking Skills’ have been developed since they were first introduced.
The initial interest centred on a project to develop a test to aid in the selection ofstudents wishing to study Law at University and although this work was not assuccessful as had been hoped, many useful lessons were learned (Rule, 1989).The emphasis on the development of a test to predict academic performance in asingle subject, Law, was recognised as being a very specific aim and, following theevaluation of this work, discussions were started to define what should beassessed, and why, so that questions and tests could be developed that would beapplicable to the prediction of success in subjects other than Law.
During this process, a number of trials were conducted using questions designed toassess a range of different skills and a more ambitious plan was then proposed witha view to designing an instrument that might be appropriate for use across a rangeof subjects. As an integral part of this activity, a review of past work wascommissioned that would provide a basis for discussion and a paper wascommissioned that would build on this review and offer suggestions for progress.The results of this work are reported in Fisher (1989, 1990a, 1990b) where aproposal is made for a general test of academic aptitude called The Higher StudiesTest.
After further work, a consultation paper was produced (UCLES, undated) containingproposals for building a test and providing details of possible question types thatmight be used. This was followed by a change of name for the proposed test to theAcademic Aptitude Profile (see Chapman, 2005) and documents were producedthat outlined the proposed scheme, its rationale, some sample questions and aguide to writing and editing questions (UCLES 1992a, 1992b, 1992c, 1992d,respectively).
It had become clear that the aim should not be to produce a psychometric aptitudetest but rather to identify and define those skills (Thinking Skills) that were crucial tosuccess in Higher Education. Consideration thus moved to a Higher EducationAptitude Test (Fisher, 1992) and the production of tests that would assess thenecessary skills directly. The Academic Aptitude Profile would be used forguidance where this was felt to be useful with students but the Higher EducationAptitude Test (HEAT) would be used as an aid to selection. In the end, these twoseparate ideas led to further discussions and came together as will be seen below.
Consultations between UCLES and a number of institutions of Higher Educationtook place and led to an agreement on the main focus of development. Workshould concentrate on the identification and definition of skills in two main areas:Critical Thinking and Mathematical Reasoning. Five-option multiple-choicequestions would be used and the language level would be that of broadsheetnewspapers.
From these initial decisions, questions were developed and trial tests created for
Thinking Skills and Admissions 1

pre-testing the new ideas. From the evaluation of the results of pre-testing andsubsequent refinement of questions, further pre-testing was conducted and thesubsequent results further evaluated.
In the period 1989 to 1995, therefore, UCLES developed a range of assessments inthe general area of Thinking Skills. New types of questions were commissionedand a Thinking Skills Service under the title of MENO came into being in the period1993-1995 (Meno was a pupil of Socrates; see Plato’s Meno dialogue). There aremany publications that explain the nature of this service (see UCLES 1993a, 1993b,1993c, 1993d), which made available a set of measures that together created acomposite assessment of Thinking Skills and provided schools and universities witha means of assessing the capability of their students. Six assessments wereavailable, assessing the kinds of skills necessary for understanding everydayarguments and logical reasoning in a variety of situations of the kind students wouldmeet in the course of Higher Education.
Substantial work was also done to address the ‘fairness’ of the new questions toensure that particular groups (defined by gender, race, ethnic origin, age and socialclass) would not be disadvantaged by the nature and administration of theassessment.
The rationale behind MENO suggested quite clearly that:
“Three things are suggested by this discussion.
1. skills may be developed generally as well as in subject-specificcontexts. There is no need to feel uncomfortable about this.Scientists, for example, are often highly proficient problem solvers intheir own fields; but they are also able to solve problems in theireveryday lives, or become business people and solve the problemsinvolved in running a business.
2. for younger people, thinking skills are likely to be developed in thecontext of formal disciplines, but more mature people are more likelyto demonstrate their thinking abilities in the context of everydayexperience.
3. in considering the intellectual capacities of people, both skills andcontent are relevant. In many cases, it may be worth while payingmore attention to skills than has happened in the past.”
(UCLES, 1993d)
In practice, the MENO Service was not taken up widely and only two of the six skillassessments were used to any extent. The discussion in Section 2.1 looks at thismatter and presents some research evidence that relates to the nature of the six-skill model. It was not long therefore before the MENO Service came to an endalthough the two more popular assessments were continued by UCLES. An awardentitled the Cambridge Thinking Skills Certificate (CTSC) was introduced in 1996that built on the two most popular MENO skills and this award continued until 2000.When the new Cambridge International Examinations (CIE) was formed in 1998,the CTSC was re-named the Cambridge Award in Thinking Skills (CATS) and thisran from 2000 until 2004 until it was adapted to form part of a new modular A-Levelin Thinking Skills.
1.2 A Growing Problem with Admissions
As with many universities, the proportion of students applying to the University ofCambridge who were achieving Grade A in all of their subjects had been increasing
Thinking Skills and Admissions 2

every year and by 2000 was very high indeed. In the years 1973 to 2003, forexample, the changes in the pattern of applicants and admissions to the Universityof Cambridge were as shown in Table 1.1.
Table 1.1: Applications and Admissions for the University of Cambridge in1973 and 2003
Applications AdmissionsYear 1973* 2003** 1973* 2003**Total 3422 11518 1786 3089Per cent AAA 26 68 41 91Per cent AAB 17 15 21 6Success Rate % 52 27
* Robinson (2002)** Cambridge Reporter (2004)
Thus, for admissions to the University of Cambridge, many features changedsubstantially over the 30 years from 1973 to 2003, although others did not. Inparticular:
• The number of applicants rose more than threefold (from 3422 to 11518).
• The proportion of applicants with three Grade As rose from 26 per cent to68 per cent.
• The proportion of applicants with two Grade As and one Grade B did notchange significantly (from 17 to 15 per cent respectively).
• The proportion of applicants admitted that held three Grade As rose from41 per cent to 91 per cent.
• The proportion of applicants admitted that held two Grade As and a GradeB fell from 21 per cent to 6 per cent.
• The success rate for applications made fell from 52 per cent to 27 per cent.
These figures show both the growth in numbers of applicants and also theincreasing need to differentiate between those who are achieving maximum gradesin the existing educational system (i.e. at A-Level).
1.3 A Trial
Within the University of Cambridge, the existence of the CTSC was known and itwas thought that the type of questions that were being used were such that theycould be used to provide useful additional information to those involved in theuniversity admissions process in Cambridge. As a result, a small-scale trial wasundertaken in one subject in 1999 (one College) and 2000 (two Colleges) using aCTSC question paper.
The trial concluded that “Thinking Skills Assessment is valuable”, that it was usefulto have assessments of “both numerical and verbal reasoning” but that there were“some problems with language and cultural assumptions”. In commenting on thetest used in the trial, it was considered that “the test shows promise” in that it was“consistent, independent of subject” and that while there was no specific preparationrequired to do well on the test, “any preparation is likely to be of general value”.
Finally it was made clear that a “large-scale validation study is needed” and that anattempt should be made to “track rejected students as well as those admitted”(Robinson, 2002).
Thinking Skills and Admissions 3

Before the results of the trial had been fully reported, discussions were held withUCLES and it was decided to build on the work to date by developing further testsfor trial to provide extra information to those administering the process ofadmissions. It was from these continuing developments that the TSA was born in2001.
The numbers of students taking TSA has grown steadily since 2001 when it wastaken by 289 applicants; in 2002, 472 were tested, in 2003 1551 and by 2004 thishad risen to 2147 applicants from the UK and overseas.
1.4 A Further Development
Around 1997/8 there were further developments within the University that wereleading to a trial of a different form of admissions test for students. In this case,there was a need to find ways of relieving the pressure on selection of applicantswishing to follow medical and veterinary courses. As some of those involved hadalso been involved in the work that led to MENO this new test which had three partsalso contained an assessment of Thinking Skills.
Details of this test and results from analysing data from the tests used are given inSection 7 of this report.
Thinking Skills and Admissions 4

2 The TSA Questions
2.1 The Six Skills of MENO
The six skills assessed by MENO were:
Critical Thinking Problem SolvingCommunication Numerical & Spatial OperationsUnderstanding ArgumentLiteracy
The questions were tried out extensively (see Massey, 1994a) and the resultsprovided much information on the nature of the six proposed scales. Analyses wereconducted using data from many sub-components of the scales and questionsassessing particular skills were looked at in some detail. The results showed thatthe analyses did not fully support the educational justification for the six skills asbeing independent components and so the six-skill educational model was beingchallenged from a measurement standpoint.
It was found that the component skills that were assessed by multiple-choicequestions ‘… achieve modestly respectable reliability estimates but those whichinclude examiner marking fail to do so’. Also, from work on the data set thatcontained the complete set of MENO components it was found that the data onlyreally supported the presence of two ‘… relatively discrete thinking skills …’. Thesewere tentatively entitled ‘numerical/spatial problem solving’ and ‘formal reasoning’(Massey, 1994a).
Not surprisingly, it was thus also considered that a profile report of scores, as hadbeen intended when MENO was conceived, would be difficult to support inmeasurement terms (Massey, 1994a). These results are relevant to the TSA andare discussed further in Section 6.5.
At the same time it became clear that although the six-component model for MENOwas generally accepted as being useful educationally, the problems that wereassociated with the administration and marking of six different assessments weresignificant. Users were tending to focus on the two skills of Critical Thinking andProblem Solving as being particularly useful in assessing the capabilities of theirstudents. Thus the practical realities of testing leading to the use of only two skillsand the analytical results indicating that the other four skills did not add significantlyto the information from the two central assessments sat comfortably together. Adiscussion of the definition and assessment of these two skills is given in Fisher(2005).
When the MENO Service came to an end, questions assessing both CriticalThinking and Problem Solving were used as the basis for a new UCLES award, theCambridge Thinking Skills Certificate, in 1996. The Cambridge Award in ThinkingSkills (CATS) introduced by Cambridge International Examinations in 2000 was alsobased on these two skills.
2.2 Other Developments
Since the late 1990s there has been a growing interest in introducing CriticalThinking to the curriculum in schools in the UK. As a result, and after trials with anumber of question types in 1999 and 2000, there is now an AS award in CriticalThinking (OCR, 2004) that has been available since 2000. An Advanced ExtensionAward (AEA) has also been available since 2003 (OCR, 2003) and an A-level,which builds on the modules from the AS award, will be available from 2006 (OCR,2004).
Cambridge International Examinations has had an AS award in Thinking Skills since1999 (CIE, 2004), and is now developing an A-level as well. As a result of this newdevelopment, which is built on a modular structure, the CATS award has now been
Thinking Skills and Admissions 5
discontinued.
There is, however, a major difference between these two (sets of) assessments.The OCR awards are for UK students and cover Critical Thinking only while thosefor CIE are for the international market and cover both Critical Thinking andProblem Solving, thus continuing the concept of the awards from the CTSC andCATS.
2.3 The TSA
When it was suggested that tests could be designed to yield results that might helpthe University admissions process, it was considered that a test of Critical Thinkingalone might prove to be too narrow a context for assessment. As a consequence,the TSA was based on both Critical Thinking (CT) and Problem Solving (PS)questions drawn from the development of the 1990s and the CTSC.
A TSA test consists of 50 questions to be answered in 90 minutes and this doesprovide an element of time pressure on candidates. Of the 50 questions, 25 areCritical Thinking questions and 25 are Problem Solving questions. Appendix A liststhe types of questions used in the TSA to assess each of the two skills and givesthe proportions of these questions in a complete test.
This report does not consider examples of question types or individual questionsand those interested in the nature of the skills assessed and the types of questionsthat have been devised to assess these skills are referred to the documentsmentioned in Section 1, to Fisher (2002) where example questions are given and tothe handbook for students taking the TSA (UCLES, 2004a). The handbookprovides examples of all question types currently used together with the correctanswers and explanations of why those answers are correct.
The first TSA tests were used in 2001 and similar tests have been continued eachyear since then. For 2001 and 2002 the tests were only available on paper but in2003 and 2004 the tests were also available online to be taken at a PC workstation.This use of technology allowed the results of those tested to be available toColleges very quickly.
A website is available that gives details of the TSA (http://tsa.ucles.org.uk) and fromwhich a copy of the handbook mentioned above can be downloaded. A short on-line test (of 10 questions) which provides feedback to the user can be taken at thiswebsite. In addition there is a full-length TSA test, of 50 questions, that can betaken on-line under ‘examination conditions’ – i.e. against the clock! This version ofthe test can also be downloaded and then printed for those who wish to take thetest in paper-and-pencil form.
The results of an investigation into the nature of the two skills assessed by CT andPS questions are given in Section 6 of this report. It will be noted that there areindications of some differences between the measurements provided by these twotypes of questions and the implications of these differences will be considered.
Thinking Skills and Admissions 6

3 Validity and Reliability
3.1 Some Properties of an Assessment
There are many criteria that can be used to judge the value of an assessment andthe initial considerations might simply be the type and format of the questions on thepaper. For example, will objective questions, such as multiple-choice or shortanswer questions, suffice for what is needed or should essay-type questions beused? What kinds of responses are being sought from the students? And for whatpurpose will these assessments be used?
Then there are practical matters such as the time available for administering thetest and a consideration of what time should be allowed for the test. Shouldstudents be made to work against the clock or should they have plenty of time toconsider their answers carefully? Here it will be important to be aware of the aimsof the assessment session and to understand how these will affect the assessmentproduced.
In addition to these mainly practical considerations, there are then more technical,but no less important, issues such as those of validity and reliability. It is notintended here to debate all of these issues in depth but simply to indicate theimportance of validity and reliability in particular. Many publications deal with thedefinition and measurement of these attributes and further information may befound, for example, in Anastasi (1968), Ebel (1972), Guilford (1973), Nuttall andWillmott (1972).
3.2 Validity
Validity, as might be expected, is about how valid an assessment tool is for aparticular purpose but even this simple statement opens many queries aboutunderstanding just what is being defined. A test of the recognition of road signs thathad been developed in the UK, for example, might be very appropriate for use in theUK, do the job well and so be regarded as a valid test. If the same test were to begiven to a group in another country, however, it might well be judged not to be soappropriate and, accordingly, much less valid. The validity of a test thus dependsboth on being clear about the ideas that lie behind its construction (i.e. what it isintended to measure) and also depends on who takes the test, for what purposeand in what context. A general definition of test validity is that a test needs to beable to measure what the test constructor set out to measure when applied to aparticular group of people in a particular context.
Here too interpretation comes into play. Is it always possible to be clear preciselywhat the test constructor (often a committee!) wished to measure? Is it also clearjust what the test does actually measure in practice when used with a particulargroup and context? These questions can rarely be answered with a definitiveresponse and so judgment generally comes into play to some degree whenconsidering validity.
There are many forms of validity but three in particular are of relevance here.Content Validity is a means of considering whether a test has met the aims of itscreators by measuring specific content. This form of validity is often used inconjunction with tests covering specific syllabus objectives (in a test of English, forexample, has grammar been assessed to the intended degree?). Then there is themore generic Face Validity which asks whether the test looks as though it shouldmeasure that which it is desired to measure – does the test look OK? These twomeasures of validity can be considered when tests are being developed and beforea test is actually used, thus focusing attention on the required outcomes.
Then there is Predictive Validity. This form of validity is used where the results oftesting are to be used to predict some specific subsequent outcome. For example,an assessment of bodily fitness may be undertaken for an individual and then aprediction made of the time that would be taken for that individual to run 1000 m.
Thinking Skills and Admissions 7

The supposition would be that the fitter the person (i.e. the higher the measure offitness), the faster that person would complete the 1000 m run. Here, a directmeasure of validity is obtained as the fitness assessment (however made) and thetime for the run would both be known as quantitative measures. In such cases,predictive validity is measured by the correlation achieved between the results ofthe (fitness) test used and the subsequent results (time for the run) that were to bepredicted; validity is assessed directly and is not a judgmental assessment.Judgment would, however, come into play when assessing whether the fitness testwas sufficiently accurate to predict the run time; and this judgment would depend onmany factors, not least whether the measure helped ‘at all’ in the prediction.
With predictive validity, as with correlations in general, the results (the value of thecorrelation achieved) can be affected by the distribution of the measures beingcorrelated. As one of the variables becomes more skewed, with very many morehigh scores than low scores on one variable, for example, so the value of thecorrelation derived from the data will become lower than the true value. This fact isvery relevant when looking at the prediction of academic success as the studentswhose results are being correlated are a highly selected group from the populationof all students. This matter will be raised again when looking at the predictiveresults of the TSA.
3.3 Reliability
Reliability is a feature of assessments that reflects the accuracy of the resultsobtained. Would a student be likely to get a similar result when sitting a similarexamination or test, for example, next time? This is a far from easy idea to pindown as people change over time, a ‘similar’ test is never the same as the originaland conditions change but it is necessary to have some idea about the accuracy ofan assessment.
The main difficulty in dealing with test reliability is finding a way to measure thisimportant characteristic. As with validity, there are a number of different types ofreliability, each having a different formulation to assess the concept that is beingmeasured.
In order to look at the reliability of the TSA, measures of internal consistencyreliability have been used. Here, the test performances of students are looked atacross the test as a whole in order to judge whether the responses form aconsistent pattern. Crudely, if a test is divided into two parts, to what extent docandidates get the same score on each part? By looking at all possible ‘split-half’correlations and averaging them an indication is obtained of how reproducible a setof test results is in practice.
3.4 Validity and Reliability
A final point must be made to underline the fact that validity and reliability arerelated, one to the other. If a test gives results that are reliable then it may, or maynot, be a valid test. If a test gives results that are not reliable then there is no waythe test can give valid results.
As an analogy, an archer may be considered who is shooting arrows at a target,perhaps as part of a competition. A valid shot in such a circumstance would be ‘anarrow in the bulls-eye’ of the target (assuming that this was the intention of thecompetition). A reliable performance would be ‘all arrows in the same place’. If thearcher is reliable and all arrows fall in the bulls-eye then the archer is giving a validperformance (each shot is valid). But if the archer is not reliable, and the shots areall over the place, then there is no way that this can be considered to be a validperformance. Yes, one shot might happen to go into the bull but the next couldmiss the target completely; not quite what was intended. Equally well, if the archerwere shooting reliably and all of the shots were falling in the same place, if thatplace happened to be the post holding up the target then there is also no doubt thatthe archer is not giving a valid performance (and no shots were valid).
Thinking Skills and Admissions 8

There is thus a clear interplay between reliability and validity. Without reliability atest cannot provide valid measures of performance; but even the most reliable testis not much use if it is not measuring what is required in the circumstances – i.e. it isnot a valid test. Of course, in practice no test can be perfectly reliable and so too notest can be perfectly valid. Further, the degree of reliability achieved will govern thedegree of validity that can be achieved.
So, if a test is ‘reasonably reliable’ then it may, or may not, be ‘reasonably valid’. Aswith the archer, even if the TSA is found to be as reliable as might be expected fromsuch a test, there will be no guarantee that the results will provide a good predictionof success at university.
As with many judgments, once the investigations are completed the task will be todecide if a test is reliable enough and valid enough for the purpose for which it isbeing used. This is never a clear cut or easy decision to make and in the end thismay simply come down to a decision on whether a test has been found to be useful.
Thinking Skills and Admissions 9

4 The Reliability of the TSA Tests
4.1 The Early Development of Thinking Skills
As has been mentioned earlier, the current work on Thinking Skills was based verymuch on previous work. Much of that work was not reported formally but somereports are available and these are referred to both here and in Section 6.
• An evaluation of Assessing Argument Questions (Thomson and Fisher, 1993)showed that out of 30 questions that were investigated, 20 ‘… performed well inthe sense that subjects needed to reason in the way intended in order to get theright answer’. In addition, information was gained about why the remaining 10questions were judged to be unsatisfactory (two had confusing wording, fivehad a misleading distractor and three were assessing comprehension notreasoning).
• A study of Formal Reasoning questions (Green, 1992) looked at 30 questionsand found that ‘Overall, most of the items functioned well’ and that the evidencepointed to the fact that ‘…students found the items novel’. Nevertheless, therewere lessons on item writing to be learned as ‘Thirteen items were judged to beinappropriate items, either because students had difficulty interpreting them orbecause they were too difficult’.
Both of these studies provided useful information on the structure of the individualquestions examined and on the development of the Thinking Skills scales generally.Being essentially small-scale, however, they did not attempt to estimate testreliability.
A much larger study involving several universities is reported by Massey (1994a).Here a substantial amount of data was collected, analysed and reported and themain findings in terms of reliability estimates are reported in Section 6. Most of theresults do, however, agree with the later results reported below.
Of much more immediate use are the data collected over the more recent past.
4.2 CTSC and CATS
In all cases where TSA tests have been used, full response data have beencollected from students. A record is thus available of responses to all questions inthe test, including whether a question has been answered or not. These data havebeen used to give scores for candidates for reporting purposes and analysed toallow an evaluation of tests and questions. Evidence is thus available on how thetests as a whole performed and on any questions that can be identified that appearto be too hard (or too easy) or are causing candidates to answer them in an unusualmanner.
During the development and operation of questions and tests of Thinking Skillswithin UCLES, there has been much pre-testing and subsequent item analysis.This process allows the necessary evaluation of tests and questions and also theestimation of the (internal consistency) measure of the reliability of the tests andpre-tests used.
Table 4.1 shows some of the item analysis data from the UCLES CTSC and thesubsequent CIE CATS awards. As the number of questions in a test is not alwaysthe same, further estimates of reliability have been provided (using the Spearman-Brown prophecy formula – see Ebel, 1972), that estimate the value of the reliabilitythat would be expected from a test with 50 questions.
Table 4.1: Reliability Estimates for CTSC and CATS Assessments – 1996-2003
Thinking Skills and Admissions 10

Year Award Numberof Tests
Number ofQuestions
Reliability Reliability(50 questions)
1996 CTSC 2 44 0.82 0.841998 CTSC 2 44 0.87 0.881999 CTSC 1 44 0.81 0.831999-Pre. CATS 3 50 0.83 0.832000 CATS 1 50 0.87 0.872000-Pre. CATS 3 50 0.75 0.752001 CATS 2 50 0.77 0.772002 CATS 2 50 0.80 0.802002-Pre. CATS 3 56 0.85 0.832003 CATS 2 50 0.80 0.80
It can be seen that with the data available the reliability estimates for the CTSCaward ranged from 0.83 to 0.88 with an average figure of about 0.85 for a singletest. With the move to the CATS award, three separate sets of pre-tests were held(see the ‘Pre.’ suffix in the Year column of the table) and these reliability estimatesranged from 0.75 to 0.83 with an average value of about 0.81 for a single pre-test.Finally, for the main CATS award, the reliability estimates range from 0.77 to 0.87with an average of about 0.80 for a single test.
These results indicate that the CTSC was a somewhat more reliable examinationthan the CATS award. This is not so surprising as the CTSC had been based onsubstantial development work and the question types used in the tests had beensubjected to considerable scrutiny during the development process. When theCATS award came into being, new questions were written and some were in adifferent format from those used in the CTSC. It is beyond the scope of thisdocument to go into the changes that took place but as can be seen, the pre-testingand then the main tests were not quite so reliable as the CTSC had been.
4.3 TSA Pre-tests
When the decision was taken to introduce a trial of the TSA, the original CTSCquestions were the only source of secure questions because those from the CIECATS award were made available to candidates after the examination and so theycould not be used again. These CTSC questions were thus used to provide thebasis for building the first TSA tests. In later years, new questions were written butall questions were subjected to pre-testing. Table 4.2 provides the details of thereliability estimates obtained.
Table 4.2: TSA Pre-test Reliability Estimates
Year andSession
Number ofpre-tests
Number ofQuestions
Reliability Reliability(50 questions)
2001/1 8 50 0.88 0.882003/1 8 30 0.69 0.782003/2 16 30 0.64 0.752004/1 6 30 0.62 0.732004/2 12 30 0.64 0.75
As may be seen from the above table, the pre-tests started off in 2001 as being veryreliable (0.88) but this value fell in subsequent pre-tests. This was in many waysunavoidable as in 2001 all good CTSC questions were used and the pre-test wasbasically a confirmation of what was known already. In later pre-testing the mix ofrevised questions to good old questions grew and finally a substantial number ofnew questions were pre-tested.
4.4 TSA Tests
Thinking Skills and Admissions 11

The TSA tests used during the admissions process were thus built from questionswith known characteristics and based very much on the CTSC. The reliabilityestimates of the tests used are given in Table 4.3 together with other test statistics.These statistics are based on raw test scores (the ‘number correct’ scores) ofcandidates although during admissions a scaled score was used in order to removeany differences in difficulty between tests, thus creating comparable scores.
Table 4.3: TSA Reliability Estimates
TSATest
No. ofQuest
s
No. ofCands.
MeanScore(%)
StandardDeviation
(%)
Reliability Reliability(50 questions)
A 50 153 62.9 15.4 0.84 0.84B 50 138 61.1 15.1 0.84 0.84
A-FE 50 58 58.9 16.6 0.86 0.86C 43 235 50.1 14.1 0.76 0.79D 46 243 50.4 16.0 0.83 0.84E 50 522 66.6 13.5 0.81 0.81F 50 583 71.6 14.4 0.85 0.85G 50 89 68.8 13.4 0.81 0.81H 50 86 59.1 12.8 0.80 0.80J 50 83 66.9 13.5 0.82 0.82
K-FE 50 160 63.6 13.0 0.79 0.79M 50 382 67.7 15.0 0.85 0.85N 50 229 68.0 13.6 0.82 0.82O 50 822 66.2 14.5 0.84 0.84P 50 529 64.9 15.4 0.84 0.84Q 50 185 64.2 15.8 0.86 0.86
Notes:
2001 Tests A and B
2002 Test A: this was administered in the Far East.Tests C and D; the tests actually administered had 50 questions eachbut were revised after the event to remove unsatisfactory questions.
2003 Tests E and F; these tests were administered using pencil and paper.Tests G, H and J; these tests were administered on-line.Test K; this test was administered in the Far East.
2004 Tests M, O and P; these tests were administered both on-line andusing pencil and paper.Tests N and Q; these tests were only administered on-line.
As can be seen, there are some differences between the tests in the way that theywere answered:
In 2001, the tests were very similar with mean scores in the low 60s and astandard deviation that indicates a very good spread of marks.
In 2002, the tests administered in the UK were much harder and candidateswere scoring only just over 50, some 10 points lower than the previous year.The spread of marks was not the same for each test either with that for TestD being somewhat greater that that for Test C.
In 2003, however, the mean scores were again generally around the upper60s and the standard deviations a little smaller than in 2001 indicating asomewhat narrower spread of marks. However, given that the tests were ofapproximately equal difficulty, it would appear that a particularly less ablegroup of students took Test H.
Thinking Skills and Admissions 12

In 2004, the mean scores are all around the mid 60s with a somewhat widerspread of marks than in 2003.
The reliability estimates of the TSA tests in 2001 and 2002 are around 0.84 withthose for tests used in 2003 being somewhat less at around 0.80. As has beennoted, this was probably due to the introduction of new questions into the later tests.As the work has progressed, questions have been developed further and thereliability figures have now risen somewhat for 2004 to about 0.84.
4.5 Other Uses of TSA
In addition to the main testing sessions, TSA tests were also used in differentsituations and an analysis of these data is shown in Table 4.4.
Table 4.4: Reliability Estimates for Other Uses of TSA Tests
TSATest
No. ofQuests
No. ofCands.
MeanScore(%)
StandardDeviation
(%)
Reliability Reliability(50 questions)
A1 40 365 48.9 14.8 0.77 0.81B1 41 28 54.7 12.1 0.67 0.71L 50 33 76.6 9.2 0.65 0.65
Notes:
2003 Test A1; a reduced version of Test A was used in an investigativeproject with new undergraduates in the UK.Test B1; a reduced version of Test B was used in China.
2004 Test L; a ‘research test’ was used with an undergraduate sample inCambridge.
As can be seen, the use of Test A/A1 with different groups of candidates gavesome differences in mean score but with similar reliability estimates. The use ofTest B/B1 in China was not particularly satisfactory but the number of candidates onwhich the analysis is based is very small. The use of Test L, however, indicated avery strong group of candidates and the smaller standard deviation indicates thatthe scores were bunched up towards the top of the distribution. In such a situation,it is perhaps not surprising that the reliability estimate is somewhat lower thanexpected.
4.6 The Reliability of TSA
It has been noted that the internal consistency reliability estimates for the TSA areof the order of 0.80 and that the initial and later tests were a little more reliable thanthis (about 0.84). The current test reliabilities probably reflect the benefits of recentdevelopment work and this will be of benefit to all concerned as results obtained willbe more able to correlate with subsequent university achievement.
The TSA is thus a reasonably reliable assessment, a condition that must be met if itis to be used as a predictor of University achievement.
Thinking Skills and Admissions 13

5 Issues of Validity
5.1 Some Early Findings
The early studies of the MENO tests were concerned mainly with the behaviour ofthe results of assessment between parts of the tests used and with the relationshipof the assessments with academic results. References to the internal analyses aremade in Section 6 but a comment on the tests shows their standing in relation toother measures.
Some of the MENO components were used in Singapore in 1996 and testmeasures were then available alongside the usual academic measures ofperformance. It was found that while correlations with individual academicmeasures were not large, those with UCAS points were ‘… on the high side of thosenormally observed for correlations between aptitude and achievement measures.’(Massey, 1997).
5.2 The Use of TSA
The TSA has been introduced to the University admissions process on a trial basisas a possible aid to selection. There is no suggestion that such a test should everreplace the existing information used during admissions (e.g. A-level grades/marks,interview results, school reports, etc.) and the emphasis behind the work is verymuch on providing supplementary predictive information. The likely value of theTSA tests has been based on a substantial background of work in the area oftesting skills deemed to be useful for Higher Education but there is, as yet, littleinformation available on the degree to which the TSA is able to predict success atuniversity.
This success is generally agreed to be performance in first-year universityexamination results: to attempt to predict final degree performance after three yearswhere students change considerably in their approach to many aspects of their lifewould be a hard task indeed.
5.3 TSA Scores as Predictors of Achievement
So far, there have been few possibilities for collecting data on the predictive powersof the TSA. The students involved in the first administration of the TSA tests inDecember 2001 who were selected for University entry came up the followingautumn (2002) and achieved their first-year results in the summer of 2003. As onlysome 289 students were tested, the selection ratio being what it is means that only48 of those were made offers, arrived in Cambridge and had results at the end ofthe first year.
For the second cohort of students, from the December 2002 testing, 472 studentswere tested, and results were available for 91 candidates in their first year. So thesample of candidates for whom first-year results were available in the summer of2004 was about double that from the 2001 sample.
Of some 1551 students who were tested in December 2003, 465 were madeconditional offers and a further 25 were made unconditional offers. Those studentswho took up their places are only now in their first year at University and so resultson their (first year) University performance will not be available until the summer of2005.
Accordingly, apart from the data from the initial trial described in Section 1.3, thereare only the two sets of data mentioned above that are available for analysis.
Table 5.1 provides the correlations between the TSA scores and the first-yearperformance in the three cases where data exist and are taken from Robinson(2002) and Forster (2004).
Thinking Skills and Admissions 14

Table 5.1: Correlations of TSA Scores with First Year Results – 2001-3 and2002-4
Student Cohort Number of Students Correlation with First Year ResultsInitial Trial 35 0.302001/2003 48 0.302002/2004 91 0.27
None of these correlations is particularly high but neither can they be ignored. Inthe context of studies in America, the US Department of Labor (1999) rates such acorrelation as ‘likely to be useful’
The sample numbers on which these results are based are very small and thecorrelations of TSA scores with University examination performance are weak butthere is some indication that those for A-level scores and Interview Scores are evenweaker (Robinson, 2002). The problem is that A-Level scores do not discriminatebetween a field of candidates all of whom have three A grades and the absolutevalues of Interview Scores may differ between interviewers even when they producethe same order of ranking. In this case at least, the TSA is providing a greaterdegree of prediction than are the other measures currently in use.
Unfortunately additional data, such as A-Level grades and Interview Scores, are notcurrently available in the case of the TSA candidate cohorts in 2001/2003 and2002/2004. It is clearly important that such data are collected in future exercise inorder to evaluate fully the relative benefits of the TSA and existing measures.
The validity of the TSA can be looked at from two standpoints. From the first, thetest is well-founded, being based on a long development to assess the skills thatare seen to be important in Higher Education (see Fisher, 2005). Here the contextin which it is used is very competitive as applicants are selected directly for a three-year degree programme. In this sense the TSA is a little different from theScholastic Aptitude Test (SAT) used in the US which is not aimed at assessingThinking Skills. The SAT is used with applicants having a much wider range ofability and selection consists of being admitted to the first year of a four-year degreeprogramme, with further selection being made at the end of the first year for asubsequent three years of a degree course.
There are many reasons why an assessment of Thinking Skills such as the TSA ismore appropriate for use in the UK than a test such as the SAT and Fisher (2005)discusses the origins of both assessments, linking the development of the SAT tothe needs of the US ‘… after the second World War, when admissions to HigherEducation were greatly expanded’. He then compares the educational systems ofthe US and the UK and argues that to use a test such as the SAT in the UK toprovide supplementary information for admissions would be ‘a mistake’ andprovides a number of reasons why this would be the case.
From the second standpoint, the TSA is seen to offer something by way ofpredicting success. Correlations such as those above will never be high because ofboth the nature of what is being assessed and also the quite restricted range ofability of students involved; in the context of a highly selected group of students,however, the results are promising. In comparisons with studies in the US, forexample, the correlations may not look good but when the range of ability ofstudents is considered they appear in a much better light.
A discussion on the future investigation of validity is given in Section 8 but there arefurther results to help in the understanding of how Thinking Skills scores relate toUniversity achievement.
5.4 Prediction by TSA Score Sub-scale
The TSA is made up from an equal mix of Critical Thinking (CT) and ProblemSolving (PS) questions and, for the purposes of the analyses so far, the test resultshave been considered as a single score. If the scores are broken down, however,
Thinking Skills and Admissions 15

so that each student has a CT score and a PS score, each of these can be used asa means of predicting University performance. Table 5.2 shows the predictivepower of the CT scores and the PS scores separately for the 2002-4 samples.
Table 5.2: Correlations of CT and PS Scores with First Year Results – 2002-4
Student Cohort Score Used Number ofStudents
Correlation with First YearResults
2002/2004 CT 91 0.132002/2004 PS 91 0.272002/2004 CT+PS 91 0.27
These results immediately suggest that whatever the value of the TSA as aninstrument in selection, there may be a difference between the value of the CT andPS scores when it come to prediction of University achievement. Indeed, it mightbe tempting to say that the CT scores are adding little or nothing to the predictiveability of the PS questions.
At this point two observations may be made. First, this is a result from a single yearonly and one that needs to be compared with analyses of data from other cohorts.The second is that many of the students in the 2002-4 cohort were applying to readComputer Science, Economics, Natural Science or Physical Science; as such itmay not be surprising that a measure of PS, based largely on numerical problems,provides a better predictor than a measure based more on logical thinking withwords.
However, another user of a TSA test, outside Cambridge, also reported that the CTsub-scores did not aid in the prediction of the first-year results as did the PS sub-scores (see Section 5.6). There is thus evidence to suggest that it would besensible to look at the sub-scales of the TSA separately and to investigate the wayin which they both operate. The start of such an investigation is reported in Section6.
5.5 The use of TSA in the Admissions Process
In 2003, following the administration of the TSA tests, a questionnaire wasdistributed to those involved in using the TSA during the Admissions process. Theaim was to investigate the ease of use of the administration system generally.Included in the questionnaire were two questions that sought information of theperceived use of the tests. Out of 16 respondents, 15 indicated that the TSA was‘useful in the admissions process’ and 13 indicated that they would ‘favour trials inmore subjects’. It thus seems that the TSA has received at least a basicacceptance with users.
At the same time, it is possible to follow through the test takers and to consider theirresults by the offers made. Table 5.3 is taken from Forster (2004) who provides agreat deal of detail on the scores of various groups of candidates on the test. Thetable looks at scores on the two parts of the test as well as on the whole by theapplication decision made in December 2003.
Table 5.3: TSA Score by Application Decision – 2003 Cohort
SelectionDecision
No. Critical Thinking Problem Solving OverallMean SD Mean SD Mean SD
Conditional 465 64.24 9.80 67.54 10.73 65.19 8.04Unconditional 25 63.50 11.42 65.80 9.75 64.09 7.91Reject 1038 56.97 9.09 60.57 9.14 58.54 7.39N/A 23 49.03 9.22 59.42 12.18 53.54 7.98Total 1551 59.14 10.00 62.73 10.21 60.55 8.24
Thinking Skills and Admissions 16

It should be noted that admission result data were not available for 23 applicants.Also, the Unconditional offer group contained only 25 applicants and this must beborne in mind when considering means for this group of candidates.
On the test as a whole as well as on the sub-scales, the group with the highestmeans was the Conditional offer group, followed by the Unconditional offer groupand then the Rejected group. Also, as might be expected, the mean scores of thetwo groups of candidates to whom offers were made were quite close whencompared with the mean score for the group to whom no offer was made. Thegroup for which no decision was available were also consistently the lowest scorersbut little can be made of that fact.
Thus, although the TSA was not being actively used in selection, the scores bycandidates consistently reflected the admissions decisions made. Clearly this resultcannot be taken as evidence of the test being a useful predictor of Universityachievement as there will be at least some element of ‘self-fulfilment’ in theseresults. Nevertheless, for a test that is being used as a trial alongside the usualselection methods, the results are encouraging.
In the light of the lack of predictive ability of the CT sub-scores in 2002-4 whencompared with that of the PS sub-scores, it is perhaps surprising to see that thedifferentiation in marks between the Conditional offer and Reject groups ofapplicants using the CT scores (7.27) was somewhat greater than that using the PSscores (6.97). It will remain to be seen whether the relative predictions found in the2002-4 cohort are also found in the 2003-5 cohort to which the above data relate.
A similar analysis was carried out for a specific subject (Subject B), applicants.Although these data are a sub-set of the main 2003 data reported above, Table 5.4shows how the mean scores of applicants related to the selection decisions made(UCLES, 2004b). Here, a Pool candidate is one who is does not achieve his or herfirst choice of College but is not rejected outright.
Table 5.4: TSA Score by Application Decision: Subject B Applicants – 2003Cohort
SelectionDecision
N Critical Thinking Problem Solving OverallMean SD Mean SD Mean SD
Offer 69 62.71 9.95 68.06 11.21 64.78 8.92Pool 87 58.37 11.12 64.39 11.70 60.92 9.43Reject 115 55.05 6.59 58.66 8.78 56.66 6.29
It can be seen that in the case of Subject B applicants the TSA scores and sub-scores again relate well to the selection decisions made. In the case of the Poolcandidates, and especially with the CT sub-scores, there is a wider spread ofscores than with either of the other two groups of applicants. This spread may wellreflect the fact that some Pool candidates may not fit the profile for the particularCollege to which they applied but may nevertheless be good applicants while othersfall short generally. As Subject B is a ‘Scientific’ subject, it is also hardly surprisingto note that for these applicants the TSA PS sub-scores are substantially higherthan the CT sub-scores and that, relative to all applicants (see table 5.3), the PSscores are higher and the CT scores are lower for candidates receiving an offer.
Again, this information is not evidence that the TSA is working as a predictor ofUniversity achievement although it is an indication that this may be the case.
As part of the work on the 2003 data, Forster (2004) reports the correlationsbetween the CT and PS sub-scores and the total score with the ‘Outcome Decision’.These results are given in Table 5.5.
Table 5.5: Correlations between TSA Sub-scores and Application OutcomeProblem Solving Total Outcome
Thinking Skills and Admissions 17

Critical Thinking 0.50 0.86 0.34Problem Solving 0.86 0.32Total 0.38
The inter-correlation between the two sub-scales will be picked up in Section 6.4 butthe information of interest here is the difference in the correlations between the sub-scale results and the selection outcome. It can be seen that the CT sub-scorescorrelate at least as well with the outcome than do the PS sub-scores. This iscontrary to the findings above using first-year results and underlines again the needfor careful investigation when the data for the next cohort become available.
5.6 Some Comments from Users
Also of some relevance to the validity of using TSA are comments from users.Although these do not in themselves constitute evidence of predictive validity, if theusers find the results useful then this is a helpful commentary on the tests used.Some general comments on TSA results being ‘useful in Admissions’ have alreadybeen mentioned but the following is a comment made by one user in the University.
My general view is that the TSA is our best indicator of Tripos performance. Itdoes not correlate particularly well with other indicators such as exam resultsand interview scores, but that just suggests that they are inaccurate. However,I would be nervous about using the TSA for pre-filtering of candidates. Thatwould undoubtedly give rise to some injustice. It should be used as just one ofseveral measures.
Another user of TSA, from outside the University, made the following points by wayof a summary.
The overall predictive validity of the measure, whilst not high, is within theexpected range and an appropriate range of scores was obtained in theundergraduate sample. Thus, if the subgroup differences could be addressedthe test could be useful in handling competition for places amongst high abilityapplicants.
This work confirmed that many teachers and academic staff are interested inthe concept of critical thinking and feel instinctively that it may well be relevantto their programmes. However, they seemed largely inexperienced in the useof the concept and were not aware of how they could get further information(e.g. website). Similarly, tutors and teachers seemed not to perceive manydifferences between tests. For us as admissions staff, before using a measurefor live admissions we would certainly need to raise awareness of whatdifferent tests measure so that tutors could make an informed decision aboutwhat constructs best related to their programme aims and curricula.
The matter of bias in the TSA results is of some concern and an investigation of thedata collected in Cambridge is reported in Section 5.7.
5.7 Bias in TSA Questions
One of the most problematic issues in testing is the writing of test questions that areunbiased. A biased question here is a question that may be answered correctly, orincorrectly, in a systematic manner by candidates with an identifiable characteristicthat does not happen with all candidates. The categories that can be checked forbias are many but the most usual are gender and ethnic origin.
In the early work on Thinking Skills, Massey (1994b) reports analyses of a ProblemSolving test which suggest that ‘… MENO is unbiased with respect to first language,ethnic origins and age …’ but also that ‘… the sexes do appear to have performeddifferentially on MENO PS …’.
In the case of the TSA, an initial study of bias has reported that:
Thinking Skills and Admissions 18

From all that has been found, however, it is clear that for the variablesinvestigated there is no substantial and consistent bias in the case of most ofthe TSA questions used. In particular, apart from one question, no evidence ofany difference between a paper-and-pencil administration and an on-linedelivery has been found. (Willmott, 2004).
Despite the fact that there was little evidence of bias found in the TSA questions,this is an area where more work needs to be done. In particular, the analysesconducted only relate to a single session of TSA and need to be repeated as moretest data accumulates. It is also necessary to be clear on matters of question andtest bias, as opposed to differential performance, as they are not the same.
The variables included in the TSA bias analyses against which questions werechecked were:
Method of Delivery On-line and Paper-and-PencilGender Male and FemaleSubject Chosen Subject of ApplicationLocation Home and OverseasSchool Type Main UK School TypesDecision Offer and Reject
One important variable that was not available for study was Ethnic Origin and this isan omission that needs to be rectified as soon as possible. Part of the difficultyhere is simply the problem of collecting the data and the operation of the DataProtection Act. A further and very important part of this difficulty stems from theconsiderations from both UCAS and the Universities concerning the extent to whichethnic origin information should be revealed to admissions selectors. While no-onewishes to influence admissions unfairly, without collecting data on ethnicity toensure fair assessments it will not be easy to check for any ethnic bias in questions.
Also, work could usefully be carried out on a wider range of candidates in order tohave sufficient data to look properly at question bias. The report mentioned alsosuggests other ways in which question bias could be investigated.
Nevertheless, it is encouraging to note that in these early analyses little evidence ofquestion bias has been found.
Thinking Skills and Admissions 19
6 Critical Thinking and Problem Solving: One Skill or Two?
6.1 The Two Sub-scales
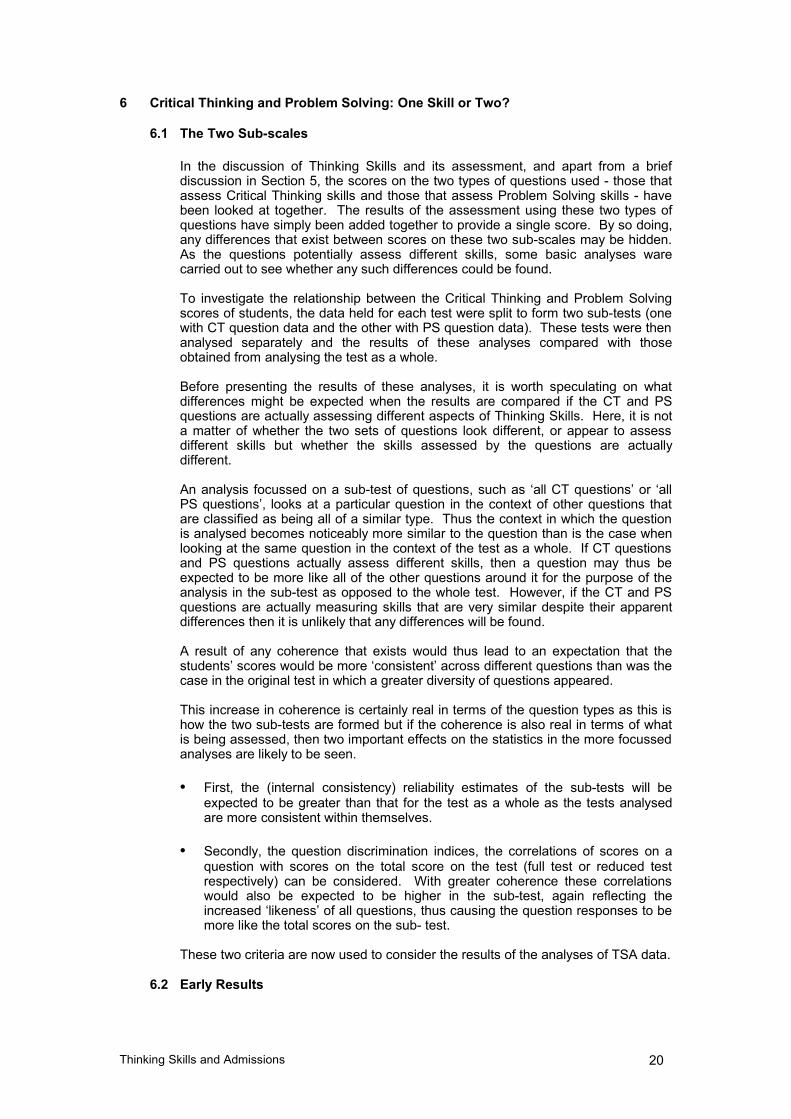
In the discussion of Thinking Skills and its assessment, and apart from a briefdiscussion in Section 5, the scores on the two types of questions used - those thatassess Critical Thinking skills and those that assess Problem Solving skills - havebeen looked at together. The results of the assessment using these two types ofquestions have simply been added together to provide a single score. By so doing,any differences that exist between scores on these two sub-scales may be hidden.As the questions potentially assess different skills, some basic analyses warecarried out to see whether any such differences could be found.
To investigate the relationship between the Critical Thinking and Problem Solvingscores of students, the data held for each test were split to form two sub-tests (onewith CT question data and the other with PS question data). These tests were thenanalysed separately and the results of these analyses compared with thoseobtained from analysing the test as a whole.
Before presenting the results of these analyses, it is worth speculating on whatdifferences might be expected when the results are compared if the CT and PSquestions are actually assessing different aspects of Thinking Skills. Here, it is nota matter of whether the two sets of questions look different, or appear to assessdifferent skills but whether the skills assessed by the questions are actuallydifferent.
An analysis focussed on a sub-test of questions, such as ‘all CT questions’ or ‘allPS questions’, looks at a particular question in the context of other questions thatare classified as being all of a similar type. Thus the context in which the questionis analysed becomes noticeably more similar to the question than is the case whenlooking at the same question in the context of the test as a whole. If CT questionsand PS questions actually assess different skills, then a question may thus beexpected to be more like all of the other questions around it for the purpose of theanalysis in the sub-test as opposed to the whole test. However, if the CT and PSquestions are actually measuring skills that are very similar despite their apparentdifferences then it is unlikely that any differences will be found.
A result of any coherence that exists would thus lead to an expectation that thestudents’ scores would be more ‘consistent’ across different questions than was thecase in the original test in which a greater diversity of questions appeared.
This increase in coherence is certainly real in terms of the question types as this ishow the two sub-tests are formed but if the coherence is also real in terms of whatis being assessed, then two important effects on the statistics in the more focussedanalyses are likely to be seen.
• First, the (internal consistency) reliability estimates of the sub-tests will beexpected to be greater than that for the test as a whole as the tests analysedare more consistent within themselves.
• Secondly, the question discrimination indices, the correlations of scores on aquestion with scores on the total score on the test (full test or reduced testrespectively) can be considered. With greater coherence these correlationswould also be expected to be higher in the sub-test, again reflecting theincreased ‘likeness’ of all questions, thus causing the question responses to bemore like the total scores on the sub- test.
These two criteria are now used to consider the results of the analyses of TSA data.
6.2 Early Results
Thinking Skills and Admissions 20

In an extensive study covering a number of Universities, Massey (1994a) foundreliability estimates for CT and PS tests individually and further information isavailable from the use of MENO in Belgium in 1995 (Nonneman et. al, 1995).These results are summarised in Table 6.1.
Table 6.1: Estimated Reliability of TSA Sub-scores – Early Results
Sample Section Number ofQuestions
Reliability Reliability(50 questions)
Univ. 1 CT 31 0.70 0.79Univ. 1 PS 42 0.83 0.85Univ. 2 PS 42 0.83 0.85Univ. 3 PS 42 0.83 0.85Univ. 4 PS 42 0.87 0.89Univ. 5 CT 54 0.86 0.85Univ. 5 PS 42 0.82 0.84
From the above results it can be seen that the reliability estimates for the CT sub-scores are 0.79 to 0.85 for a 50-question test. By way of comparison, the reliabilityestimates for the PS sub-scores are more consistent (at about 0.84/0.85) but withone higher value (0.89). These values are only very marginally higher than thosefound for the full TSA tests.
6.3 Results for TSA Analyses
The results of the sub-scale analyses of TSA data are shown in Table 6.2. In thetable, each of the three columns for Critical Thinking and Problem Solving gives thenumber of questions in the respective sub-test, the average change of the values ofthe discrimination indices across the questions in the test and the estimatedreliability for the sub-scale.
When a discrimination index is calculated for a question, the usual statistic used isthe correlation between the responses on the question (one or zero in the case ofmultiple-choice questions marked as either correct or incorrect) and the total scoreson the test as a whole. To the extent that the scores on the test as a whole includethe score on the question, this correlation is biased as the question score cannothelp but affect the total score, albeit to a ‘small degree’.
In order to be sure that in the investigation of the two sub-scales any effects due tothis bias are not causing unwarranted interpretations, for the purposes of the tablebelow unbiased correlations have been used. These correlations have beencalculated between the scores on a question and the scores on the total test scorewithout the question included. The resulting correlations will thus be unbiased andrepresent the best estimates of the degree to which the question scores and thetotal test performances are related.
Any differences in question discrimination found between a whole test or a sub-testwill now be more likely to reflect any real differences between what is beingassessed by the respective tests.
The differences in change in question discrimination are shown in favour of the sub-scale. For the reliability estimates, however, as each sub-test is shorter than theoriginal (about half the length in general), the estimated value of the reliabilityestimate has been based on what would be expected if the test consisted of 50questions, thus allowing sensible comparisons to be made.
Table 6.2: Summary of Sub-Scale Analyses for TSA tests
Thinking Skills and Admissions 21

Test/Year
Critical Thinking Problem Solving Whole TestNo.Qu.
Disc. Rel.50
No.Qu.
Disc. Rel.50
No.Qu.
Rel.50
No. ofCands.
A/2001 25 0.02 0.88 25 0.02 0.87 50 0.84 153B/2001 25 0.02 0.89 25 0.01 0.83 50 0.84 138
A-FE/2002 25 0.03 0.91 25 0.04 0.88 50 0.86 58C/2002 20 0.00 0.77 23 0.01 0.85 43 0.79 235D/2002 23 -0.01 0.85 23 -0.01 0.85 46 0.84 243E/2003 25 0.00 0.82 25 0.00 0.84 50 0.81 522F/2003 25 0.00 0.86 25 0.01 0.88 50 0.85 583G/2003 25 0.00 0.81 25 0.00 0.85 50 0.81 89H/2003 25 0.00 0.82 25 0.00 0.80 50 0.80 86J/2003 25 0.02 0.88 25 0.00 0.80 50 0.82 83
K-FE/2003 15 0.02 0.84 35 0.00 0.80 50 0.79 160M/2004 25 0.00 0.88 25 0.00 0.86 50 0.85 382N/2004 25 0.01 0.86 25 0.01 0.82 50 0.82 229O/2004 25 0.01 0.86 25 0.00 0.86 50 0.84 822P/2004 25 0.01 0.85 25 0.01 0.88 50 0.85 529Q/2004 25 0.00 0.86 25 0.01 0.89 50 0.86 185
In general, when the two sub-scales are considered, they do tend to be somewhatmore consistent than the whole test (i.e. the reliability is greater). There are a fewcases where the reliability of a sub-scale is less than that of the whole test (PS inTest B, CT in Test C and PS in Test J) but these are not typical. The increases inreliability estimates are small (about 0.02 for both CT and PS questions) and do notlead to any significant conclusions.
It can also be seen that the differences in question discrimination are very smallindeed. These results do not suggest that the CT and PS questions are in any wayassessing skills that are substantially different.
It has to be said, however, that these analyses are not the most sensitive with whichto explore the dimensionality of test data. The use of techniques such as FactorAnalysis are much better placed to investigate the nature of what is being assessedby the two sets of questions.
Nevertheless, from these results, although the sub-scale reliabilities are marginallygreater than those for the whole tests, there are no real indications that the CT andPS questions are assessing skills that are substantially different.
6.4 Sub-scale Inter-Correlations
The nature of the sub-scales can be investigated further by looking at thecorrelations between the various sub-test scores. Table 6.3 gives details of thecorrelations between the CT scores, the PS scores and the total scores forcandidates by test.
Table 6.3: Correlations between the Sub-Scales of TSA Tests
Test/Year
CorrelationCT v Total PS v Total CT v PS
Rel. 50 – Test
A/2001 0.86 0.85 0.46 0.84B/2001 0.89 0.83 0.50 0.84
Thinking Skills and Admissions 22
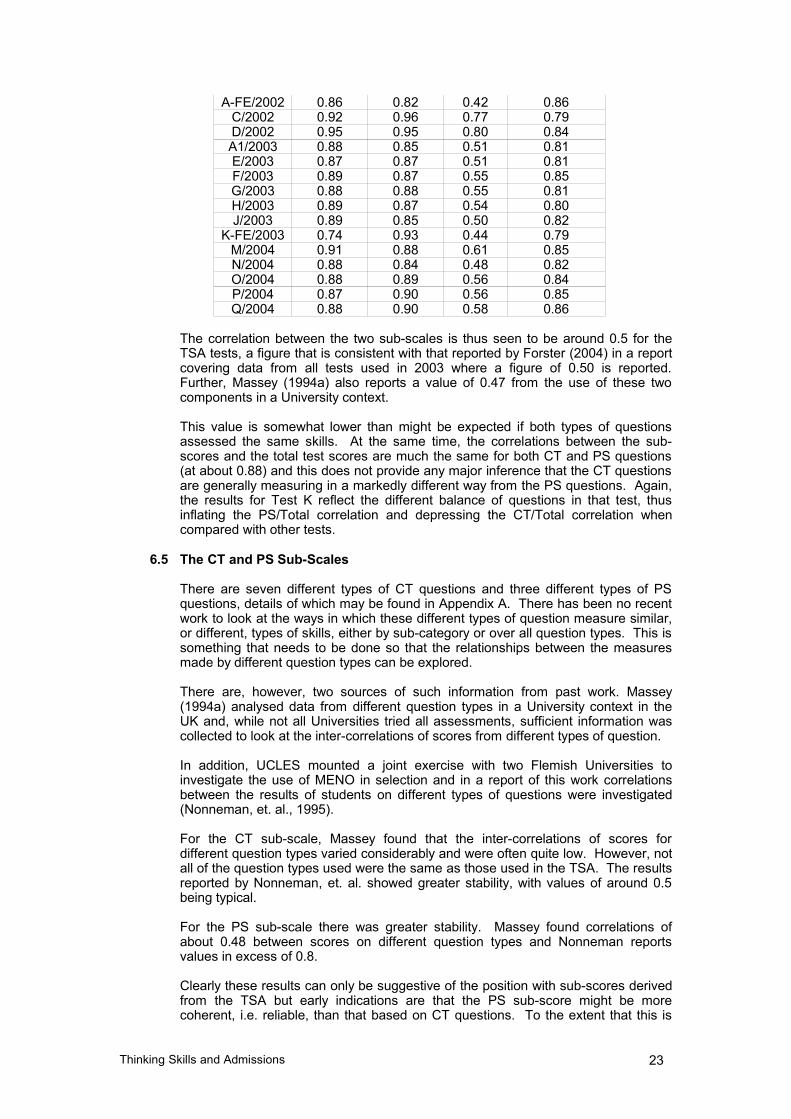
A-FE/2002 0.86 0.82 0.42 0.86C/2002 0.92 0.96 0.77 0.79D/2002 0.95 0.95 0.80 0.84A1/2003 0.88 0.85 0.51 0.81E/2003 0.87 0.87 0.51 0.81F/2003 0.89 0.87 0.55 0.85G/2003 0.88 0.88 0.55 0.81H/2003 0.89 0.87 0.54 0.80J/2003 0.89 0.85 0.50 0.82
K-FE/2003 0.74 0.93 0.44 0.79M/2004 0.91 0.88 0.61 0.85N/2004 0.88 0.84 0.48 0.82O/2004 0.88 0.89 0.56 0.84P/2004 0.87 0.90 0.56 0.85Q/2004 0.88 0.90 0.58 0.86
The correlation between the two sub-scales is thus seen to be around 0.5 for theTSA tests, a figure that is consistent with that reported by Forster (2004) in a reportcovering data from all tests used in 2003 where a figure of 0.50 is reported.Further, Massey (1994a) also reports a value of 0.47 from the use of these twocomponents in a University context.
This value is somewhat lower than might be expected if both types of questionsassessed the same skills. At the same time, the correlations between the sub-scores and the total test scores are much the same for both CT and PS questions(at about 0.88) and this does not provide any major inference that the CT questionsare generally measuring in a markedly different way from the PS questions. Again,the results for Test K reflect the different balance of questions in that test, thusinflating the PS/Total correlation and depressing the CT/Total correlation whencompared with other tests.
6.5 The CT and PS Sub-Scales
There are seven different types of CT questions and three different types of PSquestions, details of which may be found in Appendix A. There has been no recentwork to look at the ways in which these different types of question measure similar,or different, types of skills, either by sub-category or over all question types. This issomething that needs to be done so that the relationships between the measuresmade by different question types can be explored.
There are, however, two sources of such information from past work. Massey(1994a) analysed data from different question types in a University context in theUK and, while not all Universities tried all assessments, sufficient information wascollected to look at the inter-correlations of scores from different types of question.
In addition, UCLES mounted a joint exercise with two Flemish Universities toinvestigate the use of MENO in selection and in a report of this work correlationsbetween the results of students on different types of questions were investigated(Nonneman, et. al., 1995).
For the CT sub-scale, Massey found that the inter-correlations of scores fordifferent question types varied considerably and were often quite low. However, notall of the question types used were the same as those used in the TSA. The resultsreported by Nonneman, et. al. showed greater stability, with values of around 0.5being typical.
For the PS sub-scale there was greater stability. Massey found correlations ofabout 0.48 between scores on different question types and Nonneman reportsvalues in excess of 0.8.
Clearly these results can only be suggestive of the position with sub-scores derivedfrom the TSA but early indications are that the PS sub-score might be morecoherent, i.e. reliable, than that based on CT questions. To the extent that this is
Thinking Skills and Admissions 23

so, then this might enable the PS score to correlate more highly with subsequentachievement than the CT score. Finally, Massey (1994a) reports the results of conducting a factor analysis of thedata collected and although the number of students was not large (only just over100), there was a clear identification of two factors, the first of which contained theCT questions and the second the PS questions.
6.6 The Implications of the Findings
There is some evidence that the CT and PS questions are measuring skills that arenot completely the same. The questions generally appear to cohere better whenconsidered separately and the scores on the two sets of questions are onlymoderately correlated. That this is as intended – CT and PS questions were builtinto the TSA in order to assess different skills - is good but the extent to which thereare real differences is not clear without further analyses. In order to investigate thedimensionality of the data in a more formal manner further analyses (e.g. FactorAnalyses) need to be conducted.
In terms of making predictions of academic success at University, there is someevidence that scores from CT questions and PS questions might not be assessingThinking Skills in exactly the same way. Whether or not this is the case, a linearcombination of the sub-scores could be a better predictor of University achievementthan either separately or, indeed, than the simple total score.
Accordingly, an investigation into the use of a combination, linear of otherwise, asopposed to a simple addition, of the two sub-scores as a predictor of achievementwould be a useful step forward.
Thinking Skills and Admissions 24

7 The MVAT and the BMAT
7.1 The Need for an Aid to Admissions in Medical Courses
During the later stages of the work by UCLES on the development of theassessment of Thinking Skills (around 1997/98), interest was expressed by theUniversity of Cambridge in a test to aid in the selection of students for medical andveterinary courses. Here the number of applicants substantially exceeds thenumber of places available and an aid to selection could be helpful during theprocess of selection. It was thought that the work by UCLES in the area of ThinkingSkills and selection might be useful to consider and discussions were heldaccordingly.
As a result, a trial of a Medical and Veterinary Admissions Test (MVAT) wasadministered in 1999. This test consisted mainly of Problem Solving questions.Following an analysis of the data collected, the first full version of the MVAT wasthen administered in November 2000 as a possible aid in the selection of studentswho wished to enter University in October 2001.
The MVAT had three parts. Part 1 consisted of questions, multiple-choice or shortanswer in format, assessing Scientific Aptitude. These questions were essentiallyThinking Skills questions that had a generally scientific background (indeed, someCTSC questions that were in the early TSA tests were also used in the MVAT).Part 2 of the MVAT was also made up of multiple-choice and short answerquestions but these assessed Scientific Knowledge. Finally, Part 3 providedstudents with an opportunity to show their level of scientific understanding throughtackling one compulsory question and answering one further question selected fromfour presented featuring Chemistry, Physics, Biology and Mathematics. In this Part,credit was given for clarity of expression, the depth of understanding shown andevidence of a wide interest in the subject and students needed to write theirresponses to the questions in essay form. These responses were then marked bymembers of the University.
The MVAT was used again within Cambridge in 2001 and 2002 but in 2003 anumber of changes were made: the University of Oxford and University College,London also used the test and it was re-named the Biomedical Admissions Test(BMAT) to cover its somewhat wider use. The BMAT was used again in 2004 withthe added participation of the Royal Veterinary College and the University of BristolVeterinary School. Details of the BMAT, including Specimen Papers and MarkingSchemes, may be found at http://www.bmat.org.uk.
A detailed analysis of the operation of the MVAT and BMAT is given elsewhere (seeBramley, 2001; Massey, Shannon and Dexter, 2002; Shannon, Massey and Dexter,2003; Massey, 2004; Shannon, 2004a), so only those aspects of the testing relatingto the reliability and validity of the MVAT and BMAT will be mentioned here.
7.2 The Reliability of the MVAT and BMAT Assessments
7.2.1 MVAT and BMAT Part 1
Data are available for the MVAT/BMAT from the original 1999 trial throughto its use in 2004. The reliability estimates for Part 1 of these assessmentsare given in Table 7.1 below.
Table 7.1: Reliability Estimates for Part 1 of the MVAT/BMAT Tests –1999 - 2004
Thinking Skills and Admissions 25

Year Award Numberof
Questions
Reliability Reliability(50 questions)
1999 MVAT 25 0.72 0.842000 MVAT 20 0.69 0.852001 MVAT 19 0.66 0.842002 MVAT 17 0.67 0.862003 BMAT 40 0.73 0.772004 BMAT 35 0.73 0.79
It can be seen that the reliability estimates for the MVAT/BMAT ranged from0.77 to 0.86 with the later BMAT tests being somewhat less reliable thanthe previous MVAT tests. In each case the BMAT tests had a smallnumber of questions that, while satisfactory to the Question Writers andEditors, did not work very well in practice, thus lowering the reliabilityestimates.
7.2.2 MVAT and BMAT Part 2
The reliability estimates for Part 2 of the MVAT and BMAT assessments aregiven in Table 7.2 below.
Table 7.2: Reliability Estimates for Part 2 of the MVAT/BMAT Tests –1999 - 2004
Year Award Number ofQuestions
Reliability Reliability(50 questions)
1999 MVAT 44 0.75 0.772000 MVAT 30 0.83 0.892001 MVAT 30 0.79 0.862002 MVAT 25 0.79 0.882003 BMAT 30 0.72 0.812004 BMAT 27 0.66 0.78
It can be seen that the reliability estimates for Part 2 of the MVAT/BMAT,when estimated for a 50-question test, ranged from 0.77 to 0.89. The lowfigure for 1999 is likely to reflect the trial nature of the test and its questionsbut the values for 2000, 2001 and 2002 show tests giving results that arequite reliable. In 2003 and 2004, however, the values are somewhat lowerthan would be expected. Investigating the individual questions for 2004, forexample, it appears that there was one very poorly discriminating questionand three more that did not discriminate very well and these effects willhave depressed the overall estimate of (internal consistency) reliability.
7.2.3 MVAT and BMAT Part 3
As Part 3 of the MVAT/BMAT consists of open-ended essay questions thatare individually marked, no information is available here on the reliability ofthis part of the assessments.
7.3 MVAT and BMAT Scores as Predictors of Performance
As with the TSA, there have been few occasions to carry out a full evaluation of theMVAT/BMAT as predictors of performance.
An overview of the level of prediction is provided by Forster (2004) where thepredictive validity of the MVAT scores from 2000 to the 2002 Tripos results was0.30. This correlation is for all students and is for the Part 1 (Thinking Skills)section of the MVAT only. Massey (2004) provides more detail and this issummarised in Table 7.3 below.
Thinking Skills and Admissions 26
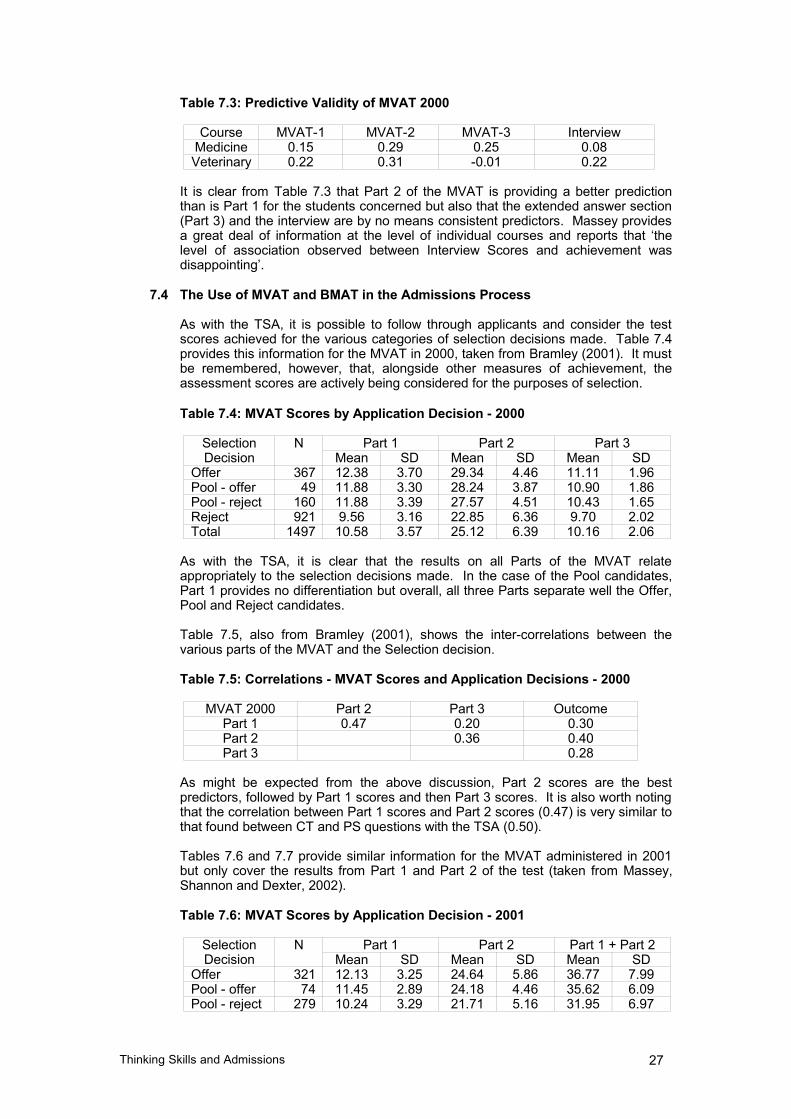
Table 7.3: Predictive Validity of MVAT 2000
Course MVAT-1 MVAT-2 MVAT-3 InterviewMedicine 0.15 0.29 0.25 0.08Veterinary 0.22 0.31 -0.01 0.22
It is clear from Table 7.3 that Part 2 of the MVAT is providing a better predictionthan is Part 1 for the students concerned but also that the extended answer section(Part 3) and the interview are by no means consistent predictors. Massey providesa great deal of information at the level of individual courses and reports that ‘thelevel of association observed between Interview Scores and achievement wasdisappointing’.
7.4 The Use of MVAT and BMAT in the Admissions Process
As with the TSA, it is possible to follow through applicants and consider the testscores achieved for the various categories of selection decisions made. Table 7.4provides this information for the MVAT in 2000, taken from Bramley (2001). It mustbe remembered, however, that, alongside other measures of achievement, theassessment scores are actively being considered for the purposes of selection.
Table 7.4: MVAT Scores by Application Decision - 2000
SelectionDecision
N Part 1 Part 2 Part 3Mean SD Mean SD Mean SD
Offer 367 12.38 3.70 29.34 4.46 11.11 1.96Pool - offer 49 11.88 3.30 28.24 3.87 10.90 1.86Pool - reject 160 11.88 3.39 27.57 4.51 10.43 1.65Reject 921 9.56 3.16 22.85 6.36 9.70 2.02Total 1497 10.58 3.57 25.12 6.39 10.16 2.06
As with the TSA, it is clear that the results on all Parts of the MVAT relateappropriately to the selection decisions made. In the case of the Pool candidates,Part 1 provides no differentiation but overall, all three Parts separate well the Offer,Pool and Reject candidates.
Table 7.5, also from Bramley (2001), shows the inter-correlations between thevarious parts of the MVAT and the Selection decision.
Table 7.5: Correlations - MVAT Scores and Application Decisions - 2000
MVAT 2000 Part 2 Part 3 OutcomePart 1 0.47 0.20 0.30Part 2 0.36 0.40Part 3 0.28
As might be expected from the above discussion, Part 2 scores are the bestpredictors, followed by Part 1 scores and then Part 3 scores. It is also worth notingthat the correlation between Part 1 scores and Part 2 scores (0.47) is very similar tothat found between CT and PS questions with the TSA (0.50).
Tables 7.6 and 7.7 provide similar information for the MVAT administered in 2001but only cover the results from Part 1 and Part 2 of the test (taken from Massey,Shannon and Dexter, 2002).
Table 7.6: MVAT Scores by Application Decision - 2001
SelectionDecision
N Part 1 Part 2 Part 1 + Part 2Mean SD Mean SD Mean SD
Offer 321 12.13 3.25 24.64 5.86 36.77 7.99Pool - offer 74 11.45 2.89 24.18 4.46 35.62 6.09Pool - reject 279 10.24 3.29 21.71 5.16 31.95 6.97
Thinking Skills and Admissions 27

Reject 1042 8.42 3.09 17.02 5.68 25.44 7.52Total 1716 9.54 3.48 19.51 6.45 29.05 8.83
Table 7.7: Correlations - MVAT Scores and Application Decisions - 2001
MVAT 2001 Part 2 Part 1 + Part 2 OutcomePart 1 0.54 0.79 0.39Part 2 0.94 0.43
Part 1 + Part 2 0.46
These results are much as found in 2001, although the Part 1 (Thinking Skills)score is a much better here predictor than was the case in 2000.
Tables 7.8 and 7.9 repeat the above information for the MVAT taken in 2002(Shannon, Massey and Dexter, 2003)
Table 7.8: MVAT Scores by Application Decision - 2002
SelectionDecision
N Part 1 Part 2 Part 1 + Part 2Mean SD Mean SD Mean SD
Offer 340 11.65 2.63 22.02 4.57 33.67 6.18Pool – offer 56 11.29 2.65 21.30 3.52 32.59 5.25Pool – reject 250 10.51 2.52 19.85 4.15 30.36 5.50Reject 1051 8.43 2.83 15.74 4.91 24.18 6.65Total 1697 9.48 3.06 17.79 5.41 27.27 7.54
Table 7.9: Correlations - MVAT Scores and Application Decisions - 2002
MVAT 2002 Part 2 Part 1 + Part 2 OutcomePart 1 0.55 0.80 0.38Part 2 0.94 0.42
Part 1 + Part 2 0.46
The results here are not unexpected and the correlation with Outcome now showsthe Part 1 score as being very similar to the Part 2 score.
Finally, Tables 7.10 and 7.11 (Shannon, 2004a) show the information for the (thennew) BMAT taken in 2003.
Table 7.10: BMAT Scores by Application Decision - 2003
SelectionDecision
N Part 1 Part 2 Part 1 + Part 2Mean SD Mean SD Mean SD
Offer 328 5.71 0.68 5.69 0.81 11.40 1.29Pool – offer 42 5.65 0.78 5.43 0.91 11.07 1.45Pool – reject 223 5.26 0.64 5.41 0.72 10.67 1.05Reject 1190 4.87 0.66 4.87 0.75 9.74 1.19Total 1783 5.09 0.74 5.10 0.83 10.19 1.37
It must be noted that the scores on the MVAT examinations were reported as rawscores and these form the basis for the reports in Tables 7.4, 7.6 and 7.8. Whenthe BMAT started in 2003, a new system of scaled scores was introduced that led tothe smaller numbers that for the basis for the reports in Table 7.10 and 7.12.
Table 7.11: Correlations - BMAT Scores and Application Decisions - 2003
MVAT 2003 Part 2 Part 1 + Part 2 OutcomePart 1 0.52 0.86 0.42Part 2 0.89 0.35
Part 1 + Part 2 0.44
Thinking Skills and Admissions 28

With 2003 results looking much as before, Tables 7.4 to 7.11 indicate that Parts 1and 2 of the MVAT/BMAT are related to selection decisions in a constant andsensible way. After the first administration in 2000, the two Parts are very similar inthe way they relate to the selection decisions for applicants although in 2003 thePart 2 score correlates less well with the Outcome measure than in previous years.
These findings are useful to know as the results presented in Section 7.3 showedthat Part 2 results were a far better predictor of University achievement than Part 1scores. It will be interesting see if subsequent analyses show that this was afeature of the 2000 testing or whether the part 2 score remains the best predictor.
7.5 The MVAT and BMAT Sub-scores
The results of the sub-scale analyses of MVAT and BMAT data for Part 1 of theassessments are shown in Table 7.12 below. The format is the same as for theTSA analyses reported in Section 6.3 where each of the three columns for CriticalThinking and Problem Solving gives the number of questions in the respective sub-test, the average change of the values of the discrimination indices across thequestions in the test and the estimated reliability for the sub-scale. Again, unbiasedquestion/total correlations have been used.
Table 7.12: Summary of Sub-Scale Analyses for Part 1 of MVAT/BMAT
Test/Year
Critical Thinking Problem Solving Whole TestNo.Qu.
Disc. Rel.50
No.Qu.
Disc. Rel.50
No.Qu.
Rel.50
No. ofCands.
MVAT2000 6 -0.04 0.79 14 0.00 0.89 20 0.85 1506MVAT2001 7 0.00 0.89 12 0.00 0.85 19 0.84 1733MVAT2002 5 -0.07 0.78 12 -0.01 0.89 17 0.86 1715BMAT2003 14 -0.02 0.78 26 0.00 0.80 40 0.77 4099BMAT2004 10 -0.02 0.83 25 0.00 0.81 35 0.79 4321
In the case of Problem Solving questions, the above results are similar to thosefound for the TSA. For Critical Thinking questions, however, the averagediscriminations are actually worse, or in one case the same, in the sub-test than inthe whole test.
The main difference here is that the number of CT questions in Part 1 of aMVAT/BMAT test is proportionally much smaller than is the case with the TSA.This means that there are some very short CT tests with total scores based on onlya few questions; as such, these total scores will not be very accurate estimates ofcandidates’ skills and so the correlations may be small for this reason.
When the two sub-scales are considered, they tend to be generally more consistentthan the whole test (i.e. the reliability is greater); the exceptions to this are the CTsub-scales from MVAT tests from 2000 and 2002.
From these results, as with those from the TSA analyses, while the sub-scalereliabilities are generally marginally greater than those for the whole tests, there areno indications that the CT and PS questions are substantially different in what theyare assessing.
7.6 The Sub-Scale Inter-Correlations
Table 7.13 now shows how the CT and PS sub-scores for Part 1 of theMVAT/BMAT relate to each other.
Table 7.13: Correlations between the Sub-Scales of Part 1 MVAT and BMAT
Test/Year
CorrelationCT v Total PS v Total CT v PS
Rel. 50 – Test
MVAT2000 0.75 0.95 0.49 0.85
Thinking Skills and Admissions 29

MVAT2001 0.79 0.90 0.45 0.84MVAT2002 0.75 0.96 0.53 0.86BMAT2003 0.78 0.92 0.47 0.77BMAT2004 0.74 0.93 0.45 0.79
The correlation between the two Thinking Skills sub-scales is again seen to be ofthe order of 0.5, as was the case for the TSA tests. The sub-score/totalcorrelations, low for CT when compared with PS, reflect the small numbers of CTquestions used relative to the PS questions (see Table 7.12).
Finally, Shannon (2004b) reports on a Factor Analysis of the BMAT data for the2003 test. While there is much detail of interest in the results, the first factor isclearly a PS factor and the second is clearly a CT factor. The first factor accountsfor almost 11 per cent of the total variance, the second factor just under 4 per centand the correlation between these factors is 0.49. There are individual questionsthat load onto other factors but the support for the findings with the analyses of boththe MVAT/BMAT Part 1 assessments and also with the TSA is substantial. Asdiscussed in Section 6.3, it is clear that further work using Factor Analytic methodswould help the understanding of the skills assessed by the BMAT Part 1 and TSAtests.
First, there do appear to be identifiable skills of Critical Thinking and ProblemSolving and they do appear to be correlated by about 0.5. Also, it does look asthough the Problem Solving skills, as assessed by PS questions, are more generalskills than those of Critical Thinking.
Only one such analysis has been done and it is clearly important to repeat similaranalyses with other MVAT/BMAT (and TSA) data. Nevertheless, the results hereare very much in keeping with what has gone before with the TSA.
7.7 The Implications of the Analyses
Much of what has been found from the MVAT/BMAT Part 1 analyses has alreadybeen seen from the TSA analyses. There are differences but these are, generally,quite small as, indeed, might be expected. Of course, the BMAT has an extra twoParts over and above the TSA and, indeed, even Part 1 of the BMAT concentrateson PS questions as a means of assessing the Thinking Skills of applicants.
As with the TSA tests, there is a need for a full data set with as much information aspossible to be available so that different analyses can be conducted to look atquestion bias, models of prediction, types of questions, etc.
Despite this need, however, Parts 1 and 2 of the BMAT provide reasonably reliableassessments although care needs to be taken with some questions which are lessthan satisfactory.
Thinking Skills and Admissions 30

8 TSA and BMAT in the Future
8.1 Much Needs Doing
This report has provided a brief overview of the origins from which the TSA and theMVAT/BMAT were created and has shown how these tests have worked in practice.From what has been seen, it is quite clear that both tests provide a good basis fordevelopment but also that there is much that can and should be done to improvethe assessment vehicles currently being piloted. Until such work has been done,the tests are not likely to reach their full potential.
The greatest need is for further data to be collected to evaluate the predictive powerof the tests. This is currently happening but, crucially, what is needed are sets ofdata which include not only the test scores and the first-year results of students butalso AS, A-Level and AEA grades and marks, Interview Scores and other evidenceused during the selection process. With these data, many different features of thetests and their efficiency could be evaluated. A linear prediction model using the CTand PS sub-scores separately in the light of the possible differences in the skillsassessed by the CT and PS questions would be another area of investigation thatcould usefully be explored.
It has been noted that the results of using interviews, Interview Scores, indicate thatthese have been very poor at predicting subsequent achievement at University.Indeed, Interview Scores are notable for being unreliable and subject to unexpectedvariation between interviewers. This is summarised by Salvatori (2001) who, in thecontext of selection of students for the health professions writes ‘Controversyremains as to the value of personal interviews and written submissions as selectiontools, although it is clear that training of assessors and explicit rating guidelinesenhance their reliability and validity.’ This point is underlined by Lucius (2003) in aconference presentation (where the context was not academic selection but HumanResource Management) where the following points were among those made.
Interviews are very widely used but can be very subjective as manyInterviewers lack formal training.
Interview scores can suffer from halo effects, lack of interview structure andagreed rating scale for questions asked and the scores can thus be unreliable(i.e. the agreement between multiple Interviewers is often low).
If this lack of training is overcome, interviews have the potential to yield scoresthat were more reliable and could thus provide useful information.
While the use of structured questions with an agreed response rating used by ofmultiple interviewers is clearly somewhat optimistic for use in an academic context,it is entirely possible that with careful training Interview Scores might become moreuseful in selecting students who have academic potential that is the case at present.
As part of the development of TSA and BMAT, it would be extremely useful to find apartner with whom the TSA could be used on a trial basis. The University ofCambridge is one that attracts applications from students who are of very highability and, while the range of ability is large, the ability of most applicants falls at theextreme end of the scale. This may well be why the TSA works as well as it does inrelation to other measures that do not discriminate well between applicants of highability but it would be extremely useful to expand the trial to include an institutionthat does not have such a selected group of applicants. Not only would this belikely to increase the reliability of the tests used but the value of using such testsmight also be seen more clearly. It would be important not to lose the focus on theneed for selection between applicants with high A-Level grades but many of theaspects of measurement and bias could be tackled better with data from applicantswith a greater range of ability than has been the case so far.
If a composite data sets were collated and, taking account of the problems on useraised in Section 5.7, background variables on students could be included that
Thinking Skills and Admissions 31

covered issues such as ethnic background, then it would be possible to use thesedata for analyses looking at the various sources of question bias as well as studythe analyses of data by question type.
It is also clear that the nature of the TSA needs to be reviewed. The skills assessedand the types of questions used are those that were identified in the early 90s and,although they are still likely to be relevant today, they should be re-affirmed and thetypes of questions used re-considered. Just as the degree courses themselves willhave changed over the past years, so too the skills assessed by the TSA may needto be amended to focus on what is currently important for success in university.This would enable the reliability of the TSA to be considered, and possiblyincreased, and might also improve its predictive validity.
Part of this review of skills could usefully include an investigation into thedimensionality of the existing test data already collected. The, somewhatinsensitive, investigation here has indicated no major differences between CT andPS questions in terms of what they assess but there are suggestions that there maybe elements of these skills that are different (indeed, it would be surprising if therewere not such differences). Just how large these differences are, whether they canbe pinpointed and whether or not any differences are important would be useful toknow as it would allow the review to be conducted against a backdrop that indicatedwhat was being assessed at present. A view could then be formed about whetherany such skill divisions needed nurturing.
No mention has been made here of prediction of success in different subjects. Thishas not been realistic with the current data as sample sizes have been small but asmore data are obtained so too can the value of using the TSA in different subjectsbe investigated.
Only when all of this information is available can the value of the tests assupplementary predictors be fully evaluated.
Following up the purpose to which the TSA and BMAT results are used (i.e. helpingto decide which applicants should be offered a place at university), it would also beuseful to follow up those students who were not successful with their application aswell as those who were admitted. This is, however, a task that would be extremelycomplex and would require substantial resources even though the informationgained would be invaluable in evaluating the worth of these tests.
There is little doubt that in the current educational climate the problems of selectionare creating issues for all concerned with access to Higher Education. TheTomlinson Report (DfES, 2004) and the subsequent discussions clearly underlineconcerns about the use of the existing A-level system for university selection. Astime goes on, candidates are achieving better and better grades and universityadmissions officers are at the sharp end in the sense of having more and moreapplicants with better and better grades. As has been seen, the selection rate atCambridge is currently about 1 in 4 but in other universities it may be as high as 1 in10 or more. In such cases, supplementary predictive information that can help thetask of admissions is likely to be welcomed.
University admissions was also the focus of the work of the Working Group chairedby Stephen Schwartz (Admissions to Higher Education Steering Group, 2004),where the topic of how to deal with the changing nature of admissions isconsidered. In particular, consideration is given to the use of a common test in theUK and ‘The Group notes that US-style SATs are one test worth exploring,alongside other possibilities.’ and that it would welcome ‘… the evaluation of othertests …’. Both the TSA and the BMAT are clear candidates for such considerationbut, as already explained in Section 5.3, there is considerable doubt as to therelevance of tests such as the SAT to the UK Educational system (Fisher, 2005).
8.2 Some Comments and Conclusions
Thinking Skills and Admissions 32

In conclusion, a number of points may be highlighted for consideration of the wayforward. These are drawn from the above paragraphs and also from Fisher (2002)
• It has to be said that both the TSA and the BMAT come from a long backgroundof Thinking Skills development and are seen to be reasonably reliableassessments. They thus provide a good basis for providing AdmissionsOfficers with supplementary information that could be used alongside thatcurrently used as predictors of university achievement. The predictive validity ofthese assessments has yet to be seen fully but, from the limited evidencepresented herein, the test scores appear to be no worse, and possibly evensomewhat better, than what is used at present (e.g. A-Level grades , InterviewScores, etc.).
• The admissions process is a difficult task and Admissions Officers maywelcome information provided by a test that assesses ‘how candidates think’ asit may help them carry out this task.
• The TSA and BMAT do assess something distinctive - cognitive skills which arenot directly assessed elsewhere.
• By assessing both Critical Thinking and Problem Solving skills in the TSA, manyof the skills necessary for Higher Education are assessed directly but the natureof these skills should be reviewed to ensure that they are up-to-date.
• Questions included in the TSA should look like the kinds of questions studentsencounter in university, thus giving the tests face validity.
The (Thinking) skills assessed by the TSA/BMAT are teachable (see Fisher, 2005)and teaching materials or guidance should be provided. This point is one that hasnot been discussed herein but if Thinking Skills are taught in schools then not onlywill future applicants be better prepared for Higher Education and to be successfulin their application to University but they are also likely to do better in their subject-based A-Levels as well. Evidence for the effect of teaching Thinking Skills onsubsequent examination performance is given by Fisher (2005). This being thecase there remains an open question as to whether effort should be made todevelop materials for teachers to support the teaching of Thinking Skills in schools
8.3 Suggestions for Further Work
Throughout this report, areas of investigation that need attention have beenmentioned as they occurred and a summary of these is provided in Appendix B.Much of this work can be conducted in the context of establishing co-operation withother universities and testing with a wide range of students to broaden the base forevaluation. This would allow the collection of a substantial data set for theevaluation of the nature, quality and predictive ability of both the TSA and the BMATtests.
Thinking Skills and Admissions 33

Appendix A
TSA Test Specification
The TSA consists of Critical Thinking and Problem Solving questions. These questionsare intended to assess different aspects of Thinking Skills although it is recognised thatthere will be something that is measured in common between them.
A TSA test consists of 50 multiple-choice questions. Of these questions, 25 assessCritical Thinking and 25 assess Problem Solving.
The questions are classified, as below, into seven types of Critical Thinking questionsand three types of Problem Solving questions.
Critical Thinking Skill Assessed No. of QuestionsSkill Category
1 Summarising the main conclusion 5of an argument
2 Drawing a conclusion when premises are given 4
3 Identifying assumptions 4
4 Assessing the impact of additional evidence 4
5 Detecting reasoning errors 4
6 Matching one argument with a second which 2has the same logical structure
7 Applying principles 2
Total - Critical Thinking 25
Problem Solving Skill Assessed No. of QuestionsSkill Category
FP Finding Procedures 9
RS Relevant Selection 8
IS Identifying Similarity 8
Total - Problem Solving 25
TSA Test 50
Thinking Skills and Admissions 34

Appendix B
Areas for Further Work
Throughout this report, references have been made to areas of investigation that would be ofbenefit to the TSA and BMAT assessments. Most of these have been included in the mainreport but this appendix provides a note of the areas that would most benefit from furtherwork.
Collation of full data set for the evaluation of:
Comparative prediction of combinations of sub-scores (as well as whole testscores)A comparison of predictive ability by subject of applicationRelationship between classical predictors and TSA/BMAT to establish worth of allvariables (i.e. A-Level grades, Interview Results, School Reports, etc.)
This would require data to be collected over a period of time and, if possible, for this tobe done in conjunction with at least one other University with a wider range of applicants.
Work on development of question types and question and test data to:
Ensure questions assess the appropriate Thinking Skills for Higher Education todayand see whether this has any implications for the question types used.
Interpret factor structures in relation to question types and skills assessedEliminate as far as possible any cultural assumptions that may be implicit in
questionsReduce the effect of language use/ability on questions (especially CT questions)Detect, identify and eliminate question and test biasImprove test questions through question analysis and evaluation and so improve
test reliabilityDetermine functioning of test parts – CT/PS
Much of this work could be done independently from the main validation samples. Somedata would need to be collected - to obtain a sample of students with a range of ethnicbackgrounds, for example - but the existing data could still yield more results than havebeen obtained already.
Other Points
One matter that comes up in the discussion of the use of Thinking Skills is that ofteaching. There is little doubt that Thinking Skills can be taught and that suchteaching improves students’ score not only on tests of Thinking Skills (such as TSAand BMAT Part 1) but also on traditional measures of achievement such as A-level(see Fisher, 2002, 2005). It is a point worthy of consideration that UCLES mightlead with the production of teaching/learning materials in this field.
A review of ‘where rejected applicants go’ and what success they have in whateverpaths they follow would be invaluable but it is recognised that this would be a verycomplex, and so costly, project to mount.
All of this work could not be mounted at one time. Some parts are quite urgent if the TSA andBMAT are to stay ahead of the field (e.g. questions development) but much could be includedover a number of years, perhaps as few as three, so that the true nature of the tests usedcould be determined.
Thinking Skills and Admissions 35

References
Note on Availability
In preparing this report, a wide variety of documents has been drawn on includingmany old project documents, many of which are no longer available. The referencesin the text are provided as usual and each one falls into one of four categories. In thelist of references below the category into which each one falls is indicated by a bold,capital letter A, B, C or D.
Category AReference to an existing publication or document that may beobtained in the usual way (e.g. from libraries, bookshops, etc.).
Category BReference to a document held in electronic form, in either Adobe pdfor MSWord format, which may be downloaded from the CambridgeAssessment website under the Assessment Directorate's sectionlisting publications, conference papers and other articles.
http://www.cambridgeassessment.org.uk/research/confproceedingsetc/
Category CReference to a document held in electronic form, in either Adobe pdfor MSWord format, and which may be downloaded from theCambridge Assessment website under the Assessment Directorate'ssection listing older (archive) documents of interest.
http://www.cambridgeassessment.org.uk/research/historicaldocuments/
Category DReference to an old UCLES project document that is no longeravailable.
References
Admissions to Higher Education Steering Group (2004). Fair Admissions to Higher Education:Recommendations for Good Practice. (Schwartz Report). A
Anastasi, A. (1968). Psychological Testing. New York: Macmillan. A
Bramley, T. (2001). MVAT 2000 – Statistical Report. Report prepared for the University ofCambridge Local Examinations Syndicate. B
Cambridge Reporter (2004). Undergraduates: Statistics of Applications and Acceptances forOctober 2003. University of Cambridge Reporter Vol. CXXXIV; Special Report No.12, Friday12 March 2004. A
Chapman, J (2005). The Development of Thinking Skills Assessment. Report prepared forthe University of Cambridge Local Examinations Syndicate. B
CIE (2004). Syllabus for A-Level and AS Thinking Skills. Cambridge: CIE. A
DfES (2004). 14-19 Curriculum and Qualifications Reform: Final Report of the Working Groupon 14-19 Reform. (Tomlinson Report) London: DfES. A
Ebel, R. L. (1972). Essentials of Educational Measurement. New Jersey, Englewood Cliffs:Prentice-Hall. A
Thinking Skills and Admissions 36

Fisher, A (1989). The Higher Studies Test. Report prepared for the University of CambridgeLocal Examinations Syndicate. B
Fisher, A. (1990a). Proposal to Develop a Higher Studies Test: A Discussion Document.Cambridge: UCLES. B
Fisher, A. (1990b). Research into a Higher Studies Test: A summary. Cambridge: UCLES. B
Fisher, A. (1992). Development of the Syndicate’s Higher Education Aptitude Tests. Reportprepared for the University of Cambridge Local Examinations Syndicate. B
Fisher, A. (2002). Thinking Skills for the 21st Century. Paper prepared for CIE seminar:Thinking Skills for the 21st Century. Cambridge 18 November 2002. Cambridge: CIE. A
Fisher, A. (2005). ‘Thinking Skills’ and Admission to Higher Education. Report prepared for theUniversity of Cambridge Local Examinations Syndicate. Cambridge: UCLES. B
Forster, M. (2004) Final Analysis of the 2003 TSA Tests. Report for the University ofCambridge Local Examinations Syndicate. B
Green, A. (1992). MENO: A Validation Study of Formal Reasoning Items. Report prepared forthe University of Cambridge Local Examinations Syndicate. D
Guilford, J.P. (1973). Fundamental Statistics in Psychology and Education. New York:Appleton. A
Lucius, R. H. (2003). Selection Assessments: What you should know. Presentation to SHRMAtlanta Conference, 21 October 2003. A
Massey, A. J. (1994a). MENO Thinking Skills Service 1993/94 Pilot: Evaluation Report.Report from the Evaluation Service: Research and Evaluation Division, University ofCambridge Local Examinations Syndicate. B
Massey, A. J. (1994b). Evaluation of MENO 1992/93 Pilot Data: Experience in TwoUniversities. Report from the Evaluation Service: Research and Evaluation Division,University of Cambridge Local Examinations Syndicate. B
Massey, A. J. (1997). MENO and GCE Achievement in Singapore. Report from the EvaluationService: Research and Evaluation Division, University of Cambridge Local ExaminationsSyndicate. D
Massey, A. J. (2004). Medical and Veterinary Admissions Test Validation Study. Report fromResearch and Evaluation Division, University of Cambridge Local Examinations Syndicate. B
Massey, A. J., Shannon M. and Dexter, T. (2002). MVAT Scores and Outcomes ofApplications for Medical and veterinary Courses in 2001. Report from the Research andEvaluation Division, University of Cambridge Local Examinations Syndicate. B
Nonneman, W., De Metsenaere, M., Janssen, P., Cortens, I., Tanssens, R., Wels, G. andClaes, L. (1995). The ‘MENO’ Test at Flemish Universities. Report prepared for the Universityof Cambridge Local Examinations Syndicate. D
Nuttall, D. L. and Willmott, A. S. (1972). British Examinations: Techniques of Analysis.Slough: NFER. A
OCR (2003). Advanced Extension Award in Critical Thinking. Cambridge: OCR. A
OCR (2004). AS/A-Level GCE in Critical Thinking: Specification Summary. Cambridge: OCR.A
Thinking Skills and Admissions 37

Robinson, P. (2002). Thinking Skills and University Admissions. Presentation made to CIEseminar: Thinking Skills for the 21st Century. Cambridge 18 November 2002.Cambridge: CIE.A
Rule, E. (1989). The Law Studies Test: Results of a Trial Administration. Report prepared for:University of Cambridge Local Examinations Syndicate. D
Salvatore, P. (2001). Reliability and Validity of Admissions Tools Used to Select Students forthe Health Professions. Advances in Health Sciences Education 6 (2): pages 159-175. A
Shannon, M. (2004a). BMAT Scores and Outcomes of Applications to the University ofCambridge for Medical and Veterinary Courses in 2003. Report from the Research andEvaluation Division, University of Cambridge Local Examinations Syndicate. B
Shannon, M. (2004b). BMAT Section 1 Factor Analysis. Results of analyses for UCLES. B
Shannon, M., Massey, A. J. and Dexter, T. (2003). MVAT Scores and Outcomes ofApplications for Medical and veterinary Courses in 2002. Report from the Research andEvaluation Division, University of Cambridge Local Examinations Syndicate. B
Thomson, A. and Fisher, A. (1993). A validation Study of Assessing Argument Items. Reportprepared for the University of Cambridge Local Examinations Syndicate. D
UCLES (undated). Draft Test Material for a Higher Studies Test: A Consultation Document.Document produced by the University of Cambridge Local Examinations Syndicate. D
UCLES (1992a). Academic Aptitude Profile: Proposed Scheme. Consultation paper. B
UCLES (1992b). Academic Aptitude Profile: Rationale. Consultation paper. B
UCLES (1992c). Academic Aptitude Profile: Logical Reasoning: sample Questions.Consultation paper. D
UCLES (1992d). Academic Aptitude Profile: Guide to Writing and Editing MathematicalReasoning Items. Consultation paper. D
UCLES (1993a). MN01-1: The MENO Thinking Skills Service 1993-1994: An Introduction. C
UCLES (1993b). The MENO Thinking Skills Service 1993-1994: Students’ Guide. C
UCLES (1993c). The MENO Thinking Skills Service 1993-1994: Handbook of AdministrativeArrangements. D
UCLES (1993d). The MENO Thinking Skills Service 1993-1994: Development and Rationale.C
UCLES (2004a). Thinking Skills Assessment. A student Handbook for TSA. Cambridge:UCLES. (See http://tsa.ucles.org.uk/index.html). A
UCLES (2004b). Analysis of (Subject B) Candidates’ TSA Results 2003. Report fromResearch and Evaluation Division, University of Cambridge Local Examinations Syndicate. B
US Department of Labor (1999). Testing and Assessment: An Employer’s guide to goodpractices. A document by the U.S. Department of Labor, Employment and TrainingAdministration (full document is available at http://www.hr-guide.com/data/G358.htm). A
Willmott, A.S. (2004). TSA Administration December 2003: A Preliminary Investigation ofQuestion Bias. Report prepared for the University of Cambridge Local ExaminationsSyndicate. B
Thinking Skills and Admissions 38