thinkforex - 2 - suppot and resistance points are particularly popular with forex traders. you will...
TRANSCRIPT


TA SUPPORT & RESISTANCE
Introduction to Technical Analysis
www.ThinkForex.com 2 [email protected]
Content
Risk Warning ..................................................................................................................................................................... 3
SUPPORT & RESISTANCE EXPLAINED: ............................................................................................................................... 4
Support & Resistance Interchange............................................................................................................................ 5
MEDTHODS TO IDENTIFY S/R: ........................................................................................................................................... 6
Horizontal S/R ............................................................................................................................................................... 6
Zones ............................................................................................................................................................................ 7
Long Wicks / Tails ......................................................................................................................................................... 8
Channels / Trendlines ................................................................................................................................................... 9
Pivot Points ................................................................................................................................................................. 10
Fibonacci ..................................................................................................................................................................... 11
Moving Averages (MA) ............................................................................................................................................... 12
Using Confluences of S/R ............................................................................................................................................ 13
Confluences: Trendline & Horizontal S/R ................................................................................................................... 13
Confluences: Fibonacci; Horizontal S/R; Moving Averages ........................................................................................ 14
Confluences: Trendline Resistance; 200eMA; Potential Chart Pattern ...................................................................... 15
Confluences: Fibonacci; Pivotal S/R; Rejection Spikes ............................................................................................... 16
SUMMARY: ...................................................................................................................................................................... 17
REDUCE YOUR LEARNING CURVE: .................................................................................................................................. 18
TA SUPPORT & RESISTANCE
Introduction to Technical Analysis
www.ThinkForex.com 3 [email protected]
Risk Warning Trading in the Foreign Exchange and CFDs market involves a significant and substantial risk of loss and may not be suitable for everyone. You should carefully consider whether trading is suitable for you in light of your age, income, personal circumstances, trading knowledge, and financial resources. Only true discretionary income should be used for trading in the Foreign Exchange and CFDs market. Any opinion, market analysis or other information of any kind contained is subject to change at any time. Nothing in this presentation should be construed as a solicitation to trade in the Foreign Exchange or CFDs market. If you are considering trading in the Foreign Exchange or CFDs market, before you trade, make sure you understand how the spot market operates, how ThinkForex is compensated, understand the Think Forex trading contract, rules and be thoroughly familiar with the operation of and the limitations of the platform on which you are going to trade. A Financial Services Guide ( FSG) and Product Disclosure Statements (PDS) for these products is available from TF GLOBAL MARKETS (AUST) PTY LTD by emailing [email protected]. The FSG and PDS should be considered before deciding to enter into any Derivative transactions with TF GLOBAL MARKETS (AUST) PTY LTD. The information on the presentation is not directed at residents in any country or jurisdiction where such distribution or use would be contrary to local law or regulation. 2012 TF GLOBAL MARKETS (AUST) PTY LTD. All rights reserved. AFSL 424700. ABN 69 158 361 561. Please note: We do not service US entities or residents.
Introduction to Technical Analysis By Matt Simpson Copyright @ 2013 TF GLOBAL MARKETS (AUST) PTY LTD All Rights Reserved
SUPPORT & RESISTANCE
Introduction to Technical Analysis
www.ThinkForex.com 4 [email protected]
Thank you for downloading this Trading Guide. This is the second of a 4‐part series to introduce you to Technical Analysis. Each part has a video and accompanying trading guide which you can view below.
Part 1: Trends Part 2: Support & Resistance Part 3: Chart Patterns Part 4: TA Techniques Combined Part5: Trading Technically (Bonus Video)
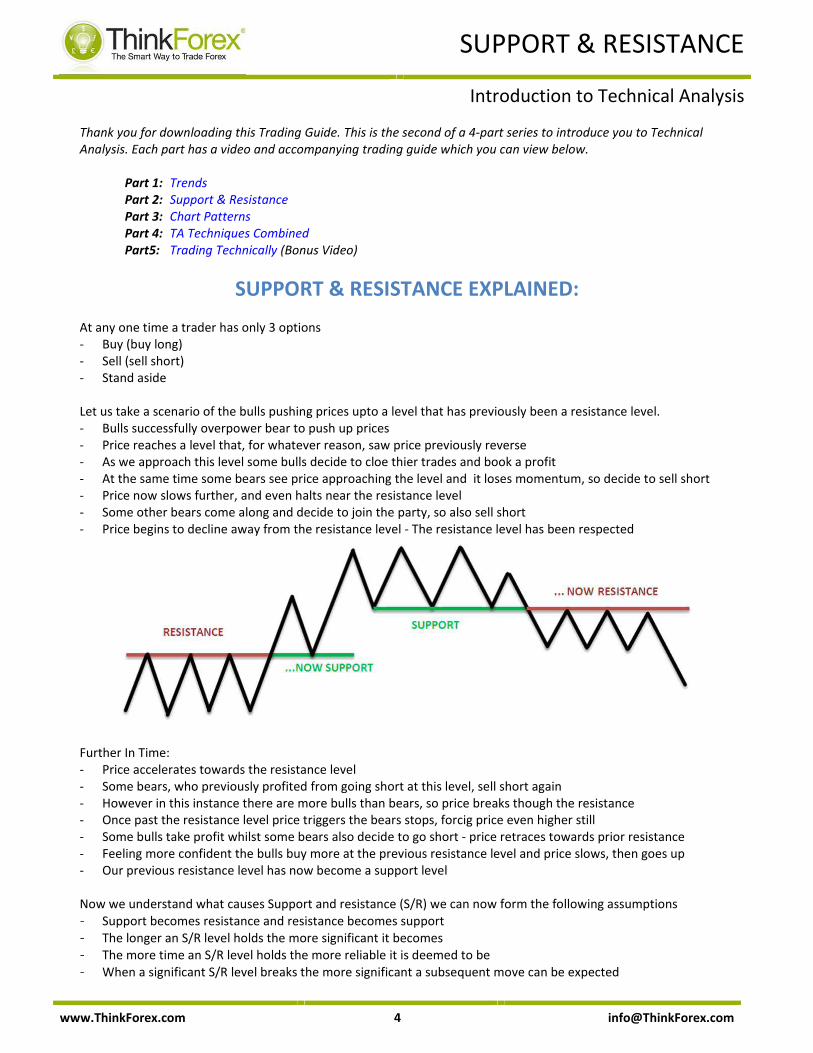
SUPPORT & RESISTANCE EXPLAINED: At any one time a trader has only 3 options ‐ Buy (buy long) ‐ Sell (sell short) ‐ Stand aside Let us take a scenario of the bulls pushing prices upto a level that has previously been a resistance level. ‐ Bulls successfully overpower bear to push up prices ‐ Price reaches a level that, for whatever reason, saw price previously reverse ‐ As we approach this level some bulls decide to cloe thier trades and book a profit ‐ At the same time some bears see price approaching the level and it loses momentum, so decide to sell short ‐ Price now slows further, and even halts near the resistance level ‐ Some other bears come along and decide to join the party, so also sell short ‐ Price begins to decline away from the resistance level ‐ The resistance level has been respected
Further In Time: ‐ Price accelerates towards the resistance level ‐ Some bears, who previously profited from going short at this level, sell short again ‐ However in this instance there are more bulls than bears, so price breaks though the resistance ‐ Once past the resistance level price triggers the bears stops, forcig price even higher still ‐ Some bulls take profit whilst some bears also decide to go short ‐ price retraces towards prior resistance ‐ Feeling more confident the bulls buy more at the previous resistance level and price slows, then goes up ‐ Our previous resistance level has now become a support level Now we understand what causes Support and resistance (S/R) we can now form the following assumptions - Support becomes resistance and resistance becomes support - The longer an S/R level holds the more significant it becomes - The more time an S/R level holds the more reliable it is deemed to be - When a significant S/R level breaks the more significant a subsequent move can be expected

SUPPORT & RESISTANCE
Introduction to Technical Analysis
www.ThinkForex.com 5 [email protected]
Support & Resistance Interchange Support and Resistance interchange: Once a level of resistance has been broken to the upside you will often see this same level retested. If this holds the previous resistance is then considered to be a level of support. The reverse is also true – when a level of support breaks it often becomes a level of resistance. The longer an S/R level holds the more significant it becomes Levels of S/R can last anything between a couple of minutes, to years or decades. The reason for the break does not usually concern the Technical Analyst because we assume something special has changed within the market conditions for this level to break.

SUPPORT & RESISTANCE
Introduction to Technical Analysis
www.ThinkForex.com 6 [email protected]
MEDTHODS TO IDENTIFY S/R: Whilst there are many inventive ways of finding S/R levels I am going to cover some of the simplest and most frequently used. These are the methods I use myself and are applicable to every timeframe or market, and accessible to anyone with charting software. The idea is to combine several forms of S/R to gain more confidence in a particular level holding in future. The more of these levels you can identify within a relatively close range to each other, the better.
Price - Horizontal S/R - Zones - Trendlines /
Channels
Indicators - Pivot Points - Fibonacci - Moving
Averages
Horizontal S/R
This is by far the most simple of methods, and the one I use most often. If you had to learn only one form of analysis then I would recommend Horizontal S/R. All we are looking for area areas on the chart which have been tested many times (the more times the more reliable) and ideally have been tested as both support and resistance. If they have been tested as both support and resistance, then you will hear me refer to these levels as pivotal S/R levels.
Use the Crosshair to identify horizontal S/R: Press Control+ D to enable the crosshair on your chart, then move your mouse up and down the chart (without clicking) to find areas that have been tested and respected on the chart. These levels needn’t be perfect (although sometimes they are) so it is OK if the Candle Tails/Wickes test the levels once in a while. Always start on higher timeframes to identify major levels or S/R before moving to lower timeframes to repeat the process.

SUPPORT & RESISTANCE
Introduction to Technical Analysis
www.ThinkForex.com 7 [email protected]
Zones
Zones are similar to Horizontal (or Pivotal) S/R levels except they allow for much more ‘breathing room’. So these are not levels where you expect an exact price to get hit and reverse, but areas where you expect some sort of price or hesitation, if nothing else. I regularly use three methods to identify Zones are as follows:
- Congestion Areas - Swing points - Long Tails/Wickes
These Congestions Areas work on all time‐frames and it is simply a case of looking left and noting these areas as potential S/R areas before price reaches there.
Congestions Areas If you look at the Silver Weekly chart you can see how there was some very messy/sideways price action around March 2010 which I have highlighted in Green. Price then rallied all the way up to 50. Some 3 years later price came all the way back into the green box and held as support. I drew the box long before price ever got there. This is not an exact science and certainly no signal to buy silver, but it helped us anticipate an area of support long before it got there.
Swing Points - Swing points must be one of, if not the most closely
watched points on a chart. - Anyone who uses Dow Theory, Elliott Waves and
Trends Analysis (Higher‐Highs, Lower‐Lows etc.) watch the swing points on a chart as part of their analysis.
- They need not be precise but you usually (at the very least) get a price reaction when we revisit a previous swing point

SUPPORT & RESISTANCE
Introduction to Technical Analysis
www.ThinkForex.com 8 [email protected]
Long Wicks / Tails
This is by far the most simple of methods, and the one I use most often. If you had to learn only one form of analysis then I would recommend Horizontal S/R. All we are looking for area areas on the chart which have been tested many times (the more times the more reliable) and ideally have been tested as both support and resistance. If they have been tested as both support and resistance, then you will hear me refer to these levels as pivotal S/R levels.
Long tails/Wickes: - Also referred to as spikes, long wicks highlight areas that have been aggressively attacked yet successfully
defended, making it an important price level for future reference. - Using a spike in isolation is not always enough. - If we see multiple areas where these spikes appear I will draw a box connecting these areas to draw my zone. - This technique is particularly useful on FX (especially Crosses and Exotics) as these multiple spikes are a common
characteristic of these markets.
SUPPORT & RESISTANCE
Introduction to Technical Analysis
www.ThinkForex.com 9 [email protected]
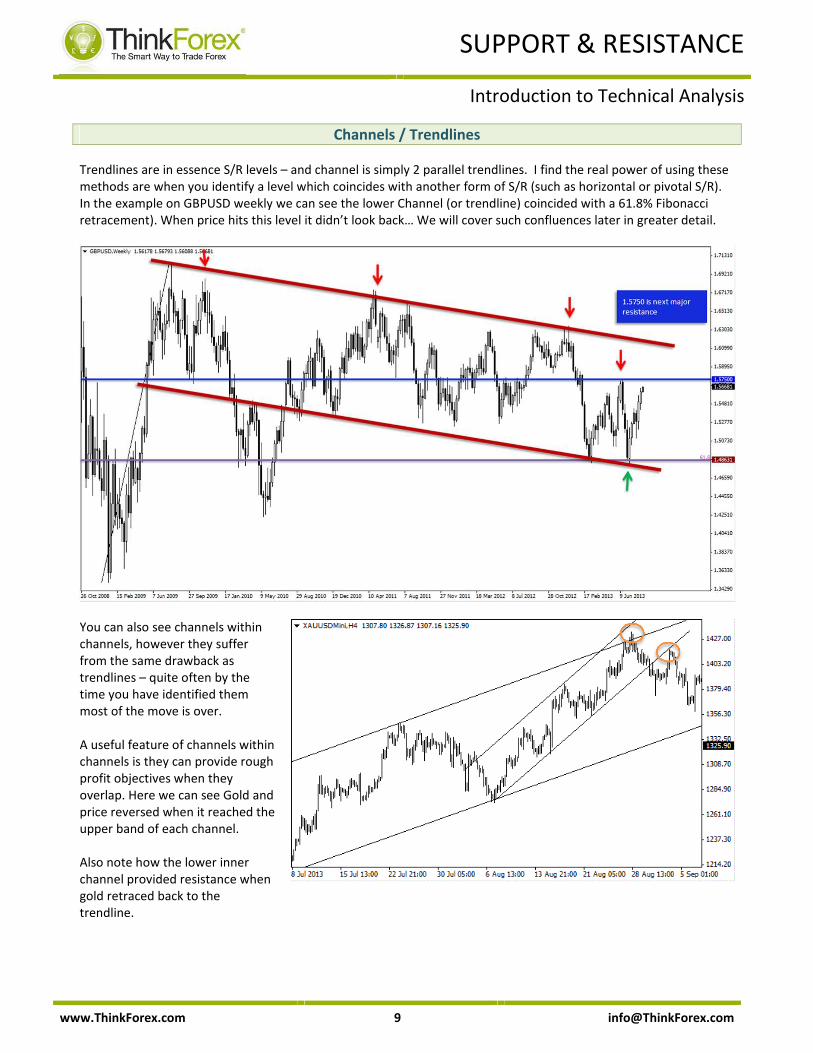
Channels / Trendlines Trendlines are in essence S/R levels – and channel is simply 2 parallel trendlines. I find the real power of using these methods are when you identify a level which coincides with another form of S/R (such as horizontal or pivotal S/R). In the example on GBPUSD weekly we can see the lower Channel (or trendline) coincided with a 61.8% Fibonacci retracement). When price hits this level it didn’t look back… We will cover such confluences later in greater detail.
You can also see channels within channels, however they suffer from the same drawback as trendlines – quite often by the time you have identified them most of the move is over. A useful feature of channels within channels is they can provide rough profit objectives when they overlap. Here we can see Gold and price reversed when it reached the upper band of each channel. Also note how the lower inner channel provided resistance when gold retraced back to the trendline.
SUPPORT & RESISTANCE
Introduction to Technical Analysis
www.ThinkForex.com 10 [email protected]
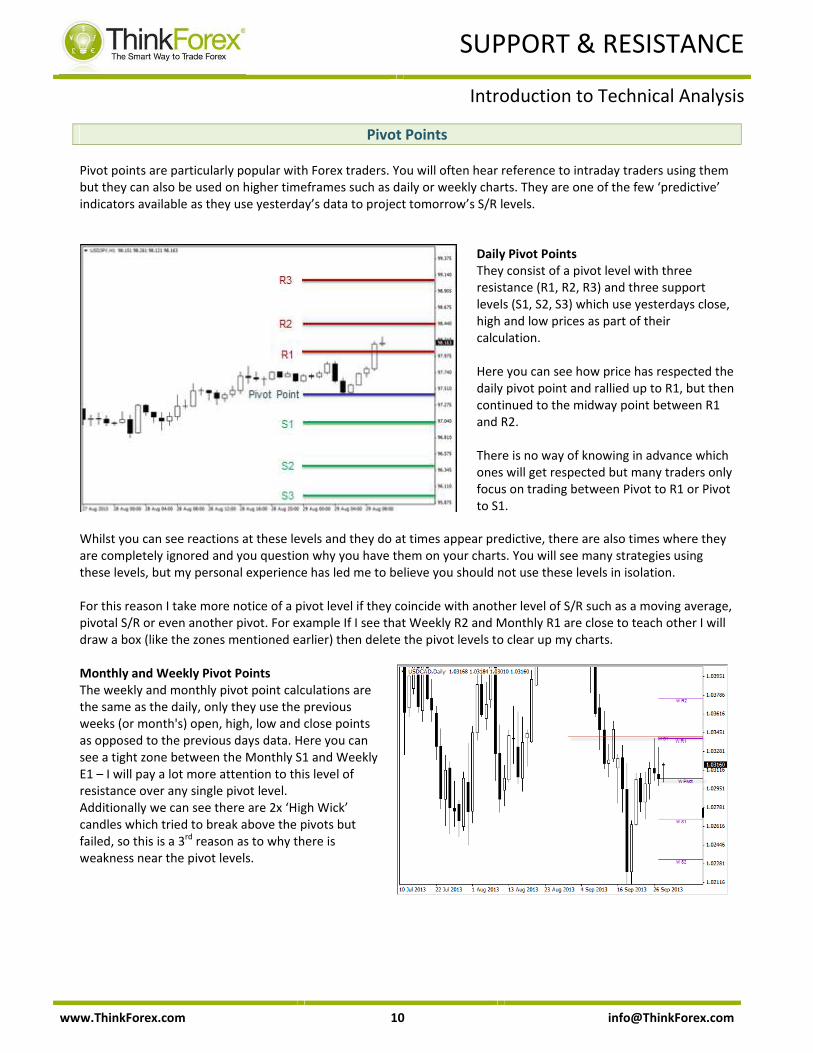
Pivot Points Pivot points are particularly popular with Forex traders. You will often hear reference to intraday traders using them but they can also be used on higher timeframes such as daily or weekly charts. They are one of the few ‘predictive’ indicators available as they use yesterday’s data to project tomorrow’s S/R levels.
Daily Pivot Points They consist of a pivot level with three resistance (R1, R2, R3) and three support levels (S1, S2, S3) which use yesterdays close, high and low prices as part of their calculation. Here you can see how price has respected the daily pivot point and rallied up to R1, but then continued to the midway point between R1 and R2. There is no way of knowing in advance which ones will get respected but many traders only focus on trading between Pivot to R1 or Pivot to S1.
Whilst you can see reactions at these levels and they do at times appear predictive, there are also times where they are completely ignored and you question why you have them on your charts. You will see many strategies using these levels, but my personal experience has led me to believe you should not use these levels in isolation. For this reason I take more notice of a pivot level if they coincide with another level of S/R such as a moving average, pivotal S/R or even another pivot. For example If I see that Weekly R2 and Monthly R1 are close to teach other I will draw a box (like the zones mentioned earlier) then delete the pivot levels to clear up my charts.
Monthly and Weekly Pivot PointsThe weekly and monthly pivot point calculations are the same as the daily, only they use the previous weeks (or month's) open, high, low and close points as opposed to the previous days data. Here you can see a tight zone between the Monthly S1 and Weekly E1 – I will pay a lot more attention to this level of resistance over any single pivot level. Additionally we can see there are 2x ‘High Wick’ candles which tried to break above the pivots but failed, so this is a 3rd reason as to why there is weakness near the pivot levels.

SUPPORT & RESISTANCE
Introduction to Technical Analysis
www.ThinkForex.com 11 [email protected]
I only put pivot levels onto my charts temporarily to highlight areas where pivots overlap or are close to each other. Once I have marked these onto the charts with boxes I then remove them as I prefer a clear chart to trade from.
Also Pivot points do not come supplied with MT4 as standard but there are many versions freely available on the internet. I have chosen the ones above because they are clean and simple and only show the current pivot levels. Many of the Pivot Points you will come across will show historical levels. Whilst this can be handy to show you how well a market has respected them (if at all) they can make the charts very messy and hard to work with.
Whichever pivots points you choose will be down to personal preference.
Fibonacci There are two forms of Fibonacci: Retracements and Extensions. For S/R levels I only use retracement so this guide will only cover this method.
The retracement tool is quite aptly named as this is exactly what we are trying to measure ‐ Retracements! When trend is in effect and we see a suspected ‘phase 2’ move (also known as corrections, counter‐trend or retracements) we measure the distance of ‘phase 1’ to try and anticipate where ‘phase 2’ may end. However remember that the markets are fractal – so you can also measure much longer trends. For more information on the fractal nature of trends please refer to guide 1 – Trends. For simplicity I only use 38.2%, 50% and 62.8% retracement levels, and take more notice if they overlap with other Fibs numbers or forms of S/R.

SUPPORT & RESISTANCE
Introduction to Technical Analysis
www.ThinkForex.com 12 [email protected]
Moving Averages (MA)
Whilst we covered MA's for the use of trends in Part 1, they can also be used for S/R levels. Something to keep in mind however the fact that MA’s, like their name is implies, Move! There is no golden rule stating which periods you should use, or which type (Simple, exponential etc.) but it is more important you are familiar with the characteristics of the MA's you choose to use. All MA's lag behind price so I only place them onto a chart temporarily to see if they coincide with other S/R levels before removing them to keep my chart clear. You will also see many textbooks or strategies referring to price bouncing off of MA's but I treat them like trendlines ‐ I would never enter a trade simply because price has tested either a trendline or MA as I failed to trade like this profitably. So like all of my analysis it needs several confluences in the same area before I give it any weight. Personally I use a combination of 8, 21, 50 and 200 eMA (exponential MA) but you would do just as well using the sMA (Simple MA). The 50 and 200 are very popular so are closely watched by a lot of market participants, so it makes sense to use these as they tend to get reactions and act as 'dynamic S/R' levels. However the 8 and 21eMA I don't really use for S/R at all but instead visualise the area between the 2 as a cloud and look for buy or sell setups around these areas. Price has stalled at the 200eMA
after a particularly bullish run‐up. Also note how this level held as resistance and was also previously support. The longer the period of MA, the more reliable they tend to be as S/R, particularly on higher timeframes above the Daily. As for intraday timeframes: - The 200MA on H4 is very
similar to the 50MA on the daily
- The 200MA on H1 is very similar to the 50MR on H4
Here we can see how price seems to 'dance' around the 50 and 200 interchangeably. Whilst I consider it to be dynamic S/R and is easy to identify in hindsight, tying to trade off of these levels are problematic because there is so much noise around the MA itself. I therefor only use MA's as an additional confluence of S/R alongside other forms of S/R.

SUPPORT & RESISTANCE
Introduction to Technical Analysis
www.ThinkForex.com 13 [email protected]
Using Confluences of S/R You probably noticed my repeated references to using confluences ‐ I cannot stress this enough. As a trader it is your duty to trade high probability trades ad a way of increasing the probability of a level holding is if several forms of S/R (or analysis) all suggest the same areas. Below you can see my preferred methods of S/R. I need at a minimum of 2 from my preferred list, but most often I use all three. I only take notice of the additional confluences if one of my preferred methods also highlights an area (so I never use the additional in isolation).
My preferred Combination - Horizontal S/R - Pivot Points- Fibonacci (50%,
38.2%)
Additional Confluences - Moving
Averages - Channels - Internal
Trendlines
Once I have identified my confluences I then draw boxes on the chart and remove my indicators. This keeps my trading charts clean and simple whilst also highlighting key areas I need to look out for.
Confluences: Trendline & Horizontal S/R
A spike low confirmed the pivotal S/R level which also coincided with the lower Channel trendline. I have found horizontal S/R and trendlines to be quite reliable.

SUPPORT & RESISTANCE
Introduction to Technical Analysis
www.ThinkForex.com 14 [email protected]
Confluences: Fibonacci; Horizontal S/R; Moving Averages
Here we can see how USDJPY is coiling up in a triangular pattern. Whilst these are usually continuation patterns (which would suggest a resumption of the uptrend) there is now law saying they have to. We are trading just above 97.00 pivotal S/R and I want to know where the next level of support is on the weekly chart should 97.00 break, and noted the following confluences at 93.56 93.56 is a key level of support because: ‐ Pivotal S/R ‐ 38.2% Retracement ‐ 50eMA But what if 93.56 breaks to the downside? 90.34 because: ‐ Pivotal S/R ‐ 50% Retracement ‐ 200eMA I particularly like these 2 levels because it is not often you see 3 confluences of support or resistance within such tight ranges.

SUPPORT & RESISTANCE
Introduction to Technical Analysis
www.ThinkForex.com 15 [email protected]
Confluences: Trendline Resistance; 200eMA; Potential Chart Pattern Between July 10th and 22nd AUDUSD had been creeping up a trendline and broke down to the pivotal S/R level of 0.9130. When price rebounded and made a bullish run I extended the broken trendline and watch price respect this as a new level of resistance. Additionally I noted how the 200eMA was in the same area then saw a Bearish Candlestick pattern form beneath the resistance confluence. At the time I was not sure if it was a Heady & Shoulders top, but I could foresee the potential for the pattern to form if the resistance level held (which is did). When price started to decline it stalled temporarily at 0.92225 near the Pivotal S/R and 50eMA. When this level broke price used the 50eMA as resistance before rolling over. The fact that 0.91300 was broken immediately also confirmed how bearish this move was.
SUPPORT & RESISTANCE
Introduction to Technical Analysis
www.ThinkForex.com 16 [email protected]
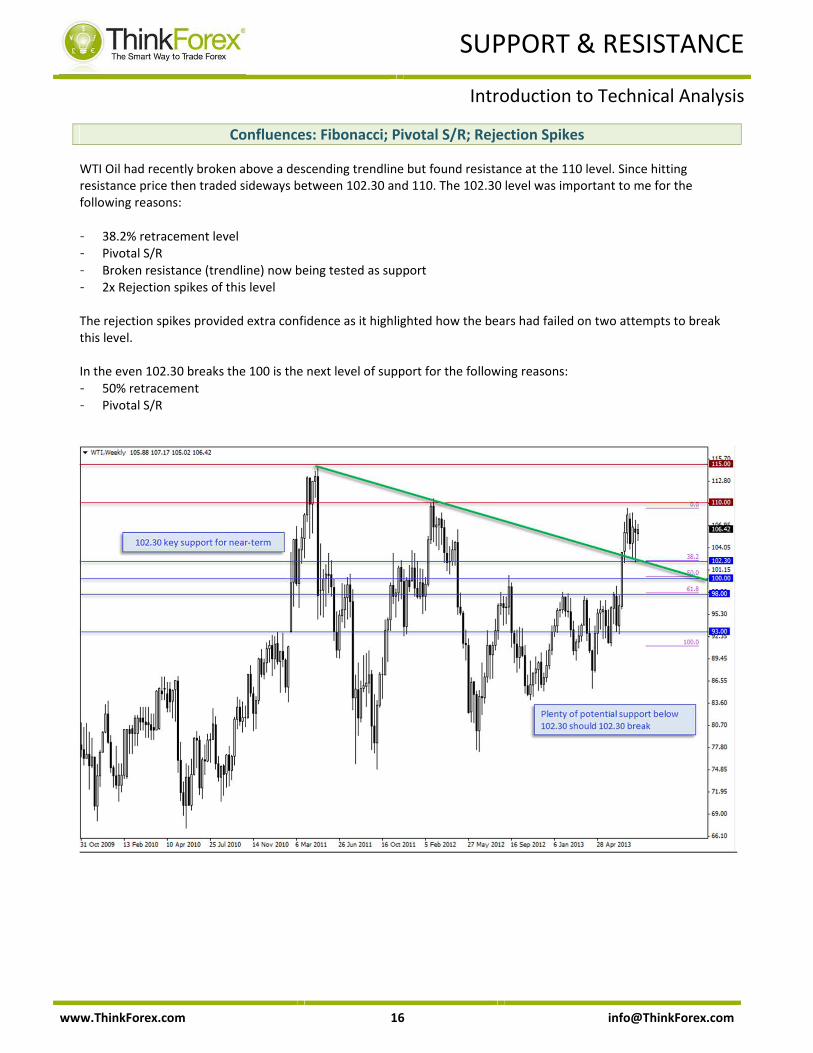
Confluences: Fibonacci; Pivotal S/R; Rejection Spikes
WTI Oil had recently broken above a descending trendline but found resistance at the 110 level. Since hitting resistance price then traded sideways between 102.30 and 110. The 102.30 level was important to me for the following reasons: - 38.2% retracement level - Pivotal S/R - Broken resistance (trendline) now being tested as support - 2x Rejection spikes of this level The rejection spikes provided extra confidence as it highlighted how the bears had failed on two attempts to break this level. In the even 102.30 breaks the 100 is the next level of support for the following reasons: - 50% retracement - Pivotal S/R

SUPPORT & RESISTANCE
Introduction to Technical Analysis
www.ThinkForex.com 17 [email protected]
SUMMARY: There really is nothing magical about support or resistance – I see them purely as a logical way of breaking down price to aid your trading plans. There are only two outcomes to the behavior of an S/R level – it will either be respected, or it will be broken. If respected go to plan A, if it breaks go to plan B.
Once combined with trendlines you have a more coherent view of the market, which will allow you to time your entries, exits, or know when to keep out of the markets all together.
Here is an example of a simple plan: ‐ If a level of support holds, we can look for bullish trades in the same direction of a bullish trend for a higher probability trade. ‐ If there are multiple levels of support in the same area it provides us with greater confidence this level may hold. ‐ We can consider placing our stop behind this level of support. ‐ We can consider placing our take profit near the next level of resistance. ‐ If this level of support breaks we will get stopped out. ‐ If this level is significant we can expect a larger downside movement, and create a new trade plan.
- Support becomes resistance and resistance becomes support - The longer a level holds the more significant it is considered to be - If a significant level breaks a significant subsequent move can be expected - Use confluences of S/R to increase the probability of it being respected\ - S/R levels can be used to plan entry and exit (SL, TP) Identify S/R using: - Horizontal S/R - Zones (Spikes, Swing Points, Congestion Areas) - Trendlines / Channels - Pivot Points - Fibonacci - Moving Averages For Greater Confidence - Zoom out for bigger picture - Identify S/R on higher timeframes then work your way down to smaller timeframes you trade. - Use confluences of S/R - Combine with other analysis - Allow ‘breathing room’

SUPPORT & RESISTANCE
Introduction to Technical Analysis
www.ThinkForex.com 18 [email protected]
REDUCE YOUR LEARNING CURVE: I hope you have enjoyed this series and found it of benefit. Whilst I would like to think you are now expert analysts just from reading this series, like anything in life, it will take time to master which will require practice and experimentation – however a great way of speeding up the process is to watch others perform analysis.
Trader’s Corner FaceBook Twitter RSS
I would highly encourage you to subscribe to the ThinkForex YouTube channel and attend our weekly webinars as
they included the methods used throughout the series.