think! campaign marketing plan 2015 to 2016 and 2016 to 2017
TRANSCRIPT

July 2015
THINK! campaign marketing plan 2015/16 & 16/17

The Department for Transport has actively considered the needs of blind and partially sighted people in accessing this document. The text will be made available in full on the Department’s website. The text may be freely downloaded and translated by individuals or organisations for conversion into other accessible formats. If you have other needs in this regard please contact the Department. Department for Transport Great Minster House 33 Horseferry Road London SW1P 4DR Telephone 0300 330 3000 General enquiries https://forms.dft.gov.uk Website www.gov.uk/dft
Crown copyright 2015 Copyright in the typographical arrangement rests with the Crown. You may re-use this information (not including logos or third-party material) free of charge in any format or medium, under the terms of the Open Government Licence v3.0. To view this licence visit http://www.nationalarchives.gov.uk/doc/open-government-licence/version/3 or write to the Information Policy Team, The National Archives, Kew, London TW9 4DU, or e-mail: [email protected]. Where we have identified any third-party copyright information you will need to obtain permission from the copyright holders concerned.
3
Contents
Introduction 5
Executive summary 6
1. Background 8
2. Context: the changing media landscape 9
3. How we will work: our strategic principles 11
1. We will work in partnership 11
2. Our campaigns will be evidence based 12
3. We will evaluate our impact and continuously improve 13
4. THINK! campaigns 15
Drink driving 15
Country roads 16
Drug driving 16
Cycling 16
Motorcycling safety 17
Young drivers 17
Partner resources and social media 18
5. THINK! educational resources 19
Child car seats 19
Child and teen road safety 19
Young drivers 20
6. Owned channels, earned media and content 21
The THINK! website 21
Social media channels 22
Content 22
Earned media 22
7. Summary of activity and timings 23
What 23
When 23
Find out more 24
Other useful links 24

4
Annex A: THINK! campaign calendar 25
Annex B: campaign strategies 26
THINK! country roads communications strategy 26
THINK! cycle safety communications strategy 29
THINK! drink drive communications strategy 32
THINK! drug drive communications strategy 35
Annex C: Campaign development checklist 40
Annex D: Summary of THINK! campaign results 2014/15 and learnings 42
Country roads 42
Drug drive 45
Drink drive 47
Motorcycling 49
Cycle safety 52

5
Introduction
This document sets out how the THINK! campaign will use social marketing to support the Department for Transport’s policy goal of reducing the number of people killed and seriously injured on our roads for 2015/16 and 16/17. It also sets out our calendar of activity for the same period.
The campaigns outlined in this plan have been selected based on: size of the problem; public, policy and stakeholder concern; evidence that marketing can be effective; and potential to complement other interventions. We will work closely with policy colleagues and identify any additional areas we can help support as new policies are developed. Activity in 2016/17 is subject to the outcome of the Government spending review. As such, we may publish an updated marketing plan during 2016 to reflect changes in policy or spending plans.
This document is aimed at road safety partners and stakeholders and has been developed in consultation with key partners including representatives from Road Safety Great Britain, the National Police Chiefs Council and the Chief Fire Officers Association. We thank them for their input. If you have any comments or suggestions on this plan please email [email protected]

6
Executive summary
Reducing the number of road users killed and injured every year is a Government manifesto priority. Despite Great Britain having some of the safest roads in the world, in 2014, 1,775 people were killed and 192,702 were injured on our roads.
In response, the Government uses a three-pronged strategy to reduce road casualties: engineering, enforcement and education. THINK! provides road safety information and advice to road users in England & Wales as part of the education strategy, with the aim of influencing behaviour to help reduce the number of people killed and seriously injured.
How we will work: our strategic principles
When developing and delivering our campaigns, we will adhere to three key strategic principles.
1. We will work in partnership
By working in partnership we can deliver greater impact and value for money. We will involve experts and partners when developing our campaigns, plan activity to complement police enforcement activity and provide toolkits and free resources so our partners can easily support our campaigns locally. We will also aim to increase the number of commercial partners supporting the campaign.
2. We will take an evidenced based approach
As well as developing campaigns based on analysis of the casualty data, road safety literature and audience insight, we will use insights from behavioural science, apply relevant behavioural models and use a wider range of behavioural change techniques.
3. We will measure the impact of our campaigns
We will use a wider range of evaluation techniques and new technologies to better measure the impact of our campaigns. We will be transparent, publishing our results online and sharing learnings and insights with partners.
7
What we will deliver: our campaigns
Subject to Cabinet Office approval we will run four paid-for advertising campaigns in 2015/16 and 16/17:
Country Roads - we will build on the new campaign we launched in 2014, which proved to be successful in reducing drivers' entry speed into bends.
Drink Driving - we are exploring whether to continue the previous 'consequences' strategy or to develop a new campaign approach.
Drug Driving - we will continue to support the new legislation with our campaign designed to increase the perceived risk of getting caught and awareness of the consequences of a drug drive conviction.
Cycling - we are exploring whether to continue to extend Transport for London's 'tips' campaign to cities outside of London or to develop an alternative approach.
We will also deliver lower cost 'earned and owned media' campaigns on:
Child and teen road safety - we will review and update our range of free child and teen road safety resources.
Young drivers - we will work with partners to identify if there is a role for THINK! to provide free resources for partners to use with young drivers as we do with under 16s.
Motorcycling - we will continue to communicate safety messages to bikers via our THINK BIKER Facebook page and will explore the potential to extend the Country Roads campaign to target motorcyclists in 2016. We will review how best to evaluate campaigns that aim to overcome the driver 'failed to look properly' problem.
Other activity
In addition, we will develop a new THINK! campaign website, consolidating content from several current sites and optimised for mobile devices. The new site will contain additional content on child car seats.
8
1. Background
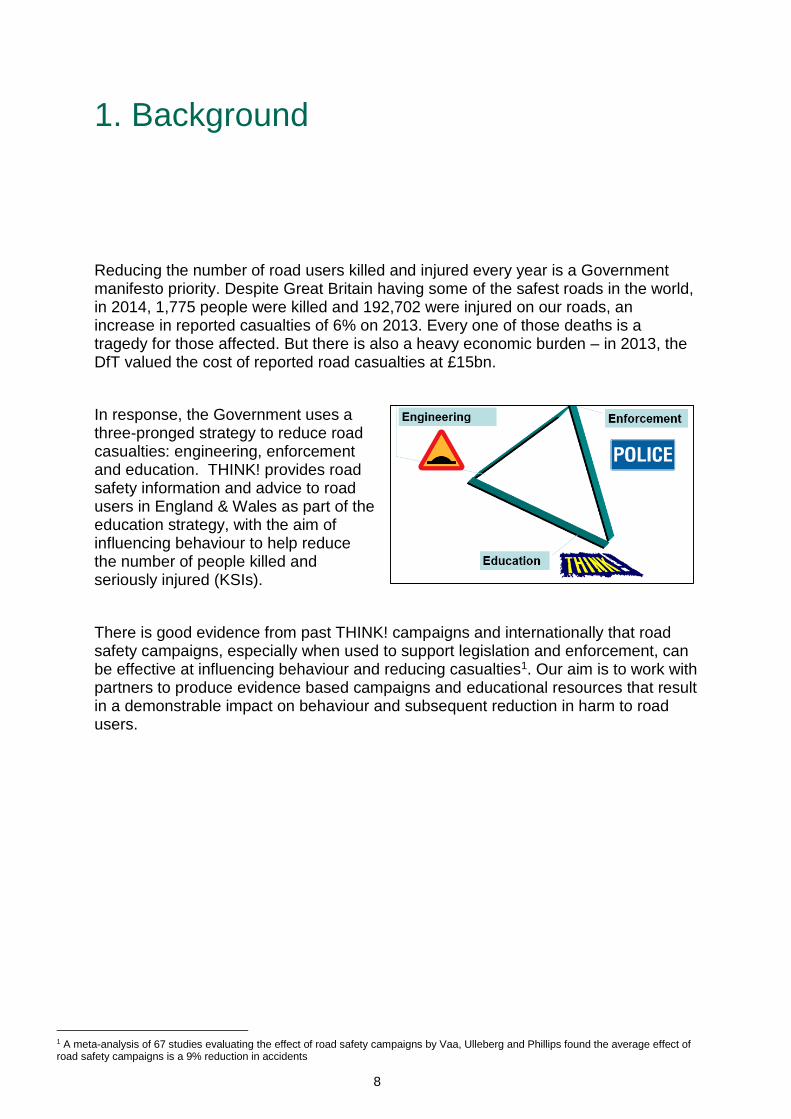
Reducing the number of road users killed and injured every year is a Government manifesto priority. Despite Great Britain having some of the safest roads in the world, in 2014, 1,775 people were killed and 192,702 were injured on our roads, an increase in reported casualties of 6% on 2013. Every one of those deaths is a tragedy for those affected. But there is also a heavy economic burden – in 2013, the DfT valued the cost of reported road casualties at £15bn.
In response, the Government uses a three-pronged strategy to reduce road casualties: engineering, enforcement and education. THINK! provides road safety information and advice to road users in England & Wales as part of the education strategy, with the aim of influencing behaviour to help reduce the number of people killed and seriously injured (KSIs).
There is good evidence from past THINK! campaigns and internationally that road safety campaigns, especially when used to support legislation and enforcement, can be effective at influencing behaviour and reducing casualties1. Our aim is to work with partners to produce evidence based campaigns and educational resources that result in a demonstrable impact on behaviour and subsequent reduction in harm to road users.
1 A meta-analysis of 67 studies evaluating the effect of road safety campaigns by Vaa, Ulleberg and Phillips found the average effect of road safety campaigns is a 9% reduction in accidents

9
2. Context: the changing media landscape
When developing this plan we have considered the wider communications landscape in which we operate and how recent trends may impact our campaigns.
In the past, THINK! could communicate key messages across a small number of mass reach media channels. Now the media landscape is more fragmented, and we are competing in an increasingly cluttered environment for audience time and attention. The way people consume media is changing:
YouTube has a higher average monthly reach amongst 15-34s than any of the main TV channels2.
68% of the UK population now use a smartphone and 45% of YouTube views are now on a mobile device3.
For many of our audiences, social and digital channels are becoming core, significant and even majority portions of the media that they consume on a day-to-day basis. This is particularly the case amongst our youngest audiences, but is broadly true up to and including the 35-45 year old age bracket.
99% of adults multimedia task or dual screen, using two media at some point during the average week4.
Implications for THINK!:
As attention spans decrease and with more content being consumed and shared on mobile devices, we will need to create short, flexible content that grabs attention in the first few seconds and is optimised for mobile.
Our content must be relevant and reach people at the right time and in the right place. Placing messages in the right context – relevant to the behaviour we are trying to influence – not only makes it more likely our content will get noticed but can create long-term associations for change.
2 Sources: TV data: BARB Jan-Jun 2013, UK YOUTUBE BRANDING RESEARCH YouTube: ComScore VideoMetrix (Home & Work PC only), Jan-Jun 2013. Base Total Individuals 3 Google UK, Nov 2014 4 Ofcom Report 2014

10
Content must be developed specifically for the channel and audience in mind, but campaigns will still need to be integrated, ensuring messages and creative are consistent across channels and platforms.
As media channels have become more fragmented and use of digital media has grown, our campaigns have become more targeted to the most at risk audiences. We will need to ensure we monitor and maintain social unacceptability of risky behaviours amongst the wider population.
The media landscape is changing faster than ever. We will need to continually monitor trends to ensure our communications remain relevant and take advantage of new opportunities.

11
3. How we will work: our strategic principles
When developing and delivering our campaigns, we will adhere to three key strategic principles. The process of how we develop campaigns is described at annex C.
1. We will work in partnership
The success of previous THINK! campaigns is in large part due to the support of our partners. We will continue to work with a range of partners to develop and deliver campaigns, from academics, to road safety professionals, to charities, to commercial organisations.
We will involve academic experts and delivery partners in campaign development.
When we campaign on issues that contravene the law, we will work closely with the National Police Chiefs Council and the National Roads Police Intelligence Forum to coordinate timings and activity, so education and enforcement campaigns complement each other.
We will work closely with representatives from the Chief Fire Officers Association to understand how we can better work with Fire and Rescue Services that deliver road safety education initiatives.
We will give as much notice as possible to partners when campaigns will run and will keep our campaign calendar updated.
We will provide campaign toolkits and free resources to make it easy to run THINK! campaigns locally. All of our creative artwork and videos will be available to partners to download online.
We will be open and transparent, sharing evaluation results and learnings with partners.
In return, we hope that more local road safety delivery partners will use our materials – therefore complementing national activity at a local level - and keep us informed as to where and how they are using it. We also ask that partners provide feedback so we can continually improve our offer.
The THINK! brand remains well known and trusted: 75% of adults are aware of THINK! 79% of those say that they take notice when they see something from THINK! 72% say that they trust messages from THINK! THINK! Survey, August 2015

12
We will work closely with the Driving and Vehicle Standards Agency on relevant issues such as educational materials and advice for young drivers and motorcyclist training. We are working with colleagues at Highways England on how best to extend road safety messages to motorists on the strategic road network.
We will build on work to date to recruit commercial partners to support our campaigns. This is vital, because as well as extending campaign reach, and providing a trusted voice, commercial partners can provide in context incentives or ‘nudges’ to help influence behaviour. For example, current partners, Coca-Cola, provide free soft drinks for designated drivers, and Johnnie Walker reward drinkers with free or discounted journeys home, in return for taking a pledge to never drink and drive.
And finally, we will review our brand communications and explore how we can better engage members of the public to play an active part in road safety and share road safety messages and content with their peers. Through this approach we can deliver new efficiencies in our communications in terms of both campaign awareness and persuasiveness (based on the theory that people are more likely to change their own behaviour if they see that people around them are themselves embracing better habits).
2. Our campaigns will be evidence based
As well as developing campaigns based on analysis of the casualty data, road safety literature and audience insight, we will use insights from behavioural science and apply relevant behavioural models. We will consider a wide range of behavioural change techniques when designing campaigns. For example, as well as informing
road users of the consequences of a behaviour, and arousing an emotional reaction to persuade them to behave in a certain way, we may ask for their commitment through a pledge, provide social proof of the majority/influencers adopting positive behaviour, or through partners provide incentives and rewards for good behaviour.
Case study: Coca-Cola Designated Driver Campaign In 2014 THINK! partnered with Coca-Cola to deliver
the annual ‘Designated Driver’ campaign for the seventh consecutive year. This campaign provided drivers with a buy-one-get-one-free offer on Coca-Cola drinks in 12,500 venues nationwide and provided a positive, in-context solution to help drivers to make the right decision to not drink and drive.
13
3. We will evaluate our impact and continuously improve
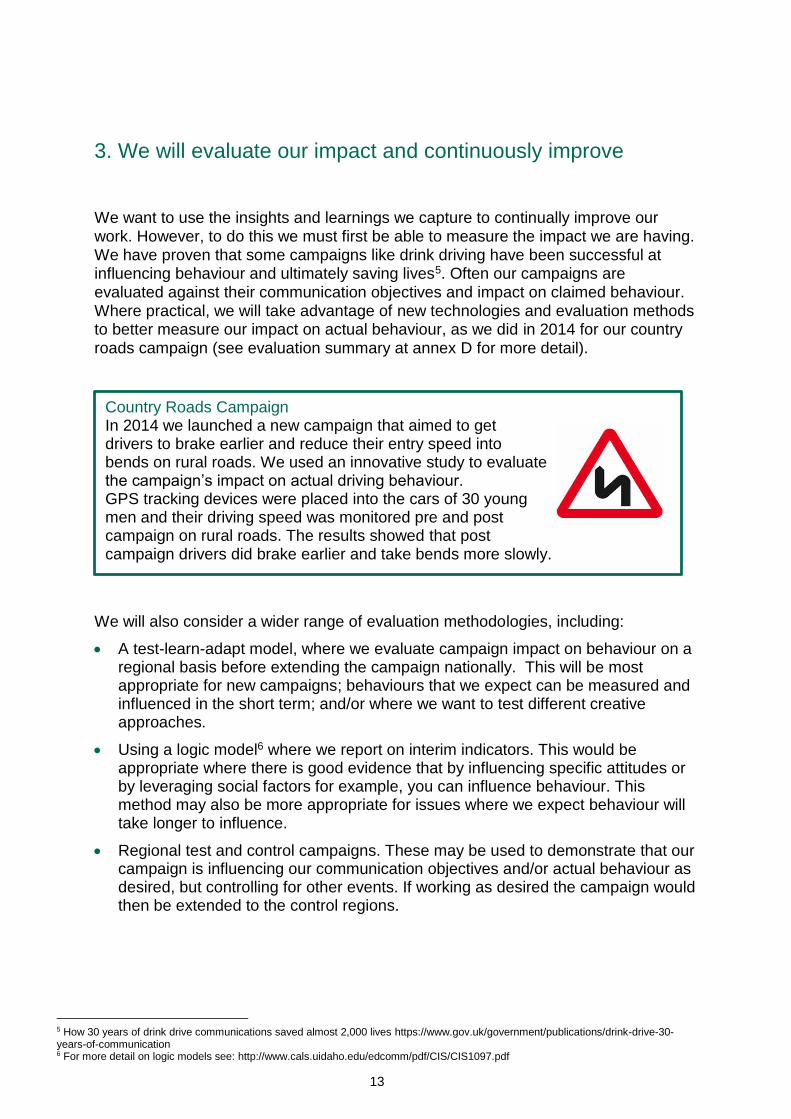
We want to use the insights and learnings we capture to continually improve our work. However, to do this we must first be able to measure the impact we are having. We have proven that some campaigns like drink driving have been successful at influencing behaviour and ultimately saving lives5. Often our campaigns are evaluated against their communication objectives and impact on claimed behaviour. Where practical, we will take advantage of new technologies and evaluation methods to better measure our impact on actual behaviour, as we did in 2014 for our country roads campaign (see evaluation summary at annex D for more detail).
We will also consider a wider range of evaluation methodologies, including:
A test-learn-adapt model, where we evaluate campaign impact on behaviour on a regional basis before extending the campaign nationally. This will be most appropriate for new campaigns; behaviours that we expect can be measured and influenced in the short term; and/or where we want to test different creative approaches.
Using a logic model6 where we report on interim indicators. This would be appropriate where there is good evidence that by influencing specific attitudes or by leveraging social factors for example, you can influence behaviour. This method may also be more appropriate for issues where we expect behaviour will take longer to influence.
Regional test and control campaigns. These may be used to demonstrate that our campaign is influencing our communication objectives and/or actual behaviour as desired, but controlling for other events. If working as desired the campaign would then be extended to the control regions.
5 How 30 years of drink drive communications saved almost 2,000 lives https://www.gov.uk/government/publications/drink-drive-30-years-of-communication 6 For more detail on logic models see: http://www.cals.uidaho.edu/edcomm/pdf/CIS/CIS1097.pdf
Country Roads Campaign In 2014 we launched a new campaign that aimed to get drivers to brake earlier and reduce their entry speed into bends on rural roads. We used an innovative study to evaluate the campaign’s impact on actual driving behaviour. GPS tracking devices were placed into the cars of 30 young men and their driving speed was monitored pre and post campaign on rural roads. The results showed that post campaign drivers did brake earlier and take bends more slowly.
14
We will explore the use of regional test and control trials which clearly offer the potential to better understand the impact we are having. However there are challenges that need to be investigated further so we understand how to best implement these and for which issues they are most appropriate. We would consider factors which may have an impact on having a ‘clean’ control group, whether they may be exposed to messaging which cannot be controlled (e.g. PR and social media activity), the potential for overlap into the control region and whether the media strategy necessary to target a particular region would replicate a likely strategy in a national campaign.
As well as sharing our evaluation results and learnings with road safety professionals
we will also publish more academic papers to be peer reviewed as we are doing with the country roads campaign.

15
4. THINK! campaigns
Working with partners, in early 2015 we shortlisted 8 potential campaign issues: child road safety, country roads, cycling, drink driving, drug driving, mobile phones, motorcycle safety, and young
drivers. With limited resource we cannot campaign on every issue and still maintain impact. So we have used the criteria to the right to refine them to a final four. These four issues will be our focus for paid-for media campaigns in 2015/16 and 16/17.
Drink driving
Despite the success in reducing drink driving, in 2013 (the most recent year for which we have confirmed statistics) there were still 240 fatalities where a driver was over the drink drive limit, 14% of all fatalities. With new drivers qualifying every day, it is essential to ensure drink drive messages continue to be heard and that social unacceptability is reinforced. There is strong evidence that communication campaigns influence behaviour. Our econometric model estimates that over 30 years the campaign saved nearly 2,000 lives and prevented more than 10,000 serious injuries7.
Since 2007 the campaign has aimed to increase the salience of the consequences of a drink drive conviction. We will review whether this is still the best approach and if appropriate develop a new campaign strategy.
7 How 30 years of drink drive communications saved almost 2,000 lives https://www.gov.uk/government/publications/drink-drive-30-years-of-communication

16
Country roads
340 people were killed and 2,548 were seriously injured in accidents on bends on rural roads in 2013. We will build on the new campaign we developed in 2014 which has already seen some promising results. Using GPS devices we were able to show that the campaign achieved its aim of getting drivers to brake earlier and take bends on rural roads more slowly.
Drug driving
In March 2015 the drug driving law changed to make it easier for the police to catch and convict drug drivers. It is now an offence to drive with certain drugs above a specified level in your blood. We will continue to support this new legislation with our campaign to raise awareness of the offence, increase the perceived risk of getting caught and raise awareness of the consequences if convicted of drug driving.
Cycling
Cyclist serious injuries have risen in recent years and cyclist safety is a Government manifesto priority. In recent years we have worked with Transport for London to extend their 'tips' campaign to cities outside of London. We will review activity to date and decide whether to continue this approach or develop an alternative.

17
You can see when each campaign is planned in the campaign calendar at annex A. The strategy for each campaign is detailed in annex B. When delivering these we will use the evaluation results and learnings from last year’s campaigns which are summarised at annex D. Note all campaign spend is subject to approval by the Cabinet Office and so plans and timings are subject to change.
We will also deliver activity on a range of other issues including:
Motorcycling safety
Motorcyclists are disproportionately represented in the casualty statistics – they make up 1% of traffic, but 19% of fatalities. The most common contributory factor to reported accidents involving motorcyclists is drivers failing to look properly. THINK! has run campaigns reminding drivers to look out for bikers for several years and has achieved positive shifts in KPI measures (see Annex D). However, this is primarily an unconscious behaviour and so is not adequately measured through standard pre and post campaign surveys, which is the approach we have used to date.
Before we run any further national advertising campaigns we will explore whether we can use technology to measure actual behaviour (as we did for our recent Country Roads campaign) or whether it is possible to design a regional test and control trial to measure the effect on accidents. We will also explore extending the 2016/17 country roads campaign to include an execution that targets motorcyclists with a message on loss of control at bends. In the meantime, we will continue to target bikers through our THINK BIKER Facebook page (which currently has 75k likes) to encourage them to ride defensively, take further training, and wear protective clothing.
Young drivers
The THINK! campaign works best when it targets a specific behaviour and a number of recent campaigns have focussed on behaviours that are disproportionately represented amongst young drivers including drink driving, drug driving and accidents on rural roads involving inappropriate speed. We are also exploring the potential to develop content and educational resources targeted to pre/young drivers
(see following section on THINK! education materials).

18
Partner resources and social media
As well as delivering campaigns directly to the end audience, we also provide a range of resources available free to partners from the THINK! Shop. These cover a wide range of issues including: child and teen road safety, cycling, drink driving, drug driving, fatigue, horse sense, mobile phones, motorcycling, seatbelts and speed. Many of these resources were updated in 2014.
We will continue to communicate a wide range of road safety messages through our Twitter channel, @THINKgovuk and through media relations.
Some of the new posters available from the THINK! Shop
19
5. THINK! educational resources
As well as creating campaigns to deliver road safety messages directly to the public, THINK! also provides online advice and educational resources for the public, children, parents, teachers and road safety professionals.
We currently provide free child road safety resources. We will develop a more holistic education offer, delivering road safety advice for parents and their children from birth to when they begin to drive. This may include advice to parents on child car seats, resources for intermediaries to teach children road safety, interactive road safety content for children, and guidance for pre/young drivers and their parents.
Child car seats
In 2014, Good Egg found that 67% of child car seats tested were fitted incorrectly. We will create and share relevant content on the THINK! website that aims to demystify the child car seat law. We will also update our existing car seat literature.
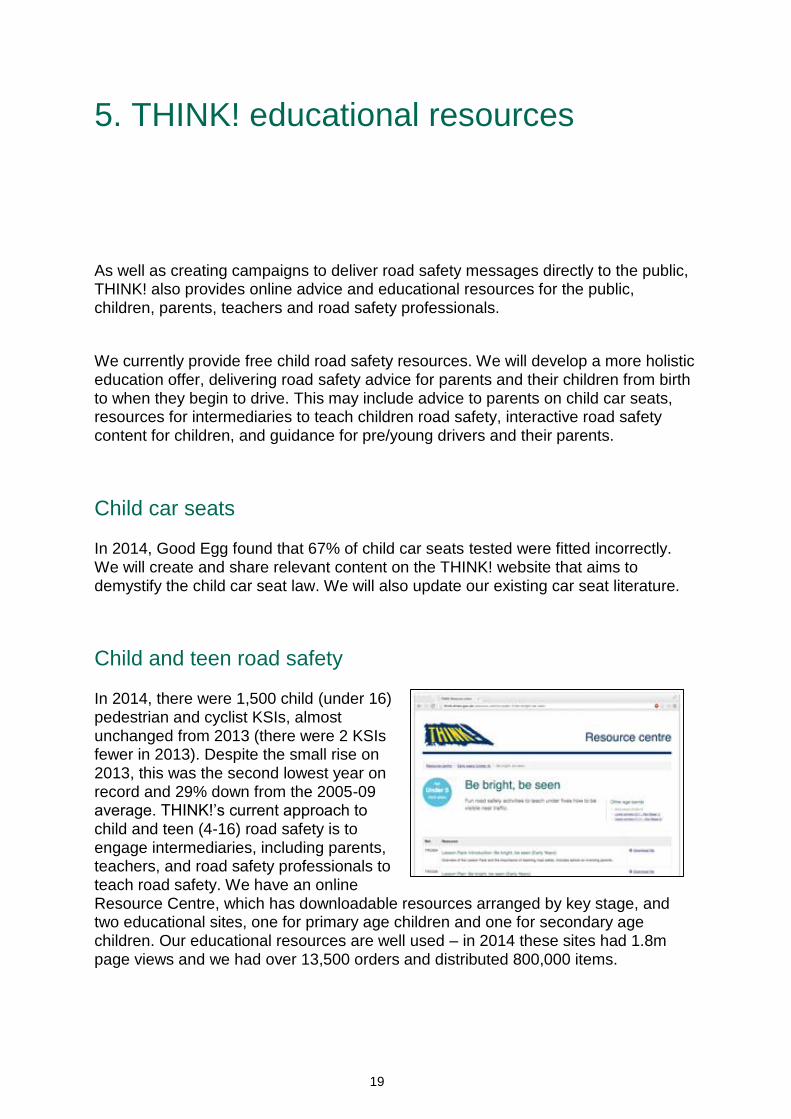
Child and teen road safety
In 2014, there were 1,500 child (under 16) pedestrian and cyclist KSIs, almost unchanged from 2013 (there were 2 KSIs fewer in 2013). Despite the small rise on 2013, this was the second lowest year on record and 29% down from the 2005-09 average. THINK!’s current approach to child and teen (4-16) road safety is to engage intermediaries, including parents, teachers, and road safety professionals to teach road safety. We have an online Resource Centre, which has downloadable resources arranged by key stage, and two educational sites, one for primary age children and one for secondary age children. Our educational resources are well used – in 2014 these sites had 1.8m page views and we had over 13,500 orders and distributed 800,000 items.

20
However, the resources and websites were created in 2009 and are now dated. A recent survey of road safety professionals who have used the resources found that 63% find the resources extremely or very useful and only 57% agree they cover all the relevant areas of road safety for children and teens. 65% of respondents agreed the materials appeal to 5-11 year olds and only 38% agree they appeal to 11-14s. We plan to set up a working group with partners to update these websites and resources, to ensure they remain relevant and engaging. As these new resources are developed we will pilot them locally to evaluate their effectiveness, using the results to refine them further, before rolling them out nationally.
We have a site that is aimed directly at primary age children, Tales of the Road, which was developed to support the previous child road safety advertising campaign. We will review whether to maintain this site or replace it with alternative content.
Young drivers
We do not currently provide online advice specifically for young drivers, rather we provide information by issue. Working with partners such as the DVSA and consulting young people and their parents we will identify whether there is a role for THINK! to provide further online advice that young people and their parents would find helpful.
We do not currently provide free educational resources to road safety professionals for use specifically with young drivers (though many of our resources will be relevant e.g. drink and drug driving materials). In the recent survey of road safety professionals who had used our educational resources, 67% said they would be likely to use THINK! young driver materials. We will work closely with policy colleagues to identify best practice materials and guidance and explore with partners whether there is a role for THINK! to host and share free young driver resources.

21
6. Owned channels, earned media and content
To support the delivery of this plan we will maximise the use of our owned channels and develop more video and visual content, and content designed specifically for social channels. To increase the efficiency of our messages we will extend
campaigns beyond the period of paid for advertising by generating more ongoing proactive media stories and sparking conversations on social media.
The THINK! website
In 2014/15 the THINK! website received over a million visitors. The website is our key channel for members of the public who want more information on any of our campaign issues, and for partners who want to download our resources. However, the content has grown across a number of sites. None of these are optimised for mobile devices, which now account for over a third of visits and is likely to grow further.
To support our campaign priorities and the development of our new educational offer, we will consolidate all relevant content on to one new website, optimised for mobile devices. This will also incorporate the current THINK! Shop so partners can download and order hard copy resources from the same site. We will also make better use of the data we capture from those who download and order materials, giving them the opportunity to opt in to relevant campaign updates via email.
Whilst developing the new site we will ensure the content meets a range of user needs and is optimised for relevant search keywords, to capture traffic from people searching for road safety advice and signpost them to the relevant content. For example drivers wanting to check what the drink drive limit is.

22
Social media channels
Twitter will remain our core social media channel to support our campaigns and communicate wider road safety messages. As of June 2015, the THINK! Twitter channel has 10,000 followers. To date we have used it mainly as a broadcast channel to share information and content with partners and road safety stakeholders. We will build on this activity to date by:
Seeking to engage more members of the public.
Encouraging action and conversation with our audiences rather than using it as a broadcast channel.
Where practical, using it to demonstrate social proof – showing others adopting positive behaviours – and reinforcing social unacceptability of risky behaviours.
As mentioned in the previous section, we will continue to use our THINK BIKER Facebook page (which has 75,000 likes) to communicate safety messages to motorcyclists. To ensure our posts have an authentic tone we will partner with bikers who can provide regular editorial and respond to comments from the community.
Content
We will develop a content strategy for each campaign that aims to target the right audience with the right content on the right platform. Based on the media landscape trends outlined in the 'Context' section and results from our own social media and campaign evaluations, we will:
Produce more content specifically designed for social media channels that gives people a reason to engage and prompts conversations, but is also integrated with the wider campaign.
Develop more visual and video content and content in ‘bite-sized’ form, reflecting the way many of our audiences now prefer to consume information.
Produce content that is easily consumed and shared on mobile devices.
Earned media
We will aim to generate a more regular flow of earned media outside of campaign periods, as well as supporting campaign launches. PR will also have an important role reinforcing social unacceptability of risky behaviours amongst the wider population and will also be used to support non priority issues, including messages for young drivers.
23
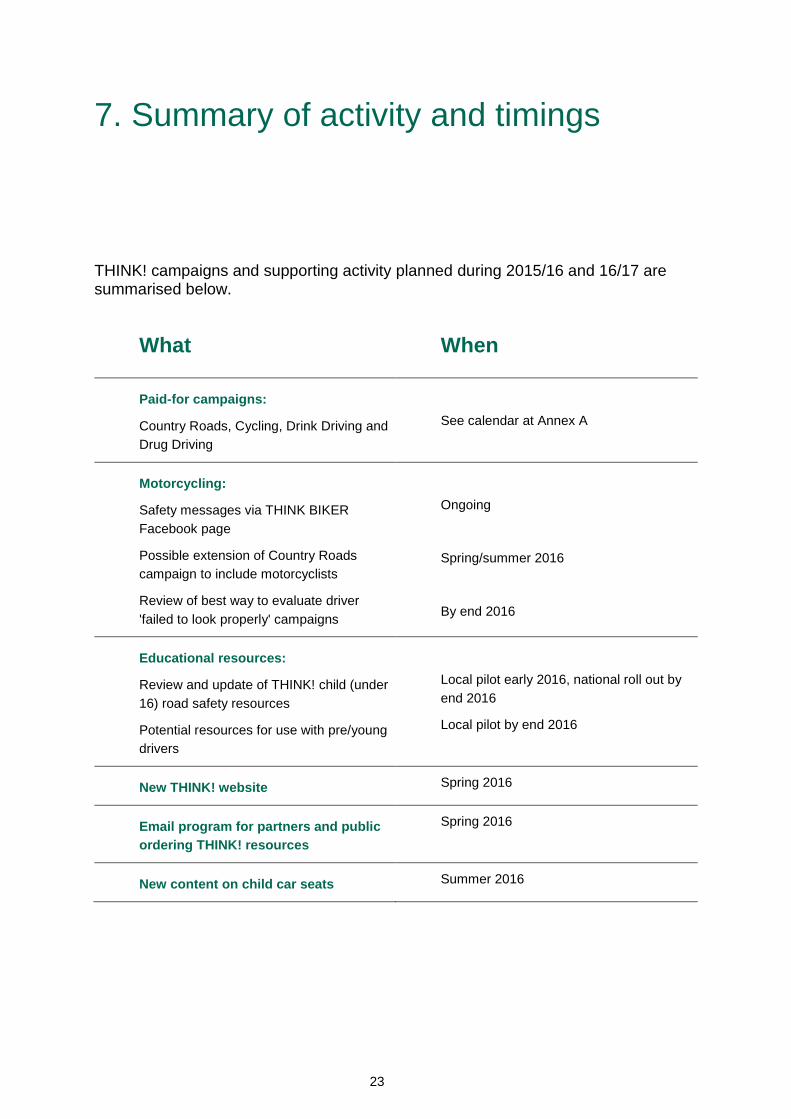
7. Summary of activity and timings
THINK! campaigns and supporting activity planned during 2015/16 and 16/17 are summarised below.
What When
Paid-for campaigns:
Country Roads, Cycling, Drink Driving and
Drug Driving
See calendar at Annex A
Motorcycling:
Safety messages via THINK BIKER
Facebook page
Possible extension of Country Roads
campaign to include motorcyclists
Review of best way to evaluate driver
'failed to look properly' campaigns
Ongoing
Spring/summer 2016
By end 2016
Educational resources:
Review and update of THINK! child (under
16) road safety resources
Potential resources for use with pre/young
drivers
Local pilot early 2016, national roll out by
end 2016
Local pilot by end 2016
New THINK! website Spring 2016
Email program for partners and public
ordering THINK! resources
Spring 2016
New content on child car seats Summer 2016

24
Find out more
To find out more about the THINK! campaign visit our stakeholder page on gov.uk or email [email protected].
Other useful links
THINK! website - http://think.direct.gov.uk/
THINK! shop (to order free resources) - http://shop.dft.gov.uk/THINKShop/
THINK! download site - https://extranet.dft.gov.uk/think-downloads/
Twitter - @THINKgovuk
YouTube - thinkuk
THINK BIKER on Facebook - facebook.com/thinkbiker
25
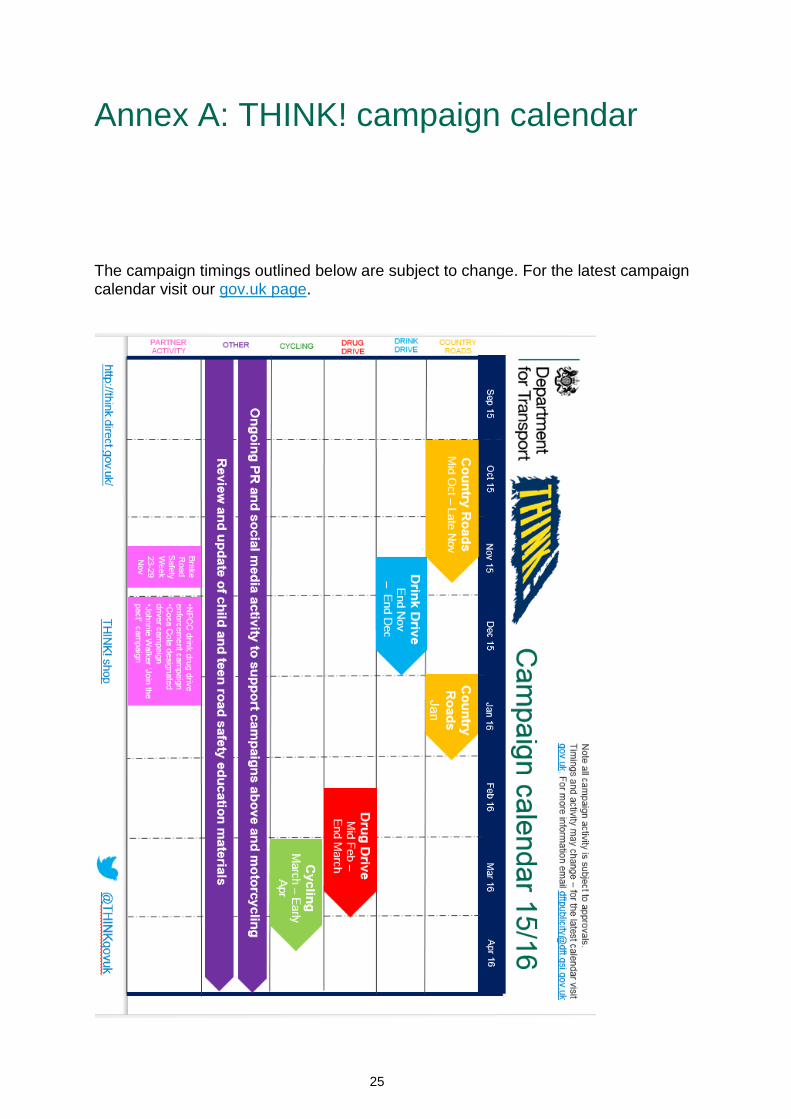
Annex A: THINK! campaign calendar
The campaign timings outlined below are subject to change. For the latest campaign calendar visit our gov.uk page.

26
Annex B: campaign strategies
THINK! country roads communications strategy
Background
60% of fatalities occur on rural roads and more fatalities occur on rural roads per mile driven, than any other road type. The biggest contributory factor to KSI accidents is loss of control, which is most often paired with inappropriate speed (driving too fast for the conditions or exceeding the speed limit). The most common manoeuvre where speed contributes to KSIs on rural roads is at bends. KSIs involving inappropriate speed are more common on single carriage rural roads than dual carriage roads and on higher speed roads.
In October 2014 we launched a new Country Roads campaign that aimed to get drivers to take bends on rural roads more slowly. Adverts ran on cinema, Youtube, online before catch up TV, radio and petrol station screens.
Objectives
Business objective:
To contribute to a reduction in the number of people killed or seriously injured on rural roads in collisions involving inappropriate speed.
Communication objectives:
To persuade drivers to brake before the bend, not on it, and to reduce their entry speed into bends on higher speed single carriage rural roads by:
Increasing knowledge and use of our key message, brake before the bend, not on it.
Increasing the salience of the potential hazards that could be around the bend on a rural road.

27
Target audiences
This is an issue that applies to all drivers, but male drivers, particularly young men, are most at risk of being involved in a KSI due to inappropriate speed.
Primary audience: 17-34 male drivers
Secondary audience: all drivers
Communication strategy
We tested a range of messages and creative ideas in focus groups with young male drivers. The proposition that resonated most was: “you have to drive more carefully on country roads because there can be unexpected hazards around the bend”. We also tested a range of tips and driving advice. Generally, the audience were not receptive to the tips, with the exception of one: ‘brake before the bend, not on it’.
This route was executed using a 3D scanning technique which enabled the viewer to see through the bends on a country road and spot the unexpected dangers ahead, reminding them that, in the real world, drivers can’t see the danger around the bend so the best action to take is to slow down by braking before the bend, not on it.
Key messages
Key messages are:
On a country road there could be an unexpected hazard just around the bend.
Give yourself time to react and stay in control – THINK! brake before the bend, not on it.
Supporting message for PR etc: country roads are more risky than you think - 60% of road fatalities occur on country roads.
Evaluation
The campaign is evaluated using a representative survey of the target audience across England and Wales to measure awareness of the campaign, and progress against campaign key performance indicators.
We used an innovative study to evaluate the campaign’s impact on actual driving behaviour. GPS tracking devices were placed into the cars of 30 young men and their driving speed was monitored pre and post campaign on rural roads. The results showed that the campaign was successful in reducing driver speed into bends:

28
Amongst those exposed to the campaign, there was a statistically significant reduction in drivers’ average entry speed into bends on rural roads of nearly 2mph.
Post campaign, drivers started decelerating earlier on most types of bends on country roads, and particularly on tighter bends.
In addition, there was a statistically significant reduction in drivers’ average speed on rural roads of 1mph.
29
THINK! cycle safety communications strategy
NB. This is the current cycle safety strategy. We are currently reviewing the strategy for 2015/16 and so this may change.
Background
In recent years, the number of cyclists who have been killed and seriously injured (KSI) have increased at a rate higher than traffic increases. In 2014 there were 113 deaths and 3,401 seriously injured pedal cyclists.
Objectives
Business objective:
To contribute to a reduction in the number of people killed or seriously injured in collisions involving cyclists.
Communications objectives:
To provide tips to cyclists to increase their knowledge and use of safe cycling behaviours.
To increase awareness amongst drivers of what they can do to be safe around cyclists.
To encourage a culture of mutual respect between cyclists and drivers.
Audiences
Drivers: male aged 16-49; commuters (urban, peak-time drivers).
Cyclists: male, aged 16-49, commuters (urban, peak-time cyclists).
Research shows8:
Drivers are generally involved in accidents involving cyclists: 87% of all cyclist reported casualties resulted from a collision with a car, with drivers failing to look properly being the most common contributory factor.
Males dominate: 68% of all motorists involved in accidents with cyclists in 2012 were male.
Casualties occur more frequently in commuting hours: 46% of cyclist KSI casualties occurred between 7-10am and 4-7pm. 70% of these occurred on Monday to Thursday.
8 and 2 Reported Road Casualties Great Britain https://www.gov.uk/government/statistics/reported-road-casualties-great-britain-annual-report-2013

30
80% of cyclist casualties are male.
81% of reported cyclist casualties occur on urban roads.
Communication strategy
The most common contributory factor to cyclist casualties involving a driver is ‘failed to look properly’. Therefore messages relating to visibility and positioning are prioritised in our campaign activity.
DfT and Transport for London (TfL) message research has shown a consistent theme around speaking to both cyclists and drivers: creating a sense of shared responsibility engages both audiences, and integrating driver and cyclist messaging communicates a fair and even-handed approach that can help reduce some of the divisiveness between road users.
The campaign media strategy aims to 'reach and remind' drivers and cyclists at the point of action when behaviour can be positively changed i.e. when they are driving or cycling. There are benefits of cyclists and drivers being exposed to the messages designed for the other group:
Drivers and cyclists see we are communicating to both groups and taking an even handed approach.
It’s important for drivers to also be aware of, and accept, appropriate cycling behaviour, for example that cyclists should ride centrally on narrow roads.
Since 2013 we have used TfL’s ‘safety tips’ creative on roadside advertising to target both cyclists and drivers. The ads use a series of practical tips to advise and remind both groups of the rules of the road and the positive actions they can take to help reduce the number of collisions on the road.
Key messages
The key messages are:
Drivers, look out for cyclists when getting out
Cyclists, ride a door’s width from parked cars
Drivers, look out for cyclists at junctions
Cyclists, ride central on narrow roads
Drivers, leave room for cyclists at traffic lights
Cyclists, always stop at red lights

31
Evaluation
The campaign is evaluated using a representative survey of the target audience across England and Wales to measure awareness of the campaign, attitudes to cycle safety and progress against campaign key performance indicators.
Campaign recognition stands at about one in four among drivers and one in three among cyclists, which is good for a campaign of this size.
Among cyclists, claimed safety-conscious behaviours have increased slightly this
year, with more reporting that they ‘ always’ give a car door’s width when passing and that they ‘always’ stop at red lights.
2013 2014 2015
Always/
Regularly
Total Always/
Regularly
Total Always/
Regularly
Total
I give at least a car door’s width when passing parked cars
37/36% 73% 40/38% 78% 46/31% 77%
I ride in the middle of the lane when cycling on narrow roads
14/15% 29% 9/18% 27% 13/19% 32%
I always stop at red lights 43/30% 73% 66/21% 87% 70/16% 86%
Claimed driving behaviours have not changed substantially year on year, although there has been an increase in the proportion reporting that they look for cyclists when opening a car door. Other KPI driving behaviours have remained stable.
2013 2014 2015
Always/
Regularly
Total Always/
Regularly
Total Always/
Regularly
Total
I give cyclists room to ride 63/30% 93% 59/33% 92% 59/33% 92%
I look out for cyclists at junctions and traffic lights
54/34% 88% 50/35% 85% 53/34% 87%
I look out for cyclists when opening my car door
42/33% 75% 43/31% 74% 46/33% 79%
I cross the line into the cyclists’ box at traffic lights (never/rarely)
n/a n/a 45/33% 78% 45/30% 75%

32
THINK! drink drive communications strategy
NB. This is the current drink drive strategy. We are currently reviewing the strategy for 2015/16 and so this may change.
Background
Drink drive casualties have been on a downward trend over the last 30 years – with the lowest number of fatalities recorded (since detailed records were kept in 1979) from 2010 to 2013.
However, drink driving is still a significant problem and accounts for 13% of fatalities on our roads. Drink driving is still regarded by the public as the most important issue to address in terms of road safety and with new drivers qualifying every day, it is essential to ensure drink drive messages continue to be heard and that social unacceptability is reinforced.
Objectives
Business objective:
To contribute to a reduction in the number of people killed or seriously injured in drink drive collisions.
Communication objectives:
Persuade drivers it’s not worth the risk of drinking before driving by increasing awareness and salience of the personal consequences of a drink drive conviction.
Maintain the social unacceptability of drink driving.
Through partners, providing in-context solutions (‘nudges’) to help drivers avoid drink driving.
Target audiences
Young men aged 17-29
Statistics show that young men aged 17-29 are disproportionally represented in drink drive accidents and failed breath tests. Additionally, approximately 350,000 young people become drivers each year. These new drivers will have been less exposed to previous campaigns and it’s vital that they’re aware of the consequences of drink driving.

33
Female drivers aged 20-39
While female drivers are far less likely to be a drink drive casualty than men9 and 82% of those convicted of drink driving are men, the conviction rate is decreasing at a slower rate for females than for males. Females aged 20-39 have the highest rate of breath test failures (amongst women).
All adults (overheard)
We continue to seek to reach a wider audience of all adults to challenge drink drivers outside of our core target audiences and reinforce the social unacceptability of drink driving amongst the law abiding majority.
Communication strategy
Since 2007 we have adopted a strategy that highlights the consequences of a drink driving conviction. This strategy is aimed at those who drive after 'a couple' (the ostrich mind-set), not drunk drivers, with a particular focus on young men aged 17 to 29 years old.
Key messages
Key messages are:
the consequences of a drink drive conviction can ruin your life: a criminal record; a heavy fine; loss of your licence/freedom; potential job loss
the only safe option is not to drink alcohol if you are planning to drive
THINK! Don’t drink and drive.
9 In 2012 around two-thirds of all drink drive casualties were men and three-quarters of drink drive KSIs were male Reported Road Casualties Great Britain 2012

34
Evaluation
The campaign is evaluated using a representative survey of the target audience across England and Wales to measure awareness of the campaign, attitudes to drink driving and progress against campaign key performance indicators.
Our most recent post campaign evaluation in 2007 showed that we have maintained the long term shifts in our key performance indicators (KPIs) amongst our primary audience of men aged 17 to 29 since we launched the current ‘consequences’ strategy in 2007:
KPI statement 2007 November 2014
Agreement it’s extremely unacceptable to drive after 2 pints 51% 56%
Agreement if I were to drink drive it’s likely I’d get caught by the police 57% 71%
Agreement it’s likely that being caught drink driving would change my lifestyle dramatically
73% 83%
Agreement if I were caught drink driving, I would get a criminal record 84% 94%
We also monitor breath test and casualty data and whilst it is difficult to isolate the effect of campaigns on casualties, we do know that the drink drive campaign is effective. Econometric analysis in 2012 estimated that in the previous 30 years the drink drive campaign had saved nearly 2,000 lives and prevented over 10,000 serious injuries, representing a value to society of £3 billion.

35
THINK! drug drive communications strategy
Background
A new drug drive law came into force in England and Wales on 2nd March 2015 making it illegal to drive if you have certain drugs above a specified level in your blood. The new offence aims to increase the effectiveness of enforcement activity, with the intention of bringing more drivers under the influence of drugs to justice, deterring driving whilst impaired through drugs and improving road safety.
The new legislation provides an opportunity to target communications to specific groups that are known to have a propensity to take drugs and drive to try to change their behaviour.
Objectives
Business objective:
To contribute to a reduction in the number of people killed or seriously injured in drug drive collisions.
Communications objectives:
To challenge and deter those that take drugs from driving, by:
─ increasing the belief that you’re likely to be caught and convicted if you drug drive;
─ increasing awareness and salience of the consequences of a drug drive conviction.
To inform and reassure users of prescription drugs who may be affected by the change.
36
Audiences
Potential drug drivers: Young men aged 17-34
Statistics10 show that this group is disproportionately represented in both drug drive accidents and in drug taking in general:
85% of accidents where drug driving was reported as a contributory factor involved male drivers.
Men are three times as likely as women to report frequent drug use in the last year (4.2% and 1.4% respectively).
63% of 16-59 year olds who reported the use of illicit drugs were aged between 16-34.
Young adults (those aged 16 to 24) are more likely to have used drugs in the last year than older adults. With 16.3% of 16-24 year olds admitting to taking illicit drugs at least once in the past year compared to 8.2% of 16-59 year olds.
The proportion of young adults aged 16 to 24 classed as frequent drug users (5.1%) was almost twice as high as the proportion of all adults aged 16 to 59 (2.8%) in 2012/13.
Prescription drug patients
The new legislation covers both illegal drugs and prescription drugs. Communications will continue to reassure those patients who may be affected by the legislation change because of the medicines they take using.
Communication strategy
The following insight was gained from strategic development research with the young male audience:
Their relationship with drugs is casual and positive and there is little consideration to the risks involved (health or legal)
Drug-taking is kept separate from their ‘normal’ life; they are aware that non-drug takers can disapprove of their behaviour and so keep their behaviour a secret from others. It is universally kept discreet from their professional lives as there is a fear that exposure will undermine their professionalism and cause negative impact and long term repercussions
Drug driving is rationalised – drug takers don’t believe their driving is significantly impaired with some believing that it can improve and ‘sharpen’ their driving ability. Consequently, drug drivers don’t think they are at risk (especially when compared to drink driving) of an accident or of being pulled over by the police.
10 All statistics are taken from the Reported Road Casualties Great Britain Annual Report: 2012 and the Crime Survey England and Wales 2010/11

37
Few believe that the police can actually identify drivers who have taken drugs. This belief is entrenched by the fact few know anyone of being stopped or prosecuted for drug driving.
There is low-level awareness of the consequences of a drug drive conviction but when made aware of examples of convictions they are shocked and concerned.
Therefore, the campaign strategy seeks to use the hook of the new legislation and increased enforcement to directly challenge drug-driver behaviour, beliefs and attitudes using the following proposition: the law has changed to clamp down on drug drivers and you are now likely to get caught.
Our strategy seeks to challenge and change the behaviour of young males by using messaging that:
informs them that the drug drive law has changed;
heightens the sense that drug drivers are now more likely to be caught and convicted;
interrupts them at key moments of decisions. For example, delivering messages that reach, remind and influence them when they’re planning and making decisions about their night out.
For the new THINK! campaign that launched in February 2015 we tested several creative routes with the target audience and selected the most effective which dramatised that a drug driver’s paranoia of being caught by the police is now a reality. The campaign film shows a young male drug driver mistaking a number of blue flashing lights on his journey, such as a flashing neon sign, for police car lights. In the final scene he’s almost home but there is another blue flashing light and this time it is the police who then pull him over. The audience thought the script was a realistic portrayal of the paranoia commonly experienced across drivers who take either cannabis or class A drugs. The script also prompted the strongest emotional response amongst the audience as they identified with the fear of being caught by the police. We produced an online film, radio, online and gaming ads as well as posters for pub and club washrooms.
Key messages
The law has changed in England and Wales and it is now illegal to drive with certain drugs above specified blood levels in the body.
The new law makes it easier for the police to catch and convict drug drivers.
Police can now test for cannabis and cocaine by the roadside using a new mobile testing device.
A drug drive conviction will have a serious effect on your life including a criminal record, a minimum 12 month driving ban and an unlimited fine and could also cost you your job.

38
Some medicines are also included in the new law. However, if you are taking medicines as directed and your driving is not impaired, then you are not breaking the law. To find out more, ask your doctor or a member of the pharmacy team.
THINK! Don’t take drugs and drive.
Evaluation
The campaign is evaluated using a representative survey of the target audience across England and Wales to measure awareness of the campaign, attitudes to drug driving and progress against campaign key performance indicators.
Our evaluation of the 2015 campaign showed that there has been some movement on our key performance indicators (KPIs) amongst our primary audience of men aged 17 to 29 and that the shifts were greater amongst those who recognised the campaign:
KPI measure Question asked Pre-campaign January 2015
Post campaign March 2015
Campaign recognition Have you seen or heard anything about taking drugs and driving recently? [yes]
57% 70%*
Have you seen any of these adverts recently?
N/A 52%
Have you seen or heard anything recently about changes to drug driving legislation?
8% 26%*
Improve beliefs around enforcement of drug driving
How likely do you think it is that someone who drives after taking recreational drugs would get stopped by the police? [very/somewhat likely]
50% 54%
[63%**]
How easy is it for police to spot a driver who has taken drugs? [very/fairy easy]
46% 41%
[47**]
If stopped, how easy is it for police to tell a driver has taken drugs? [very/somewhat easy]
76% 77%
[83%**]
If charged, how likely is it to be convicted? [very/somewhat easy]
74% 76%
[81%**]
Raise awareness of the personal consequences of a drug driving conviction
If someone were to be caught driving after taking recreational drugs, how likely do you think it would be that each of the following would happen? [lifestyle would change dramatically]
45% 51%*
* Denotes a significant increase amongst all survey respondents
**Denotes a significant increase amongst survey respondents who recognise the campaign

39
Data collection on measures that show the prevalence of actual drug driving incidents and its effect on road casualties has historically been inconsistent and unreliable. Work has been undertaken by the DfT with the police, blood testing labs and the Ministry of Justice to improve this data collection in order to measure the impact of new legislation. Accurate benchmarks for this will be set in November 2015 with a full evaluation of the new offence due in November 2016.

40
Annex C: Campaign development checklist
When developing campaigns, we use the following checklist to ensure we have addressed what we feel to be the most important considerations for a road safety campaign. For a description of how we typically develop campaigns and answer some of these questions, see the 'campaign development process' on our gov.uk page.
DEFINE THE OUTCOME
What is the problem and size of problem? When and where does it occur?
What are the behaviours that contribute to the problem?
Is it a conscious or automatic behaviour?
Which behaviours could we influence?
What impact on the problem will that have?
What is our desired outcome?
How will we measure the outcome? Can we measure actual behaviour, rather than claimed?
When do we expect to achieve the outcome? Does it require a long term shift in attitudes and social norms first or do we expect change sooner?
What resource is required?
What change will we need to make the investment worthwhile?
What other interventions (education, enforcement, engineering) are already in place and can we support them?
UNDERSTAND THE AUDIENCE
Who are our target audience?
Can we segment them? Who are they demographically? Attitudinally?
What and who are the influences on their behaviour – personal, social and environmental?
What are the benefits and barriers to them of adopting the behaviour?
Are there relevant behavioural models we can use and what do they suggest are the main determinants of the behaviour?

41
What are the relevant behavioural insights? Eg biases, heuristics
What are the key audience insights in relation to the behaviour? What is it that would make them think and feel differently?
Who are our stakeholders, and potential partners and influencers?
DESIGN THE INTERVENTION
Are communications likely to be effective at influencing behaviour?
What is our behavioural goal and do we have SMART campaign objectives?
What would be the best KPI measures for each objective?
Do we have a clear, specific call to action that the audience believe they can perform and will help?
Connect rationally – why should they listen?
Connect emotionally – what do we want them to feel?
Make it timely – can we reach them close to the point of behaviour?
Which are the most relevant behavioural change techniques for this issue? Can we make it social? Provide social proof, make a behaviour socially unacceptable, or appeal to social identity? Could we ask for their commitment? Eg take the pledge
How do we make it easy for the audience? For example, change the environment through technology, or partners who can provide ‘nudges’ or incentives.
How can we make it a habit – is there a trigger we can associate with?
How will we reinforce the change to keep it going?
TEST, LEARN AND ADAPT
Do we have good evidence for likely effectiveness?
If not, can we use a test and learn pilot or regional test/control trial?
If behaviour will take longer to influence or we can’t measure actual behaviour, can we use a logic model to evaluate progress?
How and when will we evaluate the campaign?
How and when will we share the results and learnings?
How will we use our learnings to continually improve?
This has been adapted from the Behavioural Insights Team EAST process. We also use the OASIS model on the Government Communications Network site.
42
Annex D: Summary of THINK! campaign results 2014/15 and learnings
In 2014-15 we ran two higher spend campaigns – country roads and drug drive - and three lower-spend campaigns on drink drive, cycle safety and motorcycle safety. Below is a summary of each campaign including the activities carried out, results and key learnings.
Country roads
Issue
More fatalities occur on rural roads per mile driven, than any other road type. The biggest contributory factor to KSI accidents is loss of control, which is most often paired with inappropriate speed. The most common manoeuvre where speed contributes to KSIs on rural roads is at bends.
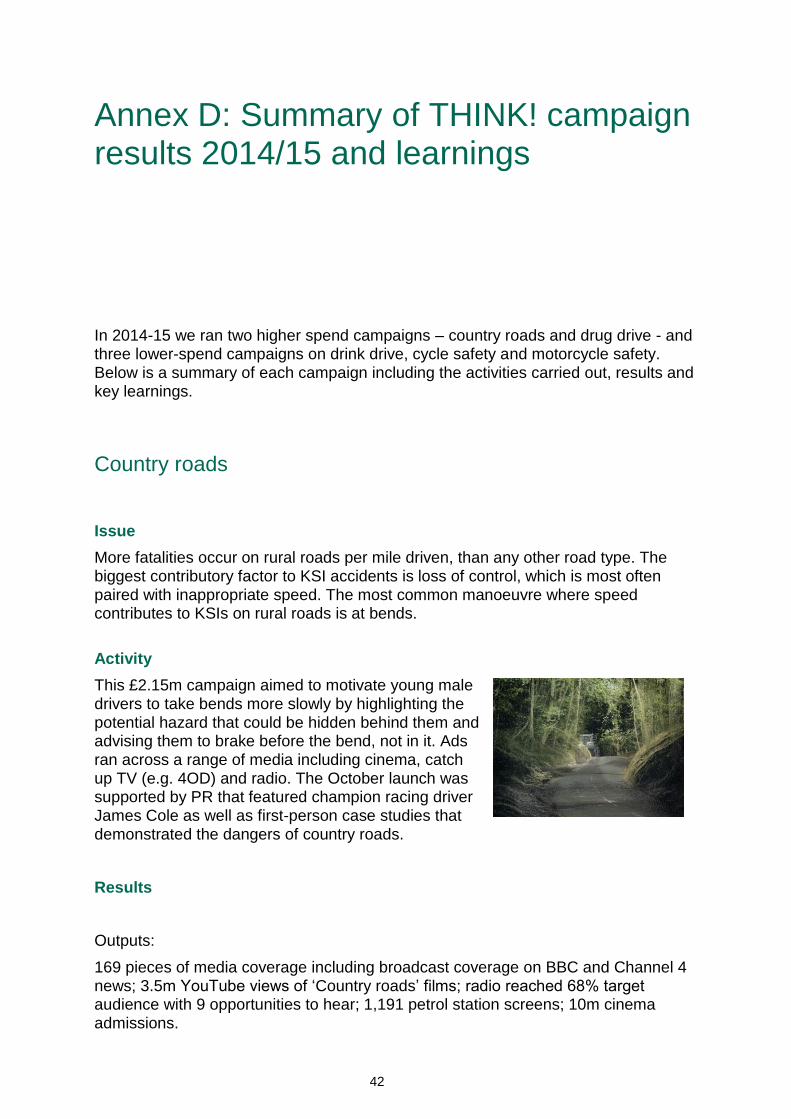
Activity
This £2.15m campaign aimed to motivate young male drivers to take bends more slowly by highlighting the potential hazard that could be hidden behind them and advising them to brake before the bend, not in it. Ads ran across a range of media including cinema, catch up TV (e.g. 4OD) and radio. The October launch was supported by PR that featured champion racing driver James Cole as well as first-person case studies that
demonstrated the dangers of country roads.
Results
Outputs:
169 pieces of media coverage including broadcast coverage on BBC and Channel 4 news; 3.5m YouTube views of ‘Country roads’ films; radio reached 68% target audience with 9 opportunities to hear; 1,191 petrol station screens; 10m cinema admissions.

43
Out-takes:
45% of the target audience recognised at least one of the ads.
There was greater awareness amongst the target post campaign that they don’t always drive in the way they should. For example agreement they rarely drive at a speed that allows them to stop in the distance they can see to be clear increased from 10% to 17%. Agreement they occasionally approach a bend too fast increased from 33% to 42%.
34% of drivers said the ads would make them reduce their speed on country roads.
Outcomes:
We used an innovative study to evaluate the campaign’s impact on actual driving behaviour. GPS tracking devices were placed into the cars of 30 young men and their driving speed was monitored pre and post campaign on rural roads. The results showed that the campaign was successful in reducing driver speed into bends:
Post campaign, there was a statistically significant reduction in drivers’ average speed going into bends on rural roads of nearly 2mph.
Drivers started decelerating earlier on most types of bends on country roads, and particularly on tighter bends, during post campaign monitoring.
In addition, there was a statistically significant reduction in drivers’ average speed on rural roads of 1mph.
The study examined weather conditions and time of day as factors that may impact driving behaviour. When driving behaviour was analysed by day and night time hours, it was evident that, regardless of time of day, average speed on rural roads was lower in the post phase compared to the pre phase. The same result was observed when analysing weather conditions – average speed on wet and dry roads was significantly slower in the post phase, suggesting the overall results were not skewed by any differences in driving conditions in the post phase.
We do not know the impact the campaign had on KSIs, but there is strong evidence of a clear relationship between speed and risk: as average traffic speed reduces so
does the likelihood of a crash resulting in injury that is recorded by the police. If a crash does happen, the risk of death and serious injury is higher at higher speeds. Taylor (2002)11 estimated that an average 1 mile per hour reduction in speed on higher speed rural roads would result in 3% fewer accidents.
11 Taylor et. al (2002), “The effects of drivers’ speed on the frequency of road accidents”; TRL Report 421

44
Key insights/learnings
For the level of spend, campaign awareness and recognition on Video on Demand and cinema was low. Future campaigns will need to build on this by maximising reach and frequency of message.
We identified one specific behavioural goal and developed a behavioural study to measure that actual behaviour (rather than just claimed). This proved a successful approach and is something we will seek to adopt again in future.
The campaign achieved changes in actual driving behaviour despite achieving only small changes in attitudes amongst the target audience. This demonstrates that it’s not always necessary to change attitudes before changing behaviour and that, for some behaviours, it is possible to change behaviour with one campaign burst (though we don’t know how long the change in behaviour was maintained for – this will be a focus for future evaluation studies).
Click here to view the full campaign evaluation results on our gov.uk page.

45
Drug drive
Issue
New legislation came into force in England and Wales on 2nd March 2015 making it illegal to drive with certain drugs above specified blood levels in the body.
Activity
This £2m campaign supported the law change by informing an ‘all adult’ audience about the new law and its consequences using PR and local press ads. In addition, we targeted those
most likely to drug drive (young males aged 17-34) to challenge and deter them from drug driving by increasing the belief that they’re now more likely to be caught and convicted. We created ads for YouTube, radio and websites using a ‘paranoia’ theme to demonstrate that the fear of being caught by the police is now a reality. To try to improve the effectiveness of our evaluation we ran our first ‘test and control’ trial by running paid-for activity targeting our young male audience in all regions in England and Wales except the North East and South West.
Results
Outputs:
446 pieces of PR coverage; 7m YouTube views of ‘Paranoia’ film; radio reached 61% of the target audience with 18 opportunities to hear; 600 pubs and clubs displayed posters in washrooms.
Out-takes:
Campaign recognition was good with 52% of the target audience recognising at least one of the ads and 26% having ‘seen or heard anything recently about changes to drug driving legislation’ (increased from 8% pre-campaign)
Awareness of the personal consequences of drug driving increased significantly from 45% pre- to 51% post-campaign.
Those who recognised at least one element of the campaign were significantly more confident that the police can identify and convict drug drivers:
63% of recognisers agreed they would be likely to get stopped vs 45% of non-recognisers;
83% of recognisers agreed its easy for the police to tell if a driver has taken drugs once stopped vs 71% of non-recognisers; and
81% of recognisers agreed its likely they would be convicted once charged compared with 71% of non-recognisers.

46
Outcomes:
We will monitor long term trends in self-reported behaviour and KSIs to assess the effectiveness of the policy, enforcement and communications.
Key insights/learnings
Perhaps because of the large amount of PR coverage we found that recognition of the campaign advertising was high in the control as well as test regions, therefore it was not a useful comparison. Test and control campaigns will be more useful when they do not coincide with national media coverage.
Although the consequences of being stopped for drug driving were found credible, many still have some doubt about the ease with which the police can spot drug drivers on the road. A more explicit ‘mechanism’ for identifying drug drivers on the road could help strengthen the credibility of enforcement claims. We know from our research that the roadside test is a powerful disincentive to drug drive, so it could be a greater focus in future activity.
People worry more about the practical consequences of drug driving, but there is some evidence that social costs are also important so we could consider highlighting more directly the social impact of being caught drug driving.
The majority of drug drivers are driving on cannabis (it’s also seen as more acceptable than driving after taking class A drugs) so we will consider emphasising cannabis specifically in future communications to make it more relevant to the target.
Click here to view the full campaign evaluation results on our gov.uk page.

47
Drink drive
Issue
Drink driving still accounts for 13% of all fatalities on our roads and remains the public’s number one road safety issue to address.
Activity
To ensure drink drive messages continue to be heard and that social unacceptability is reinforced we used a combination of paid for media, PR and partnership activities throughout the year with a budget of £230,000. The most significant activity marked the 50th anniversary of the first drink drive public information film with a new online film and supporting PR campaign which launched in November 2014.
Results
’50 years’ outputs:
221 pieces of PR coverage; 952,500 YouTube views of ‘50 years’ film (including over 400k organic views); 18,000 organic Twitter engagements (clicks, favourites, retweets, comments).
Partnerships:
In December we partnered with Diageo’s Johnny Walker brand and their ‘Join the pact’ campaign. Fronted by Formula One stars including Jenson Button, the campaign encouraged people to make a pledge to not drink and drive and in return gave away free rides with taxi app Uber. The activity was promoted using national outdoor and online advertising and PR worth £224,000.
We continued our partnership with Coca-Cola to deliver the annual ‘Designated Driver’ campaign – a soft drink promotion in 12,500 venues nationwide with in-venue promotion worth £400,000.

48
Out-takes
The campaign has achieved significant shifts in KPI measures since the launch of the current strategy. However, we have seen a decline in some KPIs this year (though they are still up since the start of the current strategy:
Respondents Pre-
2007
Aug-13 Apr-14 Nov-14 Change
since pre-2007 (% pts)
Unacceptability of driving after drinking 2 pints
Men aged 17 - 29
Extremely unacceptable
51% 62% 63% 56% +5 ppts
If I were to drink and drive I would be likely to get caught by the police
Male drivers (aged up to 29) who drink alcohol & 17-year-old male drivers.
Agreeing
57% 74% 67% 71% +14 ppts
Likely that being caught drink driving would change my lifestyle dramatically
Male drivers (aged up to 29) who drink alcohol
Agreeing
73% 89% 85% 83% +10 ppts
If I were caught drink driving, I would get a criminal record
Male drivers (aged up to 29) who drink alcohol
Agreeing it is likely
84% 95% 93% 94% +10 ppts
Outcomes:
We monitor trends in self-reported behaviour, the breath test failure rate and KSIs which have all declined since 2007. In 2012 we commissioned an independent agency who used econometrics to estimate that over 30 years the campaign has saved almost 2000 lives and prevented over 10,000 serious injuries.
Key learnings
There is some evidence that KPI measures of social unacceptability of drink driving and consideration of the consequences of a drink drive conviction have stabilised.
A number of learnings are summarised in the paper: 'How 30 years of drink drive communications saved almost 2,000 lives'.
49
Motorcycling
Issue
Per mile travelled, motorcyclists are the most at risk road user group. In 2013, over 5,000 motorcyclists were killed or seriously injured.
Activity
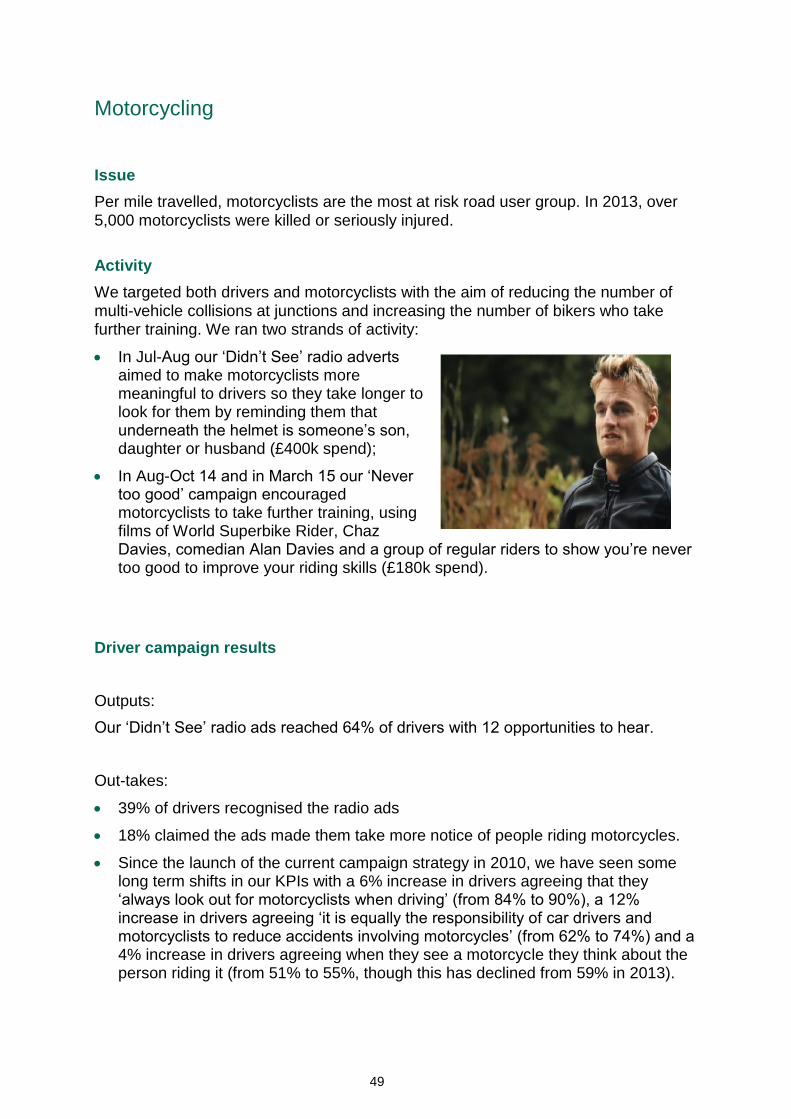
We targeted both drivers and motorcyclists with the aim of reducing the number of multi-vehicle collisions at junctions and increasing the number of bikers who take further training. We ran two strands of activity:
In Jul-Aug our ‘Didn’t See’ radio adverts aimed to make motorcyclists more meaningful to drivers so they take longer to look for them by reminding them that underneath the helmet is someone’s son, daughter or husband (£400k spend);
In Aug-Oct 14 and in March 15 our ‘Never too good’ campaign encouraged motorcyclists to take further training, using films of World Superbike Rider, Chaz Davies, comedian Alan Davies and a group of regular riders to show you’re never too good to improve your riding skills (£180k spend).
Driver campaign results
Outputs:
Our ‘Didn’t See’ radio ads reached 64% of drivers with 12 opportunities to hear.
Out-takes:
39% of drivers recognised the radio ads
18% claimed the ads made them take more notice of people riding motorcycles.
Since the launch of the current campaign strategy in 2010, we have seen some long term shifts in our KPIs with a 6% increase in drivers agreeing that they ‘always look out for motorcyclists when driving’ (from 84% to 90%), a 12% increase in drivers agreeing ‘it is equally the responsibility of car drivers and motorcyclists to reduce accidents involving motorcycles’ (from 62% to 74%) and a 4% increase in drivers agreeing when they see a motorcycle they think about the person riding it (from 51% to 55%, though this has declined from 59% in 2013).

50
KPI statement February 2010 May 2013 July 2014
“I always look out for motorcyclists when driving”
84%
90%
90%
“It is equally the responsibility of car drivers and motorcyclists to reduce accidents involving motorcycles”
62%
72%
74%
“When I see a motorcycle I think about the person riding it” (agree strongly or slightly)
51%
59%
55%
Key learnings:
The behaviour we are aiming to change amongst drivers (looking properly for bikes) is difficult to accurately capture through surveys as it is an automatic behaviour and as such drivers may not even be aware of whether they are looking for bikes. We will explore alternative methods of evaluating actual behaviour change (eg simulators, eye tracking studies and test and control trials) to better measure effectiveness.
Rider campaign results
Outputs:
450,000 YouTube views of ‘Never Too Good’; 260,000 Facebook engagements.
Out-takes:
19% of motorcyclists recognised ‘Never too Good’ - good for a low spend digital campaign
Campaign recognisers were significantly more likely to strongly agree that no matter how good or experienced you are, there is always more to learn about riding (62% vs 55%).
Amongst campaign recognisers, 43% claimed to have signed up to further training as a result of seeing the campaign.
Outcomes:
Over the autumn and spring bursts there were 100 registrations for the IAM’s Skills for Life course using the THINK discount code and 3 sign-ups for the RoSPA Advanced Riding Test. There may have been sign ups to BikeSafe, the Enhanced Rider Scheme and local training providers, however we were unable to track these.

51
Key learnings:
As expected, timing is crucial for encouraging bikers to sign up to further training. There were 3 times as many registrations with training providers using the THINK discount code in spring than in the autumn.
Findings from research, comments on our Facebook page and evaluation results demonstrate that, on the whole, bikers are aware of further training and already hold positive attitudes towards further training. The challenge is to get bikers to believe that they would personally benefit from it and to overcome inertia. Any future campaigns to encourage bikers to take further training should:
─ Make it relevant - demonstrate the benefits that training can have, even for the most experienced riders.
─ Make it attractive - demonstrate that taking advanced training is not arduous nor boring and provide incentives such as discounts on training and insurance to overcome inertia.
─ Make it social – show other bikers like them completing training.
─ Make it easy - if possible, work with and promote local training providers to help riders identify training courses near them.
Click here to view the full campaign evaluation results on our gov.uk page.

52
Cycle safety
Issue
In recent years, cycling KSIs have increased at a rate higher than traffic increases. Although in 2013 cyclist KSIs fell compared to 2012, there were still 3,252 KSIs.
Activity
In March we ran a £300,000 campaign in 12 cities in England where KSIs are highest outside of London. We used Transport for London’s ‘safety tips’ roadside advertising to target both cyclists and drivers using a series of practical tips to advise and remind both groups of the rules of the road and the positive actions they can take to help reduce the number of collisions on the road. We also developed a new partnership with Sky, who funded an out-of-home cycle safety campaign in Manchester in November.
Results
Outputs:
The roadside posters had a national reach of 3.8m adults with 17 opportunities to see.
Out-takes:
Campaign recognition is higher for cyclists than for drivers and good for a campaign of this size with 18% of drivers and 24% of cyclists recognising the campaign.
Claimed driving behaviours have not changed substantially year on year, although there has been an increase in the proportion reporting that they look for cyclists when opening a car door.
Among cyclists, claimed safety-conscious behaviours have increased slightly this year, with more reporting that they ‘always’ give a car door’s width when passing (increase from 74% to 79%).

53
Driver KPIs
2013 2014 2015
Always/
Regularly
Total Always/
Regularly
Total Always/
Regularly
Total
I give cyclists room to ride 63/30% 93% 59/33% 92% 59/33% 92%
I look out for cyclists at junctions and traffic lights
54/34% 88% 50/35% 85% 53/34% 87%
I look out for cyclists when opening my car door
42/33% 75% 43/31% 74% 46/33% 79%
I cross the line into the cyclists’ box at traffic lights (never/rarely)
n/a n/a 45/33% 78% 45/30% 75%
Cyclist KPIs
2013 2014 2015
Always/
Regularly
Total Always/
Regularly
Total Always/
Regularly
Total
I give at least a car door’s width when passing parked cars
37/36% 73% 40/38% 78% 46/31% 77%
I ride in the middle of the lane when cycling on narrow roads
14/15% 29% 9/18% 27% 13/19% 32%
I always stop at red lights 43/30% 73% 66/21% 87% 70/16% 86%
Key learnings:
There is still relatively limited knowledge about appropriate positioning relative to HGVs which could be included as a message in further campaigns.
People who are aware of safe cycling behaviours do not always follow them so a more emotive call to action alongside safety messaging could have greater impact.
There have been no significant shifts in driver knowledge or attitudes (which are already at a high level). As the tips for drivers aren’t ‘new news’ a more emotive approach may be more appropriate.
Click here to view the full campaign evaluation results on our gov.uk page.