thetechnicalreport:ananalysisof ...six generally accepted and recently published writing and editing...
TRANSCRIPT

I/#Jd7-_-24/2_
NASA Technical Memorandum84260
NASA-TM-84260 19820019311
TheTechnicalReport:AnAnalysisofInformationDesignand Packagingfor an InelasticMarket
Thomas E. Pinelli, Robert McCullough, andVirginia M. Cordle
,, ',__.; i#,?,_.[.ANGLFv :."-ST;D,n'.i C,'-NTER
HALIPTON, VIRS_i'_IA
IW ANational Aeronautics andSpaceAdministration
https://ntrs.nasa.gov/search.jsp?R=19820019311 2020-03-17T05:11:06+00:00Z


NASA Technical Memorandum 84260
TheTechnicalReport:AnAnalysisofInformationDesignand Packagingfor an InelasticMarketThomas E. Pinelli, Ames ResearchCenter, Moffett Field, CaliforniaRobert McCullough, Old Dominion University, Norfolk, VirginiaVirginia M. Cordle, College of William and Mary, Williamsburg, Virginia
NASANationalAeronauticsandSpace Administration
Ames ResearchCenterMoffett Field.California 94035
_Y2---,_z/27_-_-

TABLE OF CONTENTS
Page
LIST OF TABLES ............................ iv
LIST OF FIGURES ........................... v
SUMMARY ............................... 1
INTRODUCTION ............................. 2
RELATED RESEARCH AND LITERATURE 2
RESEARCH PROCEDURES . . ........... ............. 3
Technical Report Analysis .................... 3
Sequential Components ...................... 3
Language Components ....................... 4
Presentation Components ..................... 4
FINDINGS ............................... 5
Sequential Components ...................... 5
Language Components ....................... 9
Presentation Components ..................... 12
RECO_IENDATIONS FOR CHANGE ................. ..... 18
CONCLUDINGRE_RKS .......................... 20
REFERENCES .............................. 22
APPENDIX 26
iii

LIST.OF TABLES
Table Page
A Summary of Sequential Components............... . . 6'
B Components Included by Half or More of Each Source . . .. _ . 7 _
C Readability Results ...................... :9
D Use of Person and Voice by Survey Reports ..... ..... i0
E Preferred Data Points and Data Paths ....... . . ; .... II
F Line Length as a Function of Type Size for Single-Column Survey Documents ................... 12
G Literature Recommendations for Character Count PerLine . 13
II Average Typography Characteristics of Survey Documents IWhich Scored as Most and Least Legible After Degradation . 18
iv

LIST OF FIGURES
Figure Page
1 Percent of survey documents with visualsintegrated in text ...................... 8
2 Use of solidus and fractional exponents indisplayed mathematics of survey documents .......... 14
3 Percent of survey reports in which headings werethe same type size, style, and weight as the text ...... 15
Use of capitals compared with upper and lower casetype for headings in the survey reports ........... 15
5 Orientation of tables and figures in the surveyreports .......................... 16
6 .Bindingmethods used for the survey documents ........ 17
v


THE TECHNICAL REPORT: AN ANALYSIS OF INFORMATIONDESIGN AND PACKAGING FOR AN INELASTIC MARKET
by
Thomas E. Pinelli Robert McCullough Virginia M. CordleNASA Ames Research Center Old Dominion University College of William and MaryMoffett Field, CA 94035 Norfolk, VA 23508 Williamsburg, VA 23185
p
SU_RY
Economists measure how responsive or sensitive consumers are to change in the
price of a product by the concept of elasticity. The demand for some products issuch that consumers are relatively responsive to price changes; price changes giverise to very considerable changes in the quantity purchased. The demand for suchproducts is said to be elastic. For other products, consumers are relatively unre-sponsive to price changes; that is, price changes result in modest changes in theamount purchased. In such cases demand is inelastio (McConnell, 1978).
The demand for scientific and technical information (STI) is considered to be
inelastic because up to a certain point the consumer will continue to try to obtainthe information regardless of moderate increases in cost, either in terms of realdollars or in terms of effort/time required to make the acquisition. On the otherhand, the demand for such specific information products as the technical report isconsidered to be elastic because as cost, either in terms of real dollars or interms of effort/time required to make the acquisition increases, the informationconsumer is likely to substitute another STI product such as a journal, book, con-ference/meeting paper, or preprint, assuming the desired information can be foundin an alternate product. However, when the desired information is available fromonly one product, demand becomes inelastic.
For many R&D agencies of the federal government, including the NationalAeronautics and Space Administration (NASA), the technical report constitutes allinformation product, a primary means of communicating the results of research tothe user (Stohrer and Pinelli, 1981). Studies of STI usage among engineers andscientists indicate varying amounts of use for the technical report (COSATI, 1968).The technical report was preferred by applied technologists while theoreticalscientists preferred the refereed journal. Between these two extremes exists whatis referred to as the "marginal" user, the engineer or scientist who makes occa-sional or moderate use of technical reports.
As part of an evaluation of the NASA STI program, a review and analysis of thetechnical report was conducted. The results, which are contained in NASA TechnicalMemorandum 83269 (McCullough, Pinelli, et al., 1982), will be used by NASA to eval-uate the current design and packaging of its technical reports. This paper high-lights the results of the study and focuses on improving the utility of thetechnical report by marginal users.

INTRODUCTION
The technical report serves as a primary means of communicating the resultsof NASA's research. Consequently, NASA technical reports must be organized andwritten to accomplish effective communication. NASA employs uniform publicationsstandards which are designed to ensure clarity, quality, and utility of its tech-nical reports. These standards include a basic report format which defines thereport's components and establishes their sequence. The standards address, in alimited sense, language (verbal and visual) and presentation (typography, graphicdesign, and physical media) components. To date, these standards have not beenexamined to determine the extent to which they contribute to the effectiveness ofthe NASA technical report as a product for information dissemination. However,
there are no generally accepted standards against which NASA publications standardsfor technical reports could be compared.
The survey and analysis of the technical report involved comparing and con-trasting NASA's publications standards for technical report preparation with currentusage and practices for technical report preparation, prescriptive standards andcriteria for technical reports, and experimental/theoretical findings from theliterature specifically concerned with the organization, the language, and thepresentation components of the technical report. Current usage and practices weredetermined by systematically analyzing technical reports and related materialobtained from a survey of technical report producers. Prescriptive standards andcriteria were obtained from a review of style manuals, publications guides, andtextbooks concerning technical writing and editing, verbal and visual presentation;and typography, graphic design, and physical media. Experimental/theoreticalfindings were obtained from a survey of the literature. Manual and machine-readabledata bases including Defense Technical Information Center (DTIC), EducationalResources Information Center (ERIC), Library and Information Science Abstracts(LISA), National Technical Information Service (NTIS), and NASA's Remote Console(RECON) were searchedto obtain the experimental/theoretical findings.
RELATED RESEARCH AND LITERATURE
• The historical developments of technical report literature have been presentedby Tallman (1962), Boylan (1970), and Auger (1975). The complexity of technicalreport literature has been described by several authors (Wright, 1963 and Ilartas,1966). Studies by Earle and Vickery (1969) and by Coile (1969) determined the useof technical reports as citations in scientific and technical publications such asbooks, periodicals, and monographs. Wilson (1958), Fuccillo (1967), and Randall(1959) conducted separate studies to determine the half-life of technical reports.The SATCOM Committee (National Academy of Sciences, National Academy of Engineering,1969) and the report of the Weinberg Panel (Executive Office of the President, 1963)were concerned with the structure, organization, and transfer of scientific andtechnical information and the role of the technical report within an STI system.
Perhaps the largest and most comprehensive studies devoted to the technical reportwere conducted by the American Psychological Association (Garvey and Griffith, 1965)and a COSATI Task Group (1968) under the direction of Sidney Passman. Very littledefinitive research on the technical report has been conducted since the early1970's.

The technical report was shown to possess characteristics which make it uniqueas a medium for information transfer. As an information product the report has beencriticized and praised. Critics charge that the technical report does not meet therigors or criteria established for scientific journal publication. Lack of screen-ing or peer review was the characteristic listed most frequently as a major weak-ness. Proponents saw merit in such features of the technical report as timeliness,comprehensive treatment, and inclusion of ancillary information. Notwithstandingthe controversy over its status, the technical report was shown to constitute animportant vehicle for disseminating the results of research. Both the technicalreport and the scientific journal played distinct roles in the communication ofscientific and technical information (COSATI, 1958).
Three studies which utilized feedback from users of NASA STI were conducted to
help evaluate the NASA STI program (Monge, 1978; Pinelli, 1980; and Pinelli, 1981).This feedback indicated that NASA technical reports were being used and that the
perceived prestige of NASA technical reports was high. Specific concerns of theusers included consistency in terms of adherence to NASA publications standards, thetype of binding used for certain NASA technical reports, detailed summaries andabstracts, development of conclusions, relating the results to previous and/orexisting work, absence of grids on graphs, insufficient tabular data, and the exclu-sion of negative data.
RESEARCH PROCEDURES
The complete research procedure for the review and analysis is contained inNASA Technical Memorandum 83269. An abbreviated procedure is presented for theanalysis of the technical reports and related materials, the sequential components,the language components, and the presentation components.
Technical Report Analysis
A sample frame was established to survey and analyze technical reports. Themembership of the Society for Technical Communication (STC) and institutions/organizations on NASA's automatic distribution list for technical publications wereused for this purpose. Each member of the sample frame was requested to provide(I) copies of technical reports produced by their organization/institution forexternal distribution, (2) copies of in-house style manuals and publications/productions guides, and (3) information concerning the use of commercially availablestyle manuals and publications guides. The documents received were classified intopredetermined categories. Data were extracted and recorded onto eight data cards.
Sequential Components
From an analysis of 99 reports, an exhaustive list of structural componentsfor report organization was prepared. The position of each component was compiled.Six generally accepted and recently published writing and editing textbooks wereconsulted to determine their recommendations for report organization. Four stylemanuals and two publications guides used by the survey respondents were analyzed toproduce a listing of structural components for report organization. The standardsfor report preparation contained in the NASA Publications Manual were comparedand contrasted with the data from the survey, the data compiled from the writingand editing textbooks, and with the recommendations of the style manuals and

publications guides. A suggested outline for report components indicating bothplacement as front, body, or back matter, and ordering within these divisions wasprepared. This outline is included as an appendix. The extent to which tables andfigures were integrated into the text was calculated.
Language Components
Three readability tests were used to measure thereadability of the surveyreports. One hundred word samples were used and, whenever possible, samples weretaken from the summary, the text, the headings, and the captions of the reports.The voice (active or passive) and person (first, second, and third) were alsodetermined and recorded for all summary and text samples from the survey reportsand the sample NASA report on which readability tests were run. The results werecompared with the prescriptive standards/criteria and experimental findings.
Three mathematical style books were consulted to determine general standardsagainst which the guidelines in the NASA Publications Manual and actual usage inthe sample NASA report were compared. The survey reports were analyzed for thepresence or absence of mathematical material in text and/or in display; but noobservations were made concerning punctuation or breaking of equations. For visuallanguage components, the total number of tables and figures in each survey reportwere counted. Figure-to-page ratios and table-to-page ratios were prepared. Thedata were compared with the prescriptive standards/criteria and experimental/theoretical findings from the literature and with the guidelines set forth in theNASA Publications Manual.
Presentation Components
The typographical aspects of three report elements were considered. Theexperimental/theoretical findings were used to develop minimum and maximum accept-able limits for type size, line length, number of characters per line, and linelength for a given type size. These parameters, as they appeared in the surveyresults, the NASA sample report, and the guidelines set forth in theNASAPublications Manual, were compared with the limits of acceptability developed fromthe experimental/theoretical findings. _
Nine aspects of graphic design Were tabulated, calculated, and analyzed forthe survey reports. These data were compared with the guidelines contained in theNASA Publications Manual and with the experimental/theoretical findings fromltheliterature. The type of paper used in the survey reports was identified. The typeof binding used for the survey reports was also recorded. NASA guidelines for thepreparation of copy for microfiche were examinedrelative to other literaturerecommendations for documents which will be re-imaged. All physical media_consider-ations (paper, type of binding, and guidelines for microfiche) were compared withthe NASA publications guidelines, the practice in the sample NASA r_port, and withthe experimental/theoretical findings from the literature.
4

FINDINGS
The results of the review and analysis were compiled and presented accordingto the sequential, language, and presentation components of a technical report.The data are discussed in terms of their relationship to the NASA publicationsstandards for technical reports as contained in the NASA Publications Manual - 1974.
Sequential Components
The survey reports showed wide variation in the number, kind, and placement ofsequential components. The 99 reports surveyed used 96 different components. Onlyfive components (cover, title page, table of contents, introduction, and appendixes)were common to half or more of the reports; however, strong agreement (82 percent ormore) existed in regard to placement of these five components as front, body, orback matter.
The six style manuals and publications guides were not unified in the numberof names of components recommended for inclusion in technical reports (see Table A).While 16 of 24 components were recommended by a majority of these sources, unanimousagreement for inclusion existed for only two components: the introduction and theappendixes. The publications guides were even more divided in the recommendedsequence of the report components. Actual usage as determined by the analysis pro-vided the most variance in terms of numbers, locations, and descriptions of reportcomponents.
The three sources used in the sequential components portion of the study(survey reports, style manuals and publications guides, and textbooks) were comparedto produce a list of components recommended for inclusion by 50 percent or more ofany of the three sources. This comparison, shown in Table B, is presented to indi-cate whether each source, as a consensus, advocated that a particular componentshould be included as a structural component of a technical report. Componentsrecommended by NASA are included for comparison. The survey reports representedthe limiting factor in that, as shown previously, only five components were commonto more than half of the reports. Considering only the textbooks and style manuals,agreement existed on 12 components: the cover, title page, abstract, contents, listof figures/illustrations, list of symbols, introduction, body (text), bibliography,references, appendix, and glossary. The NASA Publications Manual discussed I0 ofthese 12, omitting only the list of figures, illustrations, and the glossary.
5

TABLE A
Summary of Sequential Components
o.
Style manualsand
publications SurveyComponent guides Textbooks sample NASA
. (n:6) _ (n:6) (n=99)
Cover .50 _83 .68 x
Title page .83 1.00 .73 _xForeword .50 .17 .19 xPreface .83 .33 .24 x
Acknowledgement .33 --- .24Letter of transmittal .17 1.00 ---Contents .83 1.00 .71 x
List of figures/illustrations .83 1.00 .39
List of tables . .67 .33 .30 •Listof symbols and/orabbreviations .50 .83 .18 x
Glossary .83 .33 .23Abstract .50 1.00 .39 xIntroduction 1.00 I_00 .58 x
Body _ .67 .83 .35 xMethod .17 --- .22Results (Data) .33 --- .27 xDiscussion .17 .50 .ll xConclusions .33 .83 .31 xRecommendations .33 .67 .07
References .83 .50 .39 xAppendix 1.00: 1.00 .60 _ xIndex .83 --- .23
Bibliography -_ ;50 __ .83 _ ." .iS xSummary --.17 ° : .50 .30 x
Style manuals--American Psychological Association, Chicago Hanual of Style,NationaY Academy of Sciences, and U.S. Geological Survey
Publications manuals--American National Standards Institute and Committee onScientific and Technical Information
Textbooks--Houp & Pearsall; Lannon; Oliu, Brusaw & Alfred; Mathes & Stevenson;Mills & Walters, and Pauley

TABLE B
Components Included by Half or More of Each Source
Source
Included by Listed byComponent Included by a Included by
majority of half or more of half or more of NASAsurvey reports style manuals textbooks Publications
and guides Manual
Cover Yes Yes Yes YesMemo/Letter of No No Yes No
transmittal
Title l,age Yes Yes Yes YesAbstract No Yes Yes YesContents Yes Yes Yes Yes
List of figures/ No Yes Yes Noillustrations
List of symbols No Yes Yes YesIntroduction Yes Yes Yes YesSummary No No Yes YesConclusions No No Yes YesRecommendations No No Yes NoBody (Text) No Yes Yes YesDiscussion No No Yes YesBibliography No Yes Yes YesReferences No Yes Yes YesAppendix Yes Yes Yes YesForeword No Yes No NoPreface No Yes No YesList of tables No Yes No No
Glossary No Yes Yes NoIndex No Yes No No
The NASA Publications Manual agreed with the survey reports in both inclusionand placement of the five components for which a consensus existed. NASA includedall three components (title page, introduction, and appendixes) recommended unani-mously by the style manuals/publications guides. Of the 16 components recommendedby half or more of these sources, II were mentioned by the NASA standards. The five
not included _ere the foreword, list of tables, list of illustrations/figures,glossary, and index. The NASA Publications Manual included five of the six compo-nents recommended by all the textbooks (title page, abstract, contents, appendix,and introduction) and 13 of the 17 components mentioned by three or more of the sixtextbooks. Components omitted by NASA were the memo/letter of transmittal, list ofillustrations/figures, recommendations, and glossary.

NASA's guidelines compared favorably, in general, with the survey usage and therecommendations of the style manuals/publications guides and textbooks where a con-sensus existed. However, no one recognized structure for the sequential componentsof technical reports was found to-exist. This lack of a single agreed-upon organi-zation is probably due to the wide variations in the content, purpose, and disci-pline of technical reports and to the varied audiences to which they are directed.Components present in areport, particularly in the body or:text, will also be _•affected by the nature of thereport--whether it is informative, analytical, orassertive.
The majority of the prescriptive Sources and the experimental/theoreticalfindings recommended that figures and tables be integrated into the text.Eighty-two percent of the survey reports integrated both figures and tables withthe text as illustrated in Figure I. The NASA Publications Manual (p. 17-18, 37-38)stated that where practical, tables and figures were preferably placed in the bodyof the report as soon as possible after mention in the text;•however, when visualswere of such volume that insertion in the text would impair readability, they shouldbe placed in the back matter,following the appendixes and references. The sampleNASA report did not contain any tables. Figures were grouped in the back matter ofthe report.
• .
u) " ' Figurei Tables . . .
, 80 k
o
" . REPORT CATEGORY , ,. :
" Figure i.- Percent of survey documents with visuals integrated in text
-: . ,.
8
Language Components
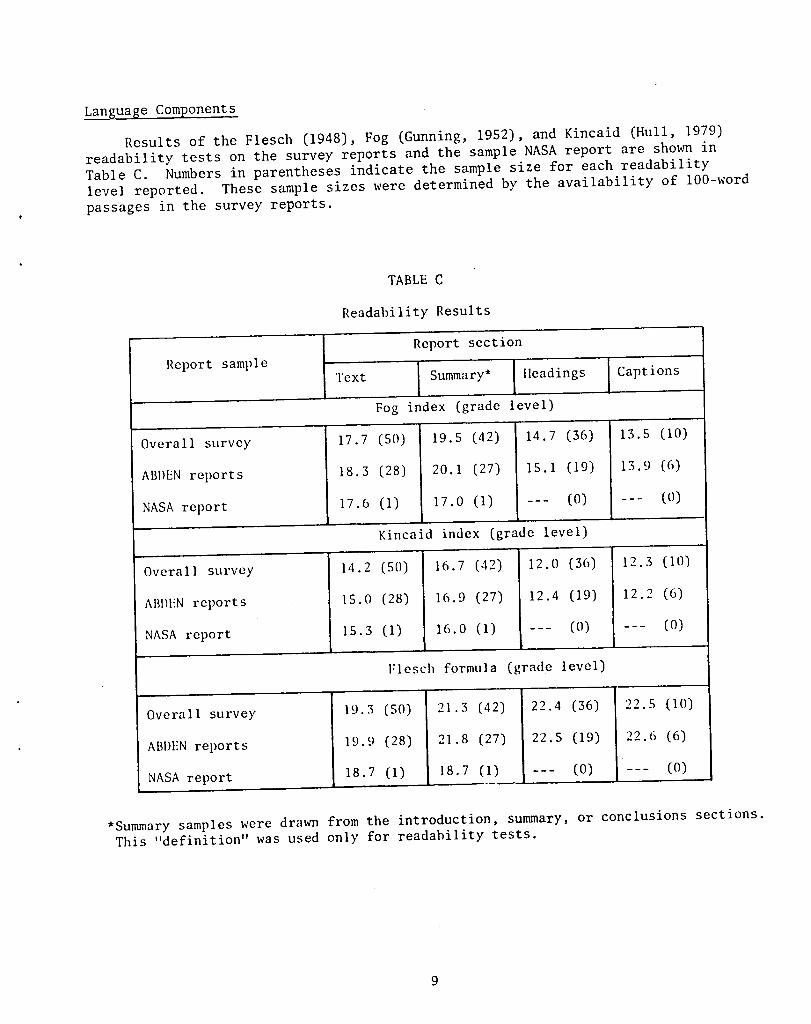
Results of the Flesch (1948), Fog (Gunning, 1952), and Kincaid (Hull, 1979)readability tests on the survey reports and the sample NASA report are shown inTable C. Numbers in parentheses indicate the sample size for each readabilitylevel reported. These sample sizes were determined by the availability of 100-word
, passages in the survey reports.
TABLE C
Readability Results
Report sectionf_eportsample
Text Summary* Headings Captions
Fog index (grade level)
Overall survey 17.7 (SO) 19.5 (42) 14.7 (36) 13.5 (I0)
ABDEN reports 18.3 (28) 20.I (27) 15.1 (19) 13.9 (6)
NASA report 17.6 (i) 17.0 (15 --- (0) --- (0)
Kincaid index (grade level)
Overall survey 14.2 (SO) 16.7 (42) 12.0 (36) 12.3 (If))
ABIH!Nreports IS.0 (28) ]6.9 (27) 12.4 (19) 12.2 (65
NASA report 15.3 (I) 16.0 (I) --- (0) (0)
1:leschformula (grade level)
Overall survey 19.3 (50) 21.3 (42) 22.4 (365 22.5 (105
ABI)ENreports 19.9 (28) 21.8 (27) 22.5 (19) 22.6 (6)
NASA report 18.7 (1) 18.7 (I) --- (05 --- (05
*Summary samples were drawn from the introduction, summary, or conclusions sections.This "definition" was used only for readability tests.

The average readability scores of the survey documents ranged from grade 14 tograde 19 for the text and grade 17 to grade 21 for the summary section. Headingsand captions scored between grade 12 and grade 15 on the Fog and Kincaid indexes.The text and summary of the NASA report fell within the ranges Scored by the surveydocuments. Survey publications on NASA-related subject areas (ABDEN) scored asmore difficult than the overall survey. The NASA sample report generally scored aseasier to read (lower grade level) than the ABDEN reports. The levels obtainedexperimentally (14 to 19) for the texts of survey and NASA reports agreed fairlywell with the general level of grade 16--college graduate--reported in the litera-ture for scientific material. Summaries tested as somewhat higher--grades 17 to 21.
The data extracted from survey reports concerning use of person and voice aregiven in Table D. As can be noted, there was a strong tendency toward use of thethird person in the text material (88 percent of reports) and in the summarymaterial (95 percent of reports). The passive voice was used more often than theactive voice in both text and summary sections. In the texts, 56 percent of thereports used the passive voice exclusively, 38 percent used the active voiceexclusively, and 6 percent used both voices. No data were obtained on the use ofperson or voice in headings and captions.
TABLE D
Use of Person and Voice by Survey Reports
Person (No. reports using} Voice (No. reports using)Report section .,.
Ist. 2nd. 3rd. Varied Active Passive Both
Text (n = 50) 2 2 44 2 19 28 3
Summary (n = 42) 1 0 40 1 18 23 . 1
In the past, a strong tradition existed for use of the passive voice in scien-tific and technical literature. This is no longer true as was evident from a reviewof the technical writing/editing textbooks, style manuals, and publications manualspreviously cited in Table A, and other literature sources (e.g., Strunk and Whlte,1978; Stanley, 1975; and IIolloway,1974). A very strong consensus of currentthinking indicated that active voice should be used whenever possible because itis usually more direct, natural, and concise. The active voice was favored overthe passive voice whenever verbs concern the interaction of inanimate objects and/orthe writer wanted to emphasize who or what performed the action. The passive voicewas recommended when the writer wanted to emphasize the receiver of the actionrather than the doer.
The textbooks, style manuals, and publications guides were more divided on thequestion of person. Most did not treat the subject of person. The PublicationManual of the American Psychological Association (1974) indicated that experiencedwriters can use first person without sacrificing objectivity or dominating thecommunication. (These are the usual arguments against use of the personal pronouns
I0

"I" and "we.") On the other hand, Pauley (1979) stated that the use of first andsecond persons should be avoided, and Mills and Walter (1978) advocated avoidingfirst person or using it only sparingly.
The sample NASA report used third person, passive voice in both text andsummary sections. The NASA Publications Manual 1974 did not discuss person orvoice. However, the current practice in editing branches of the Agency is toencourage use of the active voice whenever possible, while recognizing that thenature of scientific and technical material makes the use of the passive voicenecessary or preferable in certain situations. Current NASA practice in regardto person is that third person is preferred, but first person is permitted if theauthor prefers this form.
The maximum number of data paths plotted on one figure ranged from one to tenfor the survey documents, with a median value of four and a mean value of five.The corresponding figure for the sample NASA report was eight. NASA guidelines didnot set a maximum number, but eight types of lines (data paths) were presented andan order recommended for their introduction in figures. Literature sources andmean usage in the survey tended to limit multiple plots on a single figure to alower number than NASA usage (see Table E).
Literature recommendations varied regarding symbols for data points and datapaths in multiple plots on single figures. No data were obtained from the surveydocuments on this subject. The first three data-point symbols recommended by theNASA Publications Manual agreed with those of llarvill(1977), but NASA suggestedvarying data paths, while llarvillused a straight line for all paths.
TABLE E
Preferred Data Points and Data Paths
SOURCE DATA POINTS DATA PATHS
HARVILL O
(1977) 0
SCHUTZ "f" !
(1961, II) 0 0
NASA O{1974) D
I><>(Y0,0
o
<30
11

Presentation Components
Table F contains the results of the analysis of line lengths of survey docu-ments as a function of type size. The mean and median values for all type sizeswere above the ranges recommended by Arnold (1972, p. 84-85) and Burt (1959,p. 13-14). The sample NASA report used ll-point type. Its 41-pica longest lineexceeded the maximum acceptable length recommendations of Arnold and Burt, and itwas also above the mean and median values for survey documents which used ll-pointtype. NASA guidelines did not discuss iine length in terms of type size.
TABLE F
Line Length as a Function of Type Size for Single-Column Survey Documents
Type size No. of Mean Median Range(1)oints) documents longest-line longest-line longest-line
(picas) (picas) (picas)
9 7 39 39 36 43
lO 17 38 37 34 - 42
iI 12 37 38 27 - 42
13 l 39 --
Recommendations from the literature on minimum, maximum, and optimum charactercounts per line are listed in Table G. All were directed toward general literaturerather than scientific/technical documents in particular. Taking the lowest andhighest values cited by any sources gives a "most lenient" acceptable range of 50to 80 characters per line.
The 37 single-column survey documents had a mean count of 74 characters perline and a median value of 72 characters per line. Individual values ranged from58 to ii0 characters per line. No documents were below the minimum limit of 50
characters per line established from Table G. Eight reports, or 28 percent ofthe one-column publications were above the upper limit of 80 characters per line.No statistics were prepared on the character counts of multi-column publications.
TileNASA sample report had an average of 84 characters per line and thuswas above the upper limit of 80 characters per line obtained from the literature.The sample NASA report was also above the mean and median values for the survey.The NASA guidelines did not treat the subject of character count.
Spencer (1969, p. 35) explained the underlying basis of the need for linelength and character count limits. Short lines tend to increase the number offixation pauses the eye must make, while long lines tend to increase the number ofregressions the eye must make. Both situations decrease reading speed and increaseerrors in comprehension.
12

TABLE G
Literature Recommendations for Character Count Per Line
No. of characters per line ReferenceMinimum Optimum Maximum
50 55-60 70 Lee (1965, p. 98)
54 60 Dowding (1957, p. 6)
55 80 *Burt (1959, p. 13-14)
-- 60-70 -- Morison (1951, p. 9)
-- 60-70 -- Spencer (1969, 11. 35)
*Experimen1:al findings
The major cause of wlrying leading within a report is the presence of stackedfractions in the text. Literature sources (Strawhorn, 1978, p. 1.4.5.1; Chaundy,1954, p. 27; and Swanson, 1971, p. 16) recommended that mathematics in text shouldbe linear. Chaundy (1954, p. 26) stated that linear arrangements of mathematicsare more legible, and research by Tinker (1926, p. 465) confirmed this opinion.
a
Stacked fractions of the form _ can be expressed linearly as a/b by use of
the solidus (/) or as ab-I by use of the negative exponent (Swanson, 1971, p. 16;Chaundy, 1954, p. 26-27; and William Byrd Press, 1954, p. 32, 35).
Swanson (1971, p. 24)stated that radical signs should be avoided wheneverpossible. She aridChaundy (1954, p. 29) advocated substitution of fractionalexponents in the form aI/n for roots of any power.
Seventy-six percent of the survey publications containing mathematics in thetext used the solidus to eliminate stacked fractions. No roots of any form werelocated in the textual passages of these publications; therefore, it was not possi-ble to assess the usage of fractional exponents to replace radicals in the text.
Oxford University (Chaundy, 1954, p. 29) and the American MathematicalSociety (Swanson, 1971, p. 16) recommended that the solidus, negative exponents,and fractional exponents be used in displayed mathematics as well as mathematicsin the text to replace fractions and roots.
Figure 2 shows the percentages of survey documents which used the solidus andfractional exponents in displayed mathematics. Almost half (45 percent) used thesolidus; 35 percent used fractional exponents. A majority of reports publishedby government agencies and of ABDEN reports employed both conventions.
13

o
#
REPORTCATEGORY
Figure 2. Use of solidus and fractional exponents in displayedmathematics of survey documents
The solidus was not used to replace stacked fractions in the NASA sample reportalthough stacked fractions were present both in text and in display. The NASAI'ublications Manual 1974 did not include any references to use of the solidus,negative exponents, or fractional exponents for mathematical expressions either intext or in display. The sampie NASA report did not contain any roots; therefore,use of fractional exponents to replace radicals in text or display could not beassessed. No data were collected on the use of negative exponents in the survey orin the sample NASA report.
The majority of the overall survey and all categories except technical manualsand reports published by industrial organizations used the same type size, style,and weight for headings as was used for the text. Figure 3 illustrates the datatabulated for this parameter.. It is most likely that reports using the same typefor text and headings were prepared by some type of "strike-on" typesetting system(typewriter, word processor, computer wheel, or chain printer). Technical manualsand reports from industry tended to use more sophisticated t_ographic techniques.NASA employed a "strike-on" composing system for the sample report.
Shown in Figure 4 is the percentage use of all capitals versus upper and lowercase type for all heading levels in the survey. The ratio of all capitals to upperand lower ca_e was highest in the first level of headings and decreased stepwise inthe second and third heading levels. This trend was present in the overall surveyand in all document categories. No clear tendency was observed for the fourth andfifth heading levels. Seventy-five percent of the survey used all capitals forfirst level headings, and fifty percent used all capitals for second level headings.
14

100
9O
8OZ'" 70
(.)o 60r_LI.o 50uJ
<_ 40Zw 30
UJ0- 20
10
o
o _.. _,
REPORTCATEGORY
Figure 3. Percent of survey reports in which headings were the same typesize, style, and weight as the text
100! I I CAPITALS901 _ UPPERANDLOWERCASE
:
80€/3
z'" 70=£
-- _ 60_0
_ 5ow
< 40Z
_ 3oa. 20
10
0
HEADINGLEVEL
Figure 4. Use of capitals compared with upper and lower casetype for headings in the survey reports
15

Literature sources (e.g., Harvill, 1977, p. 17) strongly advocated thatfigures and tables be aligned with the text so that the reader does not have _orotate the publication to use them. Hartley (1974, p. 20) and Strawhorn (1978,p. 1.3.5.2) stated that if there are a large number of tables and figures and itis not feasible to reduce them to fit the page, it may be preferable to alter theformat and orientation of the entire publication.
Analysis of the survey showed that these recommendations were not observed inpractice. The majority of the survey publications contained one or more tables crfigures placed perpendicular to the rest of the text (see Figure 5). This observa-tion held true for all survey categories except technical manuals and reports fromindustry. All government publications had at least one visual placed sideways.Only once had a report format been altered to accommodate oversized tabular materialwhile maintaining text and table alignment.
I---3 ALL VISUALS ALIGNED WITH TEXT
100 _ ONE OR MORE VISUALS NOTALIGNED WITH TEXT
90 n
Figure 3. Orientation o£ tables and figures in the survey reports
16

The frequency of use of various methods to bind survey documents is illus-trated in Figure 6. For the survey as a whole, perfect binding was used most often(28 percent of publications), followed by saddle stitching (22 percent), and side-wire stitching (20 percent). All perfect bound documents used hot melt or glue;none were sewn. The most noticeable trend was the frequent use of ring binders for
technical manuals (50 percent of category).
Many of the same factors that apply to normal typographic considerations o£legibility are also factors which govern how well a recopied document can be read.llawken (1966, p. 30, 34-35, 83) mentioned type size, brightness, height of thelower case "x," counters, and space. Erdmann (1968, p. 108) concluded that sizewas an accurate predictor of legibility for digitally reproduced characters.Hawken (1966, p. 34-35) stated that the height of the lower case "x" and not theabsolute size of the type was the factor influencing reproducibility, llealsocited the ratio of thin stroke width to thick stroke width in a letterform as oneof the most important factors affecting legibility, with an even stroke ratio, l:l,being the ideal for reproducibility. Hawken also stated that this ratio becomesmore critical as the overall type size decreases. NASA guidelines (TechnicalPublications Program, A Working Guide, 1979, p. 15) stated that type size should bei0 points (approximately 3.5 mm) or larger.
The results of the typographic degradation study reported herein agreed withErdmann's conclusions. As sho_m in Table II,the "most legible" documents had
larger average type sizes than the documents deemed "least legible" subjectivelyand by error count in reading. The "most legible" documents also had higher averagevalues for all other variables measured and reported in Table H, except that there
17

was virtually no difference in the ratio of lower case "x" height to capital letterheight between "least" and "most legible" type. The NASA sample type was in themid-range for most typographic characteristics, between most and least legibledocuments, except that the thin stroke width of NASA's type was very low. Thisalso resulted in a low thin stroke to thick stroke width ratio.
TABLE fl
Average T_ography Characteristics of Survey Documents Which Scored asMost and Least Legible After Degradation
-- Ji
Characteristic Least legible Most legible NASA sampledocuments documents report
•.... iii
Type size, mm 3.20 3.53 3.30
Capital letterheight, mm 2.36 2.67 2.54
Lower case "x"
height, mm 1.70 1.96 1.91
"x" height 0.72 0.73 0.75capital height
Thin strokewidth, mm 0.203 0.279 0.127
Thick strokewidth, mm 0.279 0.355 0.381
Thin stroke width0.73 0.79 0.33
Thick stroke width
18

RECOMMENDATIONS FOR CHANGE
Producers of technical reports can increase their potential use as an informa-tion product, by making certain changes to the sequential, language, and presenta-tion components. These improvements, which affect the overall design and packagingof the product, are discussed below. These improvements are not, however, withouteconomic consideration. For this reason, cost factors should be calculated to ensurethat benefits to the user and/or increased utility will outweigh the cost to the
producer.
The structure and sequence of a technical report must be flexible enough toaccommodate the contents presented and the intended audience. However, the over-whelming variety of components and the numerous positions of placement can placesevere cost penalties, in terms of time and effort, on the user who must reviewlarge numbers of reports to obtain needed data. Therefore, it is concluded thatuniformity, concise organization, and clearly defined report components would pro-mote clarity and utility. Consequently, technical reports which display thesefeatures would be considered an asset and would be perceived as helpful by informa-tion users as well as information "specialists." It is further suggested thatimprovements to the design and packaging of technical reports would ultimatelyincrease their use by marginal users.
Producers of technical reports should develop and adopt an outline containinga sequence of report components which is flexible and can be adapted to the type ofmaterial presented (content), the message to be conveyed, and the audience to bereached. Doing so may be complicated by the fact that there appears to be no single,recognized, and agreed upon organization and structure for sequential components ofa technical report. The outline should be "tested" using a reader preference surveyconducted among technical report producers and users. The results of the surveywould be used to modify or finalize the outline. The outline should be incorporatedinto a style and/or publications manual. A system of review would then be initiatedto foster and ensure consistent application of the publication standards containedwithin the guide. This guide would be periodically reviewed and updated.
Summaries and abstracts should be clear and concise. Descriptive abstracts
are preferable to informative abstracts. The abstract should provide an overalldescription of the research while the summary should contain the essence of thefindings or results.
Tables and figures should be integrated into the text. Only when tables andfigures are of such volume that insertion in the text would impair readability,should they be placed as back matter. Integration of tables and figures shouldhelp overcome the difficulties associated with the use of microfiche.
In terms of readability, summaries and abstracts should score as less diffi-cult to read than the text. This is significant because readability scores are
more accurate predictors of readership and reader concepts of suitability ofmaterial than they are predictors of comprehension. This becomes extremely impor-tant to the information user who must read numerous summaries and abstracts todetermine if further analysis is necessary or if the actual report should beobtained. The information specialist, who is often engaged in the preliminary
19

acquisition and screening of related literature prior to the undertaking of aresearch effort, would also find considerable merit to this improvement.
The strong tradition of using the passive voice in technical report preparationshould be tempered. The active voice should be used to develop a more direct,natural, and concise presentation. The active voice is favored over the passivevoice whenever verbs concern the interaction of inanimate objects and/or the writerwanted to emphasize who or what performed the action. The passive voice is recom-mended when the writer wants to emphasize the receiver of the action rather thanthe doer.
A maximum permissible number of multiple plots on a single figure should beestablished. Doing so should help to reduce some of the problems associated withgraphs; namely too much data and grid use/nonuse. These problems become morepronounced when technical reports are microfiched and facsimile copies are produced.
Realizing that the "physical" appearance of an information product influencesthe users "mind set" regarding the value of the material, standards for compositionshould be developed which take into account the findings from the experimental/theoretical literature. The standards should cover such factors as type size andstyle, image area, line length and character density, and gutter width.
The accepted rules of style, grammar, and punctuation used in constructingthe prose of a text should also be used for mathematics, whether appearing in thetext or set off in display. The solidus and fractional exponents should be usedto replace stacked fractions and fractional exponents should be used to eliminateradicals both in the text and in display.
Figures and tables should be aligned with the text so that the reader does nothave to rotate the report. If there are a large number of tables and figures andit is not feasible to reduce them to fit on the page, it may be preferable to alterthe format and orientation of the entire publication.
The type of binding used should be determined in part by how the report willbe used. Ring binders should be used for material which is updated. Perfectbinding should be used for large publications, usually more than 140 pages in length,which have a relatively long shelf life. Binding which does not permit a publica-tion to lie flat when opened should be avoided.
Re-imaging technologies, which involve duplication, reproduction, and micro-graphics; and alter the traditional views of the printed report, necessitate thedevelopment of guidelines for copy preparation. A photocopy of a technical reportwill no longer be on the same paper, nor will it be bound in the same manner.If the report has been converted to microfiche, it may later appear as either apositive or negative image. Re-imaging degrades the report either at the loss oforiginal data (especially when tables, figures, and graphs are concerned) or by theaddition of extraneous information.
2O

CONCLUDING REMARKS
Improving the packaging of a product is generally recognized to be one way ofincreasing the absolute number of units which can be sold. By extension, this paperhas attempted to show that improvements in terms of the sequential, language, andpresentation components will improve the utility of the technical report. It wasfurther stated that increased utility would have its greatest effect on the marginaluser.
In terms of elasticity of demand there would be increased demand by the userand there would also be increased costs to the producer. These two factors wouldhave to be compared and analyzed to determine if the increased cost per unit wouldbe justified by the increased utility.
There are instances where improvements could not be justified because increasedutilization would not be the primary concern of the producer. This would mostlikely be the case for publications that are characterized by intentionallyrestricted circulation, contained volatile data, or have extremely limited distri-butions and/or specialized contents. However, when the producer is charged withmaking the data available to the widest possible audience (as many governmentagencies including NASA must) or finds it desirable to seek the widest possibledissemination of data, then the increased cost of production may well be justified.
21

REFERENCES
American National_Standards Institute. American National Standard Guidelines for
Format and Production of Scientific and Technical Reports (ANSI Z39.18-1974).New York, 1974.
American Psychological Association. Publication Manual of the American Psychologi-cal Association. 2nd ed. 1974.
Arnold, Edmund C. Ink on Paper Two. New York: Harper & Row, 1972.
Auger, C. 'P., ed. Use of Report Literature. Hamden, CN: Shoe String Press, 1975.
Bishop, Elna E, Eckel, Edwin B., and others. Suggestions to Authors of theReports of the United States Geological Survey. 6th ed. Washington, DC:U. S. Government PrintingOffice, 1978.
Boyland, N.T.G. "TechnicalReports, Identification and Acquisition." ResearchQuarterly (RQ) X (Fai! 1970), 18-21.
Burt, Cyrii L0dowic. A Psychological Study of Typography. Cambridge (England):Cambridge University Press, 1959.
Chaundy, T. W., Barrett, P. R., and Batey, Charles. The Printing of Mathematics.London: Oxford University Press, 1954.
Coile, Russell C. "Information Sources for Electrical and Electronics Engineers,"IEEE Transactions on Engineering, Writing, and Speech, EWS-12, No. 3,(October 1969), 71-78.
Dowding, Geoffrey. Factors in the Choice of Type Face. London: Wace & CompanyLtd., 1957.
Earle, Penelope and Vickery, B. C. "Subject Relations in Science/TechnologyLiterature." Aslib Proceedings, XXI (June 1969), 237-243.
Erdmann, R. L. and Neal, A. S. "Word Legibility as a Function of Letter Legibility,with Word Size, Word Familiarity, and Resolution Parameters." Journal ofApplied Psychology, 52 (October 1968), 403-409.
The Executive Office of the President. Science, Government and Information: The
Responsibilities of the Technical Community and the Government in the Transferof Information. A Report of The President's Advisory Committee, Washington,DC: The White llouse,1963.
Flesch, Rudolf. "A New Readability Yardstick." Journal of Applied Psychology,32 (June 1948), 221-233.
Fuccillo, Domenic A. Workshop on the Technical Report in Biomedical Literature.Bethesda, MD: National Institutes of Health, 1967.
22

Garvey, William D. and Griffith, Belver C. The Role of the Technical Report in theDissemination of Scientific Information. Washington, DC: American Psychologi-cal Association, 1965 (prepared for National Science Foundation, available NTISPB 167446).
Gunning, Robert. Technique of Clear Writing. New York: McGraw Hill, 1952.
Hartas, J. C. "Government Scientific and Technical Reports and Their Problems."Assistant Librarian, LIX (3) (March 1966), 54-59.
Hartley, James, Burnhill, Peter, and Fraser, Susan. "Typographical Problems ofJournal Design." Applied Ergonomics, 5 (March 1974), 15-20.
HarviJl, Lawrence R. and Kraft, Thomas L. Technical Report Standards. Sherman Oaks,CA: Banner Books, 1977.
Hawken, William R. Copying Methods Manual. Chicago: American Library Association,1966.
Holloway, A. H. A Guide to the Layout of Technical Publications. (AGARD-AG-178).June 1974, (avail. NTIS 74N32399).
lloup,Kenneth W. and Pearsall, Thomas E. Reporting Technical Information. 4th ed.Los Angeles: Glencoe Press, 1980.
Hull, Leon. "Measuring the Readability of Technical Writing." Proceedings of the26th International Technical Communication Conference. 1979.
Lannon, John M. Technical Writing. Boston: Little, Brown and Co., 1979.
Lee, Marshall. Bookmaking. New York: Bowker, 1965.
Mathes, J. C. and Stevenson, Dwight W. Designing Technical Reports. Indianapolis:The Bobbs-Merrill Co., Inc., 1976.
McConnell, Campbell R. Economics: Principles, Problems, and Policies. 7th ed.New York: McGraw-Hill Book Company, 1978.
McCullough, Robert A.; Pinelli, Thomas E.; Pilley, Douglas D.; and Stohrer, Freda F.A Review and Evaluation of the Langley Research Centers Scientific and Techni-cal Information Program: Results of Phase VI - The Technical Report: A Surveyand Analysis. NASA TM-83269. Washington, DC: National Aeronautics and SpaceAdministration, April 1982, (NTIS pending).
Meyers, Cecil H. Handbook of Basic Graphs: A Modern Approach. Belmont, CA:Dickenson, 1970.
Mills, Gordon H. and Walter, John A. Technical Writing. 4th ed. New York: Holt,Rinehart and Winston, 1978.
Monge, Peter R., Farace, Bettie F., Farace, Richard V., and Shriner, James D.The Assessment of NASA Technical Information. Communimetrics, Inc.,E. Lansing, MI, 1979. Unpublished.
23

Morison, Stanley. First Principles of Typography. London: Cambridge UniversityPress, 1951.
National Academy of Sciences. A Guide for Preparing Manuscripts. rev. ed.Washington, DC: National Academy of Sciences, 1975.
National Academy of Sciences, National Academy of Engineering. Scientific andTechnical Communication: A Pressing National Problem and Recommendations forIts Solution. Washington, DC: National Academy of Sciences, 1969. •
National Aeronautics and Space Administration. NASA Technical Publications Program:A Working Guide. Washington, DC: NASA STIB, 1979.
National Aeronautics and Space Administration. NASA Publications Manual 1974.Washington, DC: NASA STIO, 1974.
Oliu, Walter E., Brusaw, Charles T., and Alred, Gerald J. Writing That Works.New York: St. Martin's Press, 1980.
Pauley, Stephen E. Technical Report Writing Today. 2nd ed. Boston: Houghton,Mifflin Company, 1979.
Pinelli, Thomas E., and others. A Review and Evaluation of the Langley Research
Center's Scientific and Technical Information Program: Results of Phase I -Knowledge and Attitudes Survey, LaRC Research Personnel. NASA TM-81893.Washington, DC: National Aeronautics and Space Administration, November 1980,(avail. NTIS 81N16947).
Pinelli, Thomas E., and others. A Review and Evaluation of the Langley ResearchCe_:ter'sScientific and Technical Information Program: Results of Phase IV -Knowledge and Attitudes Survey, Academic and Industrial Personnel. NASATM-81934. Washington, DC: National Aeronautics and Space Administration,February 1981, (avail. NTIS 81N22976).
Randall, Gordon E. "British Literature Obsolescence at a British and an AmericanAeronautical Library." Special Libraries, L (November 1959), 447-450.
Schutz, Howard G. "An Evaluation of Formats for Graphic Trend Displays_-Experiment II." Human Factors, 3 (July'1961), 99-107.
Spencer, Herbert. The Visible Word. 2nd ed. rev. London: LuridHumphries inassociation with the Royal College of Art, 1969.
Stanley, Julia P. "Passive Motivation." Foundations of Language, 13 (May 1975),25-39. _
Stohrer, Freda F. and Pinelli, Thomas E. "Marketing Information: The TechnicalReport As Product." In (1981) Technical Communication: Perspectives for theEighties. Part I. NASA CP-2203. Compiled by J. C. Mathes andThomas E. Pinelli, 1981, 33-42 (avail. NTIS N8214960).
Strawhorn, J. M., Fake, E. C., and Huybrechts, B. D. Improving the Disseminationof Scientific and Technical Information: A Practitioner's Guide. Rockville,MD: Capitol Systems Group, 1978 (avail. NTIS 79N31081).
24

Strunk, William and White, E. B. The Elements of Style. 3rd ed. New York:Macmillan, 1978.
Swanson, Ellen. Mathematics into Type. Providence, RI: American MathematicalSociety, 1971.
Tallman, J. E. "History and Importance of Technical Report Literature." Sci-TechNews, IV (Winter 1962), 164-165+.
Tinker, Miles A. "Reading Reactions for Mathematical Formulae." Journal of
• Experimental Psychology, 9 (December 1926), 444-467.
University of Chicago. A Manual of Style. 12th ed. Chicago: University ofChicago Press, 1969.
U. S. Federal Council for Science and Technology. Committee on Scientific andTechnical Information. Guidelines to Format Standards for Scientific and
Technical Reports Prepared by or for the Federal Government. Washington, DC,1968 (avail. NTIS PB 180600).
U. S. Federal Council for Science and Technology. Committee on Scientific andTechnical Information. Task Group on the Role of the Technical Report. The
Role of the Technical Report in Scientific and Technological Communication.1968 (avail. NTIS PB 180944).
William Byrd Press. Mathematics in Type. Richmond, VA: William Byrd Press, 1954.
Wilson, C. W. J. "Report Literature Used By Aerodynamicists." Aslib Proceedings,X (August 1958), 194-200.
Wright, R. C. "Report Literature." In Special Materials in the Library. Edited byJack Burkett and T. S. Morgan. London: The Library Association, 1963, 46-59.
25
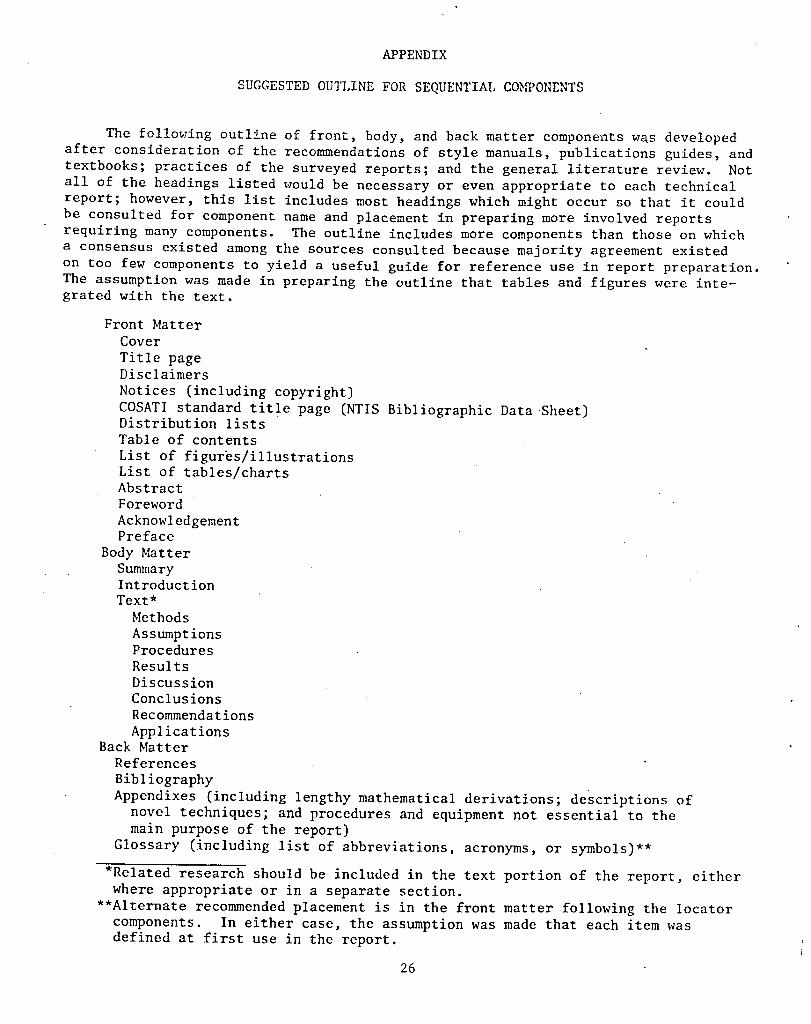
APPENDIX
SUGGESTED OUTLINE FOR SEQUENTIAL COMPONENTS
The following outline of front, body, and back matter components was developed
after consideration of the recommendations of style manuals, publications guides, and
textbooks; practices of the surveyed reports; and the general literature review. Not
all of the headings listed would be necessary or even appropriate to each technical
report; however, this list includes most headings which might occur so that it could
be consulted for component name and placement in preparing more involved reports
requiring many components. The outline includes more components than those on which
a consensus existed among the sources consulted because majority agreement existed
on too few components to yield a useful guide for reference use in report preparation. '
The assumption was made in preparing the outline that tables and figures were inte-grated with the text.
Front Matter
Cover
Title pageDisclaimers
Notices (including copyright)
COSATI standard title page (NTIS Bibliographic Data Sheet)Distribution lists
Table of contents
List of figures/illustrationsList of tables/chartsAbstract
Foreword
AcknowledgementPreface
Body Matter
SummaryIntroduction
Text*
Methods
AssumptionsProcedures
Results
Discussion
Conclusions
Recommendations
ApplicationsBack Matter
References
Bibliography
Appendixes (including lengthy mathematical derivations; descriptions of
novel techniques; and procedures and equipment not essential to the
main purpose of the report)
Glossary (including list of abbreviations, acronyms, or symbols)**
*Related research should be included in the text portion of the report, either
where appropriate or in a separate section.
**Alternate recommended placement is in the front matter following the locator
components. In either case, the assumption was made that each item was
defined at first use in the report.
26

1. Re_rt No. 2. G_emm_t AccessionNo. 3. R_ipient's _=l_ No.
NASA TM-84260
4. Title and Subtitle 5. Re_ DateJune 1982
The Technical Report: An Analysis of Information
Design and Packaging For An Inelastic Market* e. PedormingOr_nization_de
_, 8. PedormingOr_nization Re_rt No.7_Author(s)
Thomas E. Pinelli,_Robert McCullough_ and' Virginia M• Cordle- 10. W_k Unit No.
9. Performing Or_nization Name and Addre_
• NASA Ames Research Center 11. _ntract or Grant No.
Moffett Field, California 94035
13. Ty_ of Re_ and Period _ver_
12. S_nsoring A_ncy Nameand Address Technical Memorandum
National Aeronautics and Space Administration 14.Spon_ringA_ncy_deWashington, DC 20546
15. Supplementary Notes
*This paper was presented at the llth ASIS(American Society for Information
Science)Mid-Year Meeting held at the University of Tennessee, Knoxville, TN,June 13-16, 1982.
**NASA Ames Research Center, Moffett Field, CA 94035 (415) 965-5824 FTS448-5824
+Old Dominion University, Norfolk, VA 23508#College of William and Mary, Williamsburg, VA 23185
16. Abstract
As part of an evaluation of the NASA STI program, a review and analysis
of the technical report was conducted. The results, which are contained in
NASA TM-83269 (McCullough, Pinelli, et. al., 1982), will be used by NASA to
evaluate the current design and packaging of its technical reports. The resultsof this study are highlighted.
Producers of technical reports can increase the potential use of the
technical report, as an information product, by making certain changes to
the sequential, language, and presentation components• These improvements,
which effect the overall design and packaging of the product, are discussed.
These improvements are likely to have their greatest impact on the marginaltechnical report user. However, these improvements are not without economic
consideration• For this reason, cost factors should be calculated to ensure
that benefits to the user and/or increased utility will outweigh the cost tothe producer.
17. Key Wor_ (Suggest_ by Author(s)) 18. Distribution StatementEconomics of Information
Elastic/Inelastic Demand Unclassified - Unlimited
Technical Reports
Information Design and Packaging Subject Category - 82
19. Security _a_if. (of thisre_rt) 20. SecurityCla_if. (of this _) 21. No. of Pa_s 22. _ice"Unclassified Unclassified 32
"For sateby the NationalT_hnical Information_rvice, Springfield,Virginia 22161


.LLLI
IIIIIli_iiiiii_iiiiiillllll3 1176 00504 4947