thesis for the degree of doctor of philosophy
TRANSCRIPT

THESIS FOR THE DEGREE OF DOCTOR OF PHILOSOPHY
High temperature corrosion of low-alloyed and stainless steels: mechanistic study of chlorine-
induced corrosion
_____________________________________________
Mercedes Andrea Olivas Ogaz
Department of Chemistry and Chemical Engineering
CHALMERS UNIVERSITY OF TECHNOLOGY
Gothenburg, Sweden 2019

ii
High temperature corrosion of low-alloyed and stainless steels: mechanistic study of
chlorine-induced corrosion
MERCEDES ANDREA OLIVAS OGAZ
ISBN: 978-91-7905-104-4
® MERCEDES ANDREA OLIVAS OGAZ, 2019.
Doktorsavhandlingar vid Chalmers tekniska högskola
Ny serie nr 4571
ISSN 0346-718X
Department of Chemistry and Chemical Engineering
CHALMERS UNIVERSITY OF TECHNOLOGY
SE-412 96 Gothenburg
Sweden
Telephone + 46(0)31-722 1000
Cover: Schematic drawing of chloride-ion permeation through the oxide scale. SEM image of cross-sectional view of 500°C-12h sample before and after 168-hour exposure at 400 °C to 5%O2+20%H2O+75%N2+0.1mg/cm2
KCl.
Printed by Chalmers Reproservice AB
Gothenburg, Sweden 2019

iii
High temperature corrosion of low-alloyed and stainless steels:
mechanistic study of chlorine-induced corrosion Mercedes Andrea Olivas Ogaz
Department of Chemistry and Chemical Engineering
CHALMERS UNIVERSITY OF TECHNOLOGY
Abstract The global demand on power generation is constantly increasing and so far, also its
environmental impact. The environmental impact could primarily be directed to the power
generation being based on fossil fuels, giving a net increase of CO2 to the atmosphere when
combusted. The need of renewable fuels such as biomass and waste for power generation,
leading to no net release of CO2, is therefore increasing. However, biomass and waste vary in
composition and the considerably high amounts of alkali- and chlorine-containing species of
these fuels result in a highly corrosive fireside environment for the metallic components of the
boiler. Chlorine-induced corrosion is speculated to play an important role in the corrosion of
these metallic components. However, the consequences of event leading to corrosion in the
presence of chlorine is still not fully understood and the corrosion mechanism is under debate.
Thus, this study aims at investigating mechanism of chlorine-induced corrosion. The study is
divided into two parts; field exposures showing the extent and initiation of a chlorine-induced
corrosion attack and laboratory exposures aiming at investigating the mechanism of the
chlorine-induced corrosion attack.
The field exposures were focused on the startup sequence of probe exposures. The results
showed that the initiation of breakaway corrosion is very rapid in this environment. Thus, the
primary protection, i.e. the Cr-rich oxide scale on stainless steels, was immediately destroyed
and the oxides and metal chlorides formed set the boundary conditions for further corrosion,
i.e. secondary protection. The results showed that the different startup sequences had only a
minor effect on the initial corrosion attack.
Based on the corrosion attack observed in the field-exposed samples, a set of laboratory
exposures was designed. The objective was to investigate the mechanism behind chlorine
diffusion through oxide scales at high temperatures. A series of pre-oxidations were performed
in order to investigate the role of oxide composition, microstructure, and thickness on chlorine-
induced corrosion.
The investigation showed that the presence of either KCl(s) or HCl(g) accelerates the corrosion
rate of all the investigated materials. Both thickness and microstructure of the Fe-rich oxide, i.e.
secondary protection, influences the incubation time to breakaway corrosion. In addition,
cracking and spallation of the Fe-rich oxide, as well as the presence of metal chlorides at the
oxide/metal interface below a crack-free scale, were observed. Thus, the corrosion attack may
be driven by both for crack formation and chlorine diffusion through the oxide scale.
Mechanisms for both the influence of crack formation on the corrosion attack and alternative
diffusion paths for chloride is proposed. DFT calculations showed that the diffusion of chloride
ions through the oxide scale is energetically favoured to occur via oxygen vacancies.
Keywords: High temperature corrosion, chlorine-induced corrosion, low-alloyed steels, stainless
steels, pre-oxidation

iv
Acknowledgements
First of all, I would like to thank my supervisors, Professor Jan-Erik Svensson, Associate Professor
Jesper Liske, and Ph.D. Torbjörn Jonsson for the opportunity you gave me to do this Ph.D. I am
also grateful for your support, advice, time, and the knowledge you shared with me throughout
all this period.
I would also like to acknowledge the High Temperature Corrosion Centre (HTC), Konsortiet för
Materialteknik för termiska energiprocesser (KME), the Swedish Energy Agency (SEA), and all
their member companies for support and funding.
In addition, I want to express my gratitude to Professor Lars-Gunnar Johansson, Professor
Vratislav Langer, Professor Itai Panas, and Associate Professor Henrik Leion, because every time
I had a question you always replied with a friendly face. Special thanks to Charlotte Bouveng,
Sandra Gustafson, Christina Anderson, Susanne Bågenfelt, and Anna Oskarsson for assistance
with administrative matters and Esa Väänänen, Erik Brunius, and Torbjörn Jönsson for technical
support.
Special thanks to my office mates Ph.D. Loli Paz, Ph.D. Christine Geers, Ph.D. Erik Larsson, and
Amanda Persdotter; thanks for making everyday a fun day in the office with scientific
discussions, hard work, and laughter. And of course, I have not forgotten our frequent visitors
Johan Eklund and Julien Phother; thanks for bringing jokes and laughter to the office. I would
also like to thank my flat mate Ph.D. Valentina Cantatore, thanks for interesting conversations
about politics, culture, fashion, and trends during dinner and for all the advice regarding my
skin routine. And of course, thanks to the rest of my colleagues (both former and current) of
Environmental Inorganic Chemistry in the Division of Energy and Materials; you made this place
a great place to work. Thanks to my students Lisa, Johan (yes, I was your supervisor once), Jakob,
Rebecca, Angelika, Marcus, and Hampus for your great job and letting me be your supervisor; I
think I was the one who learned the most from all of you.
I also would like to thank my Mexican gang; you made me feel like I was back in Mexico when I
was homesick.
Finally, I would like to thank my family, and especially my parents, for always being so
supportive in all my crazy projects but more importantly for listening and cheering me up when
I needed it the most even though there was a whole ocean in between us. Mamá y papá, sé que
no he sido la mejor hija pero déjenme decirles que esto no lo hubiera logrado sin ustedes.
¡Muchas gracias! ¡Los quiero mucho! And to my “pequeñas incubadoras de maldad” a.k.a. my
nephews and nieces; thanks for making me smile every time you sent me small messages and
photos. ¡Los quiero!

v
List of publications The thesis is based on the following papers:
Paper I M.A. Olivas-Ogaz, M.D. Paz, T. Jonsson and J. Liske
The effect of startup procedure of probe exposures on deposit and corrosion formation in a waste
fired CFB boiler.
Proceedings paper, 22nd FBC Conference, Turku, Finland, June 2015
Paper II
M.A. Olivas-Ogaz, M.D. Paz, T. Jonsson and J. Liske
Correlation between field and laboratory exposures for boiler corrosion test – mechanistic study
of chlorine induced corrosion.
Proceedings paper, 23rd FBC Conference, Seoul, South Korea, May 2018
Paper III
M.A. Olivas-Ogaz, J. Eklund, J.-E. Svensson, J. Liske, T. Jonsson
Microstructural Study of the Influence of KCl and HCl on Preformed Corrosion Product Layers
on Stainless Steel
Oxidation of Metals (2017) 87: 801. doi:10.1007/s11085-017-9763-z
Paper IV M.A. Olivas-Ogaz, J. Eklund, A. Persdotter, M. Sattari, J. Liske, J-E. Svensson, T. Jonsson
The Influence of Oxide-Scale Microstructure on KCl(s)-Induced Corrosion of Low-Alloyed Steel
at 400 °C.
Oxidation of Metals (2018). doi:10.1007/s11085-018-9881-2
Paper V A. Persdotter, M. Sattari, E. Larsson, M. A. Olivas Ogaz, J. Liske, T. Jonsson
Oxidation of Fe-2.25Cr-1Mo steel in presence of KCl(s) at 400 °C – crack formation and its
influence on oxidation kinetics.
Submitted to Corrosion Science
Paper VI V. Cantatore, M. A. Olivas Ogaz, J. Liske, T. Jonsson, J.-E. Svensson, L-G. Johansson. I. Panas
Permeation of iron oxide scales by chloride - new insights by atomistic modelling
Manuscript

vi
Statement of the author’s contribution
Paper I
I was main the author and carried out all analysis. Field exposures were performed with help of
Ph.D. M.D. Paz.
Paper II
I was main the author and carried out all analysis. Field exposures were performed with help of
Ph.D. M.D. Paz.
Paper III
I was main author and carried out all the exposures and analysis.
Paper IV
I was main author and carried out most of the exposures and analysis. Johan Eklund and Jakob
Dahlqvist assisted in the laboratory work as students under my supervision. Ph.D. Mohammad
Sattari and Amanda Persdotter performed preparation, imaging and analysis of some of the ion
milled cross sections.
Paper V
I assisted with preparation of samples and exposures as well as co-authoring the paper.
Paper VI
I participated in the interpretation and discussion of the paper as well as co-authoring the
paper.

vii
List of acronyms
FCC Face-Centered Cubic
BCC Body-Centered Cubic
CFB Circulating Fluidized Bed
TGA Thermogravimetric Analysis
SEM Scanning Electron Microscopy
EDX Energy Dispersive X-ray
SE Secondary Electrons
BSE Back Scattered Electrons
TEM Transmission Electron Microscopy
STEM Scanning Transmission Electron Micrsocopy
HAADF High-Angle Annular Dark Field
BF Bright Field
FIB Focused Ion Beam
BIB Broad Ion Beam
XRD X-Rays Diffraction
GI Grazing Incidence
IC Ion Chromatography
CALPHAD Calculation of Phase Diagrams
DFT Density Functional Theory

viii
Table of Contents Abstract ................................................................................................................................................. iii
Acknowledgements ............................................................................................................................ iv
List of publications ............................................................................................................................. v
Statement of the author’s contribution ........................................................................................ vi
Introduction ........................................................................................................................................ 1
Oxidation theory ................................................................................................................................ 3
2.1 Oxide formation ........................................................................................................................... 4
2.2 Oxide defects ............................................................................................................................... 5
2.2.1 Diffusion ................................................................................................................................. 6
2.3 Oxidation kinetics ....................................................................................................................... 9
2.3.1 Linear rate law ........................................................................................................................ 9
2.3.2 Parabolic rate law .................................................................................................................. 9
2.3.3 Logarithmic rate law ........................................................................................................... 10
2.3.4 Breakaway corrosion ........................................................................................................... 10
Corrosion products .......................................................................................................................... 11
3.1 Oxides .......................................................................................................................................... 11
3.1.1 Corundum structure ............................................................................................................. 11
3.1.2 Spinel structure .................................................................................................................... 12
3.1.3 Halite structure .................................................................................................................... 12
3.2 Metal chlorides .......................................................................................................................... 13
Steel ...................................................................................................................................................... 15
4.1 Classification of steels ............................................................................................................... 17
4.1.1 Steels used in this study ....................................................................................................... 17
4.2 High-temperature oxidation of steels used in this study...................................................... 18
Corrosion mechanisms ................................................................................................................... 21
5.1 Chromate formation .................................................................................................................. 21
5.2 Active oxidation mechanism .................................................................................................... 22
5.3 Electrochemical mechanism .................................................................................................... 24
5.3.1 Simultaneous chlorination by KCl(s) and HCl(g) ............................................................. 25
5.4 Molten species ........................................................................................................................... 26
Research strategy and experimental plan .................................................................................. 29
6.1 Exposures .................................................................................................................................... 29
6.1.1 Field Exposures ..................................................................................................................... 29
ix
6.1.2 Laboratory Exposures.......................................................................................................... 32
Analytical techniques ...................................................................................................................... 37
7.1 Thermogravimetry ..................................................................................................................... 37
7.2 Microscopy ................................................................................................................................. 37
7.2.1 Scanning Electron Microscopy / Energy Dispersive X-rays (SEM/EDX) ......................... 38
7.2.1 Transmission Electron Microscopy (TEM) ........................................................................ 40
7.3 Focused ion beam (FIB/SEM) .................................................................................................. 40
7.4 Broad ion beam (BIB) ............................................................................................................... 42
7.5 X-ray diffraction (XRD) ............................................................................................................ 42
7.6 Ion chromatography (IC) ......................................................................................................... 43
7.7 Thermodynamic modelling ...................................................................................................... 44
7.8 Density functional theory (DFT) calculations ....................................................................... 45
Results and discussion .................................................................................................................... 47
8.1 Field exposures ........................................................................................................................... 48
8.1.1 Startup effect ........................................................................................................................ 48
8.1.2 The influence of secondary protection on field exposures ................................................ 50
8.2 Laboratory exposures ................................................................................................................ 51
8.2.1 Pre-oxidation: Secondary protection .................................................................................. 52
8.2.2 The role of chlorine species in the corrosion attack of pre-oxidized materials .............. 57
Summary and conclusions ............................................................................................................. 71
9.1 Field exposures ........................................................................................................................... 71
9.2 Laboratory exposures ................................................................................................................ 72
9.2.1 Pre-oxidation: secondary protection .................................................................................. 72
9.2.2 The role of chlorine species in the corrosion attack of pre-oxidized materials .............. 72
Influence of different chlorine species (KCl(s) and HCl(g)) on pre-oxidized stainless steel
347H .............................................................................................................................................. 72
Influence of oxide morphology, microstructure, and thickness of the low-alloyed steel Fe-
2.25Cr-1Mo on the propagation of a corrosion attack ............................................................... 73
9.2.3 Mechanisms: chlorine-induced corrosion ......................................................................... 73
Oxide scale crack formation ....................................................................................................... 73
Chlorine permeation through an oxide scale ............................................................................. 73
References .......................................................................................................................................... 75

x

1
1 _____________________________________________
Introduction
Global warming has long been a topic of debate, and the awareness has steadily been increasing.
This since global warming can have a great influence on weather, the environment, and human
health, among other things [1]. High emissions of CO2 into the atmosphere are considered to be
one of the main causes of global warming. The CO2 in the atmosphere acts as a cover that traps
heat and, subsequently, warms up the planet [2]. Fossil fuels have been and still are the main
source of power generation in the world; unfortunately, they also contribute to the increase in
CO2 emissions. In order to tackle this problem, investment in new technologies for the use of
alternative sources for power generation is needed to increase.
In 2007, the European Council proposed that, in the European Union, CO2 emissions should be
reduced 20% by the year 2020. Meanwhile, Sweden had, at an earlier time, set the goal for 50%
of power generated with renewable sources by 2020 [3]. To contribute to this goal, Sweden is
investing in research to improve the power production of already existing plants that use
renewable fuels. According to the World Bank Group, Sweden has increased its renewable share
of total energy consumption in the last 20 years [4]. In 2014, according to the Organisation for
Economic Co-operation and Development [5], Sweden is considered as one of the most
innovative countries for environment-related technology.
The combustion of biomass and waste is a promising alternative for power production, and in
Sweden, it has already been implemented. This technology consists of the production of steam
through the combustion of biomass and waste. The produced steam is used in turbines, which
generate electricity and district heating. However, power production from biomass and waste
faces some challenges, e.g. the low electric efficiency compared to fossil fuelled plants [6] and
corrosion of the metallic parts of boilers [7-9].
Biomass and waste vary in composition and contain considerable amounts of alkali- and
chlorine-containing species [7-10]. Therefore, it is speculated that the resulting fireside
environment is more corrosive than the one that results from the combustion of fossil fuels. This
may lead to a decrease in the lifetime of the metallic parts of a boiler, e.g. superheaters, where
low-alloyed and stainless steels are commonly used. Several studies have investigated out on the
fireside corrosion in this type of aggressive environment, focusing on, e.g. the influence of fuel
composition on corrosion, or material composition and temperature dependence on fireside
corrosion [7-9, 11-16]. These studies have emphasized the role of chlorine-containing species in
the fuel on the corrosion of the steel components of a boiler. However, the sequences of event

2
leading to corrosion in the presence of chlorine-containing species is still not fully understood
and the corrosion mechanism is still under debate.
This study aims to investigate the mechanism of chlorine-induced corrosion. The study is
divided into two parts; field exposures showing the extent and initiation of a chlorine-induced
corrosion attack and laboratory exposures aiming at investigating the mechanism of the
chlorine-induced corrosion. Based on this setup, the laboratory exposures were designed in such
way that key features of the corrosion attack observed in field exposed samples could be
replicated. The investigation showed that the primary protection, i.e. Cr-rich oxide scale on
stainless steels, was immediately destroyed and the oxides and metal chlorides formed set the
boundary conditions for further corrosion, i.e. secondary protection. The objective of the
laboratory exposed samples was therefore focused on investigating the role of chlorine in the
secondary protection regime. This was achieved through series of pre-oxidations of commercial
and Fe,Cr,(Ni)-model alloys to form typical model oxides. By carefully selecting the environment
parameters, oxide layers with specific thicknesses, compositions, and microstructures could be
formed. These pre-oxidized samples were subsequently exposed towards a chlorine-containing
environment.

3
2 _____________________________________________
Oxidation theory
Metals are thermodynamically unstable under most conditions to which they are exposed.
Metals may react with ambient gases to form oxides, sulphides, nitrides, carbides, or mixtures
[17]. Reaction 1 shows the total chemical reaction of a metal in the presence of oxygen gas.
𝑀 represents the metal, and 𝑂 the oxygen, 𝑥 and 𝑦 are stoichiometric integers.
𝑥𝑀(𝑠) + (𝑦 2⁄ )𝑂2 → 𝑀𝑥𝑂𝑦(𝑠) (1)
On the basis of one mole of 𝑂2, Reaction 1 can be written as follows.
(2𝑥 𝑦)𝑀 + 𝑂2 → (2 𝑦)⁄⁄ 𝑀𝑥𝑂𝑦 (2)
The last reaction can be characterized thermodynamically by the change in Gibbs free energy
under constant temperature and pressure. The change in Gibbs free energy (∆𝐺) is an indicator
used to predict if the favourability of a reaction occurring. If ∆𝐺 is negative (∆𝐺 < 0), the reaction
will proceed spontaneously [18]. Equation 3 shows the ∆𝐺 for the formation of oxide from initial
reactants.
∆𝐺 = ∆𝐺° + 𝑅𝑇𝑙𝑛 (𝑎𝑀𝑥𝑂𝑦
2 𝑦⁄
(𝑎𝑀2𝑥 𝑦⁄
)(𝑎𝑂2)) (3)
Where ∆𝐺° is the Gibbs free energy at standard conditions, 𝑅 is the universal gas constant, 𝑇 is
the temperature, and 𝑎 is the activity of the reactants and products in Reaction 2. Since the
activities of pure solids at all temperatures and pressures are equal to unity and by definition
𝑎𝑂2= 𝑝𝑂2
, the reaction can be simplified as follows when ∆𝐺 = 0, i.e. at equilibrium [18].
𝐺°𝑂2
= 𝑅𝑇𝑙𝑛𝑝𝑂2 (4)
For an oxide to be formed, the ambient oxygen pressure should be higher than the dissociation
pressure of the oxide at a given temperature [18]. In order to predict the conditions under which
a metal will oxidize or reduce, the Ellingham diagram can be used, see Figure 1.
The lines shown in the diagram correspond to oxidation reactions at standard state. The diagram
shows the relative thermodynamic stability of the indicated oxides. The most stable oxides are
the ones with the largest negative value of ∆𝐺° and are located in the lower part of the diagram.
4
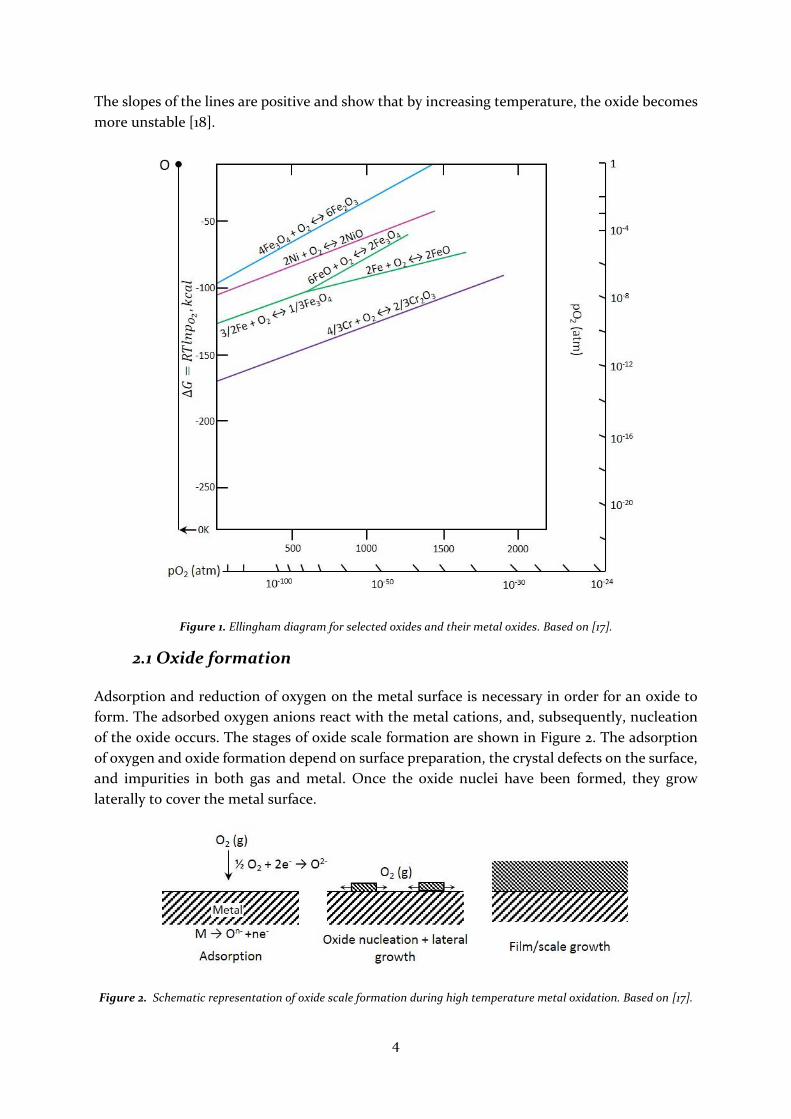
The slopes of the lines are positive and show that by increasing temperature, the oxide becomes
more unstable [18].
Figure 1. Ellingham diagram for selected oxides and their metal oxides. Based on [17].
2.1 Oxide formation
Adsorption and reduction of oxygen on the metal surface is necessary in order for an oxide to
form. The adsorbed oxygen anions react with the metal cations, and, subsequently, nucleation
of the oxide occurs. The stages of oxide scale formation are shown in Figure 2. The adsorption
of oxygen and oxide formation depend on surface preparation, the crystal defects on the surface,
and impurities in both gas and metal. Once the oxide nuclei have been formed, they grow
laterally to cover the metal surface.
Figure 2. Schematic representation of oxide scale formation during high temperature metal oxidation. Based on [17].

5
Once the oxide scale has been formed, metal and gas will not be in direct contact, which means
that any transfer of reactants occurs by transport through the oxide scale. The reactants can be
transported by lattice diffusion driven either by electric fields in or across the oxide or by the
chemical potential gradient across the scale. In other cases, the transport of reactants can occur
through different diffusion paths, such as voids, pores, or microcracks. The presence of
macrocracks offers alternative transport paths for the reactants, which accelerates the growth of
an oxide scale [17]. Figure 3 shows a schematic drawing of the transport of reactants through the
oxide scale.
Figure 3. Schematic representation of oxide scale growth during high temperature metal oxidation. Based on [17].
2.2 Oxide defects
Defects are common in an oxide structure, and they affect some of the oxide properties. The
defects can be classified as follows according to their geometry and dimension [17, 19]:
Point defects, e.g. vacancies or interstitials.
Line and surface defects, e.g. grain boundaries, dislocations, inner and outer surfaces.
In stoichiometric oxides where there is a balance between the number of cations and anions, the
Frenkel and Schottky defects are the dominant ones. The Frenkel defect involves a cationic
vacancy and an interstitial cation; the Schottky defect consists of a cationic vacancy balanced
with an anionic vacancy [17, 19]. See Figure 4.
Figure 4. Schematic representation of Frenkel and Schottky defects [19].
The non-stoichiometric oxides present a deficit or an excess of oxygen or metal according to
their different defect structures. Depending on the composition and structure, the oxides can
compensate their non-stoichiometry. When the deviation of the stoichiometry is small in
relatively simple structures, the compensation can be the formation of single-point defects,
which are considered to be dissolved in the oxide structure [17].

6
Non-stoichiometric oxides are considered as semiconductors due to their defects. They can be
classified into two different type of oxides: a p-type oxide, which means that the oxide has metal
vacancies or an excess of anions at interstitial positions; and an n-type oxide, which presents an
excess of metallic ions at the interstitial positions or anionic vacancies [18].
Due to the presence of different defects in an oxide, the transport of atoms or ions through the
oxide scale is possible. This process is called diffusion, and it is of great importance to understand
oxide growth and the possible propagation of a corrosion attack.
2.2.1 Diffusion
The transport of ions through a metal oxide occurs by diffusion through the defects present in
the oxide. Different diffusion mechanisms can occur depending on the type of defects used by
the atoms or ions to move. The mechanism can either be lattice diffusion, i.e. bulk diffusion, or
short-circuit diffusion [17].
Lattice and short-circuit diffusion have different diffusion coefficients that are dependent on
temperature, as described in Equation 5, where 𝐷 is the diffusion coefficient, and 𝐷0 is the
frequency factor independent of the temperature [19].
𝐷 = 𝐷0𝑒𝑥𝑝(−
𝑄
𝑅𝑇) (5)
The following diagram (Figure 5 left) shows a comparison between different diffusion
coefficients of nickel in nickel oxide [20]. At relatively low temperatures, e.g. about 500-800 °C,
it is suggested that the diffusion coefficient at the grain boundary is higher than the coefficient
at the lattice. The second diagram in Figure 5 (right) shows the effective self-diffusivity of silver
in single crystal and polycrystal silver. It can be seen that, at low temperature, the effective
diffusivity is higher in the polycrystal [21]. However, at increasing temperatures, the defects’
mobility in the lattice is higher than at the grain boundaries. Therefore, lattice diffusion is
considered to be the ruling mechanism at higher temperatures [17]. This can be clearly seen in
the case of silver in Figure 5 (right), where the effective diffusivity in the single crystal increases
with increasing temperature at a higher rate than the diffusivity of the polycrystal, and at some
point, they intersect [21].

7
Figure 5. Nickel self-diffusion for lattice, grain boundary, and dislocation diffusion in NiO (left) [20]; experimental data on effective self-diffusivity of silver in single crystal and polycrystal silver (right) [21].
Lattice diffusion
Lattice diffusion takes place due to the presence of point defects. Three main mechanisms are
described below, and a schematic representation is shown in Figure 6.
Vacancy diffusion: the mechanism consists of the movement of an atom or ion at a regular lattice
site to an adjacent vacancy, leaving behind a new vacancy (shown as a in Figure 6).
Interstitial diffusion: this type of diffusion occurs when an atom or an ion located at an interstitial
site moves to an adjacent interstitial site. Interstitial diffusion is commonly seen when the
interstitial ions or atoms are smaller than the ions or atoms held at the lattice sites. In the case
of larger interstitials atoms or ions, the lattice can be distorted (shown as b in Figure 6).
Interstitialcy diffusion: this diffusion mechanism involves the movement of an atom or ion to its
closest neighbour at the regular lattice site, forcing the atom or ion at the regular site to the next
interstitial position; in this way, the original interstitial takes the site in the regular lattice
(shown as c in Figure 6).
These main types of lattice diffusion mechanisms are shown below [17].

8
Figure 6. Schematic representation of lattice diffusion mechanisms: a) vacancy diffusion; b) interstitial diffusion; c) interstitialcy diffusion [22].
Short-circuit diffusion
Polycrystalline materials, such as metals and oxides, contain line and planar defects beside point
defects. These line and planar defects are dislocations and grain boundaries. Dislocations are
misalignments of the atoms that are introduced into the materials during solidification or
deformation, generally to modify the mechanical properties of the material [23].
Polycrystalline materials contain grains with identical arrangements of atoms. The orientation
of these arrangements is different in each grain, as shown in Figure 7. The spaces between grains
are called grain boundaries, which are the surfaces of the grains [23]. If the grains differ in
chemical composition and/or lattice parameters, then this grain boundary is labelled as a phase
boundary.
Figure 7. Schematic representation of grain boundaries from different orientation grains [23].
Line defects, such as grain boundaries, are considered as high diffusion paths where the flux of
atoms or ions is greater than in lattice diffusion. However, diffusion is temperature-dependent,
at relatively low temperatures, e.g. 500-600 °C (see Figure 5), the diffusion coefficients for short-
circuit diffusion are larger than the lattice diffusion coefficients. The activation energy for short-
circuit diffusion is 0.5-0.7 times that for lattice diffusion [17]. Therefore, short-circuit diffusion
is an important mechanism regarding the transport of atoms or ions at relatively low
temperatures. It should be noted that the range of temperatures used in the present work are
considered as low temperatures in diffusion, i.e. short-circuit diffusion is expected to dominate.
The results for diffusion in the NiO study by Atkinson and Taylor suggest that general aspects
of the diffusion of metals also apply to metal oxides [24]. However, the transport of reactants in
oxides is more complicated since both metal and oxygen ions can diffuse. Due to the non-
stoichiometry of oxides, transport processes can be sensitive to impurities [17].

9
2.3 Oxidation kinetics
It is possible to measure the oxidation rate of a metal by recording the weight change during a
period of time. Three kinetic laws usually describe the oxidation rates of metals: linear,
parabolic, and logarithmic. It is important to mention that oxidation rates and the
corresponding kinetic laws are dependent on temperature, time, surface preparation, oxygen
partial pressure, and the pre-treatment of the material. Therefore, kinetic models by themselves
are not sufficient to interpret and explain a corrosion mechanism. In practice, the oxidation rate
of a system may not be defined by only one rate law, e.g. breakaway corrosion (see Figure 8).
Figure 8. Schematic representation of kinetics laws for metal oxidation.
2.3.1 Linear rate law
The linear law describes a system that shows a constant oxidation rate. The oxidation rate is
limited by surface or phase boundary reactions. It is common to see this kind of rate in the early
stages of an oxidation process. [17, 18]. However, there are also cases when a linear rate can occur
after a parabolic or logarithmic oxidation rate; this occurrence is called breakaway or
catastrophic corrosion (see Figure 8). The linear rate in such a case is possible due to the cracks
and pores formed in the oxide [25].
The linear law is described by the following equation:
𝑥 = 𝑘𝑚𝑡 (6)
𝑥 is the oxide thickness, 𝑘𝑚 is the linear rate constant, and 𝑡 is the oxidation time.
2.3.2 Parabolic rate law
At high temperatures, many metals follow the parabolic law. This oxidation rate is limited by
the transport of ions and electrons through the oxide. Therefore, the mass gain decelerates with
time as the thickness of the oxide increases. The parabolic rate given by Wagner [26] is:
10
𝑥2 = 𝑘𝑝𝑡 + 𝐶 (7)
𝑥 is the oxide thickness, 𝑘𝑝 is the parabolic constant, 𝑡 is the oxidation time, and 𝐶 is the
integration constant. This model is based on the following assumptions [26]:
An oxide layer is considered compact and adherent.
The transport of ions and electrons is the rate controlling process.
Gas/oxide and oxide/metal interfaces are in thermodynamic equilibrium.
Thermodynamic equilibrium is established throughout the oxide scale.
Oxygen solubility in the metal may be neglected.
An oxide shows low deviations from stoichiometry.
An oxide scale thicker than the distances over charge effects may occur.
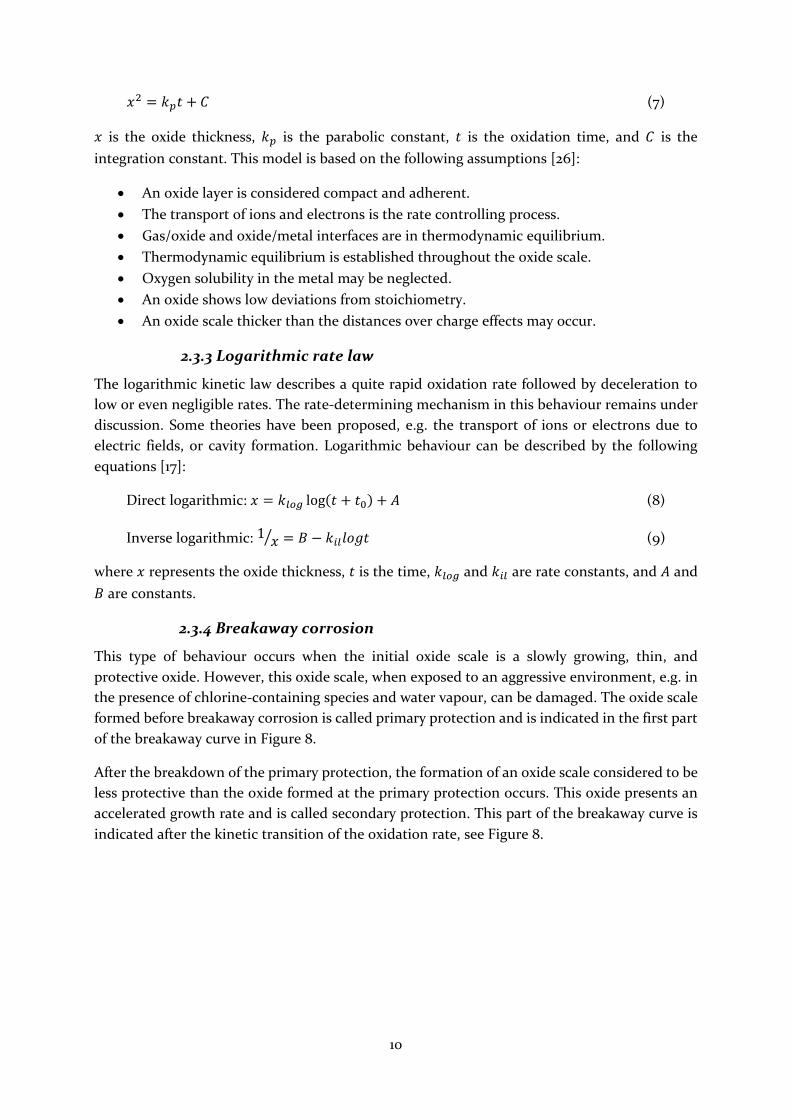
2.3.3 Logarithmic rate law
The logarithmic kinetic law describes a quite rapid oxidation rate followed by deceleration to
low or even negligible rates. The rate-determining mechanism in this behaviour remains under
discussion. Some theories have been proposed, e.g. the transport of ions or electrons due to
electric fields, or cavity formation. Logarithmic behaviour can be described by the following
equations [17]:
Direct logarithmic: 𝑥 = 𝑘𝑙𝑜𝑔 log(𝑡 + 𝑡0) + 𝐴 (8)
Inverse logarithmic: 1 𝑥⁄ = 𝐵 − 𝑘𝑖𝑙𝑙𝑜𝑔𝑡 (9)
where 𝑥 represents the oxide thickness, 𝑡 is the time, 𝑘𝑙𝑜𝑔 and 𝑘𝑖𝑙 are rate constants, and 𝐴 and
𝐵 are constants.
2.3.4 Breakaway corrosion
This type of behaviour occurs when the initial oxide scale is a slowly growing, thin, and
protective oxide. However, this oxide scale, when exposed to an aggressive environment, e.g. in
the presence of chlorine-containing species and water vapour, can be damaged. The oxide scale
formed before breakaway corrosion is called primary protection and is indicated in the first part
of the breakaway curve in Figure 8.
After the breakdown of the primary protection, the formation of an oxide scale considered to be
less protective than the oxide formed at the primary protection occurs. This oxide presents an
accelerated growth rate and is called secondary protection. This part of the breakaway curve is
indicated after the kinetic transition of the oxidation rate, see Figure 8.
11
3 _____________________________________________
Corrosion products
The corrosion products of a metal exposed to a corrosive environment may vary. For alloys, the
formation of these corrosion products depends on the alloy chemical composition, temperature,
and reaction atmosphere. The scale formed on alloys at high temperatures generally consists of
several oxide compounds. The properties of the formed compounds may influence further
corrosion behaviour of the alloy. The most important corrosion products are described in the
following sections.
3.1 Oxides
The oxides formed at high temperatures have different properties. When oxide properties
contribute to the delay of any further corrosion attack on the substrate, the oxides are called
protective. An oxide is considered protective if it meets the following requirements [18]:
Thermodynamically stable
Low diffusion coefficient for metal ions and oxygen
Thermal expansion coefficients similar to the metal
High melting temperature
Well adherent to the substrate
High plasticity at high temperature
Oxides, as pure metals, have different crystal structures that can be associated to defects in the
oxides. The crystal structures of the oxides mainly consist of hexagonal or cubic close-packed
oxygen ions. The metal ions occupy interstitial sites in the close-packed structures [17]. The
oxides can be divided according to their crystal structure as described below.
3.1.1 Corundum structure
A corundum crystal structure consists of close-packed oxygen atoms with trivalent metal atoms.
The metal atoms occupy 2/3 of the octahedral sites, and each of the metal atoms are surrounded
by six oxygen atoms. Each of the oxygen atoms are surrounded by four metal atoms [17]. Oxides
with this type of crystal structure are Cr2O3, Fe2O3, etc.
12
Chromium-containing oxides
Pure chromium forms only one stable oxide at high temperatures. This oxide is eskolaite (Cr2O3),
also called chromia, which has a corundum structure and is considered a p-type oxide. Chromia
grows slowly, forming a dense oxide in a wide temperature range [17]. Chromia is considered
protective; therefore, chromium is added to different alloys.
Hematite
Hematite (Fe2O3) is considered the most protective of the iron oxides. The oxide behaves as an
n-type semiconductor in the temperature range of 650-800 °C; and as a p-type oxide at
temperatures higher than 800 °C [17].
3.1.2 Spinel structure
Spinel is a complex oxide that consists of oxygen atoms cubic close-packed and metal ions that
occupy the tetrahedral and octahedral sites. Divalent metal ions (Fe, Mn, Zn, Mg, Ni) occupy the
tetrahedral sites, and trivalent ions (Fe, Cr, Al) occupy the octahedral ones. Metal ions can have
other distributions, as in the case of magnetite. The structure of magnetite consists of an inverse
spinel where Fe3+ ions occupy an eighth of the tetrahedral sites [17].
Spinel structures can be present in systems with different elements, as in stainless steels where
Fe2+ can be replaced with Ni2+ and Fe3+ with Cr3+, e.g. (Fe,Cr,Ni)3O4. Since iron, nickel, and
chromium ions have similar sizes, they can form several oxide combinations, depending on
temperature and oxygen activity.
Magnetite
The structure of this oxide is an inverse spinel structure at room temperature. At high
temperatures, the divalent and trivalent iron ions are randomly arranged [17]. Magnetite is
considered as an n-type oxide, and it contains both Fe2+ and Fe3+. Magnetite is less protective
than hematite.
3.1.3 Halite structure
The halite structure consists of cubic close-packed anions and smaller cations that occupy the
octahedral interstices [17]. An oxide with this type of structure is FeO, among others.
Wüstite
Wüstite is only stable at temperatures above 570 °C and with low oxygen activity. Wüstite is
classified as a p-type oxide [17]. In the oxidation of iron above 570 °C, the thickness of the wüstite
layer will be greater than the other layers due to the diffusion coefficient of iron in wüstite. The
iron diffusion coefficient in wüstite is orders of magnitude larger than the ones for hematite and
magnetite [27].
In the Fe-O system, three oxides can be formed: hematite (Fe2O3), magnetite (Fe3O4), and
wüstite (Fe1-yO). The formation of the oxides depends on temperature and oxygen activity.

13
When oxidizing pure iron, the presence of the three iron oxides described above can be
observed. The following figure shows a cross-sectional view of pure iron oxidized at 600 °C
during 24 hours in dry oxygen. The oxide order in the scale is in agreement with the diagram of
oxygen activities through the scale (see Figure 9), with hematite on the top surface, magnetite
in the middle layer, and wüstite close to the substrate where oxygen activity is the lowest.
Figure 9. FIB cross section (52° tilt) of pure iron oxidized at 600 °C in dry O2 during 24 hours. Hematite at top surface, magnetite middle layer, and wüstite bottom layer [28].
3.2 Metal chlorides
In the presence of chlorine-containing species, such as alkali chlorides (KCl, NaCl), hydrochloric
acid (HCl), and molecular chlorine (Cl2), metals form metal chlorides, e.g. FeCl2, FeCl3, CrCl2,
CrCl3, and NiCl2. The thermodynamic stability of metal chlorides and oxides at a given
temperature depends on chlorine and oxygen activities. This is shown in Figure 10.
As shown in the stability diagrams in Figure 10, metal chlorides are formed in low oxygen
activities and, therefore, are detected usually at the oxide/metal interface. The Gibbs free
energies of the formation of CrCl2, FeCl2, and NiCl2 at 600 °C are -286.0 kJ/mol, -232.1 kJ/mol,
and -174.2 kJ/mol, respectively [29].
Metal chlorides are highly hygroscopic and can absorb water. Due to their affinity to
atmospheric moisture, chloride-containing samples must be kept in desiccators to avoid
problems during handling and analysis [30].

14
Figure 10. Stability diagram of Fe-O2-Cl2, Cr-O2-Cl2, and Ni-O2-Cl2 at 600 °C; the star in each diagram indicates the atmospheric conditions when exposed to 5% O2 and 500 vppm HCl [29].

15
4 _____________________________________________
Steel
Steel is a solid solution of iron and carbon. The carbon is added in small quantities to increase
the mechanical properties of the steel. According to the iron-cementite (Fe-Fe3C) phase diagram
shown in Figure 11, pure iron presents allotropes with increasing temperature: ferrite (bcc, α),
austenite (fcc, γ), and ferrite-δ (bcc, δ). The austenite phase has a broad region in the diagram,
indicating that it has greater carbon solubility than ferrite and δ. This is of great importance
since the carbon content of the steel has a great impact on mechanical properties and heat
treatments.
Figure 11. Fe-Fe3C phase diagram based on [19].

16
By adding other alloying elements, it is possible to favour the presence of either the austenite or
ferrite phases. Elements such as nickel, manganese, and cobalt promote the opening of the
austenite phase field. When added in sufficient amounts, these alloying elements inhibit the
formation of ferrite and allow the austenite phase to be stable at lower temperatures. The
expansion of the austenite phase field is promoted by alloying elements, such as carbon and
nitrogen, however, the field is cut short by the formation of compounds. On the other hand, by
contracting and closing the austenite phase field, the formation of ferrite is encouraged, the
alloying elements that contribute to this effect are chromium, aluminium, titanium,
molybdenum, and silicon [31]. Another way to inhibit the formation of austenite is by the
contraction of the austenite phase field promoted by elements such as niobium and zirconium.
The effect of chromium and nickel on the austenite phase region can be seen in the phase
diagrams of Figure 12.
Figure 12. Effect of chromium (left) [32], and effect of nickel (right) [33] in the austenite phase field at high temperatures, images from Calphad.
The Fe-Cr phase diagram presents a narrow loop where the austenite + ferrite phases coexist,
and the austenite phase is constricted inside the loop, see Figure 12 (left). With the addition of
carbon to this system, the austenite + ferrite loop gets wider. With the addition of chromium,
the ferrite phase field gets so wide that the phase is stable at all temperatures after the 13 wt. %
of chromium. Chromium plays an important role in corrosion resistance as an alloying element
in steel. Chromium can form a protective oxide layer on a steel surface.
In the case of the Fe-Ni phase diagram, the austenite phase field is open, as shown in Figure 12
(right). By increasing the amount of nickel, the temperature transformation to ferrite-δ limits is
raised, and the ferrite transformation limits are lowered. Important to mention is that the
transformation of austenite into ferrite is quite a slow process due to the slow diffusion of nickel.
Thus, with sufficient nickel in the alloy, it is possible to obtain the austenite phase at lower
temperatures.
The phases present in an alloy, e.g. austenite and ferrite, dictate the microstructure, which plays
an important role in mechanical properties and oxidation behaviour. This is discussed further
in this chapter. Based on Figure 11 and Figure 12, it is possible to predict the microstructure of
the alloys according to their main chemical components. Figure 13 shows the microstructure of
the Fe-2.25Cr-1Mo low-alloyed steel and the 347H stainless steel used for this study. The

17
microstructure of the 347H consists mainly of austenite, whereas the microstructure of the Fe-
2.25Cr-1Mo consists of ferrite and perlite.
Figure 13. Microstructure of 347H stainless steel (left) and Fe-2.25Cr-1Mo low-alloyed steel (right).
4.1 Classification of steels
There is a large variety of steels, and they differ in chemical composition, heat treatment,
microstructure, and mechanical properties. The following scheme shows a general classification
of ferrous alloys (Figure 14) [19].
Figure 14. Classification of ferrous alloys [19].
4.1.1 Steels used in this study
Low-alloyed and stainless steels are broadly used by boiler manufacturers [14]. The chemical
composition of the steels used in this study are listed in Table 1. The alloys were selected
according to their chemical composition and oxide scale formed at high temperatures. A well-
known oxide scale is preferred in order to investigate the propagation of corrosion induced by
the presence of chlorine-containing species.

18
Material Fe C Si Mn P S Cr Ni Mo Cu N
Commercial alloys
Fe-2.25Cr-1Mo Bal. 0.1 0.3 0.5 - - 2.2 - 0.9 - -
347H Bal. 0.05 0.6 1.6 - - 17.6 10.1 - - -
Sanicro 28 Bal. 0.014 0.4 1.8 0.02 0.001 26.7 30.6 3.4 0.9 0.05
Model alloys
FeCr-0%Ni Bal. - - - - - 18 - - - -
FeCr-5%Ni Bal. - - - - - 18 5.0 - - -
FeCr-10%Ni Bal. - - - - - 18 10.0 - - -
Table 1. Chemical composition in weight %.
Low-alloyed steel
The low-alloyed steel, Fe-2.25Cr-1Mo, is a ferritic steel that is known for its good mechanical
properties and low price. However, this type of steel is considered to have a limited corrosion
resistance at low temperatures and mild corrosive environments. The low content of chromium
impedes the low-alloyed steel from forming a protective Cr-rich oxide layer, which is considered
more protective than an Fe-rich oxide.
Stainless steel
Stainless steels can be classified according to their microstructure, i.e. martensitic, austenitic,
ferritic, and duplex (ferritic-austenitic) stainless steels. The microstructure influences the
mechanical properties and oxidation behaviour of the alloy. Two austenitic stainless steels,
Sanicro 28 and 347H, were used in this study.
Compared to low-alloyed steels, stainless steels exhibit good corrosion resistance. This is due to
their relatively high content of chromium. These steels are able to form a protective oxide layer
with a minimum content of about 10 weight percent of chromium. This protective oxide layer is
defined as the primary protection, see Section 2.3.4. However, since chromium oxide has the same
structure as hematite and chromium has an ion size similar to iron, it is possible to form a solid
solution oxide, depending on temperature [34, 35]. The protective properties of the solid solution
depend on its chromium content.
Model alloys
Model alloys refer to the alloys that are tailor-made to study specific element effects on alloy
behaviour. This study used three model alloys were used with varying nickel content but with a
constant amount of chromium balanced with iron. The chemical composition of these alloys can
be seen in Table 1; the amount of chromium was set for comparison with commercial stainless
steels. The purpose of using these alloys was to investigate the effect of nickel on the oxidation
behaviour of stainless steels, including the microstructure of the alloy before and after oxidation.
4.2 High-temperature oxidation of steels used in this study
The oxidation behaviour of low-alloyed and stainless steels at high temperature may differ due
to the microstructure and content of the alloying elements, mainly chromium. Therefore, the
oxidation mechanisms and oxide scales observed for both steels differ.

19
The oxidation of stainless steels at high temperature has been broadly studied [36-45]. For long
oxidation times or for oxidation in the presence of a corrosive environment, e.g. water vapour
or alkali chlorides, chromium is depleted and loses the primary protection of the alloy. This leads
to the formation of a less protective oxide, e.g. Fe-rich oxide (secondary protection) [44, 46-49].
A cross-sectional view of the stainless steel 304L oxidized in the presence of O2 and H2O at 600
°C is shown in Figure 15, where an Fe-rich oxide island formed after the protective oxide layer
broke down [45].
Figure 15. Breakdown of protective oxide in stainless steel: a) FIB image (at 50° tilt) of the outward-growing oxide island and inward-growing oxide crater; b) schematic diagram of the oxidation process after breakdown of the protective oxide layer, the number represents the concentration of Cr in weight percent of cation content [45].
The evaporation of CrO3(g) in an oxidizing environment (dry oxygen) has been reported at
temperatures higher than 1000 °C. This means that Cr-rich oxide-forming alloys are not suitable
for applications at these temperatures [50]. In environments where alkali compounds and/or
H2O are present, breakaway corrosion has been found on the protective oxide caused by the
formation of chromates [47, 48, 51, 52] or the evaporation of chromic acid (CrO2(OH)2) [42-44,
49, 53-55].
At high temperatures, the oxidation behaviour of the low-alloyed steel is suggested to be
analogous to the oxidation of pure iron in dry oxygen and in the presence of water vapour [56].
The oxide scale consists of three oxide layers: a thin top layer of Fe2O3, a thicker middle layer of
Fe3O4, and an inward-growing Fe,Cr-spinel layer [56].
Importance of microstructure in corrosion
Steels are polycrystalline materials, and the microstructure of a steel plays an important role.
The microstructure is given by the number of phases, their proportion and distribution, and the
grain size of the alloy. The chemical composition of the alloy and previous heat treatments are
factors that can affect the microstructure [19].
For stainless steels at relatively low temperatures, the grain boundaries of the metal are the main
supply path of chromium to form a protective Cr-rich oxide. However, when the supply of
chromium is not sufficient, the oxide becomes richer in Fe and form iron oxide. This can be seen
clearly in the case of austenitic stainless steels. The microstructure of the austenitic stainless
steel consists of considerably large austenite grains. Since the grain boundaries of the metal are
the chromium supply paths, the depletion of chromium occurs first at the centre of the steel
austenite grain together with the growth of an Fe-rich oxide island. In contrast, ferritic stainless
steel in the presence of water vapour has shown better corrosion resistance than austenitic

20
stainless steel. This is attributed to a faster supply of chromium to the oxide due to the
microstructure of the steel bulk [57].
Oxides are also polycrystalline, and consequently, their microstructure is of great importance.
The microstructure of oxides can be complex and dependent on the chemical composition and
microstructure of the alloy as well as the heating rate, temperature, atmosphere, and time of the
oxidation. The role of the oxide microstructure will be discussed in following sections to give a
different approach to the study of chlorine transport through an oxide scale.

21
5 _____________________________________________
Corrosion mechanisms
The complex environment inside biomass- and waste-fired boilers consists of a combination of
oxygen, water vapour, alkali salts, and chlorine-containing species, among other compounds.
The levels of chlorine-containing species in waste- and biomass-fired boilers are usually high
compared to fossil fuels. Viklund summarizes common flue gas values for boilers when fired
with coal [58], biomass [8, 15, 59-61], and waste [62, 63] fuels in Table 2 [64].
Fuel O2 (%) H2O (%) HCl (ppm) KCl+NaCl (ppm)
Coal ̴ 4-5 ̴ 4-16 ̴ 10-50 -
Biomass ̴ 5-10 ̴ 10-20 ̴ 25-1000 ̴ 5-50
Waste ̴ 5-11 ̴ 10-20 ̴ 250-1300 <120
Table 2. Approximate flue gas composition (volume %) in waste-, biomass-, and coal-fired boilers [64].
Chlorine-containing species are highly corrosive towards metallic components, e.g. the
superheaters, in boilers. Therefore, understanding the mechanisms involved in chlorine-
induced corrosion is of great importance. Different mechanisms have been proposed to explain
chlorine-induced corrosion. However, the mechanism of chlorine-induced corrosion is still
under debate.
5.1 Chromate formation
In stainless steels, chromium depletion of the protective Cr-rich oxide (primary protection) in
the presence of alkali chlorides has been reported [51]. The authors have explained this
mechanism and have suggested that the depletion of the protective oxide layer is due to the
reaction of the alkali ion with the Cr–rich oxide, as the following reaction shows:
𝐶𝑟2𝑂3(𝑠) + 4𝐾𝐶𝑙(𝑠) + 2𝐻2𝑂(𝑔) +3
2𝑂2(𝑔) ↔ 2𝐾2𝐶𝑟𝑂4(𝑠) + 4𝐻𝐶𝑙(𝑔) (10)
∆𝐺°(600 °𝐶) = 74 𝑘𝐽 𝑚𝑜𝑙⁄ (with input gas composition = 5% O2, 40% H2O;
𝑝𝐻𝐶𝑙(𝑒𝑞) = 1.3 ∗ 10−3𝑏𝑎𝑟)
Once potassium chromate (K2CrO4) has formed, the surrounding oxide becomes depleted of
chromium. This leads to the breakdown of the protective oxide and the formation of an Fe-rich
oxide layer, which is not as protective as the former oxide, i.e. chloride ions can easily permeate
through the scale and may form metal chlorides. Figure 16 shows a schematic illustration of the
chromate formation mechanism.

22
Figure 16. Schematic illustration of chromate formation mechanism in stainless steels (left); chloride ion transport after breakdown of protective oxide (right).
This breakdown mechanism of the protective oxide scale has also been observed in the presence
of potassium carbonate (K2CO3), as the following reaction indicates [46, 51]:
𝐶𝑟2𝑂3(𝑠) + 2𝐾2𝐶𝑂3(𝑠) +3
2𝑂2(𝑔) ↔ 2𝐾2𝐶𝑟𝑂4(𝑠) + 2𝐶𝑂2(𝑔) (11)
∆𝐺°(600 °𝐶) = −129 𝑘𝐽 𝑚𝑜𝑙⁄ (with input gas composition = 5% O2; 𝑝𝐶𝑂2(𝑒𝑞) = 5.2 ∗ 106𝑏𝑎𝑟)
This mechanism implies that the alkali ion plays a major role, and not the chlorine, in the
initiation of the breakdown of a Cr-rich oxide.
5.2 Active oxidation mechanism
This mechanism was originally suggested by McNallan [65] and further developed by Grabke
[66]. It is suggested that the active oxidation mechanism initiates with the transport of
molecular chlorine (Cl2) through the oxide scale. According to Abels et al. [67], Cl2 is considered
the main aggressive chlorine-containing specie in corrosion, and not hydrochloric acid (HCl),
when exposed for short times. It is suggested by those authors that molecular Cl2 can be obtained
from the oxidation of HCl or the reaction of alkali chlorides with the oxide scale, as the following
the reactions show [66]:
2𝐻𝐶𝑙(𝑔) +1
2𝑂2(𝑔) ↔ 𝐶𝑙2(𝑔) + 𝐻2𝑂(𝑔) (12)
2𝑁𝑎𝐶𝑙(𝑠) + 𝐹𝑒2𝑂3(𝑠) +1
2𝑂2(𝑔) ↔ 𝑁𝑎2𝐹𝑒2𝑂4(𝑠) + 𝐶𝑙2(𝑔) (13)
4𝑁𝑎𝐶𝑙(𝑠) + 𝐶𝑟2𝑂3(𝑠) +5
2𝑂2(𝑔) ↔ 2𝑁𝑎2𝐶𝑟𝑂4(𝑠) + 2𝐶𝑙2(𝑔) (14)
Equilibrium partial pressures at 500 °C for the formed Cl2 are in the range of 10-10–10-13 bar Cl2
[66]. Assuming that the formed Cl2 diffuses somehow through the oxide scale, the Cl2 will react
with the metal and form metal chlorides at the oxide/metal interface.
𝐹𝑒(𝑠) + 𝐶𝑙2(𝑔) ↔ 𝐹𝑒𝐶𝑙2(𝑠) (15)
According to Figure 17, the low oxygen activity at the oxide/metal interface is favourable for the
formation of metal chlorides [66]. However, a gradient of oxygen partial pressure is present
along the oxide scale going from the low oxygen partial pressure at the oxide/metal interface to
a higher partial pressure at the gas/oxide interface.

23
Figure 17. Phase stability diagram of the system Fe-O-Cl at 500 °C at the pO2 corresponding to the Fe/Fe3O4 phase boundary. FeCl2(s) is stable [66].
It is assumed that metal chlorides formed at the oxide/metal interface tend to diffuse through
the oxide scale via cracks and pores, thus reaching higher levels of oxygen due to their
considerable vapour pressure (pFeCl2=4·10-5 bar at 500 °C) [66]. The metal chlorides are oxidized
and form Fe3O4 and/or Fe2O3, releasing Cl2 according to the following reactions:
3𝐹𝑒𝐶𝑙2(𝑔) + 2𝑂2(𝑔) ↔ 𝐹𝑒3𝑂4(𝑠) + 3𝐶𝑙2(𝑔) (16)
2𝐹𝑒𝐶𝑙2(𝑔) +3
2𝑂2(𝑔) ↔ 𝐹𝑒2𝑂3(𝑠) + 2𝐶𝑙2(𝑔) (17)
The authors have suggested that the formed molecular Cl2 might either diffuse back to the
oxide/metal interface or be released into the reaction atmosphere. The following figure shows
the schematic mechanism of active oxidation.
Figure 18. Schematic illustration of the active oxidation mechanism. Based on [66].
In summary, this mechanism is a proposed explanation of the process of the formation of metal
chlorides. This mechanism is based on the idea that Cl2 is the main aggressive specie, as
24
suggested by Abels et al. [67]. However, the conversion rate of Cl2 by the Deacon process is slow
at 500 °C in the absence of a catalyst [68]. This means that the concentration of molecular
chlorine in initiating the active oxidation process is questionable. Nevertheless, assuming that
chlorine could penetrate the oxide scale, active oxidation does not explain the transport of
chlorine through the oxide scale. The authors have assumed that the chlorine creates fast
diffusion paths by itself. However, if the chlorine is able to penetrate as a Cl2 molecule, oxygen
as O2 should be able to penetrate as well, since the O2 molecule is smaller than the Cl2 molecule.
In the event that oxygen could diffuse through the oxide scale, the gradient of oxygen partial
pressure in the scale would change, and the formation of metal chloride would be disfavoured.
Another issue that puts into question the active oxidation mechanism is that metal chlorides
form at the oxide/metal interface, however, the presence of metal chlorides on the outer part of
the oxide scale has been reported [29, 69].
5.3 Electrochemical mechanism
Folkeson et al. have proposed a different mechanism [69]. This approach does not involve any
gas phase transport of the chlorine species through the oxide scale, instead a flux of anions and
cations and an electronic current are suggested to occur. The formation of Cl2 is proposed, as
the following reaction shows:
2𝐻𝐶𝑙(𝑔) +1
2𝑂2(𝑔) → 𝐶𝑙2(𝑔) + 𝐻2𝑂(𝑔) (18)
∆𝐺°(500 °𝐶) = −12.81 𝑘𝐽 (with input gas composition = 5% O2, 10 ppm H2O and 500 ppm HCl at 1 bar; 𝑝𝐶𝑙2(𝑒𝑞) = 150 ∗ 10−6𝑏𝑎𝑟)
The formation of Cl- ions is suggested to occur at the oxide surface by the reduction of Cl2, as Reaction 19 shows. The necessary electronic current is provided by the metal oxidation at the oxide/metal interface, see Reaction 20:
𝐶𝑙2(𝑔) + 2𝑒− → 2𝐶𝑙−(𝑎𝑑𝑠) (19)
𝑀(𝑠) → 𝑀𝑛+ + 𝑛𝑒− (20)
The formation of chloride ions might be also be possible without involving the formation of Cl2,
as the following reaction shows:
2𝐻𝐶𝑙(𝑎𝑑𝑠) +1
2𝑂2(𝑎𝑑𝑠) + 2𝑒− → 𝐻2𝑂(𝑔) + 2𝐶𝑙−(𝑎𝑑𝑠) (21)
This mechanism is also possible in the presence of alkali chlorides and water vapour. Potassium
chloride at the gas/oxide interface reacts with H2O and O2 to form Cl- ions and KOH in the gas
phase, as the following reaction suggests [70]:
2𝐾𝐶𝑙(𝑠) +1
2𝑂2(𝑔) + 𝐻2𝑂(𝑔) + 2𝑒− → 2𝐾𝑂𝐻(𝑔) + 2𝐶𝑙−(𝑎𝑑𝑠) (22)
According to the authors, the formed chloride ions are not expected to dissolve into the iron
oxide because of their large size and low charge. On the contrary, chloride ions are expected to
have high mobility at the oxide surface. The oxide grain boundaries may be regarded as inner
surfaces that have properties similar to the oxide surface on top of the scale [71]. Thus, the
transport of the chlorine species is suggested to occur via grain boundary diffusion. The
following figure shows a schematic illustration of the electrochemical mechanism and indicates
the path of the chloride ions and the expected formation of the metal chlorides.

25
Figure 19. Schematic illustration of chlorine-induced corrosion from the electrochemical approach.
Metal chlorides are expected to be formed at the oxide/metal interface where oxygen levels are
low. However, Folkeson et al. [69], have shown that metal chlorides are found throughout the
oxide scale. This is in agreement with Zahs et al. [29], who have reported that metal chlorides
are not confined to the metal/oxide interface. The location of the metal chlorides is determined
by the speed of the inward transport of chloride ions and the outward transport of cations.
This approach also suggests that the metal chlorides in the scale are better ion conductors than
the oxide. Thus, with the formation and accumulation of metal chloride in the oxide scale, the
transport of ions and corrosion rate will increase.
5.3.1 Simultaneous chlorination by KCl(s) and HCl(g)
In the mechanisms in Section 5.2 and 5.3, the authors have studied the effect of alkali chlorides
and HCl(g) separately. A mechanism that involves the presence of both chlorine-containing
species has recently been proposed by Larsson [72]. Based on the electrochemical approach
proposed by Folkeson, et al. [69], the Larsson suggests that the formed KOH is chemisorbed in
the upper part of the iron oxide layer. The released chloride ions diffuse to the oxide/metal
interface and form metal chlorides. The metal chlorides accumulate at the oxide/metal interface
until a thick metal chloride layer is formed. It is suggested that this layer inhibits the flux of
electrons by the electronic isolating properties of the metal chlorides (Figure 20) [17]. Larsson
has reported that, compared to KCl(s), the presence of HCl(g) separately results in a minor effect
on oxidation behaviour. In the event both chlorine-containing species are present, it is suggested
that the absorption of HCl(g) into the oxide scale is not preferred before the absorption of
oxygen and water. Consequently, HCl(g) reacts with the KOH chemisorbed on the iron oxide
surface, forms KCl(s), and releases water (Figure 20). The formation of KCl speeds up the initial
electrochemical process. The following figure shows a schematic illustration of the mechanism
proposed by Larsson.

26
Figure 20. Schematic illustration of combined effects of KCl and HCl on corrosion attack of low-alloyed steels. Based on [72].
This mechanism is quite recent and further and more detailed research is needed.
5.4 Molten species
Corrosion in the presence of molten species has been reported to occur in biomass- and waste-
fired boilers [8, 73]. This might be due to the formation of melts by the presence of different
salts. The increase in corrosion rate caused by the presence of melts can be attributed to the
dissolution of the protective oxide, to the faster kinetics of reactions in the liquid phase, and to
the promotion of fast ion transport since the liquid phase can act as an electrolyte.
The melts formed by the mixture of two or more salts have low melting points. This is because
of the formation of eutectic melts, which have a lower melting point than pure constituents
(eutectic point). This can be observed in the following figure of the FeCl2-KCl phase diagram
where the eutectic point is at 355 °C, whereas the melting points of FeCl2 and KCl are 677 and
772 °C, respectively. Table 3 shows more examples of melting points of salt mixtures and their
eutectic mixtures.

27
Figure 21. Phase diagram FeCl2-KCl. Data from the FTsalt-FACT salt database (FactSage).
Pure compounds
(deposit)
Melting point (°C)
Pure compounds (corrosion
products)
Melting point (°C)
Eutectic mixtures Melting
point (°C)
KCl 771 FeCl2 677 KCl-NaCl 657
NaCl 801 FeCl3 303 KCl-FeCl2 355
CaCl2 782 CrCl2 820 KCl-NaCl-FeCl2 380
ZnCl2 318 CrCl3 1150 KCl-NaCl-FeCl2-PbCl2 360
PbCl2 498 NiCl2 1030 KCl-K2CrO4 650
K2SO4 1069 K2CrO4 973 KCl-K2Cr2O7 367
Na2SO4 880 K2Cr2O7 398 KCl-ZnCl2 230
CaSO4 1460 Na2CrO4 792 ZnCl2-PbCl2 300
K2CO3 901 Na2Cr2O7 357 K2SO4-Na2SO4-CaSO4 776
Na2CO3 851 CaCrO4 1020 K2SO4-Na2SO4-Fe2O3 575
CaCO3 825
Table 3. Melting points of a few pure salts and salt mixtures in biomass- and waste-fired boilers [8, 53, 74].

28

29
6 _____________________________________________
Research strategy and experimental plan
6.1 Exposures
The research strategy of this study was designed to investigate some of the mechanisms involved
in the corrosion of biomass- and waste-fired boilers. This strategy includes the preparation and
exposure of samples, analysis, and evaluation of data. Data was obtained from both field and
laboratory exposures; thus a more complete view and comprehensive understanding of the
corrosion mechanisms was achieved. Field exposures were performed to allow the analysis of
the aggressive environment in a boiler and its effect on the materials. In contrast, laboratory
exposures were performed in tube furnaces and an in-situ thermobalance with a simplified and
well-controlled environment. The setup of both types of exposures are described below.
6.1.1 Field Exposures
Field exposures were performed to generate new knowledge about corrosion testing in biomas-
and waste-fired boilers, and the correlation between field and laboratory exposures. This was
done in order to facilitate improvement of methods for the determination of the service life of
superheater materials, and an understanding of corrosion mechanisms. Two field exposure
campaigns were carried out in the waste-fired boiler, P15, located in Händelöverken, Norrköping,
Sweden, during November 2014 and October 2016. The fuel was a mixture of 50% household
waste and 50% industrial waste. The average chemical content of the fuel during the exposure
periods is shown in Table 4. The steam produced in the boiler was used for electricity production
and industrial processes. The thermal capacity of the boiler was 85 MW (supplied by Sumitomo
SHI FW). The exposures were performed at the empty pass, upstream of the superheater
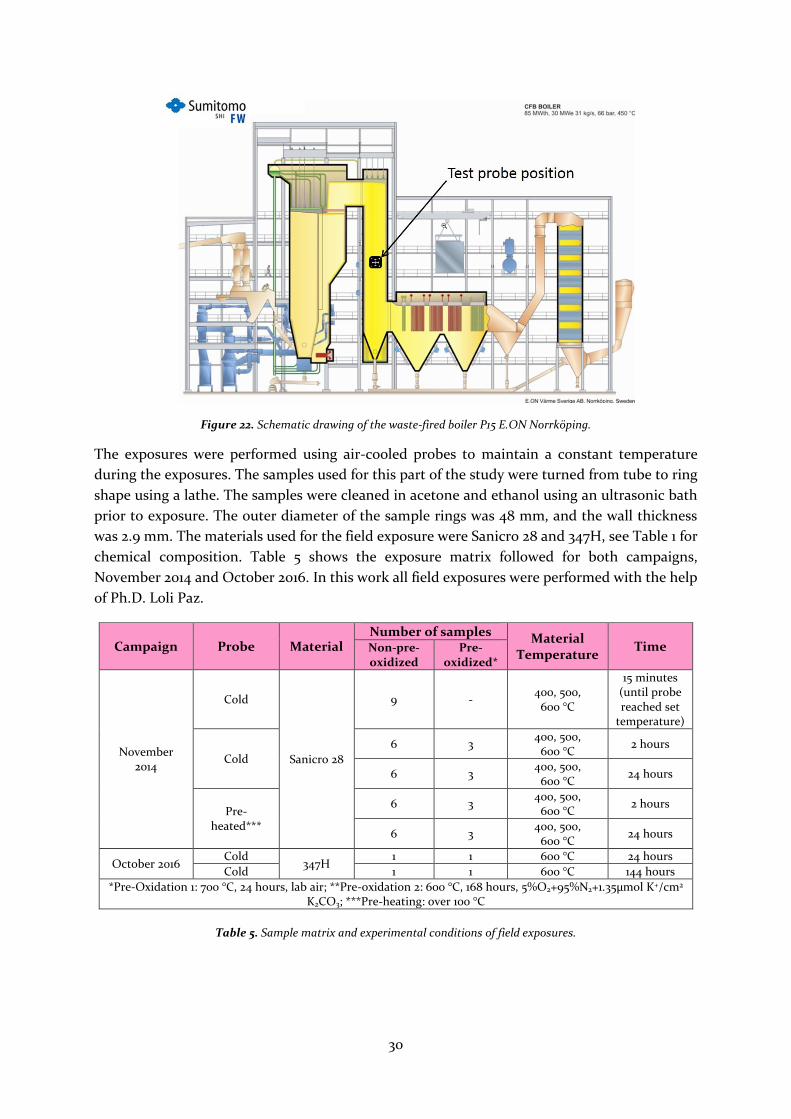
bundles. Figure 22 shows a schematic drawing of the boiler, P15, with the test probe position
indicated. The flue gas temperature of the probe position was around 680 °C.
Campaign Moisture Ash content C H N O Cl F Br S
2014 39.9 % 19.6%
dry
45.5%
dry
5.8%
dry
0.99%
dry
27.0%
dry
0.82%
dry
0.01%
dry
0.007%
dry
0.34%
dry
2016 28.9 % 21.7%
dry
48.1%
dry
6.3%
dry
0.80%
dry
21.8%
dry
0.92%
dry
0.02%
dry
0.009%
dry
0.39%
dry
Table 4. Average chemical content of fuel (supplied by E.ON).
30
Figure 22. Schematic drawing of the waste-fired boiler P15 E.ON Norrköping.
The exposures were performed using air-cooled probes to maintain a constant temperature
during the exposures. The samples used for this part of the study were turned from tube to ring
shape using a lathe. The samples were cleaned in acetone and ethanol using an ultrasonic bath
prior to exposure. The outer diameter of the sample rings was 48 mm, and the wall thickness
was 2.9 mm. The materials used for the field exposure were Sanicro 28 and 347H, see Table 1 for
chemical composition. Table 5 shows the exposure matrix followed for both campaigns,
November 2014 and October 2016. In this work all field exposures were performed with the help
of Ph.D. Loli Paz.
Campaign Probe Material Number of samples
Material Temperature
Time Non-pre-oxidized
Pre-oxidized*
November 2014
Cold
Sanicro 28
9 - 400, 500,
600 °C
15 minutes (until probe reached set
temperature)
Cold
6 3 400, 500,
600 °C 2 hours
6 3 400, 500,
600 °C 24 hours
Pre-heated***
6 3 400, 500,
600 °C 2 hours
6 3 400, 500,
600 °C 24 hours
October 2016 Cold
347H 1 1 600 °C 24 hours
Cold 1 1 600 °C 144 hours
*Pre-Oxidation 1: 700 °C, 24 hours, lab air; **Pre-oxidation 2: 600 °C, 168 hours, 5%O2+95%N2+1.35µmol K+/cm2 K2CO3; ***Pre-heating: over 100 °C
Table 5. Sample matrix and experimental conditions of field exposures.

31
Startup sequence
The startup sequence of probe exposures refers to the initial stages during the corrosion test
exposure in a waste-fired CFB boiler. This sequence includes the deposit formation and initial
oxidation of the sample surfaces. The startup sequence was studied by comparing the corrosion
behaviour of probe samples mounted on two probes and simultaneously exposed during
different startup sequences. One probe was taken directly from room temperature and mounted
in the hot boiler, whereas the other probe was preheated to above 100 °C before being mounted
in the boiler. The preheating was performed using an IR furnace and lasted about 5 minutes.
The exposed material was the stainless steel Sanicro 28. A total of 47 rings were exposed, of
which 12 rings were pre-oxidized in air at 700 °C during 24 hours in a box furnace. Each probe
had three individually controlled temperature zones of 600, 500, and 400 °C (see Figure 23). The
exposure times were 15 min, 2 hours, and 24 hours. After exposure, the probes were withdrawn
from the boiler and allowed to cool to room temperature. The samples were characterized by
means of SEM and XRD.
Figure 23. Schematic representation of field exposures.
The influence of secondary protection on field exposures
The study and analysis of isolated corrosion mechanisms in field exposure samples is
complicated due to the aggressive corrosion attack inside the boiler. In this part of the study, a
set of samples with specific starting conditions were exposed in a waste-fired CFB boiler. The
exposed material was the stainless steel 347H. A total of 4 samples were used, of which 2 of the
samples were pre-oxidized. In order to compare and correlate field and laboratory corrosion
tests, the pre-oxidation step was similar to the one performed in laboratory tests, see pre-
oxidation for stainless steels in Section 6.1.2. The pre-oxidation was performed in a tube furnace
at 600 °C. The environment of the pre-oxidation was 5%O2 and 95%N2. K2CO3 was deposited on
the surface of the rings prior to pre-oxidation in order to obtain an Fe-rich oxide. The non-pre-
oxidized samples were used as reference.
The samples were exposed during 24 and 144 hours. An air-cooled probe was used, and the
material temperature was set to 600 °C. After exposure, the probes were withdrawn from the

32
boiler and allowed to cool to room temperature. The samples were characterized by means of
SEM.
6.1.2 Laboratory Exposures
Laboratory exposures were performed to study in detail and understand the corrosion
mechanisms active in a biomass- and waste-fired boiler. The focus of this study was on chlorine-
induced corrosion, and more specifically on the transport of chlorine through oxide scales.
The laboratory exposures were designed so that different aspects of the chlorine-induced
corrosion mechanism could be studied separately. The materials used for this part of the study
were the stainless steel 347H, the low-alloyed steel Fe-2.25Cr-1Mo, and model alloys, for the
chemical composition of the materials see Table 1. The experimental plan consisted of series of
pre-oxidations to obtain tailor-made oxides and, subsequently, expose the samples to chlorine-
containing species as the following flowcharts show.
Figure 24. Flowchart of experimental plan of laboratory exposures.
The flow charts describe different effects that play a part in chlorine-induced corrosion. The first
flow chart describes the experimental strategy used to investigate the difference in the
propagation of corrosion attack depending on the chlorine-containing species present during

33
exposure. The second flow chart shows the strategy used to study the influence of the oxide scale
microstructure on the propagation of chlorine-induced corrosion.
In this study, Fe,Cr,(Ni)-model alloys were used in order to study the differences between oxide
scales formed by the stainless steels and low-alloyed steels after breakaway (secondary
protection). This was based on the idea that both oxides form Fe-rich oxide on the surface and
an inward-growing spinel oxide.
Sample preparation for laboratory exposures
Two types of exposures were performed in the laboratory, in a tube furnace and a
thermobalance. The as-received metal plates were cut into coupons with the dimensions of
15x15x2 mm for the tube furnace exposures, and 8x10x2 mm for the thermobalance exposures. A
hole of 1.5 mm diameter was drilled in each coupon to facilitate sample handling. All samples
were ground down to 320 grit with SiC paper and, subsequently, polished down to 1 µm in a
diamond suspension to a mirror-like surface. After polishing, the samples were cleaned and
degreased with acetone and ethanol in an ultrasonic agitation bath. All samples for the tube
furnace exposures were weighed before and after exposure. The weight change was recorded
using a SartoriusTM balance with microgram resolution. For the samples exposed in the
thermobalance, the mass gain was recorded simultaneously with the temperature change during
exposure. All samples were stored in desiccators before and after exposure to prevent
atmospheric corrosion.
Pre-oxidation for laboratory exposures
Samples were pre-oxidized prior to exposure to chlorine-containing species. This was done in
order to address the aim of this study, which is to investigate the mechanism behind chlorine
diffusion through oxide scales at high temperature. The pre-oxidation parameters were set to
achieve specific oxide microstructures and thicknesses depending on which aspect of the
chlorine-induced corrosion was to be investigated.
In the case of pre-oxidation of stainless steels, 1.35 µmol K+/cm2 in the form of K2CO3(s) was
deposited on each sample surface and exposed to 5% O2 and 95% N2. The aim of depositing
K2CO3(s) was to obtain an iron-rich oxide by breaking the Cr-rich oxide, which is considered
protective. The mechanism of the breakaway of the Cr-rich oxide is explained in Section 5.1. The
pre-oxidation was performed in the tube furnace.
The pre-oxidation of Fe,Cr,(Ni)-model alloys was similar to the one for stainless steels. K2CO3(s)
was deposited on the sample until 13.5 µmol K+/cm2 was reached. The pre-oxidation was
performed in a Setaram Setsys Evolution® thermobalance in order to achieve a specific mass gain
before stopping the pre-oxidation. The pre-oxidation atmosphere was 5% O2 and 95% N2. The
reaction gas flowed parallel to the sample surface. The flow was set digitally with mass flow
controllers to 15 mL/min. The temperature was calibrated externally to the centre of the
thermobalance. The pre-oxidation time depended on the chemical composition of the alloy.
Figure 25 shows the thermobalance setup.

34
Figure 25. Thermobalance exposure setup.
The pre-oxidation atmosphere was set to 5% O2, 20% H2O, and 75% N2 for the low-alloyed steels.
Water vapour was added to the gas flux by passing the dry gas through a membrane in which
water flowed at a controlled temperature. The selected pre-oxidation temperatures were 500,
600, and 700 °C. The pre-oxidation was performed in the tube furnace.
The pre-oxidation process is described in more detail in Section 8.1.1. All the pre-oxidized
samples were well characterized to investigate the actual condition of the samples before
chlorine-containing species exposures.
Exposures in presence of chlorine-containing species
The samples were exposed in the presence of chlorine-containing species after pre-oxidation.
The chlorine species were either KCl(s) or HCl(g). The exposures were performed in the tube
furnace.
KCl(s) was deposited on the sample surface ex-situ by spraying a saturated solution of KCl(s) in
a 20:80 volume ratio water-ethanol mixture and dried with warm air. The amount of salt
deposited on each sample was 0.1 mg/cm2. The sample was weighed, sprayed on both sides, and
weighed again to achieve the intended amount of salt. For the exposures in the presence of
HCl(g), the gas was supplied continuously during exposure from a gas mixture of 1% HCl and
99% N2.

35
Figure 26. Tube furnace exposure setup.
The exposures were performed isothermally in horizontal silica tube furnaces, see Figure 26. The
parameters for each exposure are shown in Table 6. The temperature was calibrated with an
accuracy of ±1 °C. The reaction atmosphere flowed parallel to the sample surfaces. The flow rate
was 2.5 cm/s, and the gas flow was calibrated with a Bios Definer 220M. In order to prevent any
condensation of water in the system, all parts were kept over 100 °C. The samples were placed in
the centre of the furnace, mounted vertically on an alumina sample holder with a capacity for
three samples.
Pre-oxidized samples in the absence of chlorine species were also exposed and analysed as
reference. A summary of the experimental matrix is shown in Table 6. The samples were
characterized by means of SEM, XRD, IC, and gravimetry.
Material System
Pre-Oxidation Chlorine exposure
Atmosphere Temperature
(°C) Time Atmosphere
Temperature (°C)
Time
T22
Tube furnace
5% O2 + 95% N2
400 24
hours
5% O2 + 20% H2O + 75% N2 +
0.1 mg/cm2 KCl
400 24
hours
5% O2 + 20% H2O +
75% N2 500 12 hours
5% O2 + 20% H2O +
75% N2 + 0.1 mg/cm2
KCl
400 1, 24,
48, 168 hours
5% O2 + 20% H2O +
75% N2 600
40 minute
s
5% O2 + 20% H2O + 75% N2 +
0.1 mg/cm2 KCl
400 1, 24,
48, 168 hours
5% O2 + 20% H2O +
75% N2
700 7
minutes
5% O2 + 20% H2O + 75% N2 +
0.1 mg/cm2 KCl
400 1, 24
hours
347H
5% O2 + 95% N2 + 1.34 µmol K+/cm2 (K2CO3)
600 168
hours
5% O2 + 20% H2O + 75% N2 +
0.1 mg/cm2 KCl
600 24
hours

36
5% O2 + 95% N2 + 1.34 µmol K+/cm2 (K2CO3)
600 168
hours
5% O2 + 20% H2O +
500 ppm HCl + 74.5% N2
600 24
hours
FeCr-0%Ni
Thermobalance
5% O2 + 95% N2 + 13.4 µmol
K+/cm2 (K2CO3)
600 5-8
hours
FeCr-5%Ni
5% O2 + 95% N2 + 13.4 µmol K+/cm2 (K2CO3)
600 16-20 hours
FeCr-10%Ni
5% O2 + 95% N2 + 13.4 µmol K+/cm2 (K2CO3)
600 40-90 hours
Table 6. Laboratory exposure parameters.
37
7 _____________________________________________
Analytical techniques
Several analytical techniques were used to characterize the samples produced for this study.
Usually it is necessary to have more than one analytical technique to analyse the oxidation
behaviour of a material since each technique characterizes different aspects of the material. A
more complete and clear view of the problem can be achieved and processed if all information
obtained from different analytical techniques is used.
7.1 Thermogravimetry
The change in weight of a material during oxidation can be used to interpret and measure
oxidation rate. In order to calculate oxidation rate, the weight of a sample is recorded before and
after exposure and normalized to its surface area. For this study, the weight change of samples
was recorded using a SartoriusTM balance with microgram resolution. After the data is plotted in
a mass change versus time graph, it is possible to interpret the behaviour of the samples in the
system. In order to obtain good statistics with this technique, several samples were exposed for
specific time periods. This technique was mainly used for isothermal laboratory exposures
performed in tube furnaces. Due to the aggressive environments used in some of the exposures,
spallation of the oxide scale occurred, making weighing after exposure unreliable.
In-situ exposures were also performed. The weight change of the samples was recorded while
the exposure was taking place with a Setaram Setsys Evolution® thermobalance. In this way, it
was possible to follow the kinetics of the different alloys during oxidation.
Thermogravimetry was omitted for field exposures due to the loss of deposit material and
corrosion products that occurred when the samples were taken out from the boiler.
7.2 Microscopy
Imaging techniques are commonly used to characterize samples in corrosion studies. From the
imaging of a sample, it is possible to extract valuable information, such as the microstructure of
the alloy before exposure and the morphology of the corrosion attack.
The techniques used in this study were optical and electron microscopy. Optical microscopy was
used to characterize the material prior to exposure. Information such as initial microstructure
including grain size was obtained. The optical microscope produces an image using photons that
hit a sample surface. The main limitation of this technique is its low resolution and

38
magnification, which is a physical limitation imposed by the light wavelength. The average
resolution of an optical microscope is about 0.25 µm. This limitation can be compensated with
the use of scanning electron microscopy.
7.2.1 Scanning Electron Microscopy / Energy Dispersive X-rays
(SEM/EDX)
Scanning electron microscopy combined with energy dispersive x-rays analysis was used in order
to achieve detailed imaging and analysis of the samples. Electron microscopy offers higher
resolution and, therefore, higher magnifications than optical microscopy. When operated in a
high-resolution setup, resolutions of about 1-2 nm can be reached. This is due to the interaction
of the electrons with the sample. The principle of the microscope is that a focused electron beam
bombards a sample surface. The electron beam interacts with the sample and generates several
signals that come from different escape depths. The generated signals are secondary electrons
(SE), backscattered electrons (BSE), characteristic x-rays, and Auger electrons, among others.
The detection of these signals provides valuable information. Different information comes from
different depths of the incident beam/material region. Figure 27 shows the generated signals
and depth range in a sample.
Figure 27. Interaction volume and signals generated in the SEM.
SEs have low energy (<50 eV) and escape from a small interaction volume, which gives good
resolution (approximately 1-5 nm). SEs are often used to obtain information about the
topography of a sample surface [75]. BSEs have higher energies, which means that they have
escaped from larger volumes, i.e. with lower spatial resolution. Due to the high energy of BSEs,
it is possible to obtain compositional contrast. The bright areas in a BSE image correspond to a
high average atomic number, and darker areas correspond to a low average atomic number [75]
or, in some cases, voids. Figure 28 shows the difference between the two detectors.

39
Figure 28. SEM images of a sample using backscattering electron (BSE) and secondary electron (SE) detectors.
Electron channelling contrast
Electrons in crystalline materials penetrate at different depths depending on the lattice
orientation. When the incoming electrons meet the low density of atoms in the lattice, the
electrons penetrate to different depths inside the crystal before being scattered. For this reason,
the term channelling is used because the crystal lattice is considered a group of different paths
or channels where the electrons preferably penetrate to different depths before scattering.
Depending on the orientations of the crystal, electrons are scattered, resulting in an orientation
contrast effect [76, 77]. The following figure shows examples of the trajectories of incoming
electrons, different scattering depths, and the resulting image contrast that clearly reveals the
metal and oxide microstructures.
Figure 29. Schematic drawing of the trajectories of incoming electrons into the atomic lattice. Based on Kamaladasa and Picard [76]; ion image of pre-oxidized low-alloyed steel Fe-2.25Cr-1Mo. Preparation and imaging by A. Persdotter.

40
Energy dispersive x-ray
In addition to SEM imaging, this technique can perform chemical analyses of selected areas
and/or points on a material surface. One of the signals generated by the interaction of the
electron beam with the material is the characteristic x-ray, which is emitted from deeper parts
of the interaction volume. The emission of x-rays occurs when a high-energy electron transfers
enough energy to release an electron from an inner shell. The atom can relax by emitting a
proton. The specific energy of the emitted proton is coupled to the atom, which makes it possible
to perform chemical analyses. This method is called energy dispersive x-ray spectroscopy (EDX).
The instruments used in this work were a SEM/EDX FEI Quanta 200 equipped with an Oxford
Instruments X-MaxN 80 T EDX detector and a SEM Zeiss Ultra 55.
7.2.1 Transmission Electron Microscopy (TEM)
Transmission electron microscopy is considered a powerful tool to investigate microstructural
features with high-resolution. The principle of the STEM is that the electrons detected after a
focused electron beam bombards a thin sample (20-200 nm) are the electrons transmitted
through the sample. Therefore, the requirements of sample preparation for STEM are of high
standards, since the sample must be thin enough to be electron transparent. The preparation of
samples was performed in a FIB/SEM workstation. Besides the preparation of a thin sample, the
STEM is operated at a higher accelerating voltage (~300 keV) than the SEM 10-20KeV operation.
STEM can be used for imaging and chemical analysis and also to obtain crystallographic
information on the sample [78]. In this study, all preparation and STEM analyses were performed
by A. Persdotter and Ph.D. Mohammad Sattari.
The TEM was operated in scanning TEM mode (STEM), which combines the TEM and SEM
principles. The STEM mode consists of scanning a finely focused electron beam through the
sample in a raster pattern, allowing the improvement of spatial resolution compared to SEM
imaging [79]. For imaging, both the bright field (BF) imaging mode and high-angle annular dark
field (HAADF) mode were used. The BF images are produced from detected unscattered
electrons that are filtered from the scattered electrons by the objective aperture. The images
obtained with this mode show bright areas that represent elements of low atomic number and
thin regions as well as holes due to less scattering of electrons [78]. In contrast, the dark field
mode uses the scattered electrons. Thus, regions that scatter fewer electrons appear dark, and
dense regions or regions with high atomic number appear bright. The HAADF mode uses the
incoherently scattered electrons detected from high angles. The compositional contrast is
enhanced by using high-angle detection [80].
The instruments used in this work were an SEM/EDX FEI Quanta 200 equipped with an Oxford
Instruments X-MaxN 80 T EDX detector and an SEM Zeiss Ultra 55, and an FEI Titan 80-300 TEM
with a field emission gun, and an Oxford X-sight EDX detector.
7.3 Focused ion beam (FIB/SEM)
A FIB workstation can be used as a microscope and a precision miller. In imaging mode, a FIB is
similar to an SEM, however, a FIB microscope uses ions instead of electrons. The use of ions for

41
imaging can result in a drawback since incident ions are highly energetic and sputter material
away. However, for the same reason, ions have the potential to modify (mill) the sample surface
with nanometre precision. An ion beam consists of gallium ions. In order to prepare cross-
sectional views of a sample without mechanical cutting, the sample was tilted 7° since the ion
beam tilts 52°. Thus, a 45° cross section relative to the sample surface was achieved. For imaging,
the sample was tilted 45° in the other direction, as Figure 30 shows. This method can be used to
prepare a one-sided cross section for SEM and thin film lift-outs for transmission electron
microscopy (TEM).
The FIB used for this research was equipped with an additional SEM column; the instrument
with both columns is called a FIB/SEM. In this way, the instrument is capable of imaging and
removing material within a very accurate range. Site-specific cross sections were made by FIB
milling using an FEI Versa 3D DualBeam instrument. A comparison of resolutions between SEM
images of a broad ion beam milled sample and a focused ion beam milled sample characterized
in the Dualbeam FIB is shown in Figure 30. In this study, all FIB preparation and imaging were
performed by A. Persdotter, Ph.D. Imran Hanif, and Ph.D. Mohammad Sattari.
Figure 30. Schematic drawing of the FIB/SEM workstation. Comparison of resolution images between: a) SEM and b) FIB/SEM workstations. Preparation and imaging by Ph.D. M. Sattari.

42
7.4 Broad ion beam (BIB)
Broad ion beam cross sectioning was used to prepare a high-quality wide cross section of the
exposed samples. This method offers accurate preparation, revealing internal structures in a
wide variety of materials. The BIB cross sectioning used in this study consisted of three
individually controlled ion beams (argon ions), a rotary stage, and a mask plate. A cut sample
was attached to the sample holder and placed on the rotatory stage. The stage was adjusted to
place a part of the sample just above the edge of the mask, see Figure 31. The ion beam, which
was aligned perpendicular to the edge of the mask, hit the visible part of the sample. The ions
removed material while the mask protected the rest of the sample. Over time, the process results
in a clean cross section of the sample area behind the mask edge.
Figure 31. Broad ion beam: schematic drawing of BIB milling process. BSE image of BIB milled cross section.
BIB cross sectioning is a great advantage compared to mechanical preparation especially for
samples containing species that are water soluble. This method is also capable of preparing wide
areas, which give more representative statistics for analysis.
7.5 X-ray diffraction (XRD)
X-ray diffraction was used to identify the crystalline phases present in the material. This
technique is based on constructive interference between x-rays and the crystalline structure of
a material. X-ray diffraction is a process in which constructive interferences are produced in
different directions. The diffraction results when the incident x-rays beam angle satisfies Bragg’s
law (see Equation 22, Figure 32). Braggs’s law correlates the angles, θ, at which the scattered x-
rays interfere constructively with the crystal planes spacing, 𝑑ℎ𝑘𝑙, for a given wavelength, λ.
2𝑑ℎ𝑘𝑙 ∙ 𝑠𝑖𝑛𝜃 = 𝑛𝜆 (23)

43
Figure 32. Illustration of Bragg’s law.
Several XRD setups are available for different applications when this basic XRD fundament is
used. The Grazing Incidence (GI) setup was used in this study. The x-ray source was fixed to a
low angle of incidence to minimize the penetration depth of the electron beam and avoid bulk
interaction. The moving detector mapped the diffraction intensities along a range of angles. A
database of known crystal compounds was used to identify the phases present in the sample.
The following figure shows a schematic illustration of the GI setup.
Figure 33. Grazing incidence setup.
A Siemens D5000 powder diffractometer with a Göbel mirror was used in this study. The
radiation employed was a characteristic Cu Kα radiation (λ = 1.54178 Å). The radiation was
generated by a copper anode x-ray tube. The measuring range was 10° < θ < 70°. The incidence
angles were 0.3 – 1° and 5 - 10° for laboratory samples and field samples, respectively.
7.6 Ion chromatography (IC)
Quantification of different compounds, such as chlorides and sulphates, is of great interest for a
corrosion study of the metallic parts of a boiler. Ion chromatography is an analytical tool used
to quantify water-soluble ions present in a sample based on ionic exchange.
The exposed samples were leached in a known volume of Milli-Q water. The dissolved ions
passed through a column with a stationary phase consisting of ionic functional groups. Thus,
the ions in the mobile phase interacted with the stationary phase. Depending on the valence of
the ions, they will be retained either strongly or weakly by the stationary phase, resulting in the
separation of the ions (Figure 34). Small monovalent ions, such as chloride, will elute earlier
from a column than large divalent ions, such as sulphates. A detector at the end of the column
recorded the conductivity from the separated ions and plotted them against time. The results
were compared to a standard solution curve with known concentrations. This technique

44
analyses anions and cations separately, and only anions were analysed in this study. The
preparation and analysis of samples were performed with the help of Ph.D. Loli Paz.
The equipment used was a Dionex ICS-90 Ion Chromatography system equipped with an IonPac
AS4A-SC analytic column. The eluent was a 1.8 mM sodium carbonate/1.7 mM sodium
bicarbonate. The flow rate was 2 mL/min.
Regarding the sample preparation, the exposed samples were leached in 10 mL of Milli-Q water
using an ultrasonic bath for 10 minutes. The leaching procedure was performed twice for each
sample, resulting in two solutions that were combined and filtered before IC analysis.
Figure 34. Schematic diagram of ion chromatography analysis process. Representation of correlation between elution time with output peak data [81].
7.7 Thermodynamic modelling
Thermodynamic modelling is an important tool that can be used for predicting the
thermodynamic properties of materials such as driving forces and phase fraction under different
conditions. The thermodynamic models used in the Calphad approach (CALculation of PHAse
Diagrams) are phenomenological, i.e. functions of temperature, pressure, and chemical
composition.
The principle of this method is to set the number of degrees of freedom to zero according to the
Gibbs phase rule. The degrees of freedom are the number of variables (pressure, temperature,
and composition fraction) that can be changed to have a specific number of phases at
equilibrium. Once the number of degrees of freedom is zero, the set of stable phases at

45
equilibrium is the one with the lowest Gibbs energy, which is predicted by the computer
programs. These software, e.g. Thermo-Calc/Dictra, Factsage, etc., find the stable phases by
minimizing the Gibbs energy in a space of such variables.
The Calphad software can calculate and predict multi-component phase diagrams of systems by
extrapolating lower order systems to higher order ones.
In this study, Thermo-calc software, version 2018b, and Fe-based alloy database TCFE9 were
used to predict the expected phases, i.e. the microstructure of the model alloys. The calculations
were performed by Ph.D. Sedigheh Bigdeli.
7.8 Density functional theory (DFT) calculations
Density functional theory can be used in different models to study specific issues of corrosion
processes on the basis of quantum mechanics. DFT can determine the energies of electronic
systems in terms of functionals (functions of another function) such as spatially dependent
electron density. The DFT procedure is an alternative to the solution to the Schrödinger
equation of. It is based on two theorems by Hohenberg and Kohn. These theorems demonstrate
that quantum mechanical properties can be obtained by electron density instead of electron
position, and that the ground state energy of a system is given by the ground state density. The
further development of the theorems was done by Kohn and Sham which is an approximation
to obtain the so-called Kohn-Sham orbital that allows the calculation of a new electron density.
Figure 35 shows the flow chart of the iterative procedure followed in DFT to calculate the total
energy of an electronic system.
Figure 35. Flow chart of the iterative procedure to calculate the total energy of a system as a function of electron density.

46
The CASTEP program package in the Material Studios framework [82] was utilized, and the PBE
GGA functional [83] was employed for all the spin-polarized calculations. The calculations were
performed by Ph.D. Valentina Cantatore.
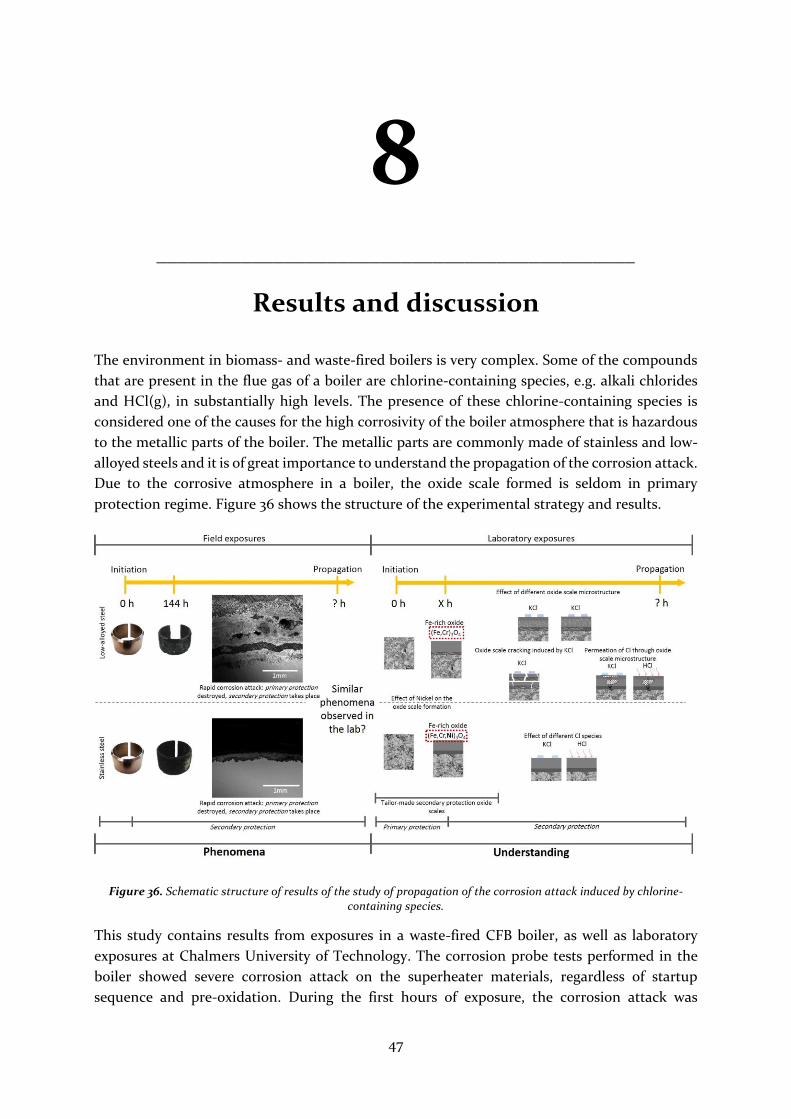
47
8 _____________________________________________
Results and discussion
The environment in biomass- and waste-fired boilers is very complex. Some of the compounds
that are present in the flue gas of a boiler are chlorine-containing species, e.g. alkali chlorides
and HCl(g), in substantially high levels. The presence of these chlorine-containing species is
considered one of the causes for the high corrosivity of the boiler atmosphere that is hazardous
to the metallic parts of the boiler. The metallic parts are commonly made of stainless and low-
alloyed steels and it is of great importance to understand the propagation of the corrosion attack.
Due to the corrosive atmosphere in a boiler, the oxide scale formed is seldom in primary
protection regime. Figure 36 shows the structure of the experimental strategy and results.
Figure 36. Schematic structure of results of the study of propagation of the corrosion attack induced by chlorine-containing species.
This study contains results from exposures in a waste-fired CFB boiler, as well as laboratory
exposures at Chalmers University of Technology. The corrosion probe tests performed in the
boiler showed severe corrosion attack on the superheater materials, regardless of startup
sequence and pre-oxidation. During the first hours of exposure, the corrosion attack was

48
characterized by a rapid formation of a secondary protection scale on all the tested materials.
Therefore, field exposures were performed with a focus on the influence of the secondary
protection scale on the propagation of a corrosion attack since this oxidation stage would have
a large impact on the life time of the components. Laboratory exposures were performed in order
to generate knowledge on the phenomena observed in the field exposures. The laboratory
exposures focused on the mechanistic study of the propagation of the corrosion attack induced
by the presence of chlorine-containing species in the atmosphere, i.e. the role of chlorine in the
secondary protection mode.
8.1 Field exposures
8.1.1 Startup effect
Corrosion tests commonly consist of using an air-cooled probe to control the temperature of the
material to be tested. The probes are inserted at a specific position in the boiler, normally at
places where a more aggressive corrosion attack has been registered. In this way, the test
materials are taken from room temperature to the test temperature (commonly around 400 to
600 °C). Due to the constant flux of flue gas in a boiler, the test materials might be affected
during the period of time necessary for the material to reach the set temperature. This can lead
to condensation of water and, subsequently, the presence of water-soluble species at the
material surface that might promote a more aggressive corrosion attack. Therefore, this part of
the study addresses the startup sequence of corrosion tests and the initiation of corrosion.
A series of exposures were performed in the waste-fired boiler, P15, in Norrköping, Sweden. A
description of the boiler is given in Section 6.1.2. The material selected for the test was the
stainless-steel Sanicro 28 (see chemical composition in Table 1). Pre-oxidized and non-pre-
oxidized samples were exposed. The pre-oxidation was performed in a box furnace at 700 °C
during 24 hours prior to the boiler exposure.
For this test, two probes were used simultaneously. The probes had three temperature zones:
600, 500, and 400 °C. Pre-oxidized and non-pre-oxidized ring samples were placed in each
temperature zone of the probes. One of the probes was pre-heated prior to exposure, which was
done to avoid any condensation at the sample surfaces and to investigate if this startup sequence
has an effect on the corrosion attack. The exposure time was set to 24 hours.
In addition, a test probe was exposed during 15 minutes. The exposure time included
temperature ramping until the material reached 600 °C. The purpose of this exposure was to
analyse the deposit formed during the first minutes of the exposure, i.e. during the heating up
of the test material. A cross section of the sample after exposure with the EDX map of the deposit
is shown in Figure 37. The EDX map shows that the deposit mainly contained chlorine and
calcium along with some traces of potassium and sulphur. This suggests the rapid deposit of
chlorine-containing species that are in direct contact with the metal surface from the first
minutes of exposure.

49
Figure 37. EDX mapping from cross section of sample exposed 15 minutes, material temperature 600 °C; cold testing probe.
The pre-heated test probe was inserted in the boiler after all three zones had reached over 100
°C during pre-heating prior to the exposure. The two probes were inserted simultaneously.
According to temperature measurements, the time to reach the set exposure temperature was
similar for both probes (7 minutes to 600 °C). However, since the cold probe started from a lower
temperature than the pre-heated probe, it exhibited a higher heating rate (heating rates to 600
°C: cold probe=82 °C/min; pre-heated probe=68 °C/min), and consequently, water was expected
to condense on the sample surfaces.
The non-pre-oxidized samples suffered spallation, especially at 500 and 600 °C. All the pre-
oxidized samples maintained a well-adhered deposit after exposure. Further discussion will
focus on samples exposed at 600 °C.
Figure 38 shows cross sections of samples from the cold and pre-heated probes exposed at 600
°C. After 24 hours of exposure, the formed oxide scale detached from the samples placed on both
cold and pre-heated test probes. However, it was observed that the sample exposed on the cold
probe showed a deep corrosion attack of about 250 µm in the metal, whereas the attack on the
pre-heated sample reached about 100 µm in the metal. The presence of metal chlorides was
detected for both samples. Enrichment of Ni was observed at the inward-growing oxide, which
is typical behaviour of stainless steels [41].

50
Figure 38. BSE image of cross section of samples exposed for 24 hours, material temperature 600 °C; (a) cold testing probe, (b) pre-heated testing probe.
The presence of metal chlorides was detected on the pre-oxidized sample exposed on the pre-
heated test probe. The deposit appeared to remain adherent to the metal surface, see Figure 39.
This indicates that the pre-oxidation that occurred prior to exposure had a minor beneficial
effect on the initial corrosion behaviour of the samples.
Figure 39. BSE image of cross section of pre-oxidized sample exposed for 24 hours, material temperature 600 °C; pre-heated test probe.
The results suggest that, regardless of the startup sequence of the corrosion test performed, all
the materials experienced breakaway corrosion, i.e. were secondary protection regime, during
the first 24 hours of exposure. It was observed that the material suffered an aggressive corrosion
attack. After these observations, a second campaign of field exposures was carried out, where
the pre-oxidation was performed in a controlled way to study the influence of a further corrosion
attack.
8.1.2 The influence of secondary protection on field exposures
The rapid formation of a secondary protection oxide scale was expected for the steel components
of the boiler due to the aggressive environment in which these components are exposed.
Therefore, the influence of secondary protection oxide scale was investigated. Well-controlled
pre-oxidation was performed on samples of a stainless-steel 347H sample, see Table 1, prior to
exposure in the boiler. The secondary protection oxide scale consisted of an outward-growing
Fe-rich oxide and an inward-growing Fe,Cr,Ni spinel oxide. A total of 4 samples were exposed; 2
pre-oxidized and two non-pre-oxidized (as reference) for 24 and 144 hours.
After exposure, cross sections of the samples were prepared. The SEM image in Figure 40 shows
the corrosion attack of the sample after a 144-hour exposure. A severe and widely spread
corrosion attack was observed on the flue gas side of the sample. Cracks in the formed oxide and
the initiation of a grain boundary attack were observed. In some regions, the extent of the grain
boundary attack was so extensive that part of the metal seemed to be defragmented. These
observations have previously been made in studies of the commercial stainless steels used in

51
boilers [16]. The presence of metal chlorides was detected on the corrosion product layer and at
the corrosion product/metal interface.
Figure 40. BSE image of cross section of 347H sample after 144-hour exposure.
Pre-oxidized 347H samples were also exposed. After 144 hours of exposure, there were regions where the pre-formed oxide layer and the deposit remained attached. In the SEM image of the pre-oxidized sample cross section, see Figure 41(a), no grain boundary attack was observed. The metal below the pre-formed oxide layer did not suffer from a corrosion attack. This suggests that a controlled formation of a secondary protection scale had a beneficial effect on the corrosion attack. Nevertheless, regions where the pre-formed oxide layer was lost, a severe corrosion attack and metal chlorides were observed, see Figure 41(b). In these regions, chlorine was detected below the corrosion product layer and at the metal where the grain boundary corrosion was observed. This indicates that chlorine was able to diffuse through the pre-formed secondary protection oxide scale, reaching and reacting with the metal.
Figure 41. Pre-oxidized 347H sample after 144-hour exposure; (a) region where the pre-formed oxide scale remained; (b) region where the pre-formed oxide scale was lost.
8.2 Laboratory exposures
Subsequent to the observations made in the field exposures, see Figure 36, laboratory exposures
were performed to investigate the formation, as well as the influence, of the secondary

52
protection oxide scale and to investigate the transport of chlorine through this oxide layer during
the propagation of a corrosion attack.
The role of chlorine in the propagation step and its transport through the oxide scale are still
under debate. Many authors have studied the effect of chlorine in the corrosion attack. Section
5 describes the corrosion mechanisms proposed to explain the accelerated corrosion rate [8, 29,
30, 40, 47, 48, 51, 65-67, 69, 70, 72, 84-90]. However, most of these studies have focused on the
initial stages of the chlorine-induced corrosion and not on the transport of chlorine through the
oxide scale.
In order to investigate the transport of chlorine through the oxide scale, well-known oxide scales
were formed prior to exposure in the presence of chlorine-containing species, see Figure 36. The
pre-oxidation step was intended to mimic the corrosion process that occurs during the early
stage of boiler operation when, due to the aggressive environment, the secondary protection
scale forms early on. This provides a different starting point for the chlorine-induced corrosion
mechanism.
8.2.1 Pre-oxidation: Secondary protection
Due to the aggressive environment present in the boiler, breakaway oxidation and the formation
of a secondary protection oxide scale appears fast. It is, therefore, important to investigate the
propagation of a corrosion attack after the formation of a secondary protection oxide scale, i.e.
corrosion after breakaway oxidation.
The following section describes the pre-oxidation procedures performed to obtain tailor-made
oxide scales that were subsequently exposed to chlorine-containing atmospheres.
Pre-oxidation of stainless steel (Pre-oxidation K2CO3-168h)
Stainless steels are known to form a primary protection oxide scale, which consists of a
protective Cr-rich oxide. This oxide is good to withstand further corrosion in relatively mild
environments. However, in the presence of a highly corrosive atmosphere, e.g. alkali chlorides
and water vapour, the primary protection layer is destroyed, allowing the growth of a secondary
protection oxide scale (Fe-rich oxide). With this knowledge, it is possible to form a well-defined
Fe-rich oxide scale on a stainless steel surface.
In this study, the stainless steel 347H (see chemical composition in Table 1) was pre-oxidized to
obtain an oxide scale defined by an outward-growing Fe-rich oxide and an inward-growing
spinel oxide, i.e. the secondary protection. The pre-oxidation atmosphere consisted of 5% O2
and 95% N2 at 600 °C during 168 hours. In order to accelerate the breakdown of the primary
protection oxide, 1.35 µmol K+/cm2, in the form of K2CO3, was deposited prior to exposure. K2CO3
was selected as the deposit in order to accelerate the primary protection breakdown without the
presence of chlorine. An exposure time of 168 hours was selected to ensure complete coverage
of the substrate by the oxide scale. The pre-oxidation parameters were selected based on the
earlier work of Pettersson, et al. [51], Jonsson, et al. [91], and Lehmusto, et al. [86].
Figure 42 shows the resulting oxide scale. The scale was dense and well adherent to the substrate
with a thickness of about 5-6 µm. The formation of K2CrO4 was promoted by the presence of the
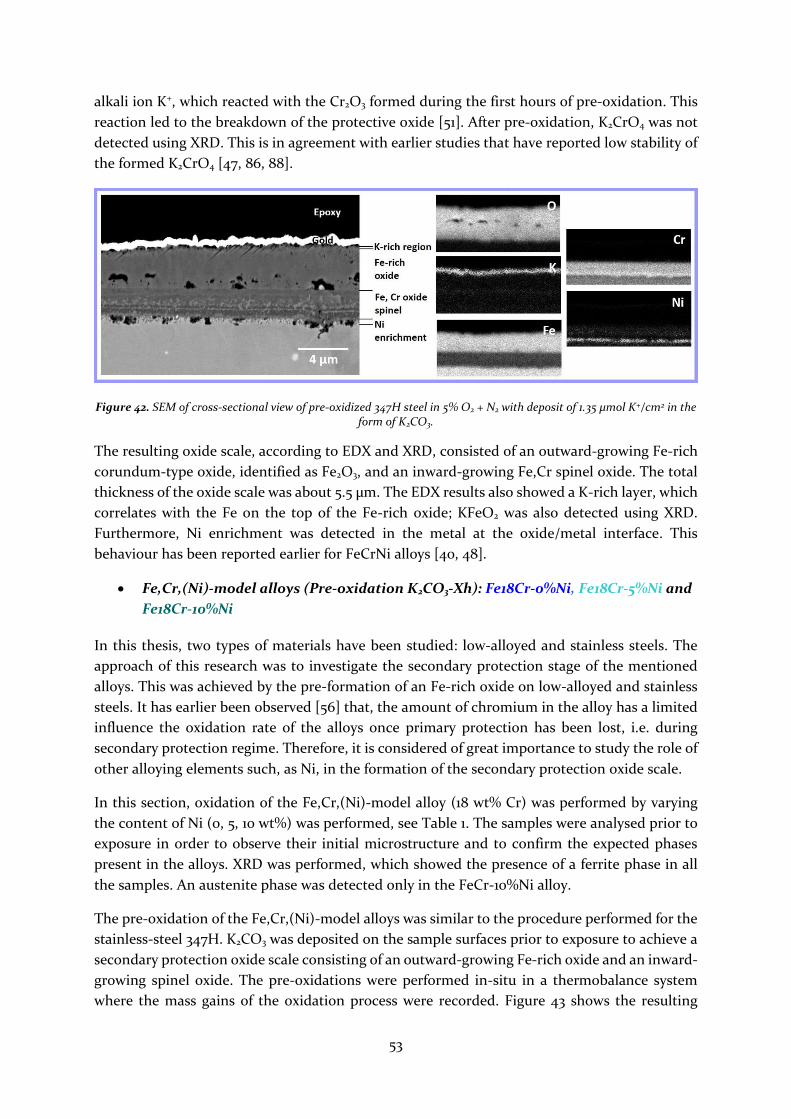
53
alkali ion K+, which reacted with the Cr2O3 formed during the first hours of pre-oxidation. This
reaction led to the breakdown of the protective oxide [51]. After pre-oxidation, K2CrO4 was not
detected using XRD. This is in agreement with earlier studies that have reported low stability of
the formed K2CrO4 [47, 86, 88].
Figure 42. SEM of cross-sectional view of pre-oxidized 347H steel in 5% O2 + N2 with deposit of 1.35 µmol K+/cm2 in the form of K2CO3.
The resulting oxide scale, according to EDX and XRD, consisted of an outward-growing Fe-rich
corundum-type oxide, identified as Fe2O3, and an inward-growing Fe,Cr spinel oxide. The total
thickness of the oxide scale was about 5.5 µm. The EDX results also showed a K-rich layer, which
correlates with the Fe on the top of the Fe-rich oxide; KFeO2 was also detected using XRD.
Furthermore, Ni enrichment was detected in the metal at the oxide/metal interface. This
behaviour has been reported earlier for FeCrNi alloys [40, 48].
Fe,Cr,(Ni)-model alloys (Pre-oxidation K2CO3-Xh): Fe18Cr-0%Ni, Fe18Cr-5%Ni and
Fe18Cr-10%Ni
In this thesis, two types of materials have been studied: low-alloyed and stainless steels. The
approach of this research was to investigate the secondary protection stage of the mentioned
alloys. This was achieved by the pre-formation of an Fe-rich oxide on low-alloyed and stainless
steels. It has earlier been observed [56] that, the amount of chromium in the alloy has a limited
influence the oxidation rate of the alloys once primary protection has been lost, i.e. during
secondary protection regime. Therefore, it is considered of great importance to study the role of
other alloying elements such, as Ni, in the formation of the secondary protection oxide scale.
In this section, oxidation of the Fe,Cr,(Ni)-model alloy (18 wt% Cr) was performed by varying
the content of Ni (0, 5, 10 wt%) was performed, see Table 1. The samples were analysed prior to
exposure in order to observe their initial microstructure and to confirm the expected phases
present in the alloys. XRD was performed, which showed the presence of a ferrite phase in all
the samples. An austenite phase was detected only in the FeCr-10%Ni alloy.
The pre-oxidation of the Fe,Cr,(Ni)-model alloys was similar to the procedure performed for the
stainless-steel 347H. K2CO3 was deposited on the sample surfaces prior to exposure to achieve a
secondary protection oxide scale consisting of an outward-growing Fe-rich oxide and an inward-
growing spinel oxide. The pre-oxidations were performed in-situ in a thermobalance system
where the mass gains of the oxidation process were recorded. Figure 43 shows the resulting

54
kinetics of three different Fe,Cr,(Ni)-model alloys. The pre-oxidation had an intended mass gain
equivalent to a calculated thickness of approximately 5 µm.
Figure 43. Pre-oxidation of model alloys: Fe18Cr-0%Ni, Fe18Cr-5%Ni, and Fe18Cr-10%Ni; calculated oxide thickness vs exposure time.
Different behaviours were observed with increasing nickel content. The Fe18Cr-0%Ni model
alloy presented the most rapid oxidation rate; the primary protection was lost within the first
minutes of exposure leading to fast growth of an Fe-rich oxide. The oxidation rate of the Fe18Cr-
10%Ni model alloy was the slowest of the three alloys, with an incubation time of approximately
8 hours prior to the breakaway of the primary protection. The growth rate of the secondary
protection oxide scale was slower than the scales formed by the Fe18Cr-0% and Fe18Cr-5%Ni. In
Figure 44, the cross-sectional views of the resulting oxide scales are shown.
Figure 44. Cross sections of model alloys a) Fe18Cr-0%Ni (90° cut,0° tilt) , b) Fe18Cr-5%Ni (90° cut, 0° tilt), and c) Fe18Cr-10%Ni (45° cut, 38° tilt) exposed to 5%O+95%N2 with deposit of 13.5 µmol K+/cm2 in the form of K2CO3 at
600°C, prepared and imaged with FIB milling. Preparation and imaging by A. Persdotter and Ph.D. I. Hanif.
The oxide scales morphology was characterized and interpreted as a two-layered oxide with an
average total thickness in the range of 3-6 µm. The top layer was identified as an outward-
growing Fe2O3 oxide. The bottom layer was spinel oxide, which was expected to differ depending
on the content of Ni in the alloy. The growth of the inward-growing spinel oxide in the Fe18Cr-
0%Ni seemed to be uniform. A region below the spinel oxide was observed; the morphology was
similar to the one reported for reaction zones [56]. In contrast, the inward-growing spinel oxide
in the Fe18Cr-5%Ni and Fe18Cr-10%Ni seemed to be thin (0.5-1 µm), however, some in regions
thick spinel oxide was found (1,5-3 µm), see Figure 44.
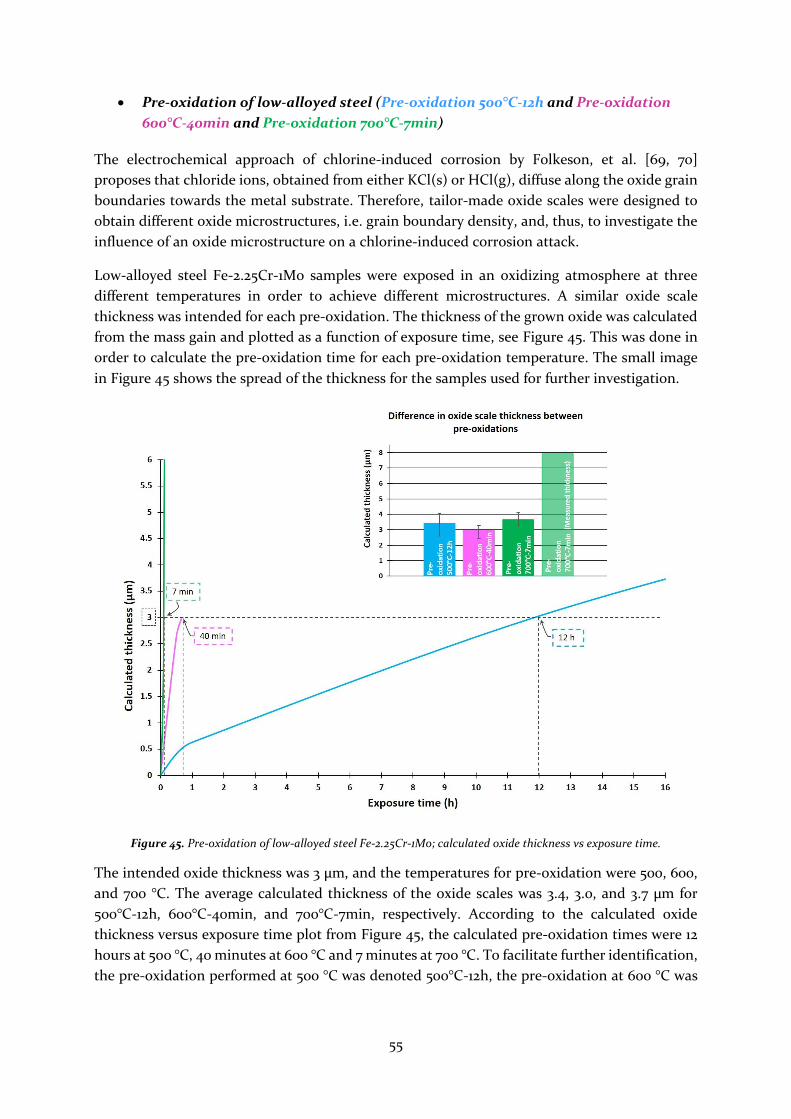
55
Pre-oxidation of low-alloyed steel (Pre-oxidation 500°C-12h and Pre-oxidation
600°C-40min and Pre-oxidation 700°C-7min)
The electrochemical approach of chlorine-induced corrosion by Folkeson, et al. [69, 70]
proposes that chloride ions, obtained from either KCl(s) or HCl(g), diffuse along the oxide grain
boundaries towards the metal substrate. Therefore, tailor-made oxide scales were designed to
obtain different oxide microstructures, i.e. grain boundary density, and, thus, to investigate the
influence of an oxide microstructure on a chlorine-induced corrosion attack.
Low-alloyed steel Fe-2.25Cr-1Mo samples were exposed in an oxidizing atmosphere at three
different temperatures in order to achieve different microstructures. A similar oxide scale
thickness was intended for each pre-oxidation. The thickness of the grown oxide was calculated
from the mass gain and plotted as a function of exposure time, see Figure 45. This was done in
order to calculate the pre-oxidation time for each pre-oxidation temperature. The small image
in Figure 45 shows the spread of the thickness for the samples used for further investigation.
Figure 45. Pre-oxidation of low-alloyed steel Fe-2.25Cr-1Mo; calculated oxide thickness vs exposure time.
The intended oxide thickness was 3 µm, and the temperatures for pre-oxidation were 500, 600,
and 700 °C. The average calculated thickness of the oxide scales was 3.4, 3.0, and 3.7 µm for
500°C-12h, 600°C-40min, and 700°C-7min, respectively. According to the calculated oxide
thickness versus exposure time plot from Figure 45, the calculated pre-oxidation times were 12
hours at 500 °C, 40 minutes at 600 °C and 7 minutes at 700 °C. To facilitate further identification,
the pre-oxidation performed at 500 °C was denoted 500°C-12h, the pre-oxidation at 600 °C was

56
denoted 600°C-40min, and the pre-oxidation at 700 °C was denoted 700°C-7min, see Table 7.
SEM images of cross sections of the obtained oxide scales are shown in Figure 46.
Figure 46. Cross sections of Fe-2.25Cr-1Mo exposed to 5%O+20%H2O+N2 at 500°C-12h, 600°C-40min, and 700°C-7min, prepared with BIB and imaged with FIB milling. Preparation and imaging by A. Persdotter.
The surface morphology of the 500°C-12h sample showed a needle formation, typical of Fe2O3
growth [28]. The 600°C-40min sample showed a smoother surface morphology, which was
observed by Pujilaksono for pure iron at 600 °C [28]. The 700°C-7min sample showed a surface
morphology similar to the 600°C-40min sample. All cross sections showed a three-layered oxide
scale consisting of an outward-growing Fe2O3 top layer, an Fe3O4 middle layer, and an inward-
growing (Fe,Cr)3O4 spinel oxide. The average measured thickness of the oxide scales was 3.7, 3.1,
and 7.5 µm for 500°C-12h, 600°C-40min, and 700°C-7min respectively, see Figure 45. For the
700°C-7min sample, the discrepancy between the calculated and measured oxide thickness is
proposed to be due to formation of wüstite, which transformed into magnetite during the slow
cooling of the sample.
A summary of the performed pre-oxidations is given in Table 7. Names and colour codes were
assigned to each pre-oxidation procedure to facilitate the identification of pre-oxidations.
Footnotes can be found in the following pages to help keep track of the pre-oxidation
procedures. After pre-oxidation, the samples were exposed to chlorine in the form of KCl(s) or
HCl(g) in an atmosphere of 5% O2, 20% H2O, and 75% N2.
Material Pre-
oxidation name
Atmosphere Temperature Time Scale
thickness (measured)
Scale layers
347H K2CO3-168h
5%O2 + N2 + 1.35 µmol K+/cm2 (K2CO3)
600 °C 168 hours 5.9 µm
K-rich region; Fe2O3;
Fe,Cr,Ni spinel oxide;
Ni-rich region
500°C-12h 500 °C 11 hours 3.7 µm
Fe2O3; Fe3O4;
(Fe,Cr)3O4

57
Fe-2.25Cr-1Mo
600°C-40min 5%O2 +
20%H2O + N2
600 °C 40 minutes 3.1 µm
700°C-7min 700 °C 7 minutes 7.5 µm
Table 7. Pre-oxidation parameters and resulting scales prior to chlorine exposures.
8.2.2 The role of chlorine species in the corrosion attack of pre-
oxidized materials
The aim of this study is to investigate the transport of chlorine through a secondary protection
oxide scale. In order to do so, tailor-made oxides were pre-formed and characterized.
Subsequently, the pre-oxidized samples were exposed to chlorine-containing species, see Figure
36. The exposures were designed based on the different chlorine-induced corrosion mechanisms
explained in Section 5, where the transport of chlorine through an oxide scale remains unclear.
Exposure of pre-oxidized stainless steel 347H in presence of KCl(s) and
HCl(g)
Chlorine and chlorine-containing species are considered to be the most corrosive species inside
biomass- and waste-fired boiler environments. Therefore, several authors have studied chlorine-
induced corrosion attacks by selecting different types of chlorine species (alkali chloride or HCl)
[29, 51, 65-67, 69, 72]. To study the effect of different chlorine species on already corroded
samples, stainless steel 347H was pre-oxidized. KCl(s) and HCl(g) were selected as the chlorine-
containing species. For KCl(s) exposure, 0.1 mg/cm2 of the salt was deposited on the oxide
surface. After depositing the KCl(s), the samples were exposed at 600 °C during 24 hours. The
reaction atmosphere was 5% O2, 20% H2O balanced with N2 during 24 hours. When exposed in
the presence of HCl(g), the reaction atmosphere was 5% O2, 20% H2O, 500 ppm HCl(g), balanced
with N2 during 24 hours at 600 °C. Pre-oxidized samples in the absence of chlorine-containing
species were also exposed during 24 hours as reference. The mass gain of pre-oxidized 347H in
the presence of chlorine-containing species and the reference are shown in Figure 47.
Figure 47. Mass gains of pre-oxidized 347H after 24-hour exposure at 600 °C to 5%O2+20%H2O+N2 in presence of chlorine-containing species.

58
The surface morphology of the reference sample was similar to the resulting surface of the pre-
oxidation sample. The oxide scale consisted of the same layer as used for the pre-oxidized
sample. However, the reference sample presented a thicker oxide. The total thickness of the
scale was 6.7 µm, which is less than 1 µm thicker than the pre-oxidation oxide scale (measured).
Exposures in presence of KCl(s)
After exposure in the presence of KCl(s), the sample surface was covered with overgrown Fe-rich
oxide. No cracks were found on the sample surface. Rough oxide nodules were detected at the
locations of former KCl(s) particles.
EDX analysis of the cross section after KCl(s) exposure indicates the presence of potassium on
the top surface of the oxide, but no signal of chlorine was detected. This is consistent with the
sample surface after pre-oxidation with K2CO3, see Figure 42. Pettersson et al. [46] have reported
that the amount of remaining KCl(s) detected on an ex-situ KCl(s) deposited sample (same
molar amount as the one used in this study) was less than 1% after a 24-hour exposure at 600 °C.
This might imply that KCl(s) had evaporated from the oxide surface, which was observed by
Karlsson with a similar experimental setup [89].
𝐾𝐶𝑙(𝑠) → 𝐾𝐶𝑙(𝑔) (24)
The equilibrium partial pressure of KCl(g) over KCl(s) at 600 °C is 3.4 ppm. No metal chlorides
were detected at the oxide/metal interface, probably due to the vaporization of KCl(s). However,
the oxide scale grew up to 8 µm, and the oxide scale was thicker than the scale on the reference
sample the oxide. This might suggest acceleration of the corrosion rate when exposed in the
presence of KCl(s). However, it is not clear if the accelerated rate is promoted by K+ or Cl-.
The deposited amount of KCl(s) was fixed prior to the exposure. Assuming that the KCl(s) reacts
somehow with the oxide scale at 600 °C, any reaction that occurs is not as quick as the
vaporization of KCl(s). In contrast, if the pre-oxidized sample had been exposed in a system with
a continuous deposition of KCl(s) on the oxide surface, an accelerated corrosion rate and even
breakaway corrosion would be expected.
Exposures in presence of HCl(g)
Figure 48 shows the pre-oxidized sample exposed in the presence of HCl(g). The sample surface
morphology differs slightly from the corresponding morphology resulting from the exposure in
the presence of KCl(s). The surface in the figure seems to be smoother and more homogeneous,
although some cracks can be seen. All samples exposed in the presence of HCl(g) suffered
spallation. The presence of iron and chromium chlorides was detected on the oxide surface using
XRD. This is in agreement with the observation of Folkeson and Zahs [69, 85], who found that
the presence of metal chloride is not confined to the oxide/metal interface.
A BIB cross section of the sample was analysed and is shown in Figure 49. Two types of regions
can be seen that are related to the areas of the oxide surface. The first region shown in the cross
section of Figure 48b is a dense oxide scale with a morphology similar to the pre-oxidation
K2CO3-168h (see Table 7) and reference scales. The oxide scale appeared to be adherent and

59
homogeneous. The oxide scale consisted of an outward-growing Fe-rich oxide and an inward-
growing mixed spinel oxide.
Figure 48. BSE image of pre-oxidation K2CO3-168h samples after exposure to 5%O2+20%H2O+N2 during 24 hours at 600 °C: a) plan view in presence of HCl(g); b) cross-sectional view in the presence of HCl(g).
The initiation of a grain boundary attack can be observed, see Figure 48b. This kind of attack
has been reported for stainless steels after exposure to an aggressive environment containing
high amounts of KCl(s) by Karlsson [89], in the presence of HCl(g) by Folkeson [69], and in the
presence of Cl2(g) reported by Zahs [85]. No signals of either chlorine or potassium were detected
in the EDX analysis, which suggests that the K-rich layer, obtained in the pre-oxidation step,
reacted with HCl(g) as follows:
2𝐻𝐶𝑙(𝑔) + 2𝐾𝐹𝑒𝑂2(𝑠) ↔ 𝐹𝑒2𝑂3(𝑠) + 2𝐾𝐶𝑙(𝑠) + 𝐻2𝑂(𝑔) (25) ∆𝐺°(600 °𝐶) = −1211 𝑘𝐽 𝑚𝑜𝑙⁄
The formed KCl(s) evaporated similar to the sample exposed in the presence of KCl(s). The
presence of KFeO2 (detected after pre-oxidation) was detected by XRD analysis. KCl(s) on the
oxide surface was not observed. Detachment of the oxide occurred at the outward/inward-
growing interface, see Figure 49. The formation of cavities might be due to an interconnection
between pores present in the magnetite layer.
Figure 49. BIB cross section of pre-oxidation K2CO3-168h sample after exposure to 5%O2+20%H2O+500ppmHCl+N2 during 24 hours.
Another feature of interest is the formation of oxide blisters, which might be cavities that grow
outwards. As shown in Figure 50, blisters formed at localized sites where the metal chlorides
were detected with EDX analysis. EDX point analysis of the metal chlorides indicated the

60
presence of chromium and iron, but it was difficult to determine which metal chloride was
present.
Figure 50. BSE image of cross- sectional view; EDX mapping of pre-oxidation K2CO3-168h sample after exposure to 5%O2+20%H2O+500ppmHCl+N2 during 24 hours.
The detection of metal chlorides at the oxide/metal interface indicates the penetration of
chlorine through the oxide scale at sites where the oxide remained uncracked. This may imply
that chlorine takes diffusion paths that differ from the paths for cracks in the oxide. However,
the formation of blisters might cause the oxide scale to crack during longer exposure times. Zahs
et al. [85] have suggested that the formation of these blisters is due to the growth stresses of the
oxide and volatilization of the metal chlorides formed at the metal/oxide interface.
Influence of oxide microstructure and thickness of the low-alloyed steel
Fe-2.25Cr-1Mo on the propagation of corrosion attack
The microstructure of an oxide scale is assumed to be important for the propagation of
oxidation. The microstructure consists of different oxide phases and density of grain boundaries.
In the chlorine-induced corrosion mechanism proposed by Folkeson et al. [69, 70], chlorine is
proposed to diffuse as a chloride ion (Cl-) through the oxide scale towards the metal via oxide
grain boundaries. This may be investigated by manipulating the microstructure of the oxide
scales, and then in a second step, the chlorine-induced corrosion attack.
Three different pre-oxidations were performed to obtain three different oxide microstructures.
The pre-oxidation procedure is described in Section 8.2.1. After pre-oxidation, 0.1 mg/cm2 of
KCl(s) was deposited on the sample surfaces. The samples were exposed to 5% O2, 20% H2O
balanced with N2 during 1, 24, 48, and 168 hours at 400 °C. Samples without a KCl(s) deposit
were also exposed for comparison. Figure 51 shows the mass gain curves. Note that the large
error bars in the 168-hour exposures were due to spallation. The reference samples did not
present any spallation or breakaway of the oxide, which confirms that, even in the presence of a
pre-formed oxide scale on the sample surface, KCl(s) still accelerated the corrosion rate. In
addition, a tendency among the reference samples was noticed, as shown in the zoomed area in
Figure 51. The tendency showed that, after 24 hours, the 700°C-7min samples showed a slightly
higher mass gain than the rest of the reference pre-oxidized samples, followed by the 600°C-
40min and the 500°C-12h samples, respectively.

61
Figure 51. Mass gains of pre-oxidized Fe-2.25Cr-1Mo after exposed at 400 °C to 5%O2+20%H2O+75%N2 in presence of 0.1mg/cm2KCl.
When the exposures were performed in the presence of KCl(s) after a 24-hour exposure, no great
difference between the 500°C-12h and the 600°C-40min samples was observed; both samples
showed breakaway corrosion after 168 hours. However, the 600°C-40min samples showed a
slightly higher mass gain than the 500°C-12h samples, similar to the finding for the reference
cases. The 700°C-7min sample presented mass loss, i.e. spallation, after only 24 hours. The
700°C-7min samples were not exposed during longer times since the spallation suffered made it
difficult to record the mass gain or loss of the samples.
After longer exposure times, it was clear that the presence of KCl(s) did accelerate the corrosion
rate of the pre-oxidized samples. This is in good agreement with earlier reports on the effect of
KCl(s) on non-pre-oxidized low-alloyed steels at 400 °C [70, 90]. The critical point, according to
the mass gain curves, is the 48-hour exposure. The 600°C-40min samples showed an accelerated
corrosion rate before the 48-hour mark, but the 500°C-12h samples maintained a low mass gain
until 48 hours had been reached. This suggests that the different microstructures and thickness
of the oxide scales pre-formed at different temperatures might influence the propagation step
of the corrosion attack.
500°C-12h samples after exposure to KCl(s)
The surface morphology and cross sections of 500°C-12h samples after 24-, 48-, and 168-hour
exposures in the presence of KCl(s) are shown in Figure 52. The base oxide was still visible after
24 hours, KCl(s) particles remained unreacted, but some of these particles seemed to start to
react, forming a melt around them. The oxide scale was still adherent to the substrate and was
denser than the starting condition of the oxide scale shown in Figure 46. The thickness of the
oxide scale slightly increased compared to the thickness of the initial pre-formed oxide scale. It
seemed that the iron oxide slowed down the propagation process in this early stage. After a 48-

62
hour exposure, the surface morphology started to change dramatically; overgrown iron oxide
covered some of the KCl(s) particles. Nonetheless, unreacted KCl(s) particles were still visible.
The oxide thickness did not increase significantly compared to the sample exposed for 24 hours.
Instead, the oxide scale appeared to be denser. However, the scale was detached from the
substrate. Folkeson et al. [70] have reported the formation of a porous oxide underneath the
spinel oxide, which appears as a detachment due to the contrast of the image.
Breakaway corrosion was observed after a 168-hour exposure, which agrees with the non-
parabolic behaviour shown in the mass gain curve in Figure 51. The plan view of the sample
exposed during 168 hours in Figure 52 shows that, the oxide obtained during the pre-oxidation
step is not visible as well as KCl(s) particles. Instead, a thick iron oxide was present, which grew
about 2 µm from the stating thickness obtained after pre-oxidation.
Figure 52. BSE images of plan view and cross sections of 500°C-12h samples after 24-, 48-, and 168-hour exposures at 400 °C to 5%O2+20%H2O+75%N2+0.1mg/cm2KCl.
In some regions of the sample, the oxide scale remained attached to the substrate after a 168-
hour exposure to KCl(s), see Figure 53. The SEM image shows a dense oxide with fewer pores
than the starting oxide scale prior to KCl(s) exposure. However, a porous oxide can be clearly
seen directly in contact with the metal surface. This oxide appears to be more porous than the
inward-growing spinel oxide. Metal chlorides were detected at the porous oxide/metal interface.

63
Figure 53. SE image of cross section of 500°C-12h sample after 168-hour exposure at 400 °C to 5%O2+20%H2O+75%N2+0.1mg/cm2KCl. Preparation and imaging by Ph.D. M. Sattari.
600°C-40min samples after exposure to KCl(s)
Pre-oxidized 600°C-40min samples in the presence of KCl(s) after 24-, 48-, and 168-hour
exposure are shown in Figure 54. The pre-formed oxide remained visible after a 24-hour
exposure, and unreacted KCl(s) crystals were present on the oxide surface. The oxide scale was
well attached to the substrate. The three-layered oxide scale that was observed after the pre-
oxidation step was also seen after the 24-hour exposure, however, the pores in the Fe3O4
appeared to have changed positions towards the oxide surface.
After 48 hours, KCl(s) particles were not visible on the oxide surface. The increase in the
oxidation rate was assumed to be due to the overgrown iron oxide seen on the surface. The cross
section of the oxide scale showed that almost no pores remained in the Fe3O4 layer. The oxide
scale seemed to be detached from the substrate. However, at the gap observed between the oxide
scale and the metal, a different morphology was noticed, which might be a porous oxide as
suggested by Folkeson et al. [70]. A similar gap in the corresponding 500°C-12h sample between
the oxide and metal was observed.
According to the mass gain curve shown in Figure 51, the parabolic behaviour of the 600°C-
40min sample was interrupted between 24 and 48 hours. An increase in oxide scale thickness
became noticeable at this stage. Cracks and spallation of the oxide surface were observed after
the 168-hour exposure. Metal chlorides were detected at the oxide/metal interface. The gap, or
porous oxide, between the oxide and the metal increased.

64
Figure 54. BSE images of plan view and cross sections of 600°C-40min samples after 24-, 48-, and 168-hour exposures at 400 °C to 5%O2+20%H2O+75%N2+0.1mg/cm2KCl.
The SEM image at higher magnification, see Figure 55, shows a dense oxide. Even though the
oxide scale seems not to be as thick as the one formed in the corresponding 500°C-12h sample,
the presence of metal chlorides appears to be uniform along the oxide/metal interface. Some
KCl(s) remained on the oxide surface according to the EDX analysis. An oxide scale morphology
consisting of Fe2O3, Fe3O4 and spinel oxide, corresponding to the scale observed during the
short-time exposures, was observed. The total oxide thickness was almost twice the thickness of
the pre-oxidized sample before exposure in the presence of KCl(s).
Figure 55. SE image of cross section of 600°C-40min sample after 168-hour exposure at 400 °C to 5%O2+20%H2O+75%N2+0.1mg/cm2KCl. Preparation and imaging by Ph.D. M. Sattari.

65
700°C-7min samples after exposure to KCl(s)
The surface morphology of 700°C-7min samples after a 24-hour exposure in the presence of
KCl(s) is shown in Figure 56. The 700°C-7min samples were limited to a 24-hour exposures due
to spallation of the oxide scale. Cracks and spallation were observed all over the surfaces of the
samples. Few unreacted KCl(s) particles were found, as can be seen in Figure 56a.
Figure 56. BSE images of plan view of 700°C-7min samples after 24-hour exposure at 400 °C to 5%O2+20%H2O+75%N2+0.1mg/cm2KCl.
According to the mass gain curves of the pre-oxidized samples, after exposure in the presence
of KCl(s), the samples appeared to have different incubation times to breakaway corrosion. This
suggests that the initial conditions, i.e. oxide scales, of the samples play an important role in the
propagation step of a corrosion attack induced by chlorine. An effect of the oxide microstructure
on corrosion behaviour would be expected, as shown by Silva [92] for zirconium oxide. That
author claims that high grain boundary density promotes the acceleration of a corrosion attack.
Nevertheless, in this study, it was too difficult to determine a clear difference between the pre-
oxidations, especially at the Fe2O3 top-layer, to claim a microstructural effect. It is worth
mentioning that the 700°C-7min sample had the thickest pre-formed oxide scale and showed
the fastest corrosion rate in the reference exposure. This sample also had the shortest incubation
time to breakaway and oxide scale crack in the presence of KCl(s), i.e. less than 24 hours.
In summary, Fe-2.25Cr-1Mo samples were pre-oxidized, three different oxide microstructures
were obtained due to the difference in temperature and time of oxidation. After being exposed
in the presence of KCl(s), an acceleration of the oxidation rate was observed. The three different
pre-oxidations presented crack formation and the presence of metal chlorides. The difference in
incubation time to breakaway corrosion was observed, depending on the pre-oxidation
performed. The pre-oxidations caused small differences in microstructure and thickness while
direct influence of the oxide microstructure on the corrosion rate could not be concluded.
However, it is clear that chlorine can penetrate a dense thick iron oxide and the acceleration was
proceeded by a change in microstructure, i.e. less porous oxide scale.

66
Oxide scale crack formation
It has been suggested that the acceleration of the corrosion rate is induced by the presence of
KCl(s), even when an oxide layer is formed prior to exposure, see Figure 47. It has also been
reported in the literature that samples with accelerated corrosion result in the formation of
multi-layered oxide scales [28, 47, 56, 90]. Therefore, the development of the oxide scale growth
was investigated in detail in the present study. Fe-2.25Cr-1Mo coupons were exposed in 5% O2,
20% H2O, and 75% N2. KCl(s) was deposited on the sample surfaces prior to exposure. Samples
in absence of KCl(s) were also exposed as reference. The exposures were performed in-situ in a
TGA device at 400 °C. The recorded kinetics are given in Figure 57.
Figure 57. TGA mass gain curves of Fe-2.25Cr-1Mo samples exposed at 400 °C during 24 hours in 5% O2, 20% H2O, and 75%N2.
The mass gain curves show the accelerated parabolic corrosion rate of the samples exposed in
the presence of KCl(s), whereas the reference sample was observed to follow a parabolic
behaviour. The curve obtained in the presence of KCl(s) presented a kinetic transition after a 12-
hour exposure followed by another parabolic curve. Due to the parabolic behaviour of the mass
gain curve, before and after kinetic transition, it is suggested that the growth of the oxide scales
is diffusion controlled. According to STEM/EDX analysis and XRD results, both oxide scales
formed before and after the kinetic transition consisted of an outward-growing Fe2O3 top layer,
an outward-growing Fe3O4 middle layer, and an inward-growing (Fe,Cr)3O4 spinel oxide. The
presence of KCl(s) was detected only on the sample surface.

67
This kinetic transition has been related to the delamination and cracking of the oxide scale.
Delamination can be attributed to growth stresses, the formation of metal chlorides, or the
accumulation of vacancies. The local cracking of the initial oxide scale has been speculated to
occur after the scale grew relatively thick, about 4 µm. After the cracking of the scale, a second
oxide scale was formed.
Figure 58 shows the proposed process of the oxide scale growth of an Fe-2.25Cr-1Mo in the
presence of KCl(s) at 400 °C. The accelerated oxidation process can be explained by the 0 to 2
steps, resulting in the formation of a relatively thick oxide. Subsequently, delamination of the
oxide scale from the metal occurred followed by local cracks. The cracks act as a path for oxygen
supply through the oxide scale, increasing the oxygen partial pressure. This leads to the
formation of a new oxide scale, which is thermodynamically favoured (pO2 > 10-22 atm [17])
underneath the first oxide scale. The oxidation process is expected to repeat, resulting in a multi-
layered oxide scale.
Figure 58. Schematic representation of the proposed oxide scale growth process when exposing Fe-2.25Cr-1Mo in 5% O2, 20% H2O, and 75% N2 in the presence of KCl(s) at 400 °C.
Chlorine permeation through the oxide scale
This study has shown that chlorine is capable of diffusing through pre-formed oxide scales and
reaching the oxide/metal interface where the chlorine reacts with the metal to form metal
chlorides. Some chlorine-induced corrosion mechanisms are described in Section 5. These
mechanisms were used to formulate part of the experimental strategy for the current research.
However, these mechanisms neither explain the path where chlorine penetrates the oxide scale
nor show experimental proof of the mechanism. This might be due to the instability of the
formed chlorine-containing corrosion products, which make difficult the characterization of
samples exposed in the presence of chlorine species. Therefore, a different approach was taken,
and the density functional theory (DFT) was used to propose a mechanism based on
68
experimental observations and an investigation of the energy landscapes associated with the
chlorine diffusion process.
The working hypothesis for this part of the study consists of an alternative path for chlorine to
penetrate an oxide scale. It is proposed that chlorine penetrates the oxide scale in the form of a
chloride ion that utilizes oxygen vacancy sites, leading to the accumulation of chloride ions at
the oxide/metal interface in the form of FeCl2. Subsequently, the transport of chloride ions as
supplied by KCl(s) on the oxide scale surface through the oxygen sub-lattice in the magnetite
layer was investigated. It is proposed that the permeation of chloride ions occurs in two steps:
The incorporation of chloride ions into the magnetite lattice and the formation of
K2O@Fe2O3 (K2Fe2O3). This would result in a quasi-homogeneous substitutional
chloride-ion distribution from which the segregation of chloride ions might occur in
single and double layers in the magnetite structure.
The recovery of the magnetite lattice by the formation of FeCl2.
This working hypothesis is also valid when the source of chloride ions is HCl(s) but with the
formation of FeOOH as a result of the chloride charging in the lattice. Figure 59 shows a
schematic drawing of the mechanism for chloride-ion permeation through the oxide scale when
KCl(s) is the source of the chloride. According to the DFT calculation, the energy landscape of
the permeation of chloride ions is favoured, as confirmed by the negative HDFT obtained. Thus,
it is shown that the magnetite lattice is able to host chloride ions by means of the spontaneous
formation of metastable oxy-chlorides as intermediates.

69
Figure 59. Schematic drawing of chloride-ion permeation through the oxide scale.
It was also noted that once a chloride ion has been located in an oxygen vacancy in the magnetite
lattice, the ability of the entry of an additional chloride ion is favoured up to 28 at% Cl-. It was
also shown that the presence of metastable oxy-chloride intermediates in the magnetite results
in their decomposition and the formation of a mixture of iron chloride and magnetite. With the
saturation of chloride ions in the magnetite, the possibility of the segregation of oxy-chloride
structures was analysed. The segregation was assumed to have monolayer or bilayer of iron
chloride motifs, and the HDFT was calculated and compared for different chloride
concentrations (7.1 and 14.3 at% Cl-), see Figure 60. The formation of monolayers of iron chloride
motifs proved to be favoured at low chloride concentrations (<10 at% Cl-) due to the construction
of an interlaying repulsion. Moreover, for higher concentrations, the formation of bilayers of
iron chloride motifs was favoured. The segregation in the bilayers of iron chloride motifs in the
magnetite might be a possible cause of delamination or crack formation at the oxide scale.

70
Figure 60. Schematic representation of chloride-ion distribution in magnetite, corresponding to 14.3 at% Cl-.
In summary, the use of DFT to investigate the energy landscape associated with the chlorine
diffusion process made it possible to validate an alternative path for permeation through an
oxide scale. Regardless of whether KCl(s) or HCl(g) is used as the source of chloride ions, it was
found that the permeation of Cl- is energetically favoured if it follows the path of oxygen
vacancies in the bulk oxide.

71
9 _____________________________________________
Summary and conclusions
This study aims at investigating the mechanism of chlorine-induced corrosion. The study is
divided into two parts; field exposures showing the extent and initiation of a chlorine-induced
corrosion attack and laboratory exposures aiming at investigating the mechanism of the
chlorine-induced corrosion attack. The corrosion mechanism has been focussing on the role of
chlorine on the propagation of the corrosion attack. In order to clarify different stages of the
corrosion attack a new definition for oxidation before and after breakaway corrosion is
introduced: primary and secondary protection, respectively.
Primary protection: the formation of the first oxide scale. This is usually a slow-growing,
thin, protective oxide, e.g. Cr-rich (Fe,Cr)2O3 on stainless steels.
Secondary protection: the oxide scale formed after breakaway, e.g. outward-growing
hematite (Fe2O3) and inward-growing spinel oxide, e.g. (Fe,Cr,Ni)3O4 on stainless steels.
This oxide scale is usually as protective as the primary protection.
9.1 Field exposures
The field exposures were focused on the startup sequence of probe exposures. The results
showed that the initiation of breakaway corrosion is very rapid in this environment. Thus, the
primary protection, i.e. the Cr-rich oxide scale on stainless steels, was immediately destroyed
and the oxides and metal chlorides formed set the boundary conditions for further corrosion,
i.e. secondary protection.
The extent and initiation of a chlorine induced corrosion attack in a complex environment was
investigated in a waste-fired boiler. The results show:
The startup sequence probe exposures have a minor effect on the early stages of
corrosion test exposures.
The corrosion attack was in all cases fast and led to thick oxide scales, i.e. secondary
protection, and the formation of metal chlorides.
The formation of a well-controlled oxide scale prior to exposure might have a beneficial
effect when expose in a complex aggressive environment.

72
9.2 Laboratory exposures
Based on the corrosion attack observed in the field exposed samples, a set of laboratory
exposures was designed the objective was to investigate the mechanism behind chlorine-
induced corrosion, focusing on understanding the chlorine diffusion through oxide scales at
high temperatures. Therefore, a series of pre-oxidations were performed in order to investigate
the role of oxide composition, microstructure, and thickness on chlorine-induced corrosion.
9.2.1 Pre-oxidation: secondary protection
Pre-oxidation was carried out without chlorine for both low-alloyed and stainless steels. The
oxide microstructure was carefully characterized. The pre-oxidation of stainless steels showed:
Rapid breakdown of the primary protection Cr-rich oxide in the presence of K2CO3. The
resulting oxide scales consisted in all cases of a dense outward-growing Fe-rich oxide and
an inward-growing Fe,Cr,(Ni) spinel oxide.
The results from the Fe,Cr,(Ni)-model alloys indicate that the presence of nickel plays
an important role in the secondary protection behaviour of stainless steels.
The low-alloyed steel Fe-2.25Cr-1Mo was pre-oxidized at three different temperatures and
exposure times, which resulted in three different oxide scales with a similar thickness. All oxide
scales consisted of an outward-growing hematite and magnetite and inward-growing spinel
oxide.
9.2.2 The role of chlorine species in the corrosion attack of pre-
oxidized materials
The pre-oxidized samples were, in a second step, exposed in environments that contained O2,
H2O, N2, and a chlorine specie, as well as in the absence of chlorine species as reference. The
investigation of the stainless steels was focused on 600 °C, while the low-alloyed steel was
focused on 400 °C.
Influence of different chlorine species (KCl(s) and HCl(g)) on pre-
oxidized stainless steel 347H
When a pre-oxidized 347H sample was exposed in the presence of 0.1 mg/cm2 KCl(s),
there was no (or little) acceleration of the corrosion attack at 600 °C. The deposited
KCl(s) evaporated from the oxide surface, and no evidence of chlorine was observed at
the oxide/metal interface.
In the in the presence of 500 ppm HCl(g), areas of the oxide surface showed oxide blister
formations, and some cracks were observed. The presence of metal chlorides was
detected at the oxide/metal interface. The metal chlorides were observed in the same
areas where uncracked-Fe2O3 blisters were found. Since the scale above the location of
where the metal chlorides have formed was dense and free of visible cracks, the transport
of chlorine through the scale is suggested to occur by alternative paths than cracks and
pores.

73
Influence of oxide morphology, microstructure, and thickness of the
low-alloyed steel Fe-2.25Cr-1Mo on the propagation of a corrosion
attack
The presence of KCl(s) accelerated the corrosion rate of all pre-oxidized samples.
A difference in the incubation time to breakaway corrosion was found between the pre-
oxidations. The samples pre-oxidized at higher temperatures experienced a shorter time
to breakaway corrosion.
The presence of metal chlorides at the oxide/metal interface was detected. According to
the cross-sectional analysis by BIB and SEM/EDX, the chlorine seems to have permeated
through dense, well-adhered oxide scales.
9.2.3 Mechanisms: chlorine-induced corrosion
Oxide scale crack formation
The influence of KCl(s) on corrosion of non-pre-oxidized Fe-2.25Cr-1Mo at 400 °C was
investigated by well-controlled laboratory exposures in combination with a detailed
microstructure investigation. By linking the scale microstructures to oxidation kinetics, it is
suggested that KCl(s) increases the overall corrosion attack by inducing cracks and delamination
of the oxide scales formed. As a crack or delamination of the oxide scale occurs the surrounding
environment and the underlying metal will come in direct contact with each other. In this
process, a new oxide scale will form (similar to the first scale). Thus, the overall corrosion attack
is driven by the recurring formation of cracks and delamination, resulting in a periodic growth
and layered microstructure.
Chlorine permeation through an oxide scale
The results from the pre-oxidized samples indicate chlorine permeation through the dense, well-
adhered oxide scale. This phenomenon is difficult to explain by a mechanism based on gaseous
species passing through the scale. If so, the oxygen gas, which is considerable smaller and in
great surplus in the environment compared to chlorine gas, would also be able to permeate
through the oxide scale causing a situation at the oxide/metal interface strongly unfavourable
for metal chloride formation.
In order to better understand the diffusion of chlorine though the oxide scale density functional
theory (DFT) was employed, i.e. DFT was used to investigate the energy landscapes associated
with the chlorine diffusion process through the oxide scale (magnetite was used as oxide model).
The investigation showed:
Chloride ions are able to diffuse through an oxide scale via oxygen vacancies.
The diffusion process was found to be valid for both KCl(s) or HCl(g) as chlorine sources.

74

75
References
1. McMichael, A.J., Woodruff, R.E., and Hales, S., Climate change and human health: present and future risks. The Lancet. 367(9513): p. 859-869.
2. Climate Hot Map - GLOBAL WARMING EFFECTS AROUND THE WORLD. 2011 2011 [cited 2016 31st October 2016]; Available from: http://www.climatehotmap.org/about/global-warming-causes.html.
3. A sustainable Energy and Climate Policy for the Environment, Competitiveness and Long-Term Stability, T.S.P.M.s. Office, Editor. 2009: Stockholm, Sweden.
4. Swedish Institute. 4 December 2015 [cited 2016 23rd June]; Available from: https://sweden.se/climate/#from-resource-economy-to-bioeconomy.
5. Swedish Institute. 3rd February 2016 [cited 2016 1st November]; Available from: https://sweden.se/nature/sweden-tackles-climate-change/.
6. Easterly, J.L. and Burnham, M., Overview of biomass and waste fuel resources for power production. Biomass and Bioenergy, 1996. 10(2): p. 79-92.
7. Davidsson, K.O., Åmand, L.E., Leckner, B., Kovacevik, B., Svane, M., Hagström, M., Pettersson, J.B.C., Petterson, J., Asteman, H., Svensson, J.E., and Johansson, L.G., Potassium, chlorine, and sulfur in ash, particles, deposits, and corrosion during wood combustion in a circulating fluidized-bed boiler. Energy and Fuels, 2007. 21(1): p. 71-81.
8. Nielsen, H.P., Frandsen, F.J., Dam-Johansen, K., and Baxter, L.L., The implications of chlorine-associated corrosion on the operation of biomass-fired boilers. Progress in Energy and Combustion Science, 2000. 26(3): p. 283-298.
9. Michelsen, H.P., Frandsen, F., Dam-Johansen, K., and Larsen, O.H., Deposition and high temperature corrosion in a 10 MW straw fired boiler. Fuel Processing Technology, 1998. 54(1–3): p. 95-108.
10. Jenkins, B.M., Baxter, L.L., and Miles, T.R., Combustion properties of biomass. Fuel Processing Technology, 1998. 54(1-3): p. 17-46.
11. Pettersson, J., Pettersson, C., Asteman, H., Svensson, J.-E., and Johansson, L.-G., A pilot plant study of the effect of alkali salts on initial stages of the high temperature corrosion of alloy 304L. High Temperature Corrosion and Protection of Materials 6, Prt 1 and 2, Proceedings, 2004. 461-464: p. 965-972.
12. Pettersson, J., Pettersson, C., Folkeson, N., Johansson, L.G., Skog, E., and Svensson, J.-E., The Influence of Sulphur Additions on the Corrosive Environment in a Waste-Fired CFB Boiler. Materials Science Forum, 2006. 522-523: p. 563-570.
13. Folkeson, N., Pettersson, J., Pettersson, C., Johansson, L.G., Skog, E., Andersson, B.A., Enestam, S., Tuiremo, J., Jonasson, A., Heikne, B., and Svensson, J.E., Fireside corrosion of stainless and low alloyed steels in a waste-fired CFB boiler; The effect of adding sulphur to the fuel, in High Temperature Corrosion and Protection of Materials 7, Pts 1 and 2, P. Steinmetz, I.G. Wright, A. Galerie, D. Monceau, and S. Mathieu, Editors. 2008, Trans Tech Publications Ltd: Stafa-Zurich. p. 289-297.
14. Antunes, R.A. and de Oliveira, M.C.L., Corrosion in biomass combustion: A materials selection analysis and its interaction with corrosion mechanisms and mitigation strategies. Corrosion Science, 2013. 76: p. 6-26.
15. Kassman, H., Pettersson, J., Steenari, B.-M., and Åmand, L.-E., Two strategies to reduce gaseous KCl and chlorine in deposits during biomass combustion — injection of ammonium sulphate and co-combustion with peat. Fuel Processing Technology, 2013. 105: p. 170-180.
16. Karlsson, S., Åmand, L.-E., and Liske, J., Reducing high-temperature corrosion on high-alloyed stainless steel superheaters by co-combustion of municipal sewage sludge in a fluidised bed boiler. Fuel, 2015. 139: p. 482-493.
17. Kofstad, P., High Temperature Corrosion. 1988, London: Elsevier Applied Science.

76
18. Jones, D.A., Principles and Preventions of Corrosion. 1992, New York Macmillan. 19. Callister, W.D. and Rethwisch, D.G., Materials Science and Engineering: An Introduction.
2010: Wiley. 20. Atkinson, A. and Taylor, R.I., The diffusion of 63Ni along grain boundaries in nickel oxide.
Philosophical Magazine A, 1981. 43(4): p. 979-998. 21. Hoffman, R. and Turnbull, D., Lattice and Grain Boundary Self‐Diffusion in Silver. Journal
of Applied Physics, 1951. 22(5): p. 634-639. 22. Khanna, A.S., Introduction to High Temperature Oxidation and Corrosion. 2002,
Materials Park, OH, USA: ASM International. 23. Askeland, D.R., Fulay, P.P., and Wright, W.J., The Science and Engineering of Materials.
2010: Cengage Learning. 24. Atkinson, A. and Taylor, R.I., The diffusion of Ni in the bulk and along dislocations in NiO
single crystals. Philosophical Magazine A, 1979. 39(5): p. 581-595. 25. Birks, N. and Meier, H., Introduction to High Temperature Oxidation of Metals. 1983,
London: Edward Arnold Ltd. 26. Wagner, C., Beitrag zur Theorie des Anluafvorgangs. Z. Physicalishe Chemie, 1933. B21: p.
25 - 41. 27. Young, D.J., High Temperature Oxidation and Corrosion of Metals. 2016: Elsevier Science. 28. Pujilaksono, B., Jonsson, T., Halvarsson, M., Svensson, J.-E., and Johansson, L.-G.,
Oxidation of iron at 400-600 °C in dry and wet O2. Corrosion Science, 2010. 52(5): p. 1560-1569.
29. Zahs, A., Spiegel, M., and Grabke, H.J., Chloridation and oxidation of iron, chromium, nickel and their alloys in chloridizing and oxidizing atmospheres at 400-700 degrees C. Corrosion Science, 2000. 42(6): p. 1093-1122.
30. Folkeson, N., Chlorine Induced Corrosion in Biomass and Waste Fired Boilers: Laboratory and Field Investigations. 2010: Chalmers University of Technology.
31. Wever, F., Ueber den Einfluß der Elemente auf den Polymorphismus des Eisens. Archiv für das Eisenhüttenwesen, 1929. 2(11): p. 739-748.
32. Computational Thermodynamics Inc. - Iron-Chromium (Fe-Cr) Phase Diagram. 2011 [cited 2019 15th January]; Available from: http://www.calphad.com/iron-chromium.html.
33. Computational Thermodynamics Inc. - Iron-Nickel (Fe-Ni) Phase Diagram. 2011 [cited 2019 15th January]; Available from: http://www.calphad.com/iron-nickel.html.
34. Wretblad, P.E., Röntgenographische Untersuchung der Systeme Zeitschrift für anorganische und allgemeine Chemie, 1930. 189(1): p. 329-
336. 35. Tsokov, P., Blaskov, V., Klissurski, D., and Tsolovski, I., Effect of mechanical activation
on the synthesis of α-Fe2O3-Cr2O3 solid solutions. Journal of Materials Science, 1993. 28(1): p. 184-188.
36. Fujii, C.T. and Meussner, R.A., The Mechanism of the High‐Temperature Oxidation of Iron‐Chromium Alloys in Water Vapor. Journal of The Electrochemical Society, 1964. 111(11): p. 1215-1221.
37. Khanna, A. and Kofstad, P., Effects of Water Vapor on Oxide Growth on 304 Stainless Steel at 900 deg C. Microscopy of Oxidation, 1990: p. 113-118.
38. Eu Tang, J., Halvarsson, M., Asteman, H., and Svensson, J.-E., The microstructure of the base oxide on 304L steel. Micron, 2001. 32(8): p. 799-805.
39. Jianian, S., Longjiang, Z., and Tiefan, L., High-temperature oxidation of Fe-Cr alloys in wet oxygen. Oxidation of Metals, 1997. 48(3): p. 347-356.
40. Pettersson, C., Johansson, L.G., and Svensson, J.E., The Influence of Small Amounts of KCl(s) on the Initial Stages of the Corrosion of Alloy Sanicro 28 at 600 degrees C. Oxidation of Metals, 2008. 70(5-6): p. 241-256.

77
41. Pettersson, C., High Temperature Corrosion of Some Stainless Steels - The Influence of Water Vapour and Potassium-Containing Salts, in Department of Chemical and Biological Engineering. 2009, Chalmers University of Technology: Gothenburg, Sweden.
42. Asteman, H., Svensson, J.-E., and Johansson, L.-G., Evidence for Chromium Evaporation Influencing the Oxidation of 304L: The Effect of Temperature and Flow Rate. Oxidation of Metals, 2002. 57(3): p. 193-216.
43. Asteman, H., Svensson, J.-E., Johansson, L.-G., and Norell, M., Indication of Cromium Oxide Hydroxide Evaporation During Oxidation of 304L at 873K in the Presence of 10% Water Vapor. Oxidation of Metals, 1999. 52: p. 95-111.
44. Asteman, H., Segerdahl, K., Svensson, J.-E., and Johansson, L.-G., The Influence of Water Vapor on the Corrosion of Chromia-Forming Steels. Materials Science Forum, 2001. 369-372: p. 277-286.
45. Halvarsson, M., Tang, J.E., Asteman, H., Svensson, J.E., and Johansson, L.G., Microstructural investigation of the breakdown of the protective oxide scale on a 304 steel in the presence of oxygen and water vapour at 600 °C. Corrosion Science, 2006. 48(8): p. 2014-2035.
46. Pettersson, J., Folkeson, N., Johansson, L.-G., and Svensson, J.-E., The Effects of KCl, K2SO4 and K2CO3 on the High Temperature Corrosion of a 304-Type Austenitic Stainless Steel. Oxidation of Metals, 2011. 76(1): p. 93-109.
47. Jonsson, T., Froitzheim, J., Pettersson, J., Svensson, J.E., Johansson, L.G., and Halvarsson, M., The influence of KCl on the corrosion of an Austenitic stainless steel (304L) in oxidizing humid conditions at 600°C: A microstructural study. Oxidation of Metals, 2009. 72(3-4): p. 213-239.
48. Pettersson, C., Pettersson, J., Asteman, H., Svensson, J.E., and Johansson, L.G., KCl-induced high temperature corrosion of the austenitic Fe-Cr-Ni alloys 304L and Sanicro 28 at 600 degrees C. Corrosion Science, 2006. 48(6): p. 1368-1378.
49. Asteman, H., Svensson, J.-E., Norell, M., and Johansson, L.-G., Influence of Water Vapor and Flow Rate on the High-Temperature Oxidation of 304L; Effect of Chromium Oxide Hydroxide Evaporation. Oxidation of Metals, 2000. 54: p. 11 - 26.
50. Tedmon, C.S., The Effect of Oxide Volatilization on the Oxidation Kinetics of Cr and Fe‐Cr Alloys. Journal of The Electrochemical Society, 1966. 113(8): p. 766-768.
51. Pettersson, J., Asteman, H., Svensson, J.E., and Johansson, L.G., KCl induced corrosion of a 304-type austenitic stainless steel at 600 degrees C; The role of potassium. Oxidation of Metals, 2005. 64(1-2): p. 23-41.
52. Karlsson, S., Pettersson, J., Johansson, L.G., and Svensson, J.E., Alkali Induced High Temperature Corrosion of Stainless Steel: The Influence of NaCl, KCl and CaCl2. Oxidation of Metals, 2012. 78(1-2): p. 83-102.
53. Segerdahl, K., Svensson, J.-E., and Johansson, L.-G., The high temperture oxidation of 11% chromium steel: Part I - Influence of pH2O. Materials and Corrosion, 2002. 53: p. 247-255.
54. Segerdahl, K., Svensson, J.E., and Johansson, L.-G., Protective and nonprotective behavior of 11% Cr steel in O-2+H2O environment at 450-700 degrees C. 2004, JOURNAL OF THE ELECTROCHEMICAL SOCIETY.
55. Segerdahl, K., Svensson, J.E., and Johansson, L.G., The high temperature oxidation of 11% chromium steel: Part II – Influence of flow rate. Materials and Corrosion, 2002. 53(7): p. 479-485.
56. Pujilaksono, B., Jonsson, T., Heidari, H., Halvarsson, M., Svensson, J.E., and Johansson, L.G., Oxidation of Binary FeCr Alloys (Fe-2.25Cr, Fe-10Cr, Fe-18Cr and Fe-25Cr) in O-2 and in O-2 + H2O Environment at 600 degrees C. Oxidation of Metals, 2011. 75(3-4): p. 183-207.
57. Badin, V., Diamanti, E., Forêt, P., and Darque-Ceretti, E., Water Vapor Oxidation of Ferritic 441 and Austenitic 316L Stainless Steels at 1100 °C for Short Duration. Procedia Materials Science, 2015. 9: p. 48-53.

78
58. Li, Y., Murphy, P., and Wu, C.-Y., Removal of elemental mercury from simulated coal-combustion flue gas using a SiO2–TiO2 nanocomposite. Fuel Processing Technology, 2008. 89(6): p. 567-573.
59. Nielsen, H.P., Frandsen, F.J., and Dam-Johansen, K., Lab-scale investigations of high-temperature corrosion phenomena in straw-fired boilers. Energy & Fuels, 1999. 13(6): p. 1114-1121.
60. Kassman, H., Broström, M., Berg, M., and Åmand, L.-E., Measures to reduce chlorine in deposits: Application in a large-scale circulating fluidised bed boiler firing biomass. Fuel, 2011. 90(4): p. 1325-1334.
61. Kassman, H., Bäfver, L., and Åmand, L.-E., The importance of SO2 and SO3 for sulphation of gaseous KCl – An experimental investigation in a biomass fired CFB boiler. Combustion and Flame, 2010. 157(9): p. 1649-1657.
62. Karlsson, S., Pettersson, J., and Åmand, L.E., Reducing high temperature corrosion when burning waste by adding digested sewage sludge, in Proceedings of The Swedish-Finnish Flame Days, International Flame Research Foundation. 2011.
63. Steinmetz, P. and Rapin, C. Corrosion of metallic materials in waste incinerators. in Materials science forum. 1997. Trans Tech Publ.
64. Viklund, P., Superheater corrosion in biomass and waste fired boilers: characterisation, causes and prevention of chlorine-induced corrosion. 2013, KTH Royal Institute of Technology.
65. McNallan, M.J., Liang, W.W., Kim, S.H., and Kang, C.T., Acceleration of the High Temperature Oxidation of Metals by Chlorine. High Temperature Corrosion, NACE, 1983: p. 316-321.
66. Grabke, H.J., Reese, E., and Spiegel, M., The Effects of Chlorides, Hydrogen-Chloride, and Sulfur-Dioxide in the Oxidation of Steels Below Deposits. Corrosion Science, 1995. 37(7): p. 1023-1043.
67. Abels, J.M. and Strehblow, H.H., A surface analytical approach to the high temperature chlorination behaviour of inconel 600 at 700 °C. Corrosion Science, 1997. 39(1): p. 115-132.
68. Liu, K., Pan, W.-P., and Riley, J.T., A study of chlorine behavior in a simulated fluidized bed combustion system. Fuel, 2000. 79(9): p. 1115-1124.
69. Folkeson, N., Johansson, L.G., and Svensson, J.E., Initial stages of the HCl-induced high-temperature corrosion of alloy 310. Journal of the Electrochemical Society, 2007. 154(9): p. C515-C521.
70. Folkeson, N., Jonsson, T., Halvarsson, M., Johansson, L.G., and Svensson, J.E., The influence of small amounts of KCl(s) on the high temperature corrosion of a Fe-2.25Cr-1Mo steel at 400 and 500 degrees C. Materials and Corrosion-Werkstoffe Und Korrosion, 2011. 62(7): p. 606-615.
71. Sutton, A.P. and Balluffi, R.W., Interfaces in Crystalline Materials. 1995: Oxford Science Publications.
72. Larsson, E., The corrosive effect of chlorine containing species on waterwalls and superheater materials in waste and biomass-fired power plants. 2016, Göteborg: Chalmers University of Technology.
73. Spiegel, M., Salt melt induced corrosion of metallic materials in waste incineration plants. Materials and Corrosion, 1999. 50(7): p. 373-393.
74. Barin, I., Thermodynamic Data of Pure Substances. Third Edition ed. 1995, Weinheim, Germany.
75. Zhou, W. and Wang, Z.L., Scanning Microscopy for Nanotechnology: Techniques and Applications. 2007: Springer New York.
76. Kamaladasa, R. and Picard, Y., Basic principles and application of electron channeling in a scanning electron microscope for dislocation analysis. Microscopy: science, technology, applications and education, 2010. 4: p. 1583-1590.
79
77. Jonsson, T., Microscopy of High Temperature Oxidation of Iron and Some Stainless Steels, in Department of Applied Physics. 2007, Chalmers University of Technology: Gothenburg, Sweden.
78. Williams, D.B., Carter, C.B., and Veyssiere, P., Transmission electron microscopy: a textbook for materials science. Vol. 10. 1998: Springer.
79. Scientific, T.F. An Introduction to Electron Microscopy - The Scanning Transmission Electron Microscope. 2018 [cited 2018 2018-12-03]; Available from: https://www.fei.com/introduction-to-electron-microscopy/stem/.
80. Nellist, P.D. and Pennycook, S.J., Scanning Transmission Electron Microscopy: Imaging and Analysis. 2011: Springer.
81. MATC, B.P.a., Schematic diagram of an ion chromatography 2006, Madison Area Technical College. p. Depiction how elution time correlates to output peak data.
82. Material Studio 7.0. Accelrys Inc. p. Simulation Software. 83. Perdew, J.P., Burke, K., and Ernzerhof, M., Generalized Gradient Approximation Made
Simple. Physical Review Letters, 1996. 77(18): p. 3865-3868. 84. Chevalier, S., Ched'Homme, S., Bekaddour, A., Amilain-Basset, K., and Buisson, L., High
temperature alloy chloridation at 850 degrees C Part II: Influence of pre-oxidation on the chloridation behaviour. Materials and Corrosion-Werkstoffe Und Korrosion, 2007. 58(5): p. 353-361.
85. Zahs, A., Spiegel, M., and Grabke, H.J., The influence of alloying elements on the chlorine-induced high temperature corrosion of Fe-Cr alloys in oxidizing atmospheres. Materials and Corrosion, 1999. 50(10): p. 561-578.
86. Lehmusto, J., Skrifvars, B.J., Yrjas, P., and Hupa, M., Comparison of potassium chloride and potassium carbonate with respect to their tendency to cause high temperature corrosion of stainless 304L steel. Fuel Processing Technology, 2013. 105: p. 98-105.
87. Reese, E. and Grabke, H.J., Einfluß von Chloriden auf die Oxidation des 2¼ Cr-1 Mo-Stahls. Materials and Corrosion, 1992. 43(12): p. 547-557.
88. Israelsson, N., Engkvist, J., Hellström, K., Halvarsson, M., Svensson, J.-E., and Johansson, L.-G., KCl-Induced Corrosion of an FeCrAl Alloy at 600 °C in O2 + H2O Environment: The Effect of Pre-oxidation. Oxidation of Metals, 2015. 83(1): p. 29-53.
89. Karlsson, S., Reducing Alkali Chloride-Induced High Temperature Corrosion by Sulphur Containing Additives–A Combined Laboratory and Field Study. 2015, Chalmers University of Technology.
90. Jonsson, T., Folkeson, N., Svensson, J.E., Johansson, L.G., and Halvarsson, M., An ESEM in situ investigation of initial stages of the KCl induced high temperature corrosion of a Fe–2.25Cr–1Mo steel at 400°C. Corrosion Science, 2011. 53(6): p. 2233-2246.
91. Jonsson, T., Karlsson, S., Hooshyar, H., Sattari, M., Liske, J., Svensson, J.-E., and Johansson, L.-G., Oxidation After Breakdown of the Chromium-Rich Scale on Stainless Steels at High Temperature: Internal Oxidation. Oxidation of Metals, 2016. 85(5): p. 509-536.
92. da Silva, M.J.G., Influence of oxide microstructure on corrosion behavior of zirconium-based model alloys. 2007: ProQuest.