theses thesis/dissertation collections 1985 ektachem
TRANSCRIPT

Rochester Institute of TechnologyRIT Scholar Works
Theses Thesis/Dissertation Collections
1985
Ektachem evaluationBarbara A. Meiklejohn
Follow this and additional works at: http://scholarworks.rit.edu/theses
This Thesis is brought to you for free and open access by the Thesis/Dissertation Collections at RIT Scholar Works. It has been accepted for inclusionin Theses by an authorized administrator of RIT Scholar Works. For more information, please contact [email protected].
Recommended CitationMeiklejohn, Barbara A., "Ektachem evaluation" (1985). Thesis. Rochester Institute of Technology. Accessed from
EKTACHEM EVALUATION
by
Barbara A. Meiklejohn
Submitted in Partial Fulfillment
of the Requirements for the Degree
MASTER OF SCIENCE
Advisor: Dr. Tai KwongAssistant Director of Clinical Chemistry
Strong Memorial Hospital
Department of Clinical Sciences
Rochester Institute of Technology
Rochester, New York 14623
1985

TABLE OF CONTENTS
Figuresi"1'1'
Tables iv
Acknowledgement v
Abstract 1
Introduction 2
Methods and Materials 5
Results and Discussion 11
References 45
n
TABLE OF FIGURES
1. Ektachem bilirubin linearity 15
2. Ektachem albumin linearity 16
3. Ektachem amylase linearity 17
4. Ektachem sodium linearity 19
5. Ektachem potassium linearity 20
6. Ektachem chloride linearity 21
7. Ektachem carbon dioxide linearity 22
8. Bilirubin comparison of the Ektachem methodology
and the Evelyn-Mai loy method 24
9. Albumin comparison of the Ektachem methodology
and a BCG method 25
10. Amylase comparison of the Ektachem methodology
and a nephelometric method 27
11. Sodium comparison of the Ektachem methodology
and an ion selective method 28
12. Potassium comparison of the Ektachem methodology
and an ion selective method 29
13. Chloride comparison of the Ektachem methodology
and a coulometric titration method 30
14. Carbon dioxide comparison of the Ektachem methodology
and a differential pH rate method 31
m

TABLE OF TABLES
1. Ektachem precision data 12
2. Ektachem linearity data 14
3. Patient comparison data 23
4. Triglyceride interference in sodium and potassium
measurements 33
5. Triglyceride interference in amylase measurements 35
6. Protein interference in sodium and potassium
measurements 36
7. Hemolysis interference in bilirubin measurements 37
8. Iodine interference in chloride and carbon dioxide
measurements 39
iv

ACKNOWLEDGEMENT
I would like to thank Dr. Tai Kwong and Frank Mirabel! a for
their valuable time, advice and guidance which they gave
enthusiastically to help me complete this project. A very special
thanks is due to Dr. Alfred Bacharach for his support throughout this
project and his editorial guidance. Also, I would like to thank Don
Garrett for his valuable assistance and instruction in the
preparation of the computer graphics.
ABSTRACT
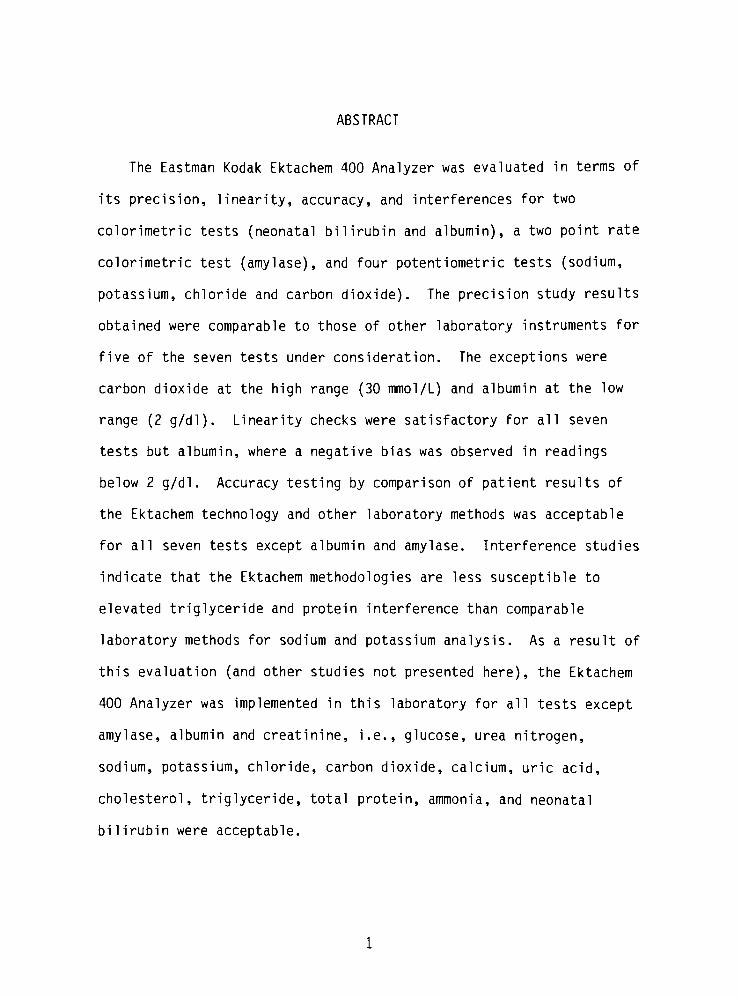
The Eastman Kodak Ektachem 400 Analyzer was evaluated in terms of
its precision, linearity, accuracy, and interferences for two
colorimetric tests (neonatal bilirubin and albumin), a two point rate
colorimetric test (amylase), and four potentiometric tests (sodium,
potassium, chloride and carbon dioxide). The precision study results
obtained were comparable to those of other laboratory instruments for
five of the seven tests under consideration. The exceptions were
carbon dioxide at the high range (30 mmol/L) and albumin at the low
range (2 g/dl). Linearity checks were satisfactory for all seven
tests but albumin, where a negative bias was observed in readings
below 2 g/dl. Accuracy testing by comparison of patient results of
the Ektachem technology and other laboratory methods was acceptable
for all seven tests except albumin and amylase. Interference studies
indicate that the Ektachem methodologies are less susceptible to
elevated triglyceride and protein interference than comparable
laboratory methods for sodium and potassium analysis. As a result of
this evaluation (and other studies not presented here), the Ektachem
400 Analyzer was implemented in this laboratory for all tests except
amylase, albumin and creatinine, i.e., glucose, urea nitrogen,
sodium, potassium, chloride, carbon dioxide, calcium, uric acid,
cholesterol, triglyceride, total protein, ammonia, and neonatal
bilirubin were acceptable.

INTRODUCTION
The evaluation of the Ektachem 400 Analyzer was performed by this
laboratory in conjunction with the Eastman Kodak Co. The goal of the
study was to evaluate data representative of the three types of
chemistries available on the analyzer, i.e., colorimetric, two point
rate colorimetric and potentiometric. Previous experience with two
prototype instruments, the Ektachem Four Chemistry Analyzer and the
Ektachem Electrolyte Analyzer, provided a sound base of experience
with the "drychemistry"
technique employed by the Ektachem 400. In
this form of technology, all of the components necessary to measure
concentration (colorimetric), enzyme rate (two point rate
colorimetric), or ion activity (potentiometric) are contained within
a single, analyte-specif ic, disposable, 2.4 mm x 2.8 mm x 0.1 mm
slide. After the slide is spotted with a 10 ul drop of patient
serum, it is shuttled into an incubator for color development
(colorimetric) or electrical potential development (potentiometric).
Approximately five minutes later, the slide is moved into the
reflectometer (colorimetric) or electrometer (potentiometric) where
appropriate readings are taken to determine concentration, enzyme
rate or ion activity results. The instrument is standardized weekly
with lyophilized calibrators available from the manufacturer.
Colorimetric tests use a minimum of three calibration points while
potentiometric calibration consists of a two point line. The basic
dry chemistry technology, methodologies and principles of operation
are similar for all of the Eastman Kodak Ektachem instruments, i.e.,
the Four Chemistry Analyzer, Electrolyte Analyzer, 400 Analyzer, 700
Analyzer, Desk Top Analyzer and Desk Top Electrolyte Analyzer.
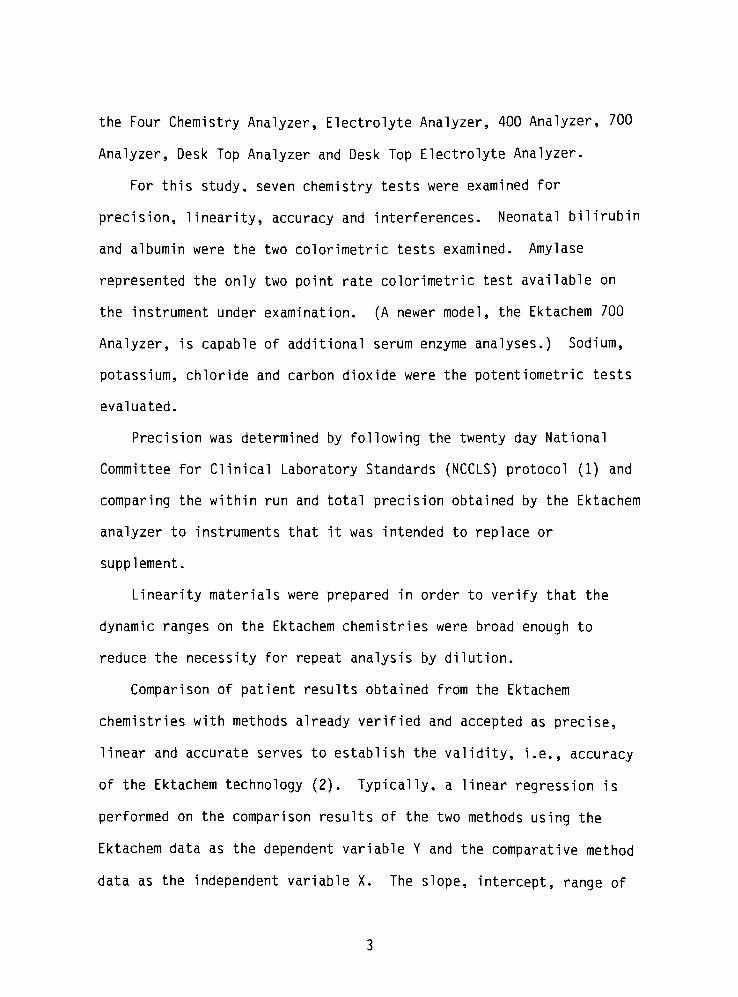
For this study, seven chemistry tests were examined for
precision, linearity, accuracy and interferences. Neonatal bilirubin
and albumin were the two colorimetric tests examined. Amylase
represented the only two point rate colorimetric test available on
the instrument under examination. (A newer model, the Ektachem 700
Analyzer, is capable of additional serum enzyme analyses.) Sodium,
potassium, chloride and carbon dioxide were the potentiometric tests
evaluated.
Precision was determined by following the twenty day National
Committee for Clinical Laboratory Standards (NCCLS) protocol (1) and
comparing the within run and total precision obtained by the Ektachem
analyzer to instruments that it was intended to replace or
supplement.
Linearity materials were prepared in order to verify that the
dynamic ranges on the Ektachem chemistries were broad enough to
reduce the necessity for repeat analysis by dilution.
Comparison of patient results obtained from the Ektachem
chemistries with methods already verified and accepted as precise,
linear and accurate serves to establish the validity, i.e., accuracy
of the Ektachem technology (2). Typically, a linear regression is
performed on the comparison results of the two methods using the
Ektachem data as the dependent variable Y and the comparative method
data as the independent variable X. The slope, intercept, range of

values, correlation coefficient and standard error of the estimate
(S ) from regression data is examined in order to determine howJ x
well the two methods agree.
Four interference studies were performed to determine their
effect upon Ektachem measurements. Elevated triglyceride
interference of sodium, potassium and amylase analyses was examined.
The effect of elevated serum protein levels on sodium and potassium
measurements was evaluated. Hemolysis effects on bilirubin
determination and iodine effects on chloride and carbon dioxide
measurements were also studied.
MATERIALS AND METHODS
EKTACHEM METHODOLOGIES
Colorimetric. The colorimetric tests on the Ektachem 400 are
measured by reflection densitometry (3). The optical system consists
of a tungsten-halogen type lamp light source which passes through the
appropriate filter for a specific chemistry and then is reflected by
a mirror onto the bottom center of the slide at a45 angle. A
photocell located directly below the slide receives the reflected
light at a90
angle to the plane of the slide. For neonatal
bilirubin measurement, patient serum is applied to the spreading
layer which contains caffeine, sodium benzoate and surfactants which
dissociate bilirubin from albumin. The free bilirubin migrates to
the next layer where it is bound to a mordant. This binding enhances
the molar absorptivity of bilirubin measured at 400 nm. In the
analysis of albumin, bromcresol green (BCG) diffuses up from the
middle layer into the above spreading layer where patient serum had
been applied. Here the BCG binds to the albumin to form a complex.
The concentration of the complex is measured by reflection
densitometry at 630 nm. and is proporational to the amount of albumin
present in the serum. For amylase analysis, patient serum is applied
onto the spreading layer of the slide which contains the dyed starch
substrate. Amylase present in the serum hydrolyzes the starch to
smaller sacchardies which migrate into the next layer of the slide
where they become bound to a mordant. The density of the dye is
measured by reflectance at 540 nm. at two minutes and again at five

minutes. The change in reflection density is proportional to the
amylase activity in the serum.
Potentiometric. Sodium, potassium, chloride and carbon dioxide
are measured potentiometrically. Each electrolyte slide consists of
two identical electrodes (4). Unknown patient serum is applied to
the indicator electrode while a known, manufacturer-supplied
reference fluid is simultaneously applied to the reference electrode.
The potential difference between the two electrodes is measured
according to the following equation (5):
R T attest
E = 2.303 log + Ejn F a-jref
where R = gas constant
T = absolute temperature
n = charge on the ion
F = Faraday constant
a-jtest =
activity of the ion being measured by the indicator
electrode
a^ref =
activity of the ion being measured by the reference
electrode
Ej= junction potential
The basic structure of the electrolyte slide consists of three
layers: the upper layer onto which sample is applied; the ion-
selective membrane layer which is sensitive and specific to the
particular electrolyte being measured; and the reference Ag/AgCl
layer. The ion selective membrane is made of methyl monesin in the
sodium slide and valinomycin in the potassium slide. An ammonium
chloride salt and membrane solvent exchange system provide the
selectivity in the carbon dioxide slide. The activity of carbonate
ion in serum is measured in the analysis of carbon dioxide. A linear
relationship exists between carbonate ion activity and carbon dioxide
at the pH and ionic strength conditions of the slide (6).
The instrument used to evaluate the Ektachem dry (slide)
chemistries was the Ektachem 400 Analyzer (Eastman Kodak Co.,
Rochester, NY 14650). It was operated according to manufacturer
specifications unless otherwise indicated. All test slide
cartridges, calibrators, tips and caps were obtained from the
manufacturer.
EXPERIMENTAL PROTOCOLS
Precision study. The normal weekly calibration of the instrument
was, for the purposes of this study, modified to a daily one.
Following calibration, two runs were completed on the instrument with
a minimum of four hours between the runs. Each run consisted of
duplicate aliquots of both a high and low level of lyophilized,
bovine-based, commercial control material. This protocol was
followed for twenty days, using the same lot of calibrators and slide
cartridges throughout. Within-run and total precision were
calculated.
Linearity study. For the neonatal bilirubin linearity study, a
30 mg/dl standard was prepared from National Bureau of Standards
(NBS) bilirubin material (National Bureau of Standards, Washington,
DC 20234) and dilutions were made with a 7 g/dl albumin solution.
Albumin linearity was determined by analyzing a series of dilutions
of a serum pool with added human albumin, fraction V (Sigma Chemical
Co., St. Louis, MO 63178) to achieve an albumin concentration of
7 g/dl. Dilutions were made with a 7 g/dl gamma globulin solution,
fraction II (Mann Research Laboratories, Inc., New York, NY). For
the amylase linearity study, dilutions of an elevated amylase serum
pool were made with 0.9% saline. For the electrolyte linearity
study, analytical reagent grade sodium chloride (NaCl) or potassium
bicarbonate (KHCO3) (Mallinckrodt Chemical Works, St. Louis, MO
63160) was added to a human serum pool to yield concentrations of
250 mmol/L, 14 mmol/L, 175 mmol/L and 55 mmol/L for sodium,
potassium, chloride and carbon dioxide, respectively. Dilutions of
this pool were then made with an electrolyte-free, human serum pool
obtained by dialyzing a normal serum pool against distilled water to
remove the electrolytes.
Accuracy study. Comparison analysis between the Ektachem
methodologies and the instruments and methods cited below were
completed within two hours of one another. The samples consisted of
freshly drawn patient sera separated into two aliquots at the time of
laboratory sample processing. During the study, the same lot number
of slide cartridges was used for each specific chemistry tested. The
comparison instruments were calibrated and operated according to the
laboratory's established operating protocol. For a period of twenty
days, two patient serum samples from infants less than fourteen days
old were analyzed for neonatal bilirubin and compared to total
bilirubin as determined by a modification of the Evelyn-Malloy method
(7) on a Perkin-Elmer Model 200 Spectrophotometer. For a period of
twenty days, ten patient serum samples were analyzed daily for
albumin and compared to the BCG method (8) of the SMA 12/60 Analyzer
(Technicon Corp., Tarrytown, NY 10591). For a ten day period, five
patient serum samples were analyzed daily for amylase and compared to
the nephelometric method (9) employed by the Perkin-Elmer Model 91
Amylase-Lipase Analyzer (Perkin-Elmer Corp., Oak Brook, IL 60521).
For a ten day period, five patient serum samples were analyzed daily
for electrolytes and compared to data obtained from the Beckman Astra
8 Analyzer (Beckman Instruments, Inc., Fullerton, CA 92634). The
Astra 8 employs ion selective electrodes for sodium and potassium
analysis, coulometric titration for chloride analysis and
differential pH rate measurements for carbon dioxide determinations
(10). Although both the Ektachem and Astra 8 employ ion selective
electrodes for the analysis of. sodium and potassium, the Astra 8
methodology is an indirect potentiometric measurement since the serum
sample is diluted and molarity concentration is determined.
Interference study. Elevated triglyceride interference studies
on sodium, potassium and amylase measurements were performed using
solutions prepared from Liposyn-10% intravenous fat emulsion (Abbott
Laboratories, N. Chicago, IL 60064). The elevated protein
interference study on sodium and potassium determinations was
performed with protein solutions prepared by the addition of human

albumin, fraction V and gamma globulin, fraction II to a serum pool.
Hemolysis interference in bilirubin measurements was studied using a
hemolysate prepared by washing human red blood cells with distilled
water three times to obtain a 7 g/dl hemoglobin stock hemolysate
solution. Iodine interference in chloride and carbon dioxide
determinations was determined using solutions of US Pharmacopia grade
potassium iodide (KI) (Mallinckrodt Chemical Works, St. Louis, MO
63160).
10
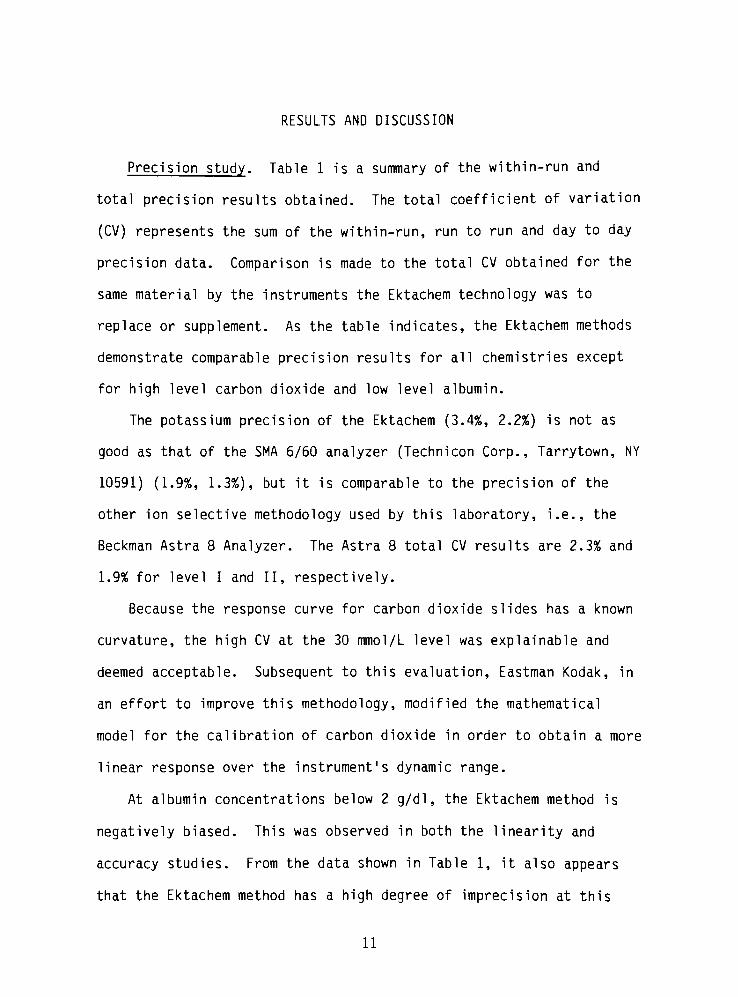
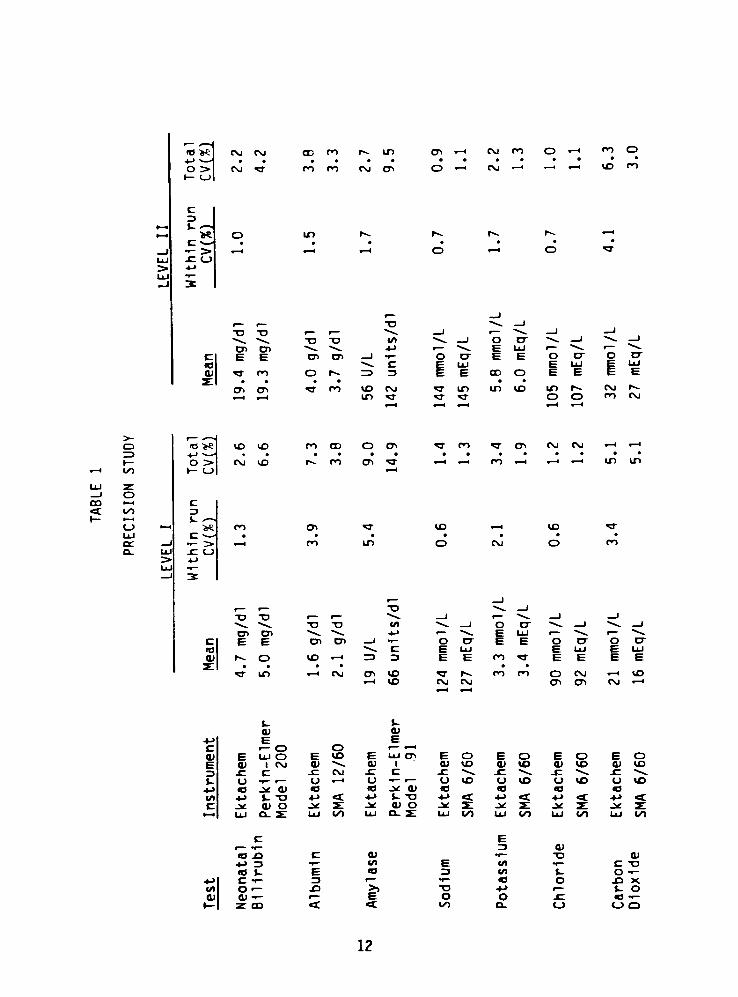
RESULTS AND DISCUSSION
Precision study. Table 1 is a summary of the within-run and
total precision results obtained. The total coefficient of variation
(CV) represents the sum of the within-run, run to run and day to day
precision data. Comparison is made to the total CV obtained for the
same material by the instruments the Ektachem technology was to
replace or supplement. As the table indicates, the Ektachem methods
demonstrate comparable precision results for all chemistries except
for high level carbon dioxide and low level albumin.
The potassium precision of the Ektachem (3.4%, 2.2%) is not as
good as that of the SMA 6/60 analyzer (Technicon Corp., Tarrytown, NY
10591) (1.9%, 1.3%), but it is comparable to the precision of the
other ion selective methodology used by this laboratory, i.e., the
Beckman Astra 8 Analyzer. The Astra 8 total CV results are 2.3% and
1.9% for level I and II, respectively.
Because the response curve for carbon dioxide slides has a known
curvature, the high CV at the 30 mmol/L level was explainable and
deemed acceptable. Subsequent to this evaluation, Eastman Kodak, in
an effort to improve this methodology, modified the mathematical
model for the calibration of carbon dioxide in order to obtain a more
linear response over the instrument's dynamic range.
At albumin concentrations below 2 g/dl, the Ektachem method is
negatively biased. This was observed in both the linearity and
accuracy studies. From the data shown in Table 1, it also appears
that the Ektachem method has a high degree of imprecision at this
11
*o >e
o >i i_>
CM CM
cm-a-
CD po
m co cvi a.
CT> i
O <
cm po
CM r-<
O po o
to n
c
i-
>
ID
o
r-4.
.
o
r r T3
o
E
X)
E C7>
X>
_i
c
3IT po o r^- 13
CT.
c
CO3"
po to
in
CMa-
oLU
E
E
00
E
O
O
iLU
E
oLlJ
E
a-
IT) in ID in
o o
CM
CM
o
^H l/>
<o >
o >i <_>
iX) ID
CM ID
ro co
i^ po
o cr>a-
CTl CM cm . t . I
co > i h h in in
i ono i4
t lOI
CJ
LlJ
OH
>e PO
PO in
ID
o
ID
O PO
, , T3 "4*^ _l
"D X3 ir **4^ 1 r ^^ _) _l
^4. T3 T3 w _l oD"
^s^ 1 "44^ |
cr> CJ. 44^ 44^, - 1 *^*_ E LUr "4^ "44^.
c E E CD cn 1 i
o cr E E oD-
o cr
tO ^4. c E LU E UJ E uj
at r^ o ID X-1 ~3 3 E E PO ^r E E E E
i-
a-
in
i-
cu
E
.-H CM <y> to
to
J-
OI
E
CMil
CM4-1
PO PO o CM
CD
^- WD
CM x-1
c o or 1
a> E LU O E to E LU CT) E o E O E O E O
E CU 1 CM CU ^4^ o> 1 CU to CU to cu to cu to
3 -C c .c CM jr. C -C "4*. jz "4^^ ^ ^4^ -C -4.
$- <J i o 1 ur-
I o to u to u to (J to
4-> .* QJ 93 (O J* CU 10 a <o a
/> 4-> *- -o U <z+- i- TJ> +J <c ->-> -c +J <t. +j <t
c -* CD O .*: z: .* Q) o .* JL .* Si .^^r j^ z:
t i LU Ct- X LU to LU o_ z: LU to LU to LU to LU tO
c Erf 3 cu
u .o c OI r-
T3 cu-J 3
"f l/l E (/) ^~
C T3
B t E o 3 in J- Oi-
i-> c r 3r f
ca o -O X
(A or JO >) "O -
r J- oQ) tt)
^~ r E O o .C
1-
h- CO <t t CO o. <_) (_> 3
12
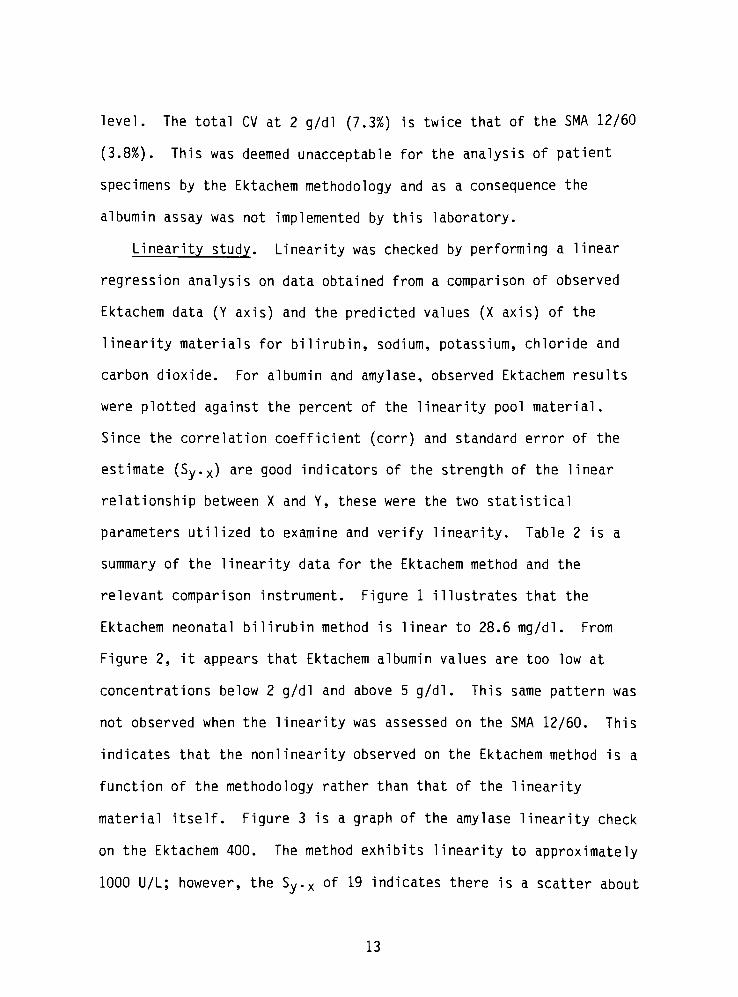
level. The total CV at 2 g/dl (7.3%) is twice that of the SMA 12/60
(3.8%). This was deemed unacceptable for the analysis of patient
specimens by the Ektachem methodology and as a consequence the
albumin assay was not implemented by this laboratory.
Linearity study. Linearity was checked by performing a linear
regression analysis on data obtained from a comparison of observed
Ektachem data (Y axis) and the predicted values (X axis) of the
linearity materials for bilirubin, sodium, potassium, chloride and
carbon dioxide. For albumin and amylase, observed Ektachem results
were plotted against the percent of the linearity pool material.
Since the correlation coefficient (corr) and standard error of the
estimate (Sy.x) are good indicators of the strength of the linear
relationship between X and Y, these were the two statistical
parameters utilized to examine and verify linearity. Table 2 is a
summary of the linearity data for the Ektachem method and the
relevant comparison instrument. Figure 1 illustrates that the
Ektachem neonatal bilirubin method is linear to 28.6 mg/dl. From
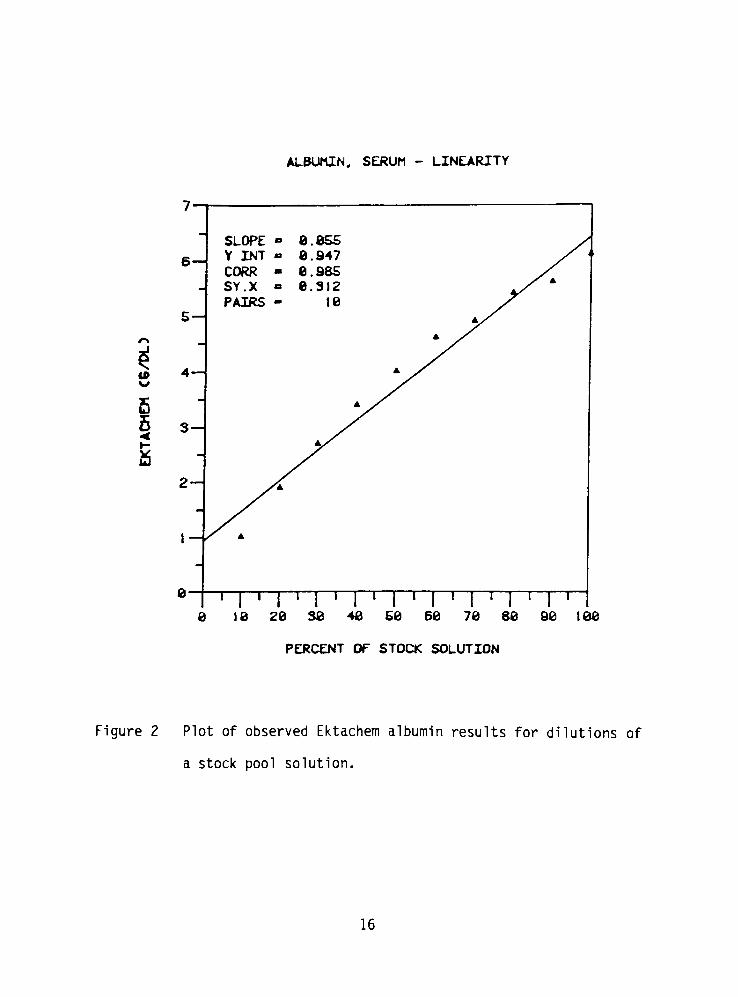
Figure 2, it appears that Ektachem albumin values are too low at
concentrations below 2 g/dl and above 5 g/dl. This same pattern was
not observed when the linearity was assessed on the SMA 12/60. This
indicates that the nonlinearity observed on the Ektachem method is a
function of the methodology rather than that of the linearity
material itself. Figure 3 is a graph of the amylase linearity check
on the Ektachem 400. The method exhibits linearity to approximately
1000 U/L; however, the Sy.x of 19 indicates there is a scatter about
13

TABLE 2
LINEARITY STUDY
Test Instrument Ranqe of Linearity
Bilirubin Ektachem 0.7-28.6 mg/dl
Perkin-Elmer
Model 200
not tested
Albumin Ektachem 1.0-6.1 g/dl
SMA 12/60 0.7-4.5 g/dl
Amylase Ektachem 14-1008 U/L
Perkin-Elmer
Model 91
0-490 units/dl
Sodium Ektachem 94-250 mmol/L
Astra 8 92-209 mmol/L
Potassium Ektachem 1.0-14.1 mmol/L
Astra 8 0.8-11.1 mmol/L
Chloride Ektachem 64-162 mmol/L
Astra 8 75-153 mmol/L
Carbon
Dioxide
Ektachem
Astra 8
5-50 mmol/L
8-43 mmol/L
0.26
Corr
.999
0.31 .985
0.08 .999
19.0 .998
13.6 .998
2.1 .999
0.9 .999
0.2 .999
0.07 .999
0.6 .999
0.5 .999
1.4 .996
0.2 .999
14

BILIRUBIN. -SERUM- LINEARITY
se
as
?B
SLOPE - 1.963 /Y .INT
--6.431 /
corr i.eee /SY.X - 8. .281 /PAIRS 11 /
16
<
5
e-
i i i i | i i i i | i i i i | i i i i | i i i i | i i i i
8 6 16 IS 28 25 38
THEORETICAL CM6/DL3
Figure 1 Plot of observed Ektachem bilirubin results for dilutions
of a stock standard solution.
15
ALBUMIN, SERUM - LINEARITY
tP
5<
1
SLOPE 8.8S5
6Y INT
CORR -
8.947
8.985
SY.X
PAIRS -
8.312
18
jf A
S *x
A
4 A
3
2-
0-
1 I ' I ' I ' I ' I ' I ' I ' I ' I '
8 18 20 38 48 SB 68 70 88 90 1.88
PERCENT OF STOCK SOLUTION
Figure 2 Plot of observed Ektachem albumin results for dilutions of
a stock pool solution.
16

AMYLASE, SERUM - LINEARITY
I2M
1088-
r>888-
688
s488
288
8 1 I ' I ' I ' I ' I I ' I ' I ' I '
8 18 20 30 40 50 60 70 80 90 100
PERCENT OF ELEVATED PATIENT POOL
Figure 3 Plot of observed Ektachem amylase results for dilutions of
an elevated patient pool.
17
the regression line. This could be due to the assessment of enzyme
linearity by a dilution technique. Figure 4 reflects Ektachem sodium
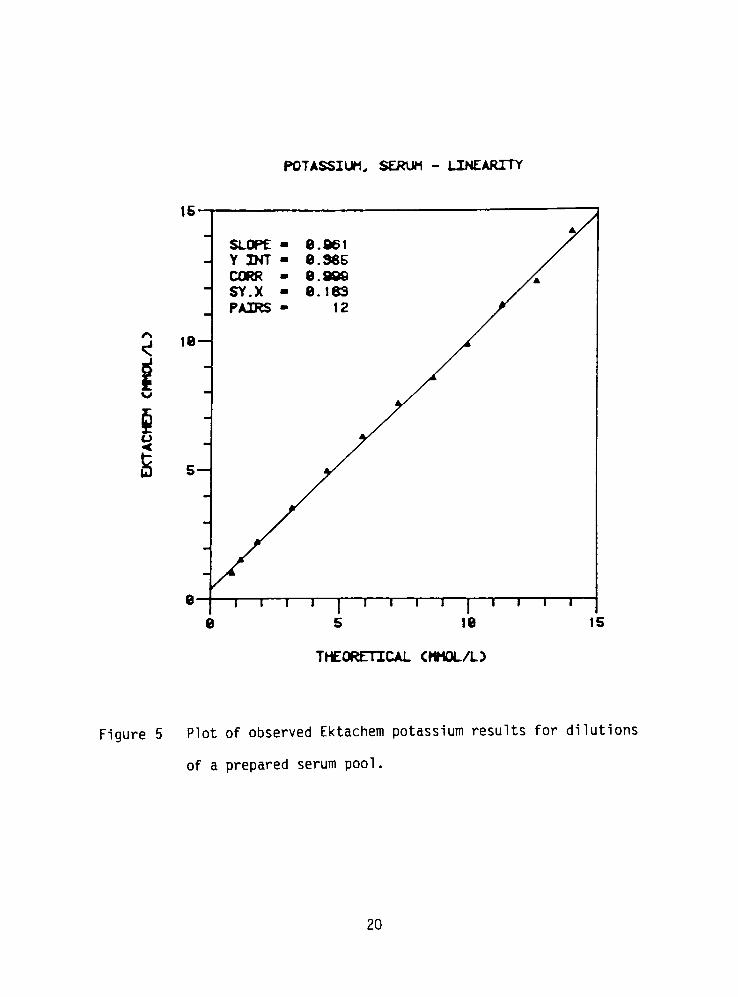
linearity from 94 to 250 mmol/L. Figure 5 illustrates that the
Ektachem potassium methodology is linear from 1.0 to 14.1 mmol/L.
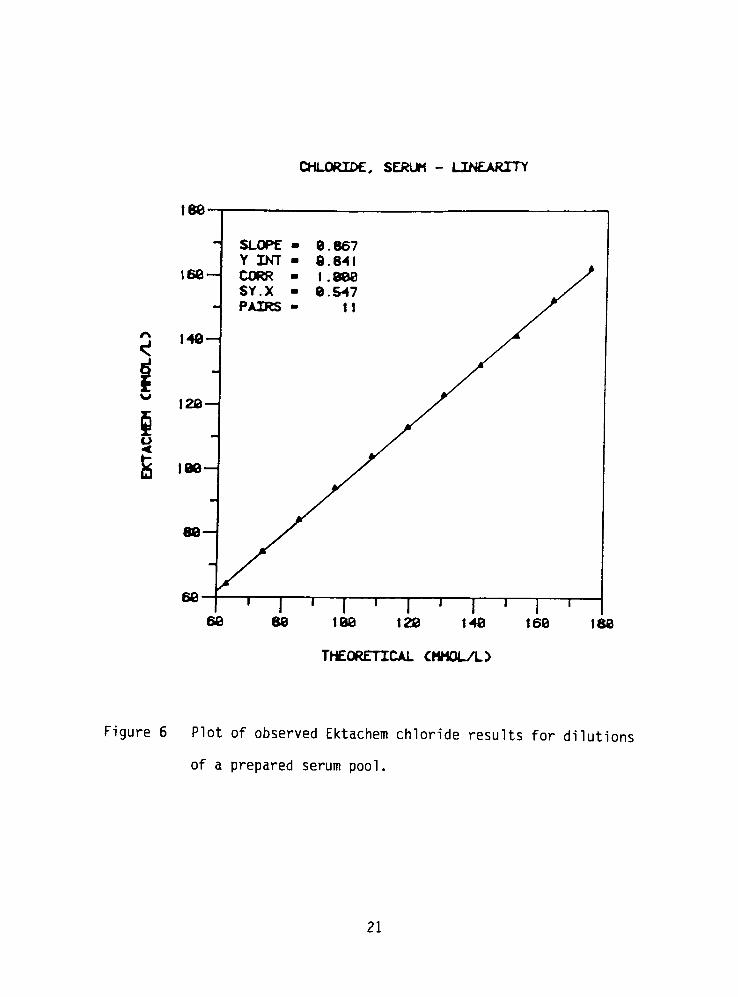
Figure 6 is a graph of Ektachem chloride linearity from 64 to
162 mmol/L. Figure 7 is a graphic illustration of Ektachem carbon
dioxide linearity over the range of 5 to 50 mmol/L. It should be
noted that the Ektachem range of linearity for the electrolytes is
greater than that of the Astra 8.
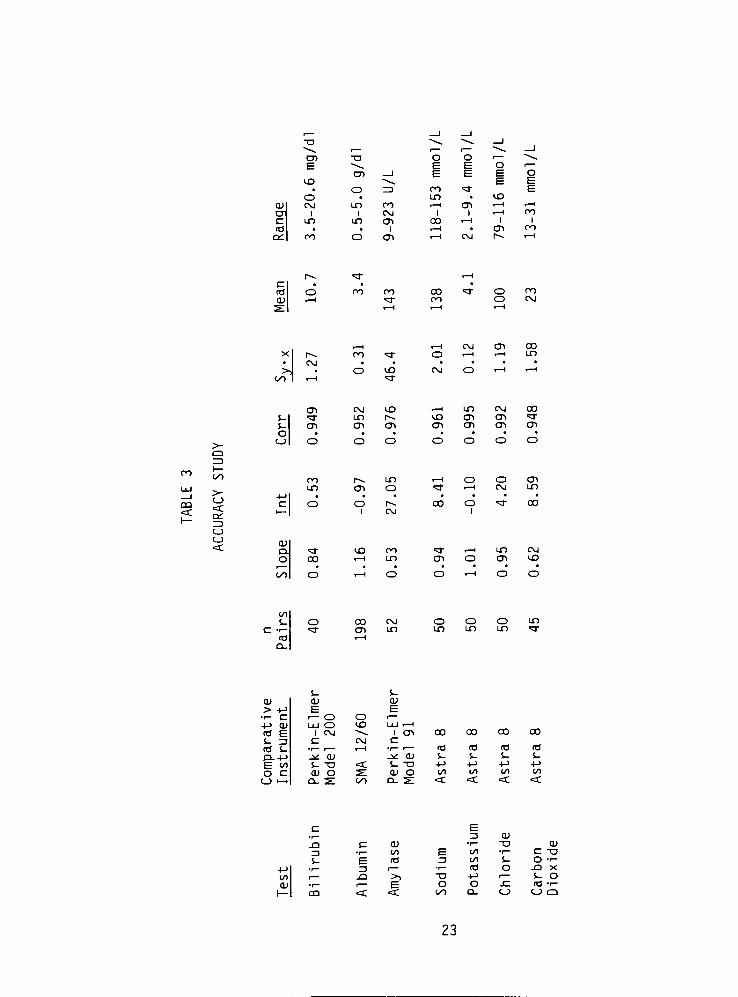
Accuracy study. Table 3 summarizes the linear regression
statistics obtained from the comparison of fresh patient serum
samples run on both the Ektachem and the comparative instruments
indicated. The data reveals that all chemistries tested had corr. of
0.95 or greater. The Sy.x was acceptable for all tests with the
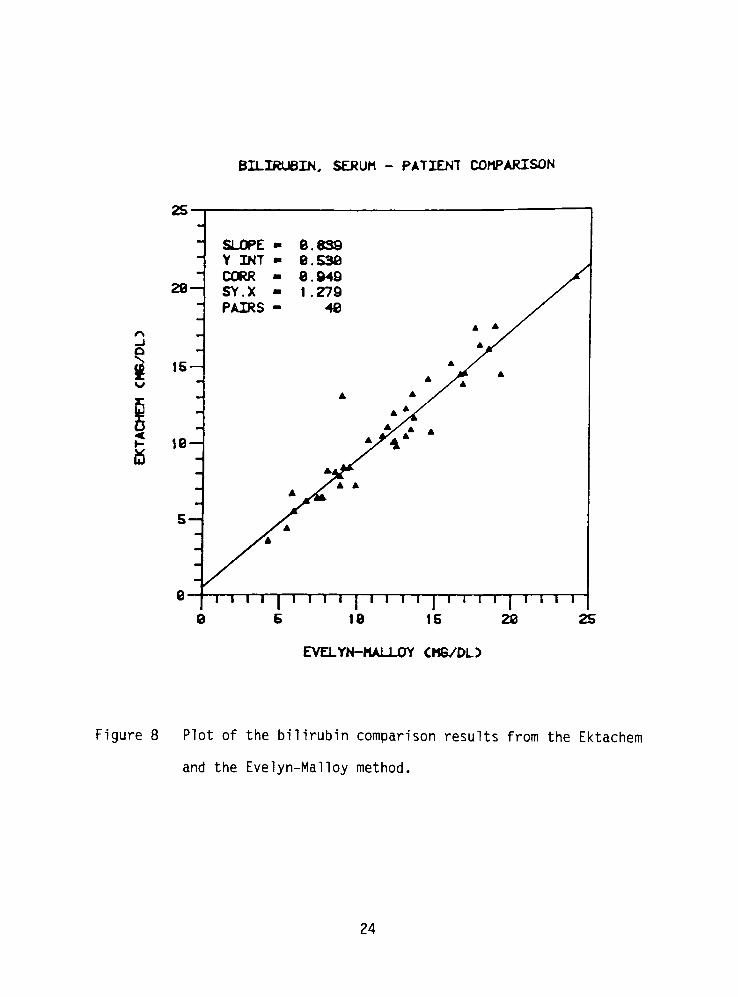
exception of amylase. Figure 8 is a graph of the comparison of
neonatal bilirubin data analyzed by the Ektachem with a modified
Evelyn-Mai loy method. The regression equation is Y = 0.839X + 0.53
with a corr. of 0.95 which was found to be acceptable. Figure 9 is a
graph of the patient comparison of albumin results obtained from the
Ektachem with the BCG method of the SMA 12/60. The regression
equation is Y = 1.157X - 0.971 with a corr. of 0.95. From the graph
it appears that Ektachem values in the range of less than 2 g/dl are
inappropriately low. When Eastman Kodak was presented with the
evidence of this negative bias in the low range, they repeated some
of the samples in their own laboratories using both the Ektachem
18

SODIUM, SERUM - LINEARITY
u
1 I ' I ' I ' I ' I ' I ' I '
75 188 125 158 175 208 225 258 275
THEORETICAL CMMOL/L)
Figure 4 Plot of observed Ektachem sodium results for dilutions of
a prepared serum pool.
19
POTASSIUM, SERUM - LINEARITY
is
le
ts
5
8-
SLOPE 8 ,86t
Y INT e 385
CORR 8 .999
SY.X e 163
PAIRS 4* 12
t i i r
8 5
T I TT18
T I 1 T
15
THEORETICAL <MMOL/L>
Figure 5 Plot of observed Ektachem potassium results for dilutions
of a prepared serum pool .
20
CHLORIDE, SERUM - LINEARITY
168
T68
T68
1188
r120 148
THEORETICAL <MMOL/L:>
188
Figure 6 Plot of observed Ektachem chloride results for dilutions
of a prepared serum pool .
21

CARBON DIOXIDE, SERUM -.LINEARITY
TV
wa
ge
48-
SLOPE - 8.862
Y INT - 2.734
CORR - 8.986
SY.X - 1.361
PAIRS - 11A X
30
X*
S 28-
19-
9-
I I I I | I I I I | I I I I | I I I I | I I I I | I I I I |8 18 28 38 48 58 68
THEORETICAL CHM0L/L3
Figure 7 Plot of observed Ektachem carbon dioxide results for
dilutions of a prepared serum pool.
22
ID
OCU CM
CT 1
c uo
(0 .
Oi CO
T3
CD
O
in
i
in
O<
oo
CM
CT)
I
CT)
F E O i
F E E o
E b=
oo <4T t=
un . CD
4 1 CT) x-f t-H
1 1 H ro
on H 1 i
4 1 . CT) PO
H CM r-. 4-H
43-
ro co coPO
o
o
ro
CM
>-
C3
>)00
s-
s-
o
,_| 41 CM CT) 00
r-4. oo <4T o x-l .I lo
CM
o VO CM O . i 4 1
41 "4T
CT) CM VD 4 1 LO CM co
<cr ID r-. VD CT) CT) >=r
CT) CTl CT) CT) CT) CT) CT)
CQ
<
>-
<c
OH
C_J
<c
oo
un
r-4
CD O
4 1 Ox-l
o
CM
CT>
O O1
l~4.
CM
00 o
1
d-
oo
CU
Q.
O 00
VD 0O
x-i un
<3-
CT)
in
CT)
CM
VD
H O
CO
4- o oo CM O o o un
"=r CD in un un un =T
ra 41
Q.
s- $-
cu d) cu
> 4-> E Er- a
i
O o i
4-> CU LU O VD LU H
<0 E 1 CM 4^ 1 CT) oo 00 co 00
s- rj c CM C
<a i- r
I 4 14
1 tO <o (O 03
Q-+-> J* CU^> cu s- s- s- S-
E oo S- TJ <t S- "O +-> +-> +-> -l->
o c (D O s: cu o CO </l cd 1/1
c_> >. ci. s: LO d_ s: <C <: < <:
+->
CO
cuI
., rj cu
.a C CU i "O cu
rj.f CO E co
r C "O
S- E td rj CO s- o <-
rj i..
<e o -Q X
, -Q >> -a -i-> 1 s- o.f
! E o o -C <d-i-
QQ =C <C L-O Q. o c_> a
23
BILIRUBIN, SERUM - PATIENT COMPARISON
_i
2S-
28-
15
ie-
s-
SLOPE 8 .639
Y INT m 9 .538
CORR m 9 .949
SY.X m 1 279
PAIRS - 48
9-
.EVELYN-MALLOY CM6/DL>
Figure 8 Plot of the bilirubin comparison results from the Ektachem
and the Evelyn-Mai loy method.
24

ALBUMIN, SERUM - PATIENT COMPARISON
*
6
5
~ 4_i
a
to
3-
ro<
SLOPE- 1 .157
Y .INT- -e 971
CORR - e 952
sy.x - e 313
PAIRS - 196
2
1-
8-
8
BROMCRESOL GREEN C6/DL)
Figure 9 Plot of the albumin comparison results from the Ektachem
and the BCG method of the SMA 12/60.
25

methodology and the LaureTI rocket electrophoresis technique (11).
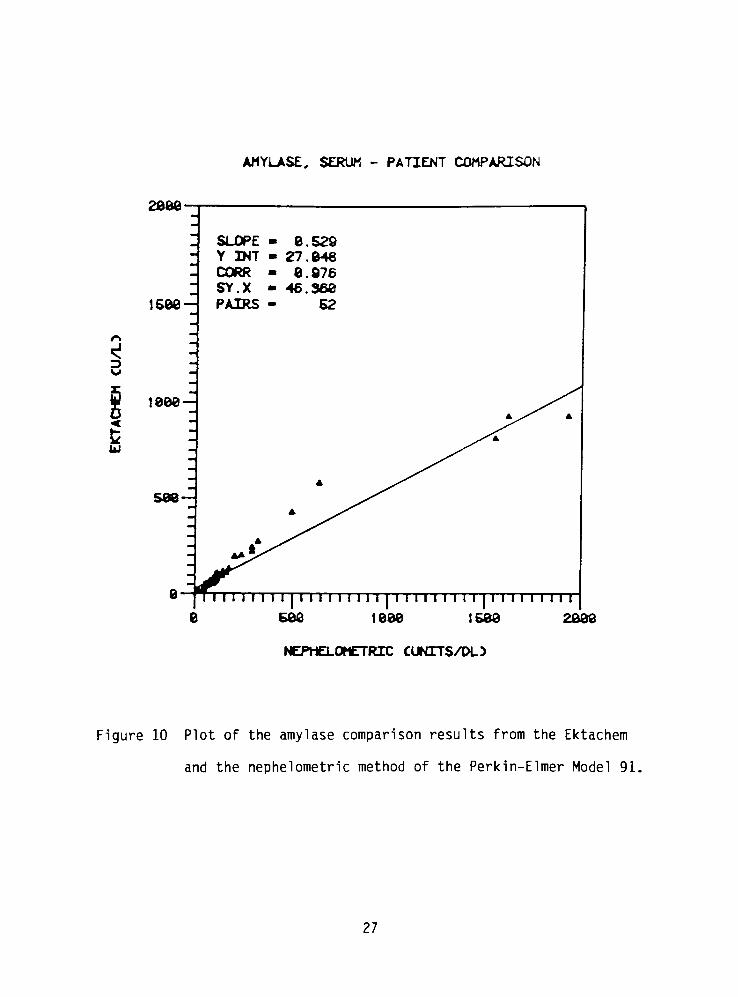
Their results confirmed those obtained during this study. Figure 10
is a graph of the comparison of patient amylase results obtained by
the Ektachem and the nephelometric methodology of the Perkin-Elmer
Model 91. The regression equation is Y = 0.529X + 27.048 with corr.
of 0.98. An examination of the data points in Figure 10 reveals that
the inclusion of the three highest amylase values is the cause of the
low slope value and the high Sy.x value of 46. If these data points
were excluded, the slope would be closer to one and the Sy.x would be
considerably reduced. Before this methodology could be accepted, a
further evaluation of data in the range above 600 U/L is mandatory.
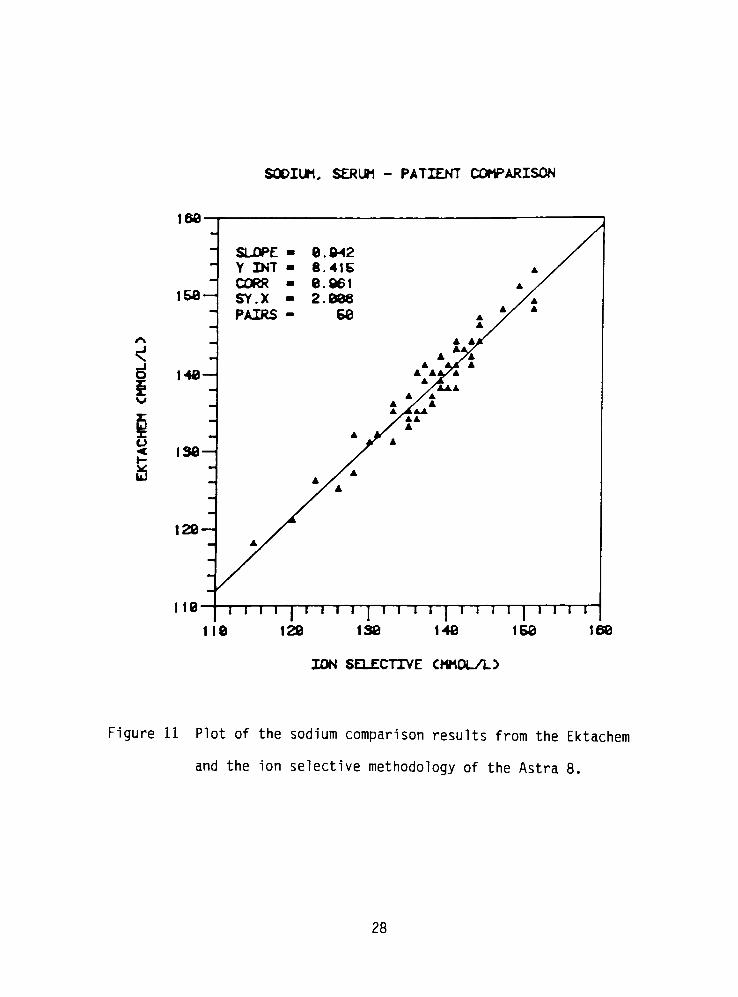
Figure 11 is a graph of the sodium determinations by two ion
selective methodologies, the Ektachem and the Beckman Astra 8. The
regression equation is Y = 0.942X + 8.415 with a corr. of 0.96 which
was found to be acceptable. Figure 12 is a graph of the patient
comparison results of potassium measurements made by the Ektachem and
the ion selective method of the Astra 8. The regression equation is
Y = 1.007X - 0.97 with a corr. of 0.995 which was accepted.
Figure 13 is a graph of the chloride patient comparison of the
Ektachem and the Astra 8 which employs a coulometric titration method
to measure chloride. The regression equation is Y = 0.947X + 4.203
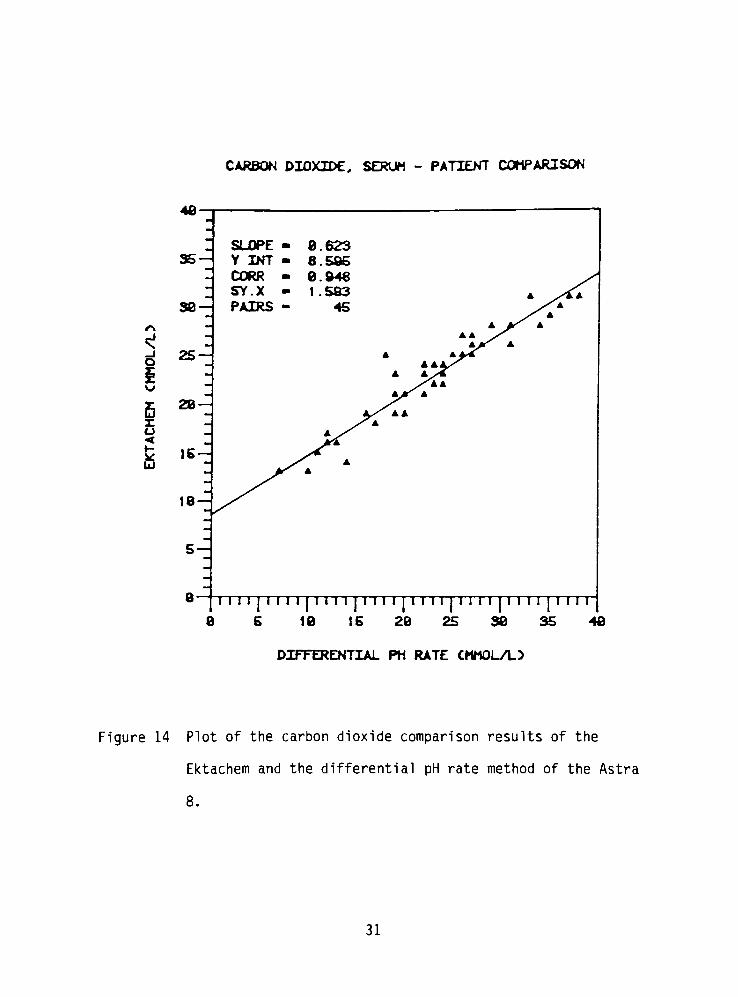
with a corr. of 0.992 which was deemed acceptable. Figure 14 is a
graph of the comparison of patient carbon dioxide samples analyzed on
the Ektachem and the Astra 8 which measures carbon dioxide by a
differential pH method. The regression equation is Y = 0.623X +
26
AMY.LASE, SERUM - PATIENT COMPARISON
3
UJ
cjowc
SLOPE - 6.529-
Y INT - 27.948
- CORR - 9.976
SY.X - 46.368
1588-^ PAIRS - 52
1QQQ
598
0 I I i I I I I | M I I I I I I I [ I II I I I I I I | I I I I I I M I
8 588 1888 1588 2088
NEPHELOMET.RIC CUNITS/DL>
Figure 10 Plot of the amylase comparison results from the Ektachem
and the nephelometric method of the Perkin-Elmer Model 91.
27
SODIUM, SERUM - PATIENT COMPARISON
o
fi
166-
158-
148
SLOPE e 942
Y .INT- 8 415
CORR e 961
SY.X 2 988
PAIRS - 58
139
129-
119 I I I I | I I I I | I I 1 1 | I I I I | 1 1 I I
119 120 138 148 158 168
ION SELECTIVE CMMOL/L5
Figure 11 Plot of the sodium comparison results from the Ektachem
and the ion selective methodology of the Astra 8.
28

POTASSIUM, SERUM - PAT.IENT COMPARISON
E
<
19
6-
6-Z
5
4
3
2-^
1
SLOPE - 1 887
Y INT - -8 997
CORR - 8 995
SY.X - 8 116
PAIRS - 58
e mi 1 1 1 ii i ji u ip in |i i ii | in 1 1 1 1 1 1 ii 1 1 1 1 1 1 i|i in
8 I 23456768 18
ION SELECTIVE CMMOL/L5
Figure 12 Plot of the potassium comparison results from the Ektachem
and the ion selective methodology of the Astra 8.
29

CHLORIDE, SERUM - PATIENT COMPARISON
129
68 98 198 118
COULOMETRIC TITRATION CMMOL/L5
128
Figure 13 Plot of the chloride comparison results from the Ektachem
and the coulometric titration method of the Astra 8.
30
CARBON D.IOXIDE, SERUM - PATIENT COMPARISON
_i
o
i
ra<i-
UJ
-UJ
SLOPE . 8.623
35-^ Y INT 6.585
CORR 8.946
SY.X 1.583 A /'A
38 ~ZPAIRS 45 ./a
A
AA""^
A
A A/^
A
25 A 4ti4
aaaXA A/
/i*
t/ A
28~Z aXaa
A
- A^X
Ar-A
,5~*^
A
A
18~
5-^
td 1 1 1 1] 1 1,....,
Mill I I 1 1 I I 1 1 | I 1 1 I | 1 I I I j9 6 19 15 28 25383548
DIFFERENTIAL PH RATE CMMOL/L)
Figure 14 Plot of the carbon dioxide comparison results of the
Ektachem and the differential pH rate method of the Astra
8.
31

8.595 with a corr. of 0.95, which was acceptable knowing that the
response curve of carbon dioxide on the Ektachem exhibits some
curvature.
Interference study.
(1) Elevated triglyceride interference: Table 4 illustrates
that abnormal concentrations of triglyceride in serum does not effect
sodium or potassium measurements on the Ektachem up to a triglyceride
concentration of 10,000 mg/dl. The Beckman Astra 8, which also
employs ion selective electrodes for sodium and potassium measurements
but with sample dilution, shows a 5 unit depression of sodium results
at a triglyceride level of 4,000 mg/dl. The IL 443 flame photometer
(Instrument Laboratories, Lexington, MA 02173) demonstrates an
interference in both sodium and potassium measurements at
triglyceride levels of 3,000 mg/dl. The Ektachem measures the
activity of an ion in the serum water of an undiluted serum sample.
With a direct potentiometric method such as this, molal concentration
is determined. Molality is the number of moles in 1 kg. of solvent
(serum water). Displacement of serum water by triglyceride or
protein has no effect on molality since the activity of the ion in
the serum water is not changed. Methods which measure molarity
concentration, such as the indirect potentiometric method of the
Astra 8, and flame photometry, are affected by triglyceride and
protein levels. Because molarity is the number of moles in 1 liter
of solution, displacement of solvent (serum water) by triglyceride or
protein will increase the apparent volume of the solution and
32

cc
LU
OO
(di
s- o
co
<3-
VD
*3"
(44. |44.
<3"
1^
"3-
(44.
"3-
(44. (4- VD VD
^3"
co
CO
<o
-t->
o
cu'
E cr
<B LU
r-4. VD r~4 Ln un Ln in Ln un un oo
T>a- ^3- "3- *3- *3"
"4T "=T =r >4r-3-
cu .
U i
(d o
J* E
P4. |44. |44- r-4 oo (4- oo oo oo oo 00
"3"
"=r*3" "4}-
rr-4l-
*T "=r *r TT ^r
o
cc
c_>>-
CO
cc
oCO
oo
(0
s- o
co
cu
E Oi<o i
o 4 1 oo VD VD VD oo oo 4 1 o*3" "3-
OO OO oo oo oo oo oo oo
CT) oo *r oo CM
oo oo oo oo oo
ooo
ooo
P4.
CM
CU I
_E ~~4.
CJr
(d O4-> E
CT) CT) 00 CT) 00 oo r. oo 4 1
OO ro oo OO oo oo"3-
oo "sT
,X-J
cu 1
T3 T3r
"4^
S- CT
cu Eu 4,^
>)t r
CD OJT
>
S- CU1
_l
o o o o o o o O o o oun o o o o o o o o o <->4 1 o o o o o o o o o n
4 1 CM OO^3"
un VD (44. CO CT) o
33
therefore result in a decrease of the concentration of the measured
ion, which is dissolved in the solvent. Table 5 demonstrates that
amylase measurements on the Ektachem are not adversely affected by
triglyceride up to levels of 5,000 mg/dl. The Perkin-Elmer Model 91
is interfered by triglyceride levels of 2,000 mg/dl and above. This
instrument uses a nephelometric (light scattering) method to measure
amylase levels in serum samples. Nephelometry is a sensitive
methodology particularly at low concentrations, but is unreliable
when dealing with very high turbidities due to interparticle
interference (12). The Ektachem is not as greatly affected by high
triglycerides in that the spreading layer of the amylase slide serves
to mask out the triglyceride interference.
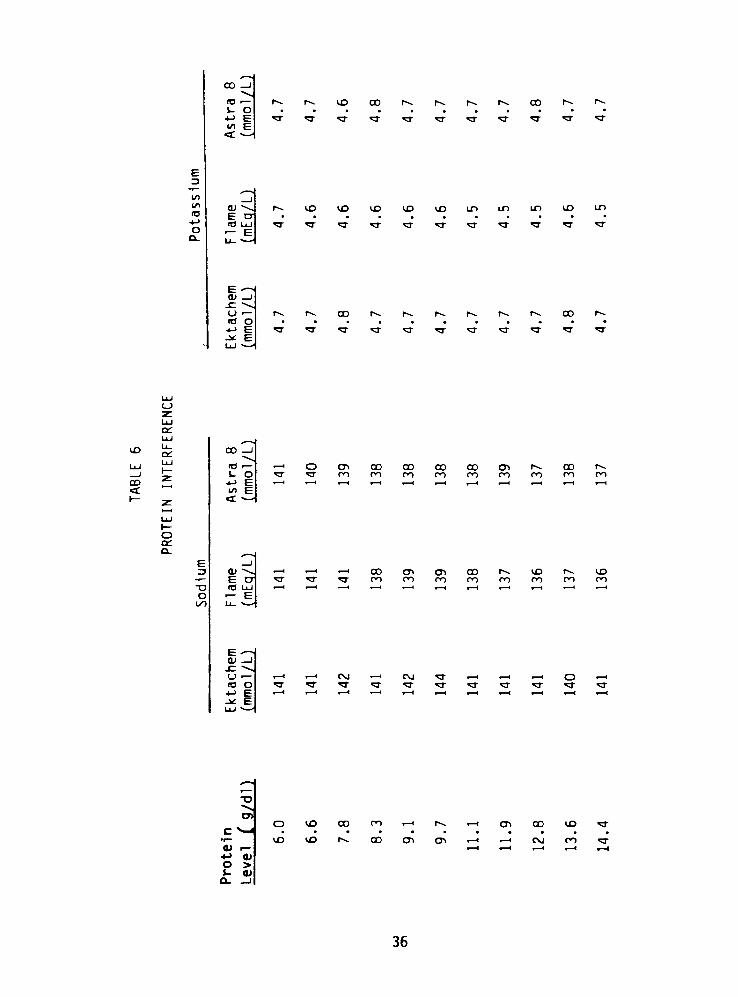
(2) Elevated protein interference: Table 6 illustrates that
protein concentrations to 14 g/dl do not affect sodium or potassium
measurement by the Ektachem ion selective methodology. A slight
decrease of 5 sodium units is observed on both the Astra 8 and the
IL 443 flame photometer at a protein concentration of 14 g/dl due to
the displacement of serum water by protein. The Ektachem is
unaffected due to reasons cited earlier in the discussion of elevated
triglyceride interference.
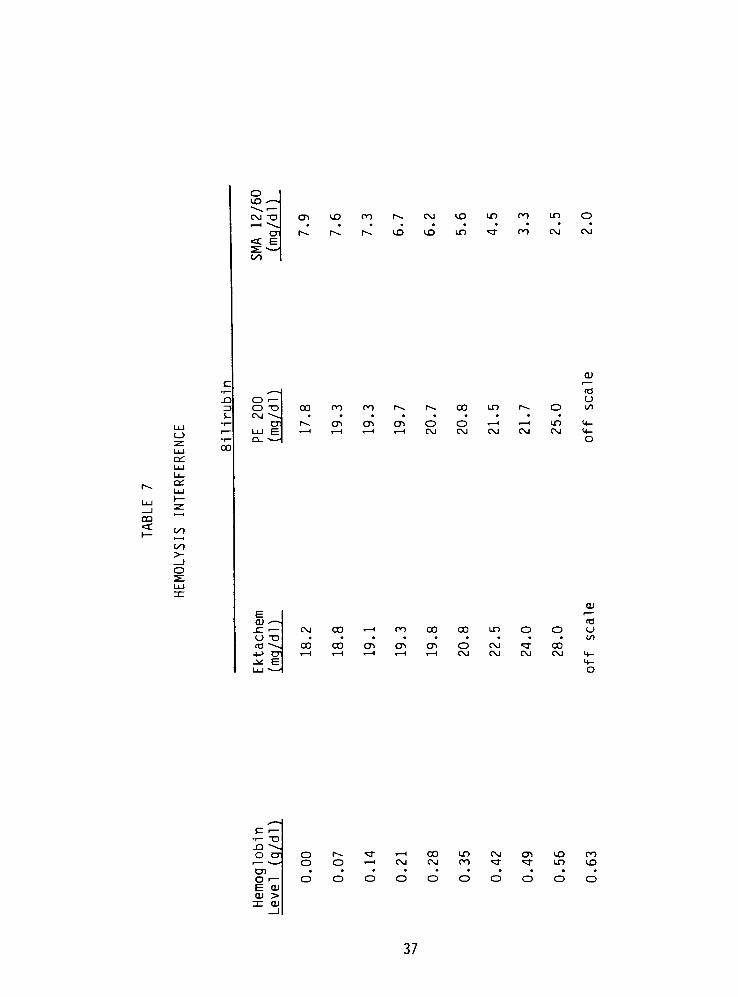
(3) Hemolysis interference: Table 7 demonstrates the positive
hemoglobin interference for the Ektachem bilirubin assay and the
modified Evelyn-Mai loy method. The SMA 12/60, however, shows a
negative hemoglobin interference. In the modification of the Evelyn-
Malloy method, bilirubin is reacted with diazotized sulfanilic acid
34
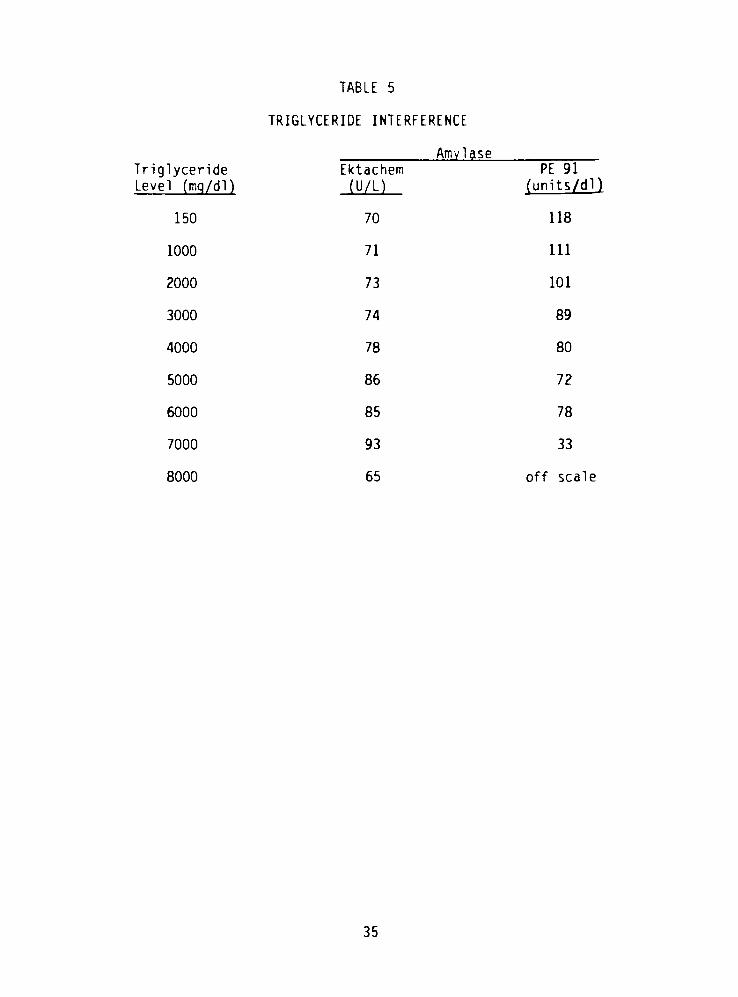
TABLE 5
TRIGLYCERIDE INTERFERENCE
Amylase
Triglyceride
Level (mq/dl)
Ektachem
(U/L)
PE 91
(units/dl)
150 70 118
1000 71 111
2000 73 101
3000 74 89
4000 78 80
5000 86 72
6000 85 78
7000 93 33
8000 65 off scale
35
CO
CO
<d
O
CL
. >J
CO 1
Id
u o4-> FCO B<x. ^
r-4.
a-
f4~ CD CO (4^ r4>
3
l"4~.
3-
r-4.
*3"
00
*3
f-4.
QJ'
E CTlid LU
E-~SCU I
o>
id o-!-> E^ E
44- vD VD VD VD VD un in in vd Ln
TT *r ^T *?a-
*T*3" 3"
*T T^3"
(4. |4^ co
>4r
f~4-
*3"
[44. f4
3-
X4
3"
00
LU
OC
VD
OO
et
LU
Ll_
cc:CO
-^LU
<d , 4 i O CT) CO CO CO 00 CT) r4- CO r-4
s- O"3" "3"
oo ro oo OO OO oo oo OO oo
co E
Zct
4-X
LUt-
occ
Cl.
E i
-J OJ 4 4 x-t 4 1 CO CT) CT) co (44. VD |4^ vD..
E CT T "4T*3-
oo oo oo oo OO oo oo oo
"O id
o . Eoo
ECU i
sz ^4,
u.^
x-4. 1 CM 4 4 CM
*3"
1 x-4 . 1 o . I
id o "IT ^T ^r *r"3" "3-
<4T rr^3"
^T ^r+-> E x-l 4 1 x-l x-l x-l . i x-l . i x-l H . i
^^ ELU
^~.
^~
T3
'V^
CT)
c -.T"
CU 1
4- 01o >i- CUO- _l
o VD CO OO H r4. '-' CTl CO CD T
LD vD (44. oo VCT) CT) t-H -1 CM OO*3"
36
oCD .
CM "O
CT
ct E
CD VD oo r~. CM vD un 00 cn O
1^ r. (44. vD VD un43-
00 CM CM
cil-
-Q
ZJ
S-
o<
o -o
CM \
CT
C_>
z
LU
CC
LU
Ll_
CC
00
r-4
00
CT)
OO
CT)
(4-
CD
00
OCM
OCM
Ln
CM
id
Oco
VI-
O
OO
cfCO
CO>-
ECU *~.
XL T
O T3
id ^4^4-> CT
^L ELU \
CM
00
00 x-i
00 CT)
00
CT)
CO
CT)
00
OCM
CM
CM
^3"
CM
00CM
Id
CO
- J
c 1
1 T3
J-J \
0 CTf 4>
CD
0r
E CU
cu >3-
cu_J
oo
|44.
o
3"
. 1
o
CM
O
00CM
Ln
00
CM"3-
CT)
<4f
VD
Ln
00
vo
37

in an acidic medium with methanol to form a purple colored product
(azobilirubin). After a fifteen minute incubation, the absorbance
reading at 700 nm is subtracted from the reading at 540 nm to give a
net absorbance reading, which is read off a standard bilirubin
absorbance-concentration chart to give a final concentration value
for the 50 ul serum sample. Since there is no sample blank, the
hemoglobin causes a positive interference by adding to the absorbance
reading obtained at 540 nm. If a serum blank is used, a low
bilirubin value would be obtained due to the destruction of bilirubin
by oxyhemoglobin in the hemolysate (13). The Jendrassik-Grof method
of the SMA 12/60, which uses a serum blank for each sample, shows the
expected decrease in measured bilirubin due to the bilirubin
destruction by oxyhemoglobin in the hemolysate (14). On the Ektachem
slide, the observed elevation in bilirubin results, due to hemolysis,
is thought to result from reflectance interference by hemoglobin not
masked in the spreading layer when concentrations of hemoglobin
exceed 70 mg/dl .
(4) Iodine interference: Table 8 illustrates the iodine
interference on Ektachem chloride and carbon dioxide measurements at
a KI concentration of 2 mEq/L. The Astra 8 also demonstrates a
slight chloride interference at this KI level, but carbon dioxide
results are unaffected by the tested concentrations of KI. The
chloride methods employed by the aforementioned instruments are known
to be non-specific for chloride. Interference from halides is well
known and documented (15). The problem of iodine interference in
38

TABLE 8
IODINE INTERFERENCE
Chi oride Carbon Dioxide
Iodine
Level (mEq/L)
Ektachem
(mmol/L)
Astra 8
(mmol/L)
Ektachem
(mmol/L)
Astra 8
(mmol/L)
0 105 105 25 22
1 111 105 26 22
2 119 106 35 21
3 123 109 45 22
4 131 111 61 20
5 137 111i
>55 21
6 144 113 >55 22
7 151 114 >55 22
8 156 115 >55 21
9 163 114 >55 21
10 172 116 >55 22
15 >180 122 >55 22
20 >180 125 >55 21
25 >180 131 >55 21
50 >180 >150 >55 21
100 >180 >150 >55 20
1:> = greater than
39
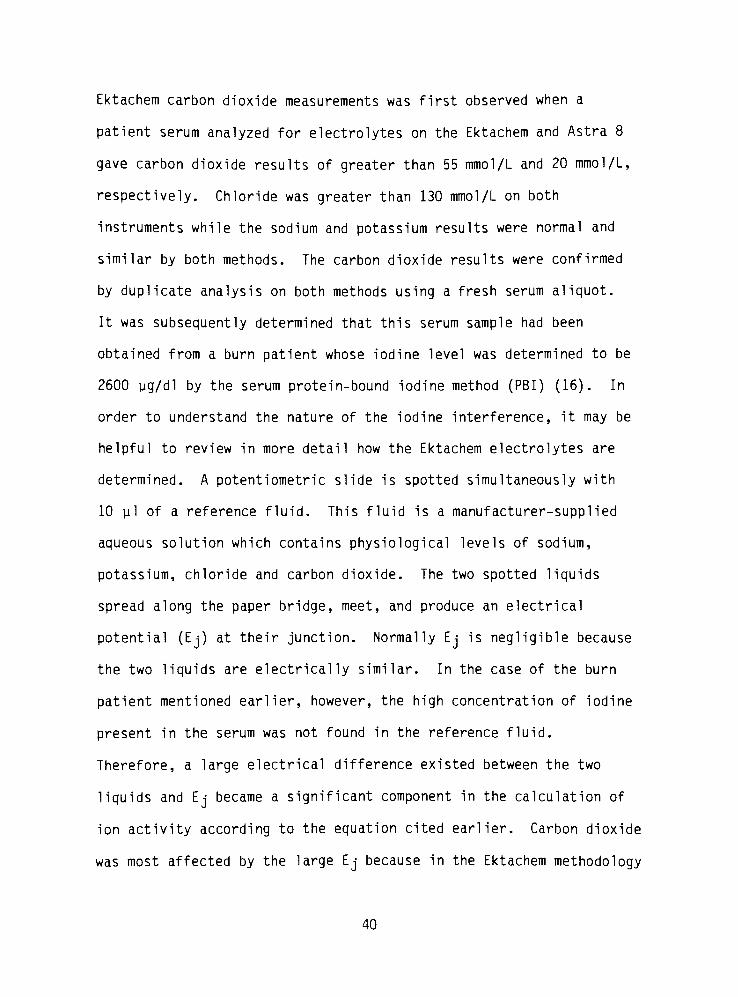
Ektachem carbon dioxide measurements was first observed when a
patient serum analyzed for electrolytes on the Ektachem and Astra 8
gave carbon dioxide results of greater than 55 mmol/L and 20 mmol/L,
respectively. Chloride was greater than 130 mmol/L on both
instruments while the sodium and potassium results were normal and
similar by both methods. The carbon dioxide results were confirmed
by duplicate analysis on both methods using a fresh serum aliquot.
It was subsequently determined that this serum sample had been
obtained from a burn patient whose iodine level was determined to be
2600 ug/dl by the serum protein-bound iodine method (PBI) (16). In
order to understand the nature of the iodine interference, it may be
helpful to review in more detail how the Ektachem electrolytes are
determined. A potentiometric slide is spotted simultaneously with
10 pi of a reference fluid. This fluid is a manufacturer-supplied
aqueous solution which contains physiological levels of sodium,
potassium, chloride and carbon dioxide. The two spotted liquids
spread along the paper bridge, meet, and produce an electrical
potential (Ej) at their junction. Normally Ej is negligible because
the two liquids are electrically similar. In the case of the burn
patient mentioned earlier, however, the high concentration of iodine
present in the serum was not found in the reference fluid.
Therefore, a large electrical difference existed between the two
liquids and Ej became a significant component in the calculation of
ion activity according to the equation cited earlier. Carbon dioxide
was most affected by the large Ej because in the Ektachem methodology
40
for carbon dioxide, it is carbonate ion (CO32-) which is actually
being measured. Since the amount of this ion in serum is very small,
approximately 0.025 mmol/L, compared to sodium (140 mmol/L),
potassium (4 mmol/L), and chloride (100 mmol/L), it would seem likely
that the large ionic strength difference between the two liquids at
their junction would be most pronounced for the carbonate ion and
hence carbon dioxide measurement would be the electrolyte most
affected.
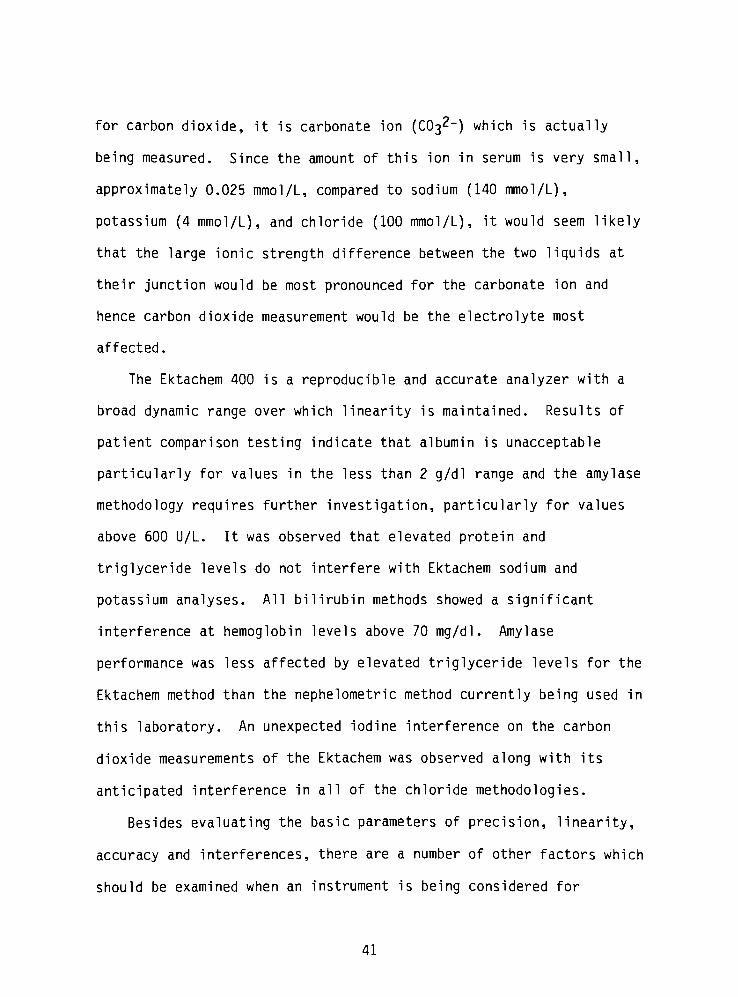
The Ektachem 400 is a reproducible and accurate analyzer with a
broad dynamic range over which linearity is maintained. Results of
patient comparison testing indicate that albumin is unacceptable
particularly for values in the less than 2 g/dl range and the amylase
methodology requires further investigation, particularly for values
above 600 U/L. It was observed that elevated protein and
triglyceride levels do not interfere with Ektachem sodium and
potassium analyses. All bilirubin methods showed a significant
interference at hemoglobin levels above 70 mg/dl. Amylase
performance was less affected by elevated triglyceride levels for the
Ektachem method than the nephelometric method currently being used in
this laboratory. An unexpected iodine interference on the carbon
dioxide measurements of the Ektachem was observed along with its
anticipated interference in all of the chloride methodologies.
Besides evaluating the basic parameters of precision, linearity,
accuracy and interferences, there are a number of other factors which
should be examined when an instrument is being considered for
41

purchase and implementation in a clinical laboratory setting. Some
of these factors and an appraisal of the performance of the Ektachem
400 in relation to them follow.
Sample volume is an extremely critical factor especially when a
hospital has a substantial pediatric and/or geriatric population. If
a 0.5 ml micro specimen cup is used, a 25 ul dead space is required
with only an additional 10 pi for each test requested. This small
volume requirement is one of the Ektachem technology's most
impressive features.
Turnaround time is another important feature in the consideration
of an analyzer for the laboratory, particularly if critical care
patient samples are being analyzed and physicians are awaiting
results in order to initiate treatment. The Ektachem 400 has an
approximate five minute delay from time of sampling to data
availability.
The reliability of an instrument is a feature of key importance.
If an instrument requires constant attention, maintenance and service
by the manufacturer, it can become a great burden to the laboratory
staff. In the early stages of this evaluation, the Ektachem 400
demonstrated a considerable amount of downtime. For a period of six
months, the average number of service calls came to one a week. This
excessive downtime has improved since updates and corrections have
been made by the manufacturer and a sample workload reduction was
implemented.
42
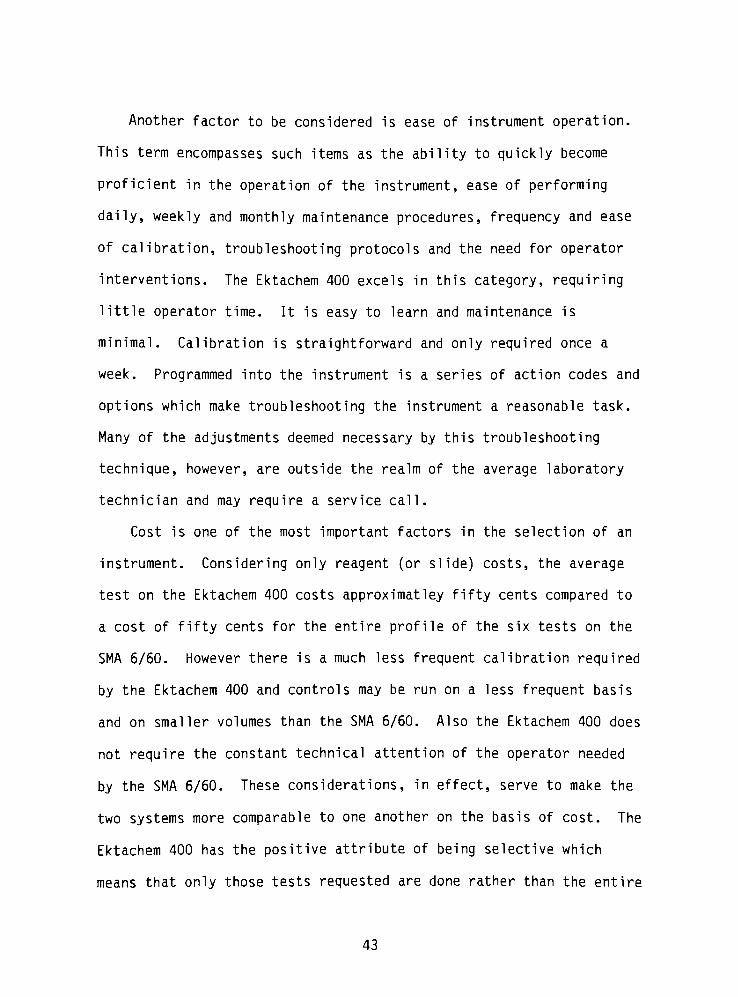
Another factor to be considered is ease of instrument operation.
This term encompasses such items as the ability to quickly become
proficient in the operation of the instrument, ease of performing
daily, weekly and monthly maintenance procedures, frequency and ease
of calibration, troubleshooting protocols and the need for operator
interventions. The Ektachem 400 excels in this category, requiring
little operator time. It is easy to learn and maintenance is
minimal. Calibration is straightforward and only required once a
week. Programmed into the instrument is a series of action codes and
options which make troubleshooting the instrument a reasonable task.
Many of the adjustments deemed necessary by this troubleshooting
technique, however, are outside the realm of the average laboratory
technician and may require a service call.
Cost is one of the most important factors in the selection of an
instrument. Considering only reagent (or slide) costs, the average
test on the Ektachem 400 costs approximatley fifty cents compared to
a cost of fifty cents for the entire profile of the six tests on the
SMA 6/60. However there is a much less frequent calibration required
by the Ektachem 400 and controls may be run on a less frequent basis
and on smaller volumes than the SMA 6/60. Also the Ektachem 400 does
not require the constant technical attention of the operator needed
by the SMA 6/60. These considerations, in effect, serve to make the
two systems more comparable to one another on the basis of cost. The
Ektachem 400 has the positive attribute of being selective which
means that only those tests requested are done rather than the entire
43

profile such as occurs on the SMA 6/60 and the SMA 12/60. In this
age of the DRG, this feature may make the Ektachem 400 a desirable
addition to the clinical laboratory.
44

REFERENCES
1. National Committee for Clinical Laboratory Standards: Proposed
guidelines for user evaluation of precision performance of
clinical chemistry devices. EP5-P, Publ. Vol. 2 No. 1, 1-48,
1982. 771 E. Lancaster Ave., Villanova, PA 19085.
2. Hartman, A.E., Validation protocol for new methods or instruments
in the clinical laboratory. Lab. Med. 14, 411-416 (1983).
3. Curme, H.G., et al . , Multilayer film elements for clinical
analysis: General concepts. Clin. Chem. 24. 1335-1342 (1978).
4. Curme, H.G., et al., Single-use ion-selective electrodes:
General concepts. Clin. Chem. 25, 1115 (1979).
5. Ektachem 400 Operator's manual, section 14.3, Principles of
measurement. (1981).
6. Ektachem 400 Operator's manual, section 14, Potentiometric
Methodology, CO2 Test Methodology. (1981).
7. Malloy, H.T. and Evelyn, K.A., The determination of bilirubin
with the photoelectric colorimeter. J. Biol. Chem. 119, 481
(1937).
8. Doumas, B.T., Watson, W., and Biggs, H.G., Albumin standards and
the measurement of serum albumin with bromcresol green. Clin.
Chim. Acta 31, 87-96 (1971).
9. Zinterhofer, L., Wardlaw, S., Jatlow, P., and Seligson, D.,
Nephelometric determination of pancreatic enzymes. Clin. Chim.
Acta 43, 5-12 (1973).
45
10. Finley, P.R., Williams, R.J., Lichti, D.A., and Thies, A.C,
Evaluation of a new multichannel analyzer, "Astra-8". Clin.
Chem. 24, 2125-2131 (1978).
11. Laurell, C.B., Quantitative estimations of protein by
electrophoresis in agarose gel containing antibodies. Anal .
Biochem. 15, 42-52 (1966).
12. Strobel, H.A., ed., Clinical Instrumentation, Addison-Wesley.
Reading, MA, 1973, pp 584-585.
13. Shull, B.C., Lees, H., and Li, P.K., Mechanism of interference by
hemoglobin in the determination of total bilirubin. I. Method of
Malloy-Evelyn. Clin. Chem. 26, 22-25 (1980).
14. Shull, B.C., Lees, H., and Li, P.K., Mechanism of interference by
hemoglobin in the determination of total bilirubin. II. Method
of Jendrassik-Grof. Clin. Chem. 26, 26-29 (1980).
15. Tietz, N., ed., Fundamentals of Clinical Chemistry, first
edition, W.B. Saunders, Philadelphia, PA, 1970, p 624.
16. Tietz, N., ed., Fundamentals of Clinical Chemistry, first
edition, W.B. Saunders, Philadelphia, PA, 1970, pp 590-598.
46