thermokarst lake changes in the southern fringe of …file.scirp.org/pdf/ars_2016110114563655.pdfis...
TRANSCRIPT

Advances in Remote Sensing, 2016, 5, 215-231 http://www.scirp.org/journal/ars
ISSN Online: 2169-2688 ISSN Print: 2169-267X
DOI: 10.4236/ars.2016.54018 November 1, 2016
Thermokarst Lake Changes in the Southern Fringe of Siberian Permafrost Region in Mongolia Using Corona, Landsat, and ALOS Satellite Imagery from 1962 to 2007
Adiya Saruulzaya1, Mamoru Ishikawa1, Yamkhin Jambaljav2
1Graduate School of Environmental Science, Hokkaido University, Sapporo, Japan 2Permafrost Department, Institute of Geography and Geoecology, Ulaanbaatar, Mongolia
Abstract This study presents thermokarst lake changes at seven different sites in the conti-nuous and isolated permafrost zones in Mongolia. Lakes larger than 0.1 ha were ana-lyzed using Corona KH-4, KH-4A and KH-4B (1962-1968), Landsat ETM + (1999- 2001), and ALOS/AVNIR-2 (2006-2007) satellite imagery. Between 1962 and 2007, the total number and area of lakes increased by +21% (347 to 420), and +7% (3680 ha to 3936 ha) in the continuous permafrost zone, respectively. These changes cor-respond to the appearance of 85 new lakes (166 ha) during the last 45 years. In con-trast, lakes in the isolated permafrost zone have decreased by −42% (118 to 68) in number and −12% (422 ha to 371 ha) in area from 1962 to 2007. The changes in lake area and number are likely attributed to shifts in climate regimes and local perma-frost conditions. Since 1962, the mean annual air temperature and potential evapo-transpiration have increased significantly in the northern continuous permafrost zone compared to the southern isolated permafrost zone. Due to ongoing atmos-pheric warming without any significant trend in annual precipitation, patches of ice-rich subsurface have thawed, and the number and area of lakes have accordingly developed in the continuous permafrost zone. Shrinking of thermokarst lakes in the isolated permafrost zone may be due to disappearing permafrost, deepening of the active layer, and increased water loss through surface evaporation and subsurface drainage.
Keywords Thermokarst Lake, Siberian Permafrost Region, Mongolia, Corona, Landsat, ALOS
How to cite this paper: Saruulzaya, A., Ishikawa, M. and Jambaljav, Y. (2016) Ther- mokarst Lake Changes in the Southern Fringe of Siberian Permafrost Region in Mongolia Using Corona, Landsat, and ALOS Satellite Imagery from 1962 to 2007. Advances in Remote Sensing, 5, 215-231. http://dx.doi.org/10.4236/ars.2016.54018 Received: August 22, 2016 Accepted: October 29, 2016 Published: November 1, 2016 Copyright © 2016 by authors and Scientific Research Publishing Inc. This work is licensed under the Creative Commons Attribution International License (CC BY 4.0). http://creativecommons.org/licenses/by/4.0/
Open Access

A. Saruulzaya et al.
216
1. Introduction
Thermokarst lakes are common features in Arctic and sub-Arctic permafrost regions [1]-[3] and important indicators of permafrost degradation [4] [5]. These lakes are de-fined as lakes that generally occupy closed basins formed by the settlement of ground following thawing of ice-rich permafrost or melting of massive ice [6]. After a thermo-karst lake has formed, the lake size may change due to continued permafrost thaw, var-iations in air temperature, potential evapotranspiration and precipitation [2] [7]-[10]. The factors controlling their dynamics on decadal scales have been controversial and still are an important topic in permafrost regions.
Most previous studies have investigated the dynamics of thermokarst lakes in the permafrost regions of Siberia, Canada and Alaska using remote sensing imagery with high and medium resolution [2] [3] [8]-[12]. For example, Jones et al. [3] documented that the number of water bodies (>0.1 ha) increased by 10.7% but that the total surface area decreased by 14.9% as result of partial drainage of a few large lakes in the northern portion of the Seward Peninsula of Alaska between 1950 and 2007. Riordan et al. [9] found that the total area and number of lakes decreased by 11.6% and 19% since 1950 respectively, although the amount of precipitation has been stable. They concluded that lake shrinkages are mostly due to a rapid increase in air temperature (i.e., potential evapotranspiration). Plug et al. [2], on the other hand, found that temporal variation of the lake area, which increased for 1978-1992, and decreased for 1992-2001, agreed with those of annual precipitation in the continuous permafrost zone in northwest Canada. Labrecque et al. [11] also found two phases of significant changes in the lake area in Canadian Yukon Territory, an increasing trend with 1.6% between 1951 and 1972 when precipitation increased slightly, while a decreasing trend with 5% between 1973 and 2001. These studies clearly show the relationship between hydro-climatic changes and variations in lake area.
The spatial and temporal extent of permafrost, as an impermeable ground layer, can have a first order effect on thermokarst lake dynamics. Smith et al. [8] found that the area and number of lakes increased in the continuous permafrost zone while they de-creased in the discontinuous, sporadic, and isolated permafrost zones between 1973 and 1998 in western Siberia. This phenomenon is attributed to thawing of near-surface ground ice in the continuous permafrost zone, promoting thermokarst lake formation, whereas in discontinuous, sporadic and isolated permafrost zones, losses in lake area and number are attributed to subsurface drainage facilitated by permafrost loss [7].
A similar geographical shift of permafrost zones from continuous in northern terri-tories to sporadic in the southern region is seen in Mongolia. In addition, climatic gra-dients occur along latitude as well; it is, colder and wetter in the northern territory, and warmer and drier in the southern territory. Although this environmental gradient would be interesting for comprehensive analysis of the factors controlling dynamics of thermokarst lakes, which have extensively developed on the depressions and valleys in the Altai, Hangai, Hovsgol and Hentii Mountain regions [13]-[16], the spatiotemporal changes of these lakes have not been investigated in Mongolia so far.

A. Saruulzaya et al.
217
The primary objective of this study is to provide quantitative information on the temporal and spatial changes of thermokarst lakes in Mongolia using a time series of high-resolution satellite imagery. The other objective is to address the effects of the long-term trends of hydro-climatic regimes and permafrost degradation on the areal changes of lakes.
2. Study Sites
Study sites are located in the southern fringe of Siberian permafrost regions in Mongo-lia. We selected four study sites in the northern continuous permafrost zone including Darkhad depression, Mungut river valley, Chuluut river valley, and Khongor-Ulun, while selecting three other sites Nalaikh depression, Galuut depression, and Erdene in the southern isolated permafrost zone (Figure 1). The sites are referred herein as sites 1-7 respectively. A set of basic environmental characteristics at all study sites are sum-marized in Table 1. In addition, these sites contain long-term permafrost monitoring boreholes located for our study sites.
Permafrost exists in almost two thirds of Mongolia, predominantly in the Altai, Hangai, Hovsgol, and Hentii Mountain regions and the surrounding areas [17]. The re-gion is characterized by mountain and arid land permafrost and the permafrost distri-bution changes according to geomorphological and microclimatic conditions. Perigla-cial features include ice wedge polygons, thermokarst lakes, and pingos which are ex-tensively developed in the permafrost zones [13]-[16] [18] [19]. Continuous and ice- rich permafrost occurs in the northern areas with volumetric ice contents higher than 30% [16], while discontinuous, sporadic and isolated permafrost has low ice content in the southern areas. Permafrost temperatures generally range from −3˚C to −0.1˚C [17]. The average thickness and mean annual temperature in the areas of permafrost are 50 - 100 m and −1 to −2˚C in river valleys and depressions, and 100 - 250 m and −1 to −3°C on mountains [17]. The thickness of the active layer in the continuous permafrost zone is 1 - 3 m, while it ranges 4 - 7 m in the discontinuous and isolated permafrost zone [16]. The continuous permafrost in northern Mongolia has warmed faster than south-ern isolated permafrost zone over recent decades [17] [20] [21]. The borehole data (10 - 15 m depth) in the continuous permafrost zone (sites 1 - 4) has shown a temperature increase between 0.38 and 0.95˚C [21]. In contrast, the borehole temperature (10 - 15 m depth) in the isolated permafrost zone (sites 5 - 7) has only increased between 0.1 and 0.64˚C in the last 30 years [21].
Mongolia has a typical continental climate. The lowest air temperatures often reach −34˚C in mid-January in the northern regions, while it reaches −20˚C in the southern regions [22]. In the warmest months, air temperatures range between 10 and 15˚C in the northern territories such as Hovsgol, Hangai, Altai, and Hentii Mountain regions and reach 20˚C in the southern territory (Gobi Steppe). Precipitation during the sum-mer season contributes to more than 80% of the total annual precipitation in Mongolia [23]. The mean annual total precipitation ranges between 150 - 300 mm in the north, and 50 - 100 mm in south area [22]. The territory, thus, has a transition zone in terms

A. Saruulzaya et al.
218
of rainfall amount as well as vegetation, which changes from desert to grassland and boreal forest, within only several hundreds of kilometers over a south-to-north dis-tance.
Figure 1. Location of study sites in the southern fringe of Siberian permafrost region in Mongolia: Site 1. Darkhad depression (very large lakes such as Dood Nuur and Targan are excluded from the recent analysis); Site 2. Mungut river valley; Site 3. Chuluut river valley; Site 4. Khongor-Ulun; Site 5. Nalaikh depression; Site 6. Galuut depression; and Site 8. Erdene. Black polygons representing the thermokarst lake surface area in study sites (as of 1962/68). The background is the shaded relief of ASTER GDEM.

A. Saruulzaya et al.
219
3. Data and Methods 3.1. Remote Sensing Data and Processing
To estimate thermokarst lake changes at study sites, we used satellite imagery for three different time series: 1962-1968, 1999-2001 and 2006-2007. All images were acquired during the summer season. For this analysis we employed 14 Corona scenes, 7 Landsat Enhanced Thematic Mapper Plus (ETM+) images, and 7 Advanced Land Observing Satellite (ALOS) Advanced Visible and Near Infrared Radiometer type 2 (AVNIR-2) satellite data sets (Table 2).
The oldest data (1960s) is especially useful in developing countries where aerial pho-tographs in wide area coverage are rarely available. Beside the presented technical ad-vantages, the high resolution Corona satellite images are also available at a reasonable price and provide an excellent opportunity for change detection studies. The Corona declassified images (1962-1968) were acquired from the US Geological Survey Earth Table 1. General environmental characteristics of study sites. Permafrost temperature, active layer, and ice content datasets were obtained from the articles of Sharkhuu [16], and Jambaljav et al. [17]. N/A is not available data.
Study sites Permafrost
extent Area (km2)
Above sea level (m)
Permafrost temperature (°C)
Ice-content (%)
Active layer (m)
Site 1 Continuous 576.3 1570 −2.4 >30 1.0 - 3.0
Site 2 Continuous 12.1 1767 −1.2 10 - 20 2.0 - 2.8
Site 3 Continuous 9.5 1856 −1.6 10 - 20 1.2 - 2.0
Site 4 Continuous 14.2 2377 −1.4 N/A N/A
Site 5 Isolated 0.2 1403 −0.1 0-10 7.5
Site 6 Isolated 76.6 2445 −1.0 N/A N/A
Site 7 Isolated 0.8 2417 −0.4 N/A 7.8
Table 2. The Corona KH-4, KH-4A, and KH-4B, Landsat ETM+, and ALOS/AVNIR-2 satellite images used in this study.
Study sites
Corona date
Corona KH-4, KH-4A, and KH-4B
Landsat date
Landsat ETM+ ALOS date ALOS/
AVNIR-2
Site 1 1962/08/29 DS009044048AF031 DS009044048AA036
1999/09/05 LE71370241999248 2006/09/17 AVNIR-2
Site 2 1968/08/29 DS009044048AF024 DS009044048AA029
2000/09/07 LE71370262000251 2006/08/29 AVNIR-2
Site 3 1966/09/21 DS1035-1006DF075 DS1035-1006DA076
1999/08/22 LE71350271999234 2007/06/17 AVNIR-2
Site 4 1968/08/11 DS1104-1055DF009 DS1104-1055DA015
2000/09/10 LE71420262000254 2007/09/01 AVNIR-2
Site 5 1968/08/16 DS1104-2135DF001 DS1104-2135DA005
1999/08/10 LE71310271999222 2007/06/07 AVNIR-2
Site 6 1964/06/10 DS1006-2085DF054 DS1104-2085DA058
1999/08/22 LE71350281999234 2007/09/27 AVNIR-2
Site 7 1962/08/29 DS009044032AF024 DS009044032AA030
2001/09/19 LE71360292001262 2006/08/31 AVNIR-2
A. Saruulzaya et al.
220
Resources Observation Systems (USGS EROS) Data Center (http://earthexplorer.usgs.gov/). The images were taken by the KH-4, KH-4A and KH-4B satellite systems which were equipped with both forward and backward-looking cameras (Table 2). The Corona images have a higher spatial resolution (3.00 - 7.60, 2.70 - 7.60 and 1.8 - 7.60 m, respectively) at a scale between 1:247,500 and 1:305,000 and wide area coverage. The Corona images were scanned at 3600 dpi (7 microns) by USGS in a digital format. Of the total (15 × 290 km, 17 × 232 km and 14 × 188 km, re-spectively) ground coverage of Corona KH-4, KH-4A and KH-4B images, only small portions were cropped from both the backward and forward images at study sites.
The Corona strips are known to contain significant geometric distortions, especially at the edges of an image along the track [24] [25]. To geometrically correct and ortho-rectify the strips, we used a non-metric camera model in ERDAS Leica Photogramme-tric Suite (LPS) version 9.3 software, where we assigned the focal length, the pixel size of the scanned scenes and flight altitude of the camera platform [26]. We used the bun-dle block adjustment procedure in LPS to simultaneously estimate the orientation of all Corona strips based on ~100 ground control points (GCPs). Latitude (x) and longitude (y) information of the GCPs were extracted from the panchromatic Landsat ETM+ images (band 8), whereas elevation information (z) was extracted from the ASTER Global Digital Elevation Model (GDEM). All tie points were automatically placed at the correct locations on both images (forward and backward) in LPS. The Corona stripes were mosaicked in LPS to produce the final orthorectified images. Root mean square error (RMSE) of the aerial triangulation for Corona images were less than 15 m because of the small subset of data used at study sites.
The Landsat ETM+ panchromatic images were obtained from the USGS Global Vi-sualization Viewer (http://glovis.usgs.gov/) with limited cloud coverage conditions. The Landsat ETM+ images have spatial resolutions of 30 m (multispectral) and 15 m (pan-chromatic) over an area of 180 × 180 km. In this study, a total 7 Landsat ETM+ pan-chromatic images (band 8) from 1999 to 2001 were used (Table 2). All data sets were registered to UTM coordinate system zones 46N, 47N and 48N, and elevation refe-renced to WGS 1984 datum.
In order, the ALOS/AVNIR-2 satellite images between 2006 and 2007 (Table 2) were acquired from the Japan Aerospace Exploration Agency (JAXA; http://www.eorc.jaxa.jp/ALOS/en/about/about_index.htm). ALOS/AVNIR-2 is a satellite sensor that has four spectral bands and performance with a resolution of 10 m in the visible and near-infrared bands (ground coverage 70 × 70 km). The ALOS/ AVNIR-2 images were orthorectified using the Landsat ETM+ images in AutoSync workstation of ERDAS based on at least 30 GCPs for each image. The orthorectified ALOS images were a maximum RMSE of less than 1 m. Figure 2 summarizes the me-thodological framework of satellite images in this study.
3.2. Thermokarst Lake Area Delineation and Analysis
Firstly, we attempted the automated classification of lake areas based on the orthorectified

A. Saruulzaya et al.
221
Figure 2. Flowchart of satellite images processing methodology.
images. However, we abandoned the automated spectral approaches commonly used in digital image processing due to the issues where cloud shadows creating dark patches that were spectrally similar to water, and sun glint near the edges of these images creat-ing bright small lakes were confused bright target such as meadows [1] [9].
We visually delineated all lake areas from each satellite image that were above a minimum area of 0.1 ha (1000 m2). The shoreline of each lake was manually traced as a polygon area using ArcGIS 9.1 software. The areas of the extracted lake polygons were computed (Figure 2). Finally, we categorized the extracted lake areas into four distinct classes (i.e., 0.1 - 1 ha, 1 - 10 ha, 10 - 100 ha, and 100 - 1000 ha) in order to better un- derstand the lake dynamics of individual lake size categories. Furthermore, we removed very large lakes (e.g., Dood Nuur (4810 ha) and Targan (1962 ha) in site 1 (Figure 1)) from the recent analysis, which are not likely thermokarst lakes [13].
3.3. Hydro-Climate Data and Analysis
Since Mongolia has a sparse distribution of meteorological stations with weather records spanning more than 50 years, we used the reanalysis data to evaluate the corre-lation between thermokarst lake changes and hydro-climatic parameters. Mean annual air temperature (MAAT) at 2 meter height data from 1962 to 2007 was downloaded for the National Center for Environmental Prediction (NCEP) National Center for At-mospheric Research (NCAR) data. The horizontal resolution of the compiled NCEP/ NCAR precipitation data (2.5˚ × 2.5˚) was not sufficient to investigate rainfall. There-fore, the annual total precipitation (P) was downloaded from the high-resolution Asian Precipitation Highly Resolved Observational Data Integration Towards Evaluation (APHRODITE) data (0.5˚ × 0.5˚) from 1962 to 2007 (http://www.chikyu.ac.jp/precip/). In addition, the APHRODITE data is available until 2007, thus we only used satellite images from 1962 to 2007. The NCEP/NCAR and APHRODITE data were analyzed in the Grid Analysis and Display System (GrADS) software. In order to estimate water

A. Saruulzaya et al.
222
balance, we calculated annual potential evapotranspiration (PET) using the Thorn-thwaite Water Balance Model [27] based on the maximum and minimum air tempera-tures. Finally, we estimated water balance by subtracting P from PET (P-PET) for the study period of 1962 and 2007.
4. Results and Discussion 4.1. Thermokarst Lake Changes from 1962 to 2007
Contrasting changes in thermokarst lake dynamics were observed between the conti-nuous and isolated permafrost zones in Mongolia. For the continuous permafrost zone (sites 1-4), the total number of lakes increased by 73 (or +21%), from 347 in 1962/68 to 420 in 2006/07 (Table 3). The total lake area shows similar pattern as the lake number, increasing the total area of lakes over the study period (1962/68 to 2006/07) from 3680 ha to 3936 ha (or +7%). In site 1, the number of lakes increased by +25% (from 296 to 371), and their area increased from 3350 ha to 3651 ha (or +9%) between 1962 and 2007 (Figure 3). The number of lakes in site 2 remained stable throughout the whole study period. However, area of lakes decreased by −24% (161 ha to 122 ha) from 1962 to 2007. Both number and area of lakes in site 3 showed a decrease of −15% (34 to 29 in number) and −34% (59 ha to 39 ha) respectively during the study period. In site 4, ten lakes were delineated in 1962/68, then their number increased by 3 (or +30%) in 1999/01 and later remained stable for 2006/07. Lake area in this site increased by +13% from 1962 to 2007.
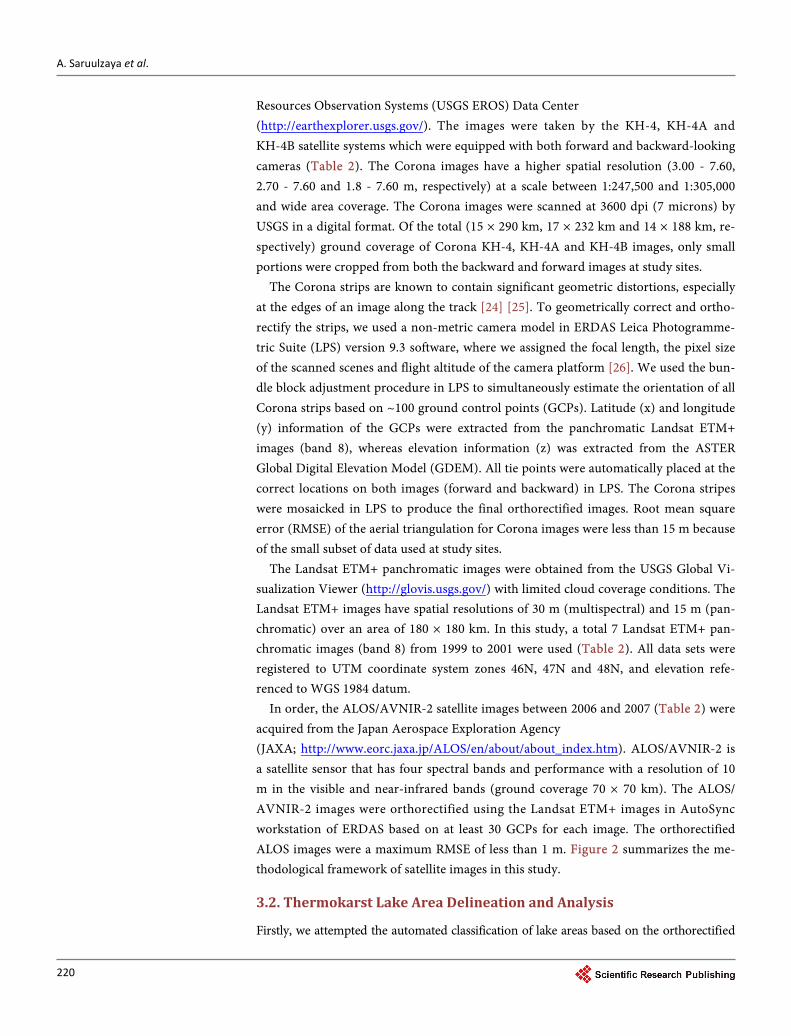
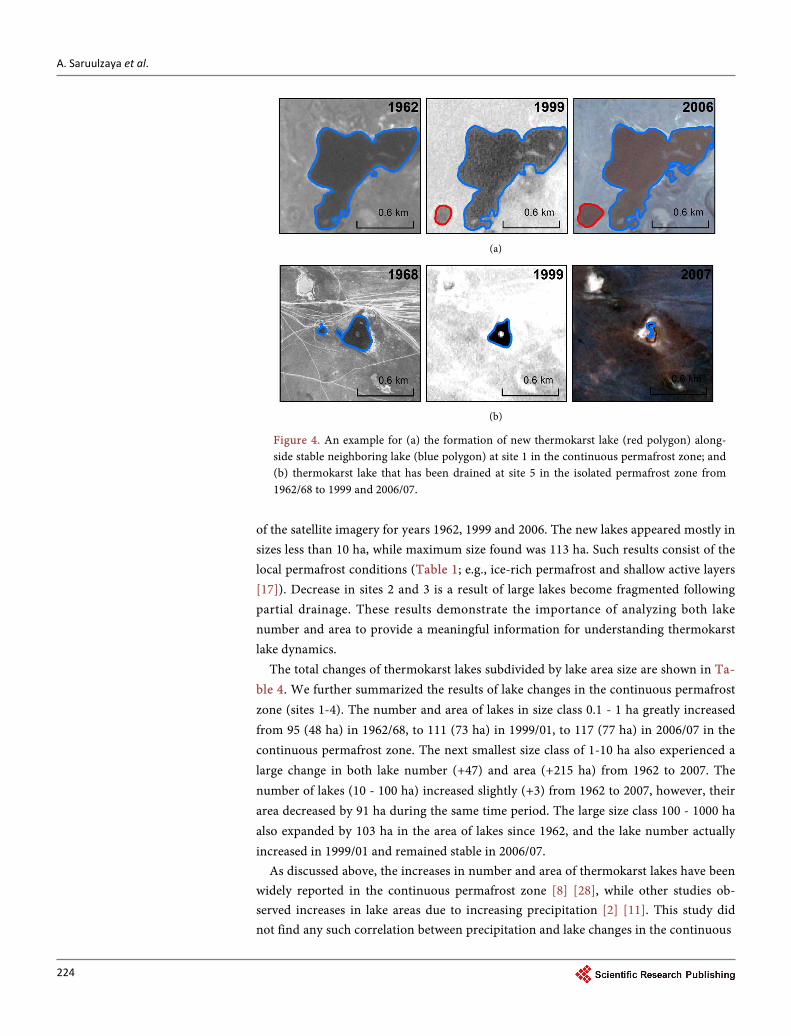
We observed spatially heterogeneous patterns in lake changes with identified in-creasing and decreasing lake number and areas for the continuous permafrost sites. The increase in both number and area of lakes in sites 1 and 4 can be explained by the for-mation of new lakes as results of permafrost thaw. While many new lakes were found in site 1, where total of 53 lakes appeared in 142 ha in 1999/01 and 32 lakes appeared in 24 ha in 2006/07, only a few lakes appeared in site 4. Figure 4 (a) shows one example for the formation of new lake alongside stable neighboring lakes based on visual inspection Table 3. Thermokarst lake changes by sites and by permafrost zones over the study period.
Permafrost zone
Study sites 1962-1968 1999-2001 2006-2007
Lake number
Lake area (ha)
Lake number
Lake area (ha)
Lake number
Lake area (ha)
Continuous
Site 1 296 3350 350 3612 371 3651
Site 2 7 161 7 141 7 122
Site 3 34 59 30 47 29 39
Site 4 10 110 13 119 13 124
Total 347 3680 400 3919 420 3936
Isolated
Site 5 2 7 1 5 1 1
Site 6 108 409 73 371 64 367
Site 7 8 6 3 4 3 3
Total 118 422 77 380 68 371

A. Saruulzaya et al.
223
Figure 3. Thermokarst lake changes for each study site from 1962/68 to 1999/01 and 2006/07.
A. Saruulzaya et al.
224
(a)
(b)
Figure 4. An example for (a) the formation of new thermokarst lake (red polygon) along-side stable neighboring lake (blue polygon) at site 1 in the continuous permafrost zone; and (b) thermokarst lake that has been drained at site 5 in the isolated permafrost zone from 1962/68 to 1999 and 2006/07.
of the satellite imagery for years 1962, 1999 and 2006. The new lakes appeared mostly in sizes less than 10 ha, while maximum size found was 113 ha. Such results consist of the local permafrost conditions (Table 1; e.g., ice-rich permafrost and shallow active layers [17]). Decrease in sites 2 and 3 is a result of large lakes become fragmented following partial drainage. These results demonstrate the importance of analyzing both lake number and area to provide a meaningful information for understanding thermokarst lake dynamics.
The total changes of thermokarst lakes subdivided by lake area size are shown in Ta-ble 4. We further summarized the results of lake changes in the continuous permafrost zone (sites 1-4). The number and area of lakes in size class 0.1 - 1 ha greatly increased from 95 (48 ha) in 1962/68, to 111 (73 ha) in 1999/01, to 117 (77 ha) in 2006/07 in the continuous permafrost zone. The next smallest size class of 1-10 ha also experienced a large change in both lake number (+47) and area (+215 ha) from 1962 to 2007. The number of lakes (10 - 100 ha) increased slightly (+3) from 1962 to 2007, however, their area decreased by 91 ha during the same time period. The large size class 100 - 1000 ha also expanded by 103 ha in the area of lakes since 1962, and the lake number actually increased in 1999/01 and remained stable in 2006/07.
As discussed above, the increases in number and area of thermokarst lakes have been widely reported in the continuous permafrost zone [8] [28], while other studies ob-served increases in lake areas due to increasing precipitation [2] [11]. This study did not find any such correlation between precipitation and lake changes in the continuous

A. Saruulzaya et al.
225
Table 4. Thermokarst lake changes for four lake size classes in sites 1 - 4 in the continuous per-mafrost zone from 1962 to 2007.
Lake size class (ha)
1962-1968 1999-2001 2006-2007
Lake number
Lake area (ha)
Lake number
Lake area (ha)
Lake number
Lake area (ha)
0.1 to 1 95 48 111 73 117 77
1 to 10 187 655 221 849 234 870
10 to 100 61 1928 63 1861 64 1837
100 to 1000 4 1049 5 1136 5 1152
permafrost zone. Our results differ from those of Jones et al. [3] in terms of the direc-tion of lake changes, as that study found an increase in the number of small lakes but total lake area decreased between 1950 and 2007 for Alaska. However, similarly to Smith [8], we also found the increasing the number and area of lakes in the continuous permafrost zone in Mongolia, which strongly suggests that this phenomenon is a result of local thawing of ice-rich permafrost [21]. The temperature data from continuous permafrost boreholes exhibited an increase in permafrost temperature in the northern continuous permafrost zone. In fact, since the 1980s, permafrost has been degrading more significantly in the northern continuous zone [20] [21]. Warming and thawing of permafrost is consistent with thermokarst lake changes observed in this study for the continuous permafrost zone.
For the isolated permafrost zone, only two lakes were observed in 1962/68 in site 5 and one of them drained before 1999/01 (Figure 4(b), and Table 3). In terms of lake area change, there was a decrease of −86% (6 ha) for this site (Figure 3). The observed lakes in site 6 decreased both in number (−41%) and area (−10%) from 1962 to 2007, respectively. In site 7, lake number shows a decrease of −62% between 1962/68 and 1999/01, but remained stable afterwards for 2006/07. However, lake area decreased by −33% in 1999/01 and −50% in 2006/07. In the isolated permafrost zone, the investi-gated thermokarst lakes have greatly decreased in number and area between 1962 and 2007 as result of lake drainage. Overall, a total of 118 lakes (422 ha) were delineated in the isolated permafrost zone for the period of 1962/68. The number of these lakes de-creased by −35% (77 lakes) in 1999/01, and −42% (68 lakes) in 2006/07. The total area of lakes in this permafrost zone decreased by −12% (from 422 ha to 371 ha) during the last 45 years.
In the isolated permafrost zone, there is a predominance of smaller lakes as shown in Table 5, which divides thermokarst lakes into four size classes. From 1962 to 2007, the number of lakes decreased in all size classes (except 100 - 1000 ha), and the most reduc-tion (from 117 lakes to 67 lakes) occurred in lake size classes between 0.1 - 1 ha and 10 - 100 ha. Large lake size class of 100-1000 ha was 181 ha (1962/68) and decreased by 34 ha (2006/07). Between 1962 and 2007, lake area decreased in all lake classes. In fact, fif-ty lakes completely disappeared in sites 5 - 7 (Figure 4(b)). Most of the disappeared lakes had an area of less than 1 ha. This result is likely associated with the deep active layers (Table 1) and disappearing permafrost at those sites [21].

A. Saruulzaya et al.
226
Table 5. Thermokarst lake changes for four lake size classes in sites 5 - 7 in the isolated perma-frost zone from 1962 to 2007.
Lake size class (ha)
1962-1968 1999-2001 2006-2007 Lake
number Lake area
(ha) Lake
number Lake
area (ha) Lake
number Lake
area (ha)
0.1 to 1 81 25 42 21 34 20
1 to 10 30 104 29 98 28 96
10 to 100 6 112 5 110 5 108
100 to 1000 1 181 1 151 1 147
Shrinking and disappearing thermokarst lakes may become a common feature in the
discontinuous, sporadic and isolated permafrost zones as a consequence of warming climate and disappearing permafrost [7]. Our results were consistent with lake reduc-tions observed by other similar studies [7]-[9]. Smith et al. [8] used satellite imagery from 1970s to 2004 to document the decline of thousand lakes in Siberia. Their study showed an increase of total lake number and area in the continuous permafrost zone, and a contrasting decrease in discontinuous to isolated permafrost zone. We also found a substantial reduction in the total number and area of thermokarst lakes in the isolated permafrost zone in Mongolia.
4.2. Hydro-Climatic Change from 1962 to 2007
Figure 5 and Table 6 show the climatic trends derived from the NCEP/NCAR and APHRODITE data for our study sites. The mean annual air temperature (MAAT) in-creased by 2.65˚C, 2.34˚C, 2.39˚C, and 0.79˚C in sites 1, 2, 3, and 4 respectively, in the continuous permafrost zone between 1962 and 2007 (Figure 5(a)). In the isolated per-mafrost zone, MAAT increased slightly at the sites 5, 6, and 7 (0.91˚C, 1.62˚C, and 0.35˚C, respectively) during the last 45 years. Total annual precipitation (P) decreased at all sites (Figure 5(b)), except site 7 (Table 6). The correlations of the linear trend at those sites were insignificant since the 1962. However, the total annual potential evapo-transpiration (PET) increased significantly at all sites mainly due to increasing MAAT, except for sites 5 and 7. The total annual PET had higher amounts at sites 5-7 in the isolated permafrost zone than sites 1 - 4 in the continuous permafrost zone (Figure 5 (c)). These differences were attributed to the large latitudinal climatic gradient in Mongolia (see Figure 1 and Table 1). According to these results, the decreasing total annual P and increasing PET contributed to the negative water balance (P-PET) at all sites, except site 7 (Figure 5(d)).
We attribute the increase in area and number of lakes observed in the continuous permafrost zone to ongoing warming (Figure 5(a)), which has been found as the main driver for thermokarst lake expansion in this permafrost zone [8] [28]. During the last 45 years, MAAT and PET increased significantly in sites 1 - 4. Such persistent warming trend has enhanced the permafrost degradation in northern Mongolia [21] including thawing of massive ground ice (e.g., Hinzman et al. [29]). As a result, new thermokarst

A. Saruulzaya et al.
227
lakes were formed in the continuous permafrost zone (Figure 4) due to ice-rich per-mafrost thaw and ground surface subsidence.
(a) (b)
(c) (d)
Figure 5. Hydro-climatic change from 1962 to 2007: (a) Mean annual air temperature MAAT; (b) total annual precipitation P; (c) total annual potential evapotranspiration PET; and (d) water balance P-PET at all study sites. Solid lines show the sites 1 - 4 in the continuous permafrost zone while dashed lines show the sites 5 - 7 in the isolated permafrost zone.
Table 6. Linear trends in MAAT, total annual P, total annual PET, and water balance based on the long-term NCEP/NCAR and APHRODITE data. Their statistical parameters were computed such as changes (∆) between 1962 and 2007, coefficients of determination of the liner trend (r2) and significance level (p).
Study sites
MAAT (°C) Total Annual
P (mm) Total Annual
PET (mm) Water Balance (P-PET) (mm)
∆T r2 p ∆P r2 p ∆PET r2 p ∆P-PET r2 p
Site 1 2.65 0.33 0.001 −13.4 0 0.443 81.5 0.41 0.001 −94.9 0.17 0.001
Site 2 2.34 0.32 0.001 −14.9 0 0.651 81.6 0.41 0.001 −96.5 0.16 0.001
Site 3 2.39 0.33 0.001 −100.5 0.21 0.006 94.9 0.47 0.001 −195.4 0.4 0.001
Site 4 0.79 0.05 0.034 −41.5 0.03 0.044 37.8 0.13 0.001 −79.3 0.09 0.003
Site 5 0.91 0.15 0.011 −49.1 0.06 0.007 4.63 0 0.721 −53.7 0.03 0.049
Site 6 1.62 0.23 0.001 −32.3 0.04 0.076 66.1 0.29 0.001 −98.4 0.24 0.001
Site 7 0.35 0.01 0.322 27.8 0.13 0.017 14.6 0.01 0.093 13.2 0 0.859

A. Saruulzaya et al.
228
The observed reduction in number and area of lakes in the southern isolated perma-frost zone may be due to a combination of several factors including the air temperature, the potential evapotranspiration, and negative water balance, as well as permafrost dis-appearance [21]. The MAAT trend increased slightly at sites 5 - 6 in the isolated per-mafrost zone from 1962 to 2007 (Figure 5(a)). Furthermore, a decreasing trend of MAAT with an increasing P was found at site 7, such results were not consisted with the lake reduction. From our analysis, we found no significant correlation between the total annual PET and reduction of lakes in these sites. However, the total annual PET was higher at sites 5 - 7 in the isolated permafrost zone than sites 1 - 4 in the conti-nuous permafrost zone (Figure 5(c)). Potentially, the reduction in area and number of thermokarst lakes, especially small lakes (Figure 3), it likely associated with negative water balance (P-PET), the disappearing permafrost and subsurface drainage observed in the isolated permafrost zone [7] [9].
5. Conclusion
This study provides the first baseline information of thermokarst lake changes across Mongolia, filling the gap in sub-Arctic lake inventories at regional scales such as the southern fringe of Siberian permafrost region. The time series data of high-resolution satellite imagery demonstrated useful in determining changes in the number and areal extent of thermokarst lakes greater than 0.1 ha in Mongolia from 1962 to 2007. We found contrasting changes of thermokarst lake dynamics in the continuous and isolated permafrost zones. Thermokarst lakes in the continuous permafrost zone have increased significantly in number and area while in the isolated permafrost zone we observed a decrease in both number and area over the 45 years of the study period. The dramatic increase in number of smaller lakes with sizes between 0.1 - 1 ha and 1 - 10 ha com-pared to larger lakes (10 - 100 ha and 100-1000 ha) in the continuous permafrost zone is likely as a result of permafrost degradation due to increasing temperature and eva-porations. However, small lakes (0.1 - 1 ha) had a significant reduction in number in the isolated permafrost zone. The mechanism behind reduction of lake number and area may attribute to a combination of disappearing permafrost, deepening of the active layer and an increase water loss in this permafrost zone. Future research should focus on the temporal and spatial assessment of lake area changes across this region to better understand the detailed processes of lake area dynamics.
Acknowledgements
This research was supported by the Global Center of Excellence for Integrated Field Environmental Science Program at Hokkaido University in Sapporo, Japan. We thank all colleagues of the Permafrost Department, Institute of Geography and Geoe-cology, Mongolian Academy of Sciences who helped in this study. Finally, we also thank to C.G. Andresen of the Los Alamos National Laboratory for English revision, and one anonymous reviewer for the constrictive suggestions to improve this manu-script.

A. Saruulzaya et al.
229
References [1] Grosse, G., Schirrmeister, L., Kunitsky, V.V. and Hubberten, H.W. (2005) The Use of
CORONA Images in Remote Sensing of Periglacial Geomorphology: An Illustration from the NE-Siberian Coast. Permafrost and Periglacial Processes, 16, 163-172. http://onlinelibrary.wiley.com/doi/10.1002/ppp.509/pdf http://dx.doi.org/10.1002/ppp.509
[2] Plug, L.J., Walls, C. and Scott, B.M. (2008) Tundra Lake Changes from 1978 to 2001 on the Tuktoyaktuk Peninsula, Western Canadian Arctic. Geophysical Research Letters, 35, L03502. http://onlinelibrary.wiley.com/doi/10.1029/2007GL032303/epdf http://dx.doi.org/10.1029/2007GL032303
[3] Jones, B.M., Grosse, G., Arp, C.D., Jones, M.C., Walter Anthony, K.M. and Romanovsky, V.E. (2011) Modern Thermokarst Lake Dynamics in the Continuous Permafrost Zone, Northern Seward Peninsula, Alaska. Journal of Geophysical Research, 116, G00M03. http://onlinelibrary.wiley.com/doi/10.1029/2011JG001666/epdf http://dx.doi.org/10.1029/2011JG001666
[4] Morgenstern, A., Grosse, G., Gunther, F., Fedorova, I. and Schirrmeister, L. (2011) Spatial Analysis of Thermokarst Lakes and Basins in Yedoma Landscapes of the Lena Delta. The Cryosphere 5, 849-867. http://www.the-cryosphere.net/5/849/2011/tc-5-849-2011.pdf
[5] Grosse, G., Jones, B. and Arp, C. (2013) Thermokarst Lakes, Drainage, and Drained Basins. In: Shroder, J.F., Ed., Giardino, R. and Harbor, J. Eds., Treatise on Geomorphology, Vol. 8, Glacial and Periglacial Geomorphology, Academic Press, San Diego, CA, 325-353. http://www.sciencedirect.com/science/article/pii/B9780123747396002165
[6] van Everdingen, R.O. (1998) Multi-Language Glossary of Permafrost and Related Ground- Ice Terms. http://globalcryospherewatch.org/reference/glossary_docs/Glossary_of_Permafrost_and_Ground-Ice_IPA_2005.pdf
[7] Yoshikawa, K. and Hinzman, L.D. (2003) Shrinking Thermokarst Ponds and Groundwater Dynamics in Discontinuous Permafrost near Council, Alaska. Permafrost and Periglacial Processes, 14, 151-160. http://onlinelibrary.wiley.com/doi/10.1002/ppp.451/epdf http://dx.doi.org/10.1002/ppp.451
[8] Smith, L.C., Sheng, Y., MacDonald, G.M. and Hinzman, L.D. (2005) Disappearing Arctic Lakes. Science, 308, 1429. http://www.sscnet.ucla.edu/geog/downloads/297/154.pdf http://dx.doi.org/10.1126/science.1108142
[9] Riordan, B., Verbyla, D. and McGuire, A.D. (2006) Shrinking Ponds in Subarctic Alaska Based on 1950-2002 Remotely Sensed Images. Journal of Geophysical Research, 111, G04002. http://onlinelibrary.wiley.com/doi/10.1029/2005JG000150/epdf http://dx.doi.org/10.1029/2005JG000150
[10] Andresen, C.G. and Lougheed, V.L. (2015) Disappearing Arctic Tundra Ponds: Fine-Scale Analysis of Surface Hydrology in Drained Thaw Lake Basins over a 65 Year Period (1948- 2013). Journal of Geophysical Research, Biogeosciences, 120, 466-479. http://onlinelibrary.wiley.com/doi/10.1002/2014JG002778/epdf http://dx.doi.org/10.1002/2014JG002778
[11] Labrecque, S., Lacelle, D., Duguay, C., Lauriol, B. and Hawkings, J. (2009) Contemporary (1951-2001) Evolution of Lakes in the Old Crow Basin, Northern Yukon, Canada, Remote Sensing, Numerical Modeling, and Stable Isotope Analysis. Arctic, 62, 225-238. http://www.jstor.org/stable/40513290 http://dx.doi.org/10.14430/arctic134
[12] Karlsson, J.M., Lyon, S.W. and Destouni, G. (2012) Thermokarst Lake, Hydrological Flow

A. Saruulzaya et al.
230
and Water Balance Indicators of Permafrost Change in Western Siberia. Journal of Hy-drology, 464-465 (2012) 459-466. http://www.sciencedirect.com/science/article/pii/S0022169412006385
[13] Tserensodnom, J. (2000) Catalog of Mongolian Lakes. Ulaanbaatar, Mongolia.
[14] Tumurbaatar, D. (2001) Permafrost in the Darkhad Depression of Hovsgol. Proceeding of the International Symposium on Mountain and Arid Land Permafrost, Ulaanbaatar, Mon-golia, 2-7 September 2001, 79-82.
[15] Nishida, H. and Jamsran, Ts. (2009) Darkhadyn Wetland in Mongolia: Synthesis Investiga-tion on Ecosystems. Kanazawa, NPO Mongolia Ecology Information Center, Japan.
[16] Sharkhuu, N. (2011) Field Guidebook to Mountain and Arid Land Permafrost in the Na-laikh and Terelj Areas near Ulaanbaatar, and in the Hovsgol and Hangai Mountainous Re-gions, Mongolia. Ulaanbaatar, Mongolia, 1-50.
[17] Jambaljav, Ya., Vanchig, T., Battogtokh, D., Saruulzaya, A., Gansukh, Ya., Temuujin, Kh. and Amarbaysgalan, Yo. (2013) Scientific Report of Long Term Monitoring on Mongolian Permafrost Region. Dorjgotov, D., Ed., Institute of Geography, Mongolian Academy of Sciences, Ulaanbaatar, Mongolia, 1-321.
[18] Wu, T., Wang, Q., Watanabe, M., Chen, J. and Battogtogh, D. (2009) Mapping Vertical Profile of Discontinuous Permafrost Ground Penetrating Radar at Nalaikh Depression, Mongolia. Environmental Geology, 56, 1577-1583. http://dx.doi.org/10.1007/s00254-008-1255-7 http://link.springer.com/article/10.1007/s00254-008-1255-7
[19] Ishikawa, M. and Jambaljav, Ya. (2015) Formation Chronology of Arsain Pingo, Darhad Basin, Northern Mongolia. Permafrost and Periglacial Processes, 27, 297-306. http://onlinelibrary.wiley.com/doi/10.1002/ppp.1877/pdf http://dx.doi.org/10.1002/ppp.1877
[20] Ishikawa, M., Sharkhuu, N., Jambaljav, Ya., Davaa, G., Yoshikawa, K. and Ohata, T. (2012) Thermal State of Mongolian Permafrost. Proceedings of the Tenth International Confe-rence on Permafrost, Vol. 1, Salekhard, Russia, 173-178. http://www.uspermafrost.org/icop-proceedings/TICOP%20Vol%201.pdf
[21] Davaa, G. and Jambaljav, Ya. (2014) Water Resources, Glacier and Permafrost. In: Davag-dorj, D., Batjargal, Z. and Natsagdorj, L., Eds., Mongolia-Second Assessment Report on Climate Change, Vol. 2, Ministry of Environmental and Green Development Press, Ulaan-baatar, Mongolia, 109-127.
[22] Dagvador, D., Khuldorj, B. and Aldover, R.Z. (2009) Mongolia Assessment Report on Cli-mate Change 2009. Vol. 1, Ulaanbaatar, Mongolia, 1-228. http://www.unep.org/pdf/MARCC2009_BOOK.pdf
[23] Batima, P. and Dagvadorj, D. (2000) Climate Change and Its Impacts in Mongolia. JEMR Publishing, Ulaanbaatar, Mongolia, 1-227.
[24] Altamaier, A. and Kany, Ch. (2002) Digital Surface Model Generation from CORONA Sa-tellite Images. Photogrammetry and Remote Sensing, 56, 221-235. http://www.sciencedirect.com/science/article/pii/S0924271602000461
[25] Goossens, R., Wulf, A.D., Bourgeois, J., Cheyle, W. and Willems, T. (2006) Satellite Imagery and Archaeology: The Example of Corona in the Altai Mountains. Journal of Archaeologi-cal Science, 33, 745-755. http://dx.doi.org/10.1016/j.jas.2005.10.010 http://www.sciencedirect.com/science/article/pii/S0305440305002220
[26] Dashora, A., Lohani, B., and Malik, J. N. (2007) A Repository of Earth Resource Informa-tion-CORONA Satellite Program. Current Science, 92, 926-932.

A. Saruulzaya et al.
231
http://home.iitk.ac.in/~javed/malik%20sir%20papers/10-Dashora-etal-Curr-Sci-2007.pdf
[27] McCabe, G.J. and Markstrom, S.L. (2007) A Monthly Water-Balance Model Driven by a Graphical User Interface. https://pubs.usgs.gov/of/2007/1088/pdf/of07-1088_508.pdf
[28] Jorgenson, M.T., Shur, Y.L. and Pullman, E.R. (2006) Abrupt Increase in Permafrost De-gradation in Arctic Alaska. Geophysical Research Letter, 33, L02503. http://onlinelibrary.wiley.com/doi/10.1029/2005GL024960/epdf http://dx.doi.org/10.1029/2005GL024960
[29] Hinzman, L.D., Goring, D.J. and Kane, D.L. (1998) A Distributed Thermal Model for Cal-culating Soil Thermal Temperature Profiles and Depth of Thaw in Permafrost Regions. Journal of Geophysical Research, 103, 975-991. http://onlinelibrary.wiley.com/doi/10.1029/98JD01731/full
Submit or recommend next manuscript to SCIRP and we will provide best service for you:
Accepting pre-submission inquiries through Email, Facebook, LinkedIn, Twitter, etc. A wide selection of journals (inclusive of 9 subjects, more than 200 journals) Providing 24-hour high-quality service User-friendly online submission system Fair and swift peer-review system Efficient typesetting and proofreading procedure Display of the result of downloads and visits, as well as the number of cited articles Maximum dissemination of your research work
Submit your manuscript at: http://papersubmission.scirp.org/ Or contact [email protected]