thermodynamic and kinetic study of solid state reactions … · thermodynamic and kinetic study of...
TRANSCRIPT

1
Thermodynamic and kinetic study of solid state reactions in theCu-Si system
R.R. Chromik, W.K. Neils and E.J. Cotts
Department of Physics, Binghamton University, State University of New York, Binghamton, NewYork 13902-6016
Abstract
It has been shown that significant changes in the course of solid state reactions can be realizedby decreasing length scale, temperature, or by varying parent microstructures. In the case of theformation of Cu3Si by interdiffusion of Cu and Si, previous research has shown that over a largetemperature range reaction rates are determined by the rate of grain boundary diffusion of Cuthrough the growing Cu3Si phase. We have examined the effect of replacing crystalline Si withamorphous Si (a-Si) on these solid state reactions, as well as the effect of decreasing the temperaturesand length scales of the reactions. Multilayered thin film diffusion couples of Cu and a-Si wereprepared by sputter deposition, with most average composite stoichiometries close to that of theequilibrium phase Cu3Si. Layer thicknesses of the two materials were changed such that themodulation (sum of the thickness of one layer of Cu and a-Si), λ, varied between 5 and 160 nm. X-ray diffraction analysis and transmission electron microscopy analysis were used to identify phasespresent in as prepared and reacted diffusion couples. Complete reactions to form a single phase ormixtures of the three low temperature equilibrium silicides (Cu3Si, Cu15Si4 and Cu5Si) were observed.Upon initial heating of samples from room temperature, heat flow signals were observed withdifferential scanning calorimetry corresponding to the growth of Cu3Si. At higher temperatures (>525 K) and in the presence of excess Cu, the more Cu rich silicides, Cu15Si4 and Cu5Si formed. Basedon differential scanning calorimetry results for samples with average stoichiometry of the phasesCu3Si and Cu5Si, enthalpies of formation of these compounds were measured. Considering thereaction of these phases forming from Cu and a-Si, the enthalpies were found to be –13.6±0.3 kJ/molfor Cu3Si and –10.5±0.6 kJ/mol for Cu5Si. The growth of Cu3Si was found to obey a parabolicgrowth law: tkx 22 = , where x is the thickness of the growing silicide, 2k is the temperature
dependent reaction constant, and t is the reaction time. Also, the form of the reaction constant, 2k ,
was Arrhenius: ( )TkEkk ba−= exp2$
with bk being Boltzmann’s constant and the pre-factor, $
k =
1.5x10⁻³ cm2/s, and activation energy, aE = 0.98 eV. These results indicate a much slower reaction to
form Cu3Si in thin film Cu/a-Si diffusion couples than indicated by previous researchers using mostlybulk samples of Cu and crystalline Si (x-Si).
“ Thermodynamic and kinetic study of solid state reaction in the Cu-Si system” , R.R. Chromik,W.K. Neils, and E.J. Cotts, Journal of Applied Physics, vol. 86, no. 8, p 4273-4281, Oct. 1999.

2
I. IntroductionThe properties of metal silicides are of interest in a number of areas in applied science,
including catalysis, high temperature applications, and microelectronics1,2. The study of thethermodynamics of the Cu-Si system aids in the development of a basic understanding of metal-silicon systems. Some Cu silicides, in particular Cu3Si, have shown promise as catalysts, withclear evidence that the oxidation of silicon is catalyzed by Cu3Si3-6, and some evidence that Cu3Siserves as an effective catalyst in other reactions7-9. In microelectronics, the use of Cumetallization in VLSI applications depends upon the prevention of the formation of Cusilicides1,10. When Cu is directly deposited on Si crystals, Cu3Si forms readily at moderatetemperatures11 (e.g. 470 K). To prevent the formation of silicides, a thin film diffusion barrier isused1,10,12-13. An understanding of the kinetics and energetics of these reactions facilitates theirprevention. It has been speculated that a large driving force for the formation of Cu3Si results inthe formation of Cu3Si by transport through diffusion barriers1 although the heat of mixing ofCu3Si has never been reported.
There have been a number of reports on the Cu-Si system that detail phase formationsequences and reaction kinetics for bulk diffusion couples14-18, lateral diffusion couples19, and thinfilm or thick film Cu on bulk crystalline Si11,20-26. There are many consistent aspects of theseprevious reports. For example, it has been well documented that the first phase to form in thesystem, in both bulk and thin film diffusion couples, is the orthorhombic η′′-Cu3Si phase. Also,the growth kinetics of this phase have been characterized by five previous investigators over acombined temperature range of 470 to 800 K15-19. All of these researchers found that theformation of Cu3Si followed a parabolic growth law tkx 22 = , where x is the thickness of theCu3Si layer, t is the time and k2 is the temperature dependent reaction constant. These results arein reasonable agreement for the magnitude of the reaction constant, k2. The activation energiesobserved by these investigators at temperatures below 740 K vary from 0.8 to 1.34. In the mostrecent publication, Becht, et. al.15 reported an activation energy of 1.81 eV above a temperatureof 743 K, which they associated with a bulk diffusion mechanism. Table 1 summarizes theprevious studies, where the type of diffusion couple is indicated (bulk, lateral or thin film) and theactivation energy obtained for a given temperature range is shown.
This study has focused on examining the thermodynamics and kinetics of the formation ofthe three low temperature Cu silicides: Cu3Si, Cu5Si and Cu15Si4 in sputtered, thin filmcomposites. We sought to examine the effect on solid state reactions of the differentmicrostructures presented by thin film Cu and amorphous Si (a-Si). Differential scanning
calorimetry (DSC)was used tomonitor thegrowth of the Cusilicides in Cu/a-Sithin film diffusioncouples. X-raydiffraction analysiswas used toexamine the as-prepared state ofthe Cu/a-Si
Researcher DiffusionCouple
TemperatureRange (K)
ActivationEnergy (eV)
Hong, et. al. Lateral 473-533 0.95±0.03Ward and Carroll Bulk 523-623 1.01
Veer, et. al. Bulk 615-795 0.81Becht, et. al. Bulk
Bulk670-740740-920
1.141.81
Onishi and Muira Bulk 683-735 1.34
Table I- Descriptions of the technique and results for previous investigations of the growthkinetics of Cu3Si.

3
multilayers and identify product phases in samples reacted in the differential scanning calorimeter.Transmission electron microscopy was also available for imaging the thin films and obtainingelectron diffraction patterns.
II. ExperimentalAn examination of the Cu-Si phase diagram27, 28, shown in Fig. 1, is helpful in considering
the formation of Cu silicides at Cu/a-Si interfaces. There are three low temperature equilibriumcompounds that may form: Cu3Si (η′′), Cu15Si4 (ε) and Cu5Si (γ). The total stoichiometric range(eight atomic percent) for these three compounds is rather narrow. The nearness in stoichiometryof the equilibrium alloys makes an attempt to fabricate single-phase alloys more troublesome thanusual. Small errors in average stoichiometry of a composite may result in the formation ofsignificant amounts of secondary phases upon reaction to equilibrium.
Multilayer, thin film diffusion couples of Cu and a-Si were prepared by sputter deposition.For this process, a sample chamber equipped with commercially available magnetron sputter gunswas evacuated to a base pressure of less than 3x 10⁻⁷ torr prior to sample preparation. Tofacilitate the sputtering process, VLSI grade argon gas was flowed into the chamber. Using acapacitance manometer for pressure measurements, the chamber pressure was set to 5 mtorrduring sample preparation. Sputtering rates were determined with calibrated quartz crystal ratemonitors. Using DC power for Cu and RF power for Si, the rates were set at 0.12 nm/s for Cuand 0.09 nm/s for Si.
The modulation, λ (sum of the thickness of one layer of Cu and one layer of a-Si), andstoichiometry of the Cu/a-Si multilayers were controlled by timed sequential deposition of eachmaterial onto a NaCl substrate (5.1 cmdiameter disk). A range of stoichiometries wasused between 55 and 89 atomic percent Cu,where some specific stoichiometries werestudied in more detail: Cu75Si25, Cu83Si17 andCu89Si11. For the two most Cu-richstoichiometries a single modulation was usedfor each: 136 nm for Cu83Si17 and 196 nm forCu89Si11. In the case of the Cu75Si25 samples,the modulation was varied between 5.2 and 160nm.
To obtain freestanding films from the assputtered samples, the NaCl substrate wasdipped into de-ionized water. The thin film,between 1 and 2 µm total film thickness andcontaining between 14 and 200 individuallayers of Cu and a-Si (depending on λ), wascaptured on filter paper and thoroughly rinsedwith de-ionized water and then semiconductorgrade acetone. The sample was then placed inan oven with a dry nitrogen atmosphere set at308 K. After drying for one hour, the samplewas removed from the oven and cut into
Figure 1- A sketch of the Cu-Si equilibrium phase diagram.There are three low temperature silicide phases: Cu3Si (η″),Cu15Si4 (ε), Cu5Si (γ).

4
smaller pieces for easy handling in preparation for x-ray diffraction analysis and differentialscanning calorimetry.
A portion of each sample was examined using x-ray diffraction analysis. The experimentalset up consisted of an x-ray diffractometer operating in a standard θ-2θ geometry. The radiation,produced from a Cu anode, was filtered with a Ni foil. The resulting x-rays were primarily Cu-Kα radiation. All Bragg peaks associated with the crystalline metals and alloys of this study areindexed for Cu-Kα radiation with an average wavelength of 0.15418 nm .
As the sample was cut up to perform x-ray diffraction analysis, it was also prepared forheating in a differential scanning calorimeter. Trimmed portions of the diffusion couple werestacked into an Al pan. Typical sample masses were between 1.2 and 3.5 mg (six or more DSCsamples were available from an as-prepared thin film). Once massed, each sample washermetically sealed in the Al pan in an Ar atmosphere of 10 kPa. Samples were then heated in acommercially available differential scanning calorimeter at either 10 or 20 K/min. The uppertemperature, where an anneal was performed (10-20 minutes), was between 600 and 650 K. Ascan of this type was performed three times consecutively on each sample. To obtain the signalassociated with solid state reactions taking place in the diffusion couple, the third run wassubtracted from the first.
III. Results and Discussion
A. X-ray diffraction analysisWe first present results of the structural analysis of Cu/a-Si multilayered composites after
high temperature anneals. The formation of Cu silicides is confirmed by means of x-ray diffractionof the samples after cooling, and considered in the context of previous investigations thatgenerally report the initial growth of Cu3Si at the Cu/Si interfaces. The results provide anindication of the phase formation sequence that is elucidated when the calorimetry results are alsoconsidered.
X-ray diffraction profiles for different Cu/a-Si composites after annealing at hightemperature (600 – 650 K) are shown in Fig. 2. The x-ray diffraction profile for an Si rich sample,Cu55Si45, is displayed in Fig. 2(a), while the average stoichiometries of the samples in Fig. 2(b)through 2(d) are Cu74Si26, Cu76Si24, and Cu83Si17, respectively. Each different composite washeated to 600 K or above, and annealed for between ten and twenty minutes. After cooling toroom temperature, x-ray diffraction analysis was performed. The results of Fig. 2 are typical ofthose observed for a number of different samples after heating to high temperatures.

5
Analysis of the x-raydiffraction profiles of Fig. 2(a-d)indicate that the phases formed in aCu/a-Si composite upon solid statereaction to high temperature areconsistent with the equilibriumphases corresponding to the averagestoichiometry of the composite.Considering each of these phases inturn, we examine the most Si richequilibrium phase, Cu3Si, first.There have been numerouscrystallographic reports on thestructure of Cu3Si29-32. The mostrecent report29 summarizes theexisting work and provides a basisfor identifying the Cu3Si phasedespite the existence of anorthorhombic superstructure31:a=7.676 nm, b=0.700 nm, c= 2.194nm. Myers and Follstaedt29 pointout that the majority of the linesobserved in a diffraction profile (x-ray or electron) for Cu3Si can beindexed to a smaller hexagonallattice (a= 0.404 nm and c = 0.244nm) contained within thesuperlattice. Table 2 summarizes thed spacings that were observed forCu3Si grown in our thin film
diffusion couples and compares our results to those found in Ref. 29. Figs. 2(a and b) indicate thatfor stoichiometries of 75at% Cu and less, Cu3Si is the phase formed, as expected from the Cu-Siphase diagram (c.f. Fig. 1). The third x-ray diffraction profile of Fig. 2(c) is typical of that for asample of intermediate composition between the equilibrium phases Cu3Si and Cu15Si4. Using acalculated pattern based on an experimental study33,34, peaks in this scan are indexed to the cubicstructure of Cu15Si4. Bragg peaks identified with the Cu3Si are also observed in the scan of Fig.2(c), as would be expected for the average composite stoichiometry. The x-ray diffraction profileof Fig. 2(d), for a composite of average stoichiometry Cu5Si and λ = 136 nm, can be readilyindexed. The intensity and angles of the observed Bragg peaks are consistent with the equilibriumCu5Si phase.
Figure 2- X-ray diffraction data for Cu/a-Si multilayers after heating ina differential scanning calorimeter (DSC) to high temperature (600-650K). These profiles are for samples of different average stoichiometries,where the Cu content increases from top to bottom: (a) Cu55Si45, (b)Cu74Si26, (c) Cu76Si24, and (d) Cu83Si17. Where appropriate, peaks areindexed to equilibrium Cu silicide phases.

6
The x-ray diffraction data of Fig. 3 reflect structural changes in Cu/a-Si composites uponinitial heating from room temperature. The data in Fig. 3 are for a Cu5Si composite in the as-prepared condition, Fig. 3(a), and for similar samples after heating at 20 K/min to a temperature
of 465 K, Fig. 3(b), and to a temperature of545 K, Fig. 3(c). New Bragg peaks observed inthese x-ray diffraction profiles after the sampleswere heated can be identified with the Cu3Siphase. Present in all three profiles are also fiveBragg reflections from crystalline Cu. For thesample heated to 545 K, there is a peak at44.58 degrees, which is indexed to the mostintense reflection for Cu3Si from the hexagonalsublattice (112 0) 29. For the profile of thesample heated to 465 K, this same reflection forCu3Si is also evident as a shoulder next to the(111) reflection for Cu. The results of the x-raydiffraction studies are consistent with theobservation that Cu3Si grows first in thesecomposites.
Chromik, Neils and Cotts Hexagonal Sublattice,Cu3Si
Myers and Follstaedt
3.54 3.50 (1010) 3.50 vw
3.19 3.24 vw2.68
2.542.45 2.44 (0001) 2.45 w2.34 2.31 w2.13 2.12 m2.092.072.03 2.02 (1120) 2.02 st
2.00 (1011)1.95
1.83 w1.76 1.75 (2020) 1.79 w
1.59 1.56 (1121)1.43 1.42 (2021) 1.43 m
1.23 1.22 (0002) 1.22 w1.17 1.17 (3030) 1.17 m
1.01Table II - A collection of the d-spacings observed for the Cu3Si phase (η′′) by this group and a report by Myers andFollstaedt. All entries are in units of 10-10 m.
Figure 3- X-ray diffraction data for a Cu/a-Si multilayer(Cu83Si17 average stoichiometry): (a) as prepared, (b) heated to465 K, (c) heated to 545 K. Peaks are indexed to crystallineCu (appearing in all of the profiles here) and the silicide phaseCu3Si.

7
B. Calorimetry
A calorimetric examination of thecourse of solid state reactions in Cu/a-Simultilayers in conjunction with x-raydiffraction studies provides a clear indicationof the phase formation sequence of differentCu-silicides. Analysis of the calorimetric dataprovides a quantitative characterization of thegrowth kinetics of Cu3Si in our composites.We find that the general nature of the reactiondepends upon the individual layer thickness.
For Cu/a-Si multilayers with largervalues of λ, the general course of solid statereactions in Cu/a-Si is illustrated in Fig. 4.Distinctly different behaviors are seen incalorimetric investigations of composites for λvalues significantly less than 30 nm (as seenbelow). The plots of heat flow (normalizedby the interfacial area of a particularcomposite) versus temperature in Fig. 4 arefor four samples of different averagestoichiometries and values of λ (Fig. 4(a) –Cu55Si45 and λ= 142 nm, Fig. 4(b) - Cu75Si25 and λ = 66 nm, Fig. 4(c) - Cu76Si24 and λ= 96 nm,and Fig. 4(d) - Cu83Si17 and λ = 136 nm). The composites were heated at a constant rate of 10K/min from a temperature of 300 K to 600 K, where they were annealed for 300 s. These datareveal common features of solid state reactions in Cu/a-Si diffusion couples.
The initial growth of Cu3Si at the Cu/a-Si interfaces dominates the low temperaturecalorimetry data for composites with larger values of λ. Upon heating such a Cu/a-Si composite(30 nm < λ < 200 nm), a heat flow signal is first observed at a temperature of about 350 K (Fig.4). The reaction rate tends to increase with increasing temperature, reaching a maximum at atemperature close to 510 K (e. g. peak A in Fig. 4, the peak temperature depends upon the valuesof heating rate and λ). The x-ray diffraction analysis that we presented in Figs. 2 and 3 indicatesthat this main calorimetry peak (peak A) corresponds to the formation of Cu3Si, consistent withprevious studies of this system. We find that the other peaks (B, C and D in Fig. 4) correspond todifferent physical transformations.
Calorimetry peaks observed at higher temperatures (peaks B and C in Fig. 4) are identifiedwith the formation of the more Cu rich equilibrium Cu-Si compounds. A clear example isprovided in Fig. 4(d), a plot of heat flow versus temperature for a composite of averagestoichiometry Cu5Si. The main calorimetry peak (labeled A) has been correlated with theformation of Cu3Si. X-ray diffraction data for this sample of average stoichiometry Cu5Si aftercooling to room temperature revealed evidence of the equilibrium Cu5Si phase; thus we identifythe higher temperature calorimetry peak (peak B) with the formation of Cu5Si. The second peak(labeled C) in the calorimetry scan of Fig. 4(c) generally appears only for compositions betweenCu3Si and Cu5Si, i.e. close to that of the equilibrium composition, Cu15Si4. X-ray diffraction
Figure 4- A collection of plots of heat flow per unitinterfacial area versus temperature (measured usingdifferential scanning calorimetry) for Cu/a-Si multilayers ofdifferent stoichiometries that were heated from roomtemperature. The average stoichiometry of the samplesbecomes more Cu rich from top to bottom: (a) Cu55Si45 and λ=142 nm, (b) Cu75Si25 and λ = 66 nm, (c) Cu76Si24 and λ= 96nm, and (d) Cu83Si17 and λ = 136 nm. Various peaks in theheat flow are labeled and have been attributed to either Cusilicide formation or the recovery of disordered Cu3Si. Avertical line marks the beginning of an isotherm at 600 K.

8
analysis (c.f. Fig. 2(c)) of samples exhibitingpeak C provided identification of the phaseCu15Si4 . Thus, we attribute this calorimetrysignal (peak C) to the growth of Cu15Si4 .
The high temperature calorimetrypeaks which we have identified with theformation of Cu rich, equilibrium Cu-Sicompounds are sometimes observed atsignificantly smaller amplitude in plots of heatflow versus temperature for Cu3Sicomposites, depending on values of heatingrate and modulation (λ). Higher heating ratesor larger values of λ tend to result in largeramplitudes of the heat flow peaks observed athigher temperature peaks for Cu3Sicomposites (Fig. 5). We interpret theoccurrence of these higher temperature peaksin Cu3Si composites (which we have linked tothe formation of Cu rich compounds) asresulting from the lack of a complete reactionof the Cu and a-Si layers to form Cu3Si beforethe nucleation temperature of the remainingphases occurs. These additional peaks mayalso be due in part to small errors in layerthicknesses.
A small, additional heat flow peak
[labeled peak D, clearest in Fig. 4(a) and (c)] isgenerally observed at a temperature of about430 K, although with varying amplitudes as canbe seen in Fig. 4. This peak corresponds to arelatively small enthalpy release, between 0 and-0.5 kJ/mol, as opposed to the magnitude of thelarge peak (peak A), which is approximately -10 kJ/mol. No new Bragg peaks are found in x-ray diffraction profiles of samples heated to atemperature just above this calorimetry peak(peak D) and cooled to room temperature (c.f.Fig. 3(b)). In the following discussion, anexamination of reactions in composites ofdifferent values of λ is used to connect thissmall calorimetric signal with the recovery ofdisordered, 7 nm thick layers of Cu3Si existingat the Cu/a-Si interfaces before reaction in thecalorimeter.
Figure 5- Two sets of plots of the heat flow versustemperature for samples of average stoichiometry Cu3Si and λ= 160 nm. Two portions of each sample were heated at 10K/min (dotted line) and 20 K/min (solid line). A verticalline marks the beginning of an isotherm at 600 K.
Figure 6- Three plots of heat flow versus temperaturemeasured by differential scanning calorimetry for samples withaverage stoichiometry Cu3Si and (a) λ= 5.2 nm, (b) λ= 10 nm,and (c) λ= 32 nm.

9
The nature of solid state reactions observed in Cu/a-Si composites prepared with smallervalues of λ was found to be different than those of larger modulation. Upon heating a Cu/a-Sicomposite (λ � 30 nm), calorimetry data revealed traces similar to those observed for therecovery of a disordered phase35-37 rather than a composite reacting by nucleation and growth of anew phase. To illustrate these points, the heat flow versus temperature is plotted in Fig. 6 (a) -(c) for composites of Cu3Si stoichiometry and values of λ equal to 5.2, 10 and 32 nm,respectively, that were heated at 10 K/min. The peaks are relatively small compared to those inFig. 4, and the first peak is now at 450 K or below. Distinct peaks are observed at highertemperatures, as observed for the recrystallization of alloys with a high density of defects.
C. Structural Characterization of Cu/a-Si Multilayers
Because of the energetic nature of sputter deposition, one expects that there may beinterdiffusion at the Cu/a-Si interfaces in a multilayered sample during deposition. Growth of aninterlayer (sometimes amorphous) in as prepared sputtered thin films has been observed before forother metal-silicide systems38-40. This interlayer, whatever its composition, changes the initial stateof the sample from the ideal situation of two pure elements. The existence of such an interlayer isconsistent with the calorimetry observations for λ � 30 nm.
To confirm our interpretation of the calorimetry data for the small modulation samples weconducted a transmission electron microscopy investigation of such samples. For instance, a Cu/a-Si composite of smaller modulation length (λ = 10 nm) and total film thickness 70 nm was floatedoff of the NaCl substrate, rinsed with deionized water, placed on a Cu grid, and examined bymeans of transmission electron microscopy. Electron diffraction and bright field transmissionelectron microscopy were performed on this sample in plane view. The sample waspolycrystalline with grain size on the order of 10 nm. Electron diffraction results revealed ringsthat were indexed to the Cu3Si phase.
The indication is that a layer of Cu3Si forms at the Cu/a-Si interfaces during samplefabrication. The x-ray diffraction results indicate that this phase is highly disordered. If a highdensity of defects were found in the alloy,the recovery process in this phase uponheating could account for a small,exothermic reaction. Given these factsand the calorimetry results for small λvalue samples, we conclude that the peakat approximately 430 K in calorimetryscans for thicker layered composites(peak D in Fig. 4) corresponds to therecovery of disordered Cu3Si found at theCu/Si interfaces. This conclusion isfurther substantiated with an investigationof the dependence uponλ of theintegrated enthalpy release (section D).
Despite the apparent existence ofan interlayer in the Cu/a-Si diffusioncouples, low angle x-ray diffraction
Figure 7- Low angle x-ray diffraction results for two Cu/a-Simultilayers of Cu3Si stoichiometry and (a) λ= 100 nm, and (b) λ= 23nm.

10
shows that samples are typically well layered structures. Figure 7 displays the data obtained forlow angle x-ray diffraction experiments performed on Cu/a-Si multilayers with Cu3Sistoichiometry and two different modulations: λ= 100 nm [Fig 7(a)] and λ= 23 nm [Fig 7 (b)].The existence of many distinct peaks at low angle indicates a layered structure for our thin films.Simulations of the low angle spectra for the two samples of Fig. 7 were carried out usingcommercially available software. The simulations, which included a 4 nm thick interlayer ofCu3Si, are in qualitative agreement with the data obtained for both samples of Fig. 7. Theindication from the simulations is that the interfacial roughness in our samples is at most 1.0 nm.
The consistency of the layered structure and interface quality is also reflected indifferential scanning calorimetry data. If we assume relatively smooth interfaces in ourmultilayers, then our corresponding calorimetry data should scale directly with interfacial area.However, we note that processes such as recovery and recrystallization (labeled D in Fig. 4) thatare not occurring at an interface should not scale directly with the interfacial area of the diffusioncouple. In Fig. 8, we plot the heat flow per interfacial area, measured by differential scanningcalorimetry, versus temperature for samples with three different modulations: 160 nm (solid line),86 nm (long dash) and 66 nm (short dash). For three separate samples with three distinctlydifferent values of layer modulation, λ, the signal associated with the growth of Cu3Si scales with
the interfacial area. At the lowesttemperatures (less than 410 K) in Fig. 8,we see good agreement between heat flowdata for the three different samples.However, the low temperature peakcentered at approximately 420 K that wasassociated with a recovery process doesnot scale well with interfacial area. Athigher temperatures (440-470 K) the tracesof Fig. 8 once again scale well withinterfacial area, in a temperature rangewhere we observed solid state reactions toform Cu3Si. The indication from low anglex-ray diffraction and this examination ofthe calorimetry data is that our samples arelayered structures with well definedinterfacial area. This conclusion allows usto examine the kinetics of formation ofCu3Si (section E).
Figure 8- A set of differential scanning calorimetry data (heatflow per unit interfacial area versus temperature) for sampleswith average stoichiometry Cu3Si and three differentmodulations: λ= 160 nm (solid line), λ= 96 nm (long dash), andλ= 86 nm (short dash). A vertical line marks the beginning of anisotherm at 600 K.
11
D. Enthalpy of Formation for Cu3Si
Measurements of the heat of formation as a function of modulation length also indicatesignificant premixing at the Cu/a-Si interfaces. For a determination of the enthalpy of formation ofCu3Si from Cu and a-Si, multilayer samples were prepared with the average stoichiometry of thisphase. A variety of modulations were used, ranging from 5.2 to 160 nm. Figure 8 is a plot ofheat flow, measured by differential scanning calorimetry, versus temperature for samples withthree different bilayer thicknesses: 160 nm (solid line), 86 nm (long dash) and 66 nm (short dash).
If an interlayer forms in as-prepared sputtered thin films, the amount of enthalpy obtainedupon reacting a multilayer should vary with the modulation, λ. When sample preparationconditions (pressure, sputtering power and rates, etc.) are kept the same, the interlayer will beapproximately the same thickness in every sample, independent of λ� For values of λ greater than2λο (twice the thickness of the interlayer), the relation of a measured heat of formation to themodulation may be written as38,41:
λ∆λ
−∆=∆ gdHHH
$
$
2 (1)
where ∆Ho is the heat of formation with an absence of an interlayer, gdH∆ is the heat of
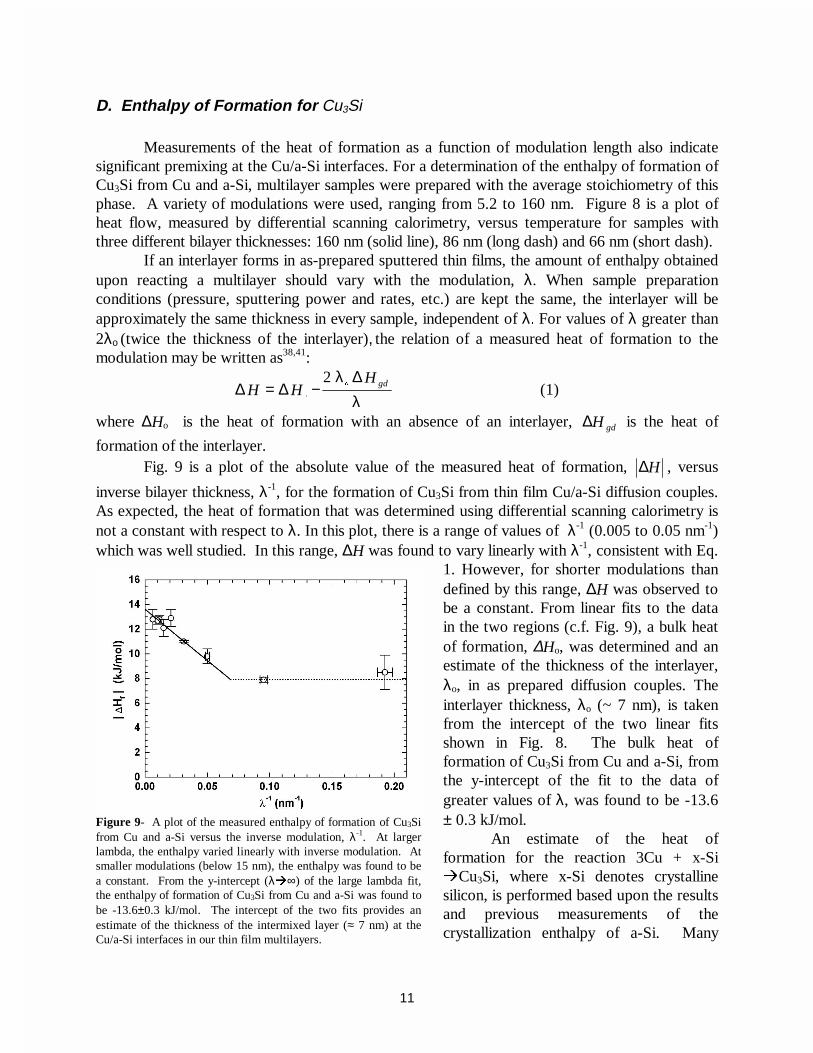
formation of the interlayer.Fig. 9 is a plot of the absolute value of the measured heat of formation, H∆ , versus
inverse bilayer thickness, λ-1, for the formation of Cu3Si from thin film Cu/a-Si diffusion couples.As expected, the heat of formation that was determined using differential scanning calorimetry isnot a constant with respect to λ. In this plot, there is a range of values of λ-1 (0.005 to 0.05 nm-1)which was well studied. In this range, ∆H was found to vary linearly with λ-1, consistent with Eq.
1. However, for shorter modulations thandefined by this range, ∆H was observed tobe a constant. From linear fits to the datain the two regions (c.f. Fig. 9), a bulk heatof formation, ∆Ho, was determined and anestimate of the thickness of the interlayer,λo, in as prepared diffusion couples. Theinterlayer thickness, λo (~ 7 nm), is takenfrom the intercept of the two linear fitsshown in Fig. 8. The bulk heat offormation of Cu3Si from Cu and a-Si, fromthe y-intercept of the fit to the data ofgreater values of λ, was found to be -13.6± 0.3 kJ/mol.
An estimate of the heat offormation for the reaction 3Cu + x-SiÆCu3Si, where x-Si denotes crystallinesilicon, is performed based upon the resultsand previous measurements of thecrystallization enthalpy of a-Si. Many
Figure 9- A plot of the measured enthalpy of formation of Cu3Sifrom Cu and a-Si versus the inverse modulation, λ-1. At largerlambda, the enthalpy varied linearly with inverse modulation. Atsmaller modulations (below 15 nm), the enthalpy was found to bea constant. From the y-intercept (λÆ∞) of the large lambda fit,the enthalpy of formation of Cu3Si from Cu and a-Si was found tobe -13.6±0.3 kJ/mol. The intercept of the two fits provides anestimate of the thickness of the intermixed layer (≈ 7 nm) at theCu/a-Si interfaces in our thin film multilayers.

12
measurements of the heat of crystallization,∆Hx , of a-Si are available42-44. Using avalue of ∆Hx = -11.6±0.4 kJ/mol which isbased on a set of measurements from thisgroup, we estimate the heat of formationof Cu3Si from Cu and x-Si to be –10.7±0.3 kJ/mol. While ours is apparently thefirst measurement of the heat of formationof Cu3Si, we can compare our result with aprevious theoretical estimate of thisquantity, ∆H = -2.7 kJ/mol45. Similardisparities between estimates and actualmeasurements have been observed in manymetal-Si systems in the past.
Measurements of the enthalpies offormation for other Cu silicides were alsomade. Two stoichiometries other thanCu75Si25 were chosen: Cu83Si17 andCu89Si11. The first of these corresponds to the stoichiometry for the equilibrium silicide phaseCu5Si. The second lies in a region where a complete reaction to equilibrium would result in aphase mixture of Cu5Si and excess Cu. A high temperature phase does exist that is more Cu richthan Cu5Si (c.f. Fig. 1), but the lower phase boundary for this phase is higher in temperature thanthe range of our experiments. Measurements of the enthalpy of formation at these twostoichiometries were done using only one value for the sample modulation for each stoichiometry:136 nm for Cu83Si17 and 196 nm for Cu89Si11. Thus, the correction for the defective Cu3Si at theinterfaces of the diffusion couples was determined using the results of the Cu3Si investigation.With this correction achieved, the enthalpy of formation for bulk Cu5Si forming from Cu and a-Siwas found to be –10.5±0.6 kJ/mol. In the two-phase region (Cu89Si11) the enthalpy of formationwas found to be –7.5±1.2 kJ/mol. These two points along with the determination for Cu3Si areplotted in Fig. 10 as the enthalpy of formation versus atomic percent Si. The solid, horizontal linein Fig. 10 represents a phase mixture between crystalline Cu and crystalline Si, while the dashedline represents a phase mixture between crystalline Cu and amorphous Si. The points in Fig. 10are values for the enthalpy of formation of these alloys and phase mixtures from Cu and x-Si, i.e.–6.2±1.0 kJ/mol for Cu89Si11 and -8.6±0.5 kJ/mol for Cu5Si.
E. Growth Kinetics for Cu3SiThe reaction kinetics for the formation of Cu3Si from Cu/a-Si diffusion couples were
investigated using differential scanning calorimetry. This technique utilizes our measurement ofheat flow and the planar geometry of our diffusion couples to provide a direct calculation ofreaction constants for any temperature during a DSC heating curve. These calculations areaccomplished using the relation of the heat flow to the reaction rate for planar, one-dimensionalgrowth46:
dt
dx
M
HA
dt
dH ∆ρ= (2)
Figure 10- A plot of the enthalpy of formation of of Cu silicidesversus atomic percent Si. Enthalpies of formation from Cu and x-Si for two equilibrium phases (Cu3Si and Cu5Si) are shown on thisplot and a determination for the Cu rich stoichiometry Cu89Si11.The lines for equilibrium phase mixtures between Cu and x-Si(solid line) and Cu and a-Si (dashed line) are also plotted here.

13
where A is the interfacial area, ∆H is the heat of reaction, and ρ and M are the density and molarmass of the growing silicide. For the case where the growth of the silicide is diffusion controlledthe thickness of the silicide, x follows a parabolic growth law:
x
k
dt
dx
2
2
= (3)
where t is the time and k2 is the temperature dependent reaction constant. Thus, with diffusionlimited growth assumed or independently verified, a reaction constant may be determined byintegrating Eq. 2 with respect to time and combining the result with Eqs. 2 and 3 to yield:
dt
dHH
HA
Mk
2
2 2
∆ρ
= (4)
Reaction constants for the growth of Cu3Si in the temperature range of 450-500 K weredetermined from heat flow data using Eq. 4. In general, one expects that the temperaturedependence of the reaction constant is Arrhenius, indicating thermally activated growth:
−= TkEkk
b
aexp2$
(5)
where bk is Boltzmann’s constant, aE is the activation energy and ko is the pre-factor.
Fig. 11 is a plot of the logarithm of the reaction constants measured as described aboveversus inverse temperature. Four sets of data are provided in this graph for three of which are forsamples of Cu3Si stoichiometry of different modulations: 86 nm (q), 96 nm (c) and 160 nm (°).The last set contained in Fig. 11 are reaction constants calculated from linear fits to portions to
isothermal DSC data (plotted as &). Thesemeasurements of the reaction constant, k2,from isothermal data are in goodagreement with those determined fromconstant heating rate data. They alsoprovided a verification of diffusion limitedgrowth that was assumed for thedeterminations of k2 from constant heatingrate data. From numerous fits to data ofreaction constants from samples withmodulation of λ > 66 nm, the bestdetermination of the pre-factor andactivation energy is kο= 1.5x10⁻³ cm2/s and
aE = 0.98 eV.
Some of the previous worksuggests that at temperatures below 750 Kgrain boundary diffusion is generally thedominant growth mechanism of Cu3Si inCu/Si diffusion couples15. Fig. 12 is anArrhenius plot of the reaction constantsmeasured here and those determined byother investigators10-12,16. Becht et. al.
Figure 11- A plot of the logarithm of the reaction constant, k2,versus inverse temperature times one thousand for three differentsamples of average stoichiometry Cu3Si and modulation: 86 nm (q),96 nm (c) and 160 nm (°) and one of Cu5Si stoichiometry and λ=136 nm (&). The data plotted as hollow symbols is the average ofreaction constants determined from five or more separate DSCexperiments (constant heating rate data) on a given sample. Thesolid symbol data is from linear fits to plots of H2 versus t forisothermal portions of DSC scans. For clarity, error bars are shownfor the 160 nm modulation (°) only.

14
observed a distinct change in the activationenergy of the reaction process from 1.1eV/atom to 1.8 eV/atom at a temperature of743 K. Based upon this observation andchanges in sample morphology theyconcluded that bulk diffusion was thedominant growth process at the highesttemperatures, with grain boundary diffusiondominant below 743 K. In diffusion couplesof Si and phosphorus-doped Cu (one atomicpercent P), results at high temperature weresimilar, but the apparent grain boundarydiffusion mechanism dominated attemperatures up to 803 K, with a largerreaction constant observed, and a slightlydifferent activation energy (0.94 eV/atom).The values of k2 reported by otherinvestigators generally are in the range of thevalues (or their low temperatureextrapolation) reported by Becht et. al.Becht considered most of the data of theprevious investigators plotted in Fig. 12, andconcluded that these reflected a grainboundary diffusion mechanism.
The magnitude of the reactionconstants for the formation of Cu3Si in ourthin film Cu/a-Si diffusion couples werefound to be about three orders of magnitudesmaller than previously observed inneighboring or overlapping temperatureranges. The activation energy we observed,
aE = 0.98 eV, was similar to those observed
by other investigators (c.f. Table 1). It should be noted that the order of magnitude of the reactionconstants we observed is close to those of an extrapolation of the curve which Becht, et. al.identified with bulk diffusion. Apparently, the microstructure of the Cu3Si grown from a-Si andsputtered Cu does not afford the high rates of grain boundary diffusion observed in samples ofCu3Si grown from crystalline Si and single crystal Cu. These results are consistent with previousresults in the sense that grain boundary diffusion is often sensitive to sample morphology. It issurprising that a small grained sample such as those typically prepared by sputtering would havelower grain boundary diffusion rates than larger grained, bulk samples. Our lower values ofreaction constant may be due to the disordered nature of the Cu3Si layer that grows over theselength scales. Also, no preferred orientation of crystallites was found in our Cu3Si layers, so that ifcertain grain boundaries provide short circuits for diffusion these are not available in anycontinuous paths.
Figure 12- An Arrhenius plot (logarithm of the reactionconstant versus inverse temperature) of the results of manyinvestigations of the growth of Cu3Si: this work (q), Hong,et. al. (c), Veer, et. al. (°), Ward and Carroll (♦), Onishiand Miura (�), and Becht, et. al. (y) [see Refs. 15-19]. Thelines on this plot were taken from the three forms of thereaction constant for different diffusion mechanisms foundby Becht, et. al.: bulk, grain boundary (with and withoutphosphorous impurities).

15
IV. Conclusions
We determined the heat of formation of Cu3Si from a-Si and Cu to be -13.6 kJ/mol andcalculated the heat of formation of Cu3Si forming from x-Si and Cu to be -10.7 kJ/mol. Weobserved the reaction sequence in Cu/a-Si composites upon heating from room temperature. Wefound that Cu3Si forms first at room temperature, but the other equilibrium silicides, Cu15Si4 andCu5Si would form at higher temperatures when the supply of Si was depleted. Reaction constantsfor the formation of Cu3Si were reported and compared to previous measurements. We found thatby the variation of the microstructure afforded by sputter deposition that distinctly slower (3orders of magnitude) growth for Cu3Si was afforded than in the case of bulk diffusion couples.
Acknowledgements
We gratefully acknowledge the support of the National Science Foundation, DMR-9202595and DUE-9452604, and the Integrated Electronics Engineering Research Center (IEEC) locatedin the Watson School at Binghamton University. The IEEC receives funding from the New YorkState Science and Technology Foundation, the National Science Foundation and a consortium ofindustrial members.
References1. S. P. Murarka, Mat. Sci. Eng. R19 87 (1997).2. J. Li, Y. Shacham-Diamand and J.W. Mayer, Mater. Sci. Rep. 1 (1992).3. C. S. Liu and L. J. Chen, J. Appl. Phys. 75, 2730 (1994).4. C.S. Liu and L.J. Chen, J. Appl. Phys. 74, 5507 (1993).5. J. M. Harper, A. Charai, L. Stolt, F. M. d’Heurle, and P. M. Fryer, Appl. Phys. Lett. 56 2519 (1990).6. L. Stolt, A. Charai, F. M. d’Heurle, P. M. Fryer, and J. M. E. Harper, J. Vac. Sci. Technol. A 9 1501(1991).7. K. Richter and P. Doppler, Sol. State Ionics 101-103, 687 (1997).8. A.I. Gorbunov, A.P. Belyi and G.G. Filippov, Russ. Chem. Rev. 43, 291 (1974).9. N. Selamoglu, J.A. Mucha, D.L. Flamm and D.E. Ibbotson, J. Appl. Phys. 64, 1494 (1988).10. H. Mori, J. Imahori, T. Oku and M. Murakami, AIP Conf. Proc. 418, 475 (1998).11. C.S. Liu and L.J. Chen, J. Appl. Phys. 74, 5501 (1993).12. R.J. Gutmann, T.P. Chow, W.N. Gill, A.E. Kaloyeros, W.A. Lanford and S.P. Murarka, Advanced
Metallizations for Devices and Circuits- Science, Technology and Manufacturability edited by S.P. Murarka,A. Katz, K.N. Tu and K. Maex (Mater. Res. Soc. Proc. 337, Pittsburgh, PA, 1994), pp. 41-57.
13. D. Adams, R.L. Spreitzer, S.W. Russell, N.D. Theodore, T.L. Alford and J.W. Mayer, Advanced Metallizationsfor Devices and Circuits- Science, Technology and Manufacturability edited by S.P. Murarka, A. Katz, K.N.Tu and K. Maex (Mater. Res. Soc. Proc. 337, Pittsburgh, PA, 1994), pp. 231-236.
14. L. Levin, Z. Atzmon, A. Katsman and T. Werber, Mater. Chem. Phys. 77, 4399 (1995).15. J.G.M. Becht, F.J.J. van Loo and R. Metselaar, Reactivity of Solids 6, 45 (1988).16. W.J. Ward and K.M. Carroll, J. Electrochem. Soc. 129, 227 (1982).17. M. Onishi and H. Muira, Trans. JIM 18, 107 (1977).18. F.A. Veer, B.H. Kolster and W.G. Burgers, Trans. Met. Soc. AIME 242, 669 (1968).19. S.Q. Hong, C.M. Comrie, S.W. Russell and J.W. Mayer, J. Appl. Phys. 70, 3655 (1991).20. B.G. Demczyk, R. Naik, G. Auner, C. Kota and U. Rao, J. Appl. Phys. 75, 4995 (1994).21. R. Padiyath, J. Seth, S.V. Babu and L.J. Matienzo, J. Appl. Phys. 73, 2326 (1993).22. A. Cros, M.O. Aboelfotoh and K.N. Tu, J. Appl. Phys. 67, 3328 (1990).23. M.Setton, J. Van der Spiegel and B. Rothman, Appl. Phys. Lett. 57, 357 (1990).24. C. Chang, J. Appl. Phys. 67, 566 (1990).25. S.H. Corn, J.L. Falconer and A.W. Czanderna, J. Vac. Sci. Technol. A6, 1012 (1988).

16
26. F. Ringeisen and J. Derrien, J. Vac. Sci. Technol. B1, 546 (1983).27. T.B. Massalski, Binary Alloy Phase Diagrams, 2nd Ed. (ASM International, Materials Park, OH, 1990), pp.
1477-8.28. E.S. Microware, Inc.29. S.M. Myers and D.M. Follstaedt, J. Appl. Phys. 79, 1337 (1996).30. K.P. Mukherjee, J. Bandyopadhyaya and K.P. Gupta, Trans. Met. Soc. AIME 245, 2335 (1969).31. J.K. Solberg, Acta Cryst. A34, 684 (1978).32. G. Weber, B. Gillot and P. Barrett, Phys. Stat. Sol. A75, 567 (1983).33. ICDD, Calculated from ICSD using POWD-12++, (1997).34. F.R. Morral and A. Westgren, Ark. Kemi, Mineral. Geol., 11, 1 (1934).35. J. Knop, Masters Thesis, Binghamton University, 1996.36. R.B. Schwarz and R.R. Petrich, J. Less-Common Met. 140, 171 (1988).37. L. Battezzati, G. Cocco, L. Schiffini and S. Enzo, Mat. Sci. Eng. 97, 121 (1988).38. R.J. Kasica and E.J. Cotts, J. Appl. Phys. 82, 1488 (1997).39. K. Holloway, PhD Dissertation, Stanford University, 1988.40. I.J.M.M. Raajimakers, A.H. Reader and P.H. Oosting, J. Appl. Phys. 63, 2790 (1988).41. C. Michaelsen, K. Barmak, and T. P. Weihs, J. Phys. D: Appl. Phys. 30 3167 (1997).42. S. Roorda, S. Doorn, W.C. Sinke, P.M.L.O., Scholte and E. van Loenen, Phys. Rev. Lett. 62, 1880 (1989).43. E.P. Donovan, F. Spaepen, D. Turnbull, J.M. Poate and D.C. Jacobsen, J. Appl. Phys. 57, 1795 (1985).44. J.C.C. Fan and H. Anderson, J. Appl. Phys. 52, 4003 (1981).45. D. Lüdecke, CALPHAD 11, 135 (1987).46. E.J. Cotts in Thermal Analysis in Metallurgy, edited by R.D. Shull and A. Joshi (Minerals, Metals and Mining
Society, Warrendale, PA, 1992), pp. 299-328.