thermochemically driven gas{dynamic fracturing … library/research/oil-gas/enhanced oil... ·...
TRANSCRIPT

THERMOCHEMICALLY
DRIVEN GAS–DYNAMIC
FRACTURING (TDGF)
Award Number: DE-FC26095NT15479
Oct 2005 – Dec 2008
Final Technical Report
Project Director: Michael Goodwin
More Oil Inc., 1257 Stonewater Cir, Ocoee, FL 34661
Phone - 321-948-5843
Email - [email protected]
March 2010
Disclaimer
This report was prepared as an account of work sponsored by an
agency of the United States Government. Neither the United States
Government nor any agency thereof, nor any of their employees, makes
any warranty, express or implied, or assumes any legal liability or re-
sponsibility for the accuracy, completeness, or usefulness of any infor-
mation, apparatus, product, or process disclosed, or represents that
its use would not infringe privately owned rights. Reference herein to
any specific commercial product, process, or service by trade name,
trademark, manufacturer, or otherwise does not necessarily constitute
or imply its endorsement, recommendation, or favoring by the United
States Government or any agency thereof The views and opinions of
authors expressed herein do not necessarily state or reflect those of
the United States Government or any agency thereof.

Abstract
This report concerns efforts to increase oil well productivity and effi-
ciency via a method of heating the oil-bearing rock of the well, a tech-
nique known as Thermochemical Gas-Dynamic Fracturing (TGDF).
The technique uses either a chemical reaction or a combustion event
to raise the temperature of the rock of the well, thereby increasing oil
velocity, and oil pumping rate. Such technology has shown promise
for future application to both older wellheads and also new sites.
The need for such technologies in the oil extraction field, along with
the merits of the TGDF technology is examined in Chapter 1. The
theoretical basis underpinning applications of TGDF is explained in
Chapter 2. It is shown that productivity of depleted well can be in-
creased by one order of magnitude after heating a reservoir region of
radius 15-20 m around the well by 100 degrees 1-2 times per year.
Two variants of thermal stimulation are considered: uniform heating
and optimal temperature distribution in the formation region around
the perforation zone. It is demonstrated that the well productivity at-
tained by using equal amounts of thermal energy is higher by a factor
of 3 to 4 in the case of optimal temperature distribution as compared
to uniform distribution.
Following this theoretical basis, two practical approaches to applying
TDGF are considered. Chapter 3 looks at the use of chemical intiators
to raise the rock temperature in the well via an exothermic chemical
reaction. The requirements for such a delivery device are discussed,
and several novel fuel-oxidizing mixtures (FOM) are investigated in

conditions simulating those at oil-extracting depths. Such FOM mix-
tures, particularly ones containing nitric acid and a chemical initiator,
are shown to dramatically increase the temperature of the oil-bearing
rock, and thus the productivity of the well. Such tests are substanti-
ated by preliminary fieldwork in Russian oil fields.
A second, more cost effective approach to TGDF is considered in
Chapter 4: use of diesel-fuel to raise the rock temperature by a com-
bustion process in the well. The requirements for such a Gas-Vapor
Generator are laid out, and the development of a prototype machine
is explained. This is backed up with laboratory experiments show-
ing that the fuel-water mixture used does significantly increase the
viscosity of the oil samples. The prototype Gas-Vapor Generator is
shown to be able to operate at temperatures of 240 ℃ and pressures
of 200 atm. Unfortunately, geopolitical and economic factors outside
of our control led to the cancellation of the project before the field
testing phase of the generator could be commenced. Nevertheless, it
is to be hoped that this report demonstrates both the feasibility and
desirability of the Gas-Vapor Generator approach to the application
of TDGF technology in both existing and new wells, and provides a
foundation for further research in the future.

Contents
Abstract iv
Contents vi
List of Figures vii
List of Tables viii
Nomenclature ix
1 Background and introduction 1
1.1 Enhancing oil recovery rates . . . . . . . . . . . . . . . . . . . . . 1
1.2 Hydraulic fracturing . . . . . . . . . . . . . . . . . . . . . . . . . 2
1.3 Thermochemically Driven Gas dynamic Fracturing (TDGF) tech-
nology . . . . . . . . . . . . . . . . . . . . . . . . . . . . . . . . . 2
1.4 Project goals . . . . . . . . . . . . . . . . . . . . . . . . . . . . . 4
2 Theoretical background:
Heating the Depleted Well Vicinity to Enhance Oil Output 6
2.1 Introduction . . . . . . . . . . . . . . . . . . . . . . . . . . . . . . 6
2.2 Modeling the thermal stimulation of oil-bearing formations . . . . 6
2.3 Darcy Equation . . . . . . . . . . . . . . . . . . . . . . . . . . . . 7
iv

CONTENTS
2.4 Pseudo-Steady-State Well Operation: Productivity Dependence
on Oil Viscosity and Other Parameters . . . . . . . . . . . . . . . 8
2.5 Well Productivity Dependence on Temperature Distribution for a
Given Total Thermal Energy Input . . . . . . . . . . . . . . . . . 10
2.6 Relaxation of a Thermally Stimulated Reservoir and Dependence
of Well Productivity on the Cooling Regime . . . . . . . . . . . . 13
2.6.1 Conductive Cooling of a Thermally Stimulated Pay Zone . 14
2.6.2 Convective Cooling of a Thermally Stimulated Pay Zone . 15
2.6.3 Cooling of a Thermally Stimulated Pay Zone by Simulta-
neous Conduction and Convection . . . . . . . . . . . . . . 17
2.7 Analysis and Conclusions . . . . . . . . . . . . . . . . . . . . . . . 18
3 Experimental Results & Discussion I:
Initial Binary Chemical Approach 22
3.1 Introduction . . . . . . . . . . . . . . . . . . . . . . . . . . . . . . 22
3.2 TGDF summary . . . . . . . . . . . . . . . . . . . . . . . . . . . 23
3.3 Chemical generator design and prototype . . . . . . . . . . . . . . 25
3.4 Optimizing FOM . . . . . . . . . . . . . . . . . . . . . . . . . . . 28
3.5 Preparation of recommended fuel-oxidizer mixture compositions
based on theoretical and numerical analysis . . . . . . . . . . . . 28
3.5.1 Measurement of reaction rates and analysis of regimes of
reaction in high-pressure chemical reactor and test facility 30
3.5.2 Parameters measured . . . . . . . . . . . . . . . . . . . . . 31
3.5.3 Description of the chamber and conditions of the experiments. 31
3.5.4 Experimental procedure . . . . . . . . . . . . . . . . . . . 33
3.5.5 Modelling well parameters . . . . . . . . . . . . . . . . . . 33
3.6 Experimental analysis . . . . . . . . . . . . . . . . . . . . . . . . 34
3.7 Conclusions . . . . . . . . . . . . . . . . . . . . . . . . . . . . . . 36
4 Experimental Results & Discussion II:
Generator Approach 37
4.1 Introduction . . . . . . . . . . . . . . . . . . . . . . . . . . . . . . 37
4.2 Gas-vapor generator (GVG): technical specifications . . . . . . . . 42
4.2.1 Overall generator specifications . . . . . . . . . . . . . . . 43
v

CONTENTS
4.2.2 Composition of the well product . . . . . . . . . . . . . . . 46
4.3 Results: Combustion of oil-saturated rock samples . . . . . . . . . 48
4.4 Testing the prototype generator . . . . . . . . . . . . . . . . . . . 49
4.5 Conclusions . . . . . . . . . . . . . . . . . . . . . . . . . . . . . . 52
5 Conclusions 53
References 55
vi

List of Figures
3.1 Schematic diagram of the proposed chemical generator design. . . 26
3.2 Main units and parts . . . . . . . . . . . . . . . . . . . . . . . . . 26
3.3 Schematic of the revised generator. . . . . . . . . . . . . . . . . . 29
3.4 Schematic of the testing chamber. . . . . . . . . . . . . . . . . . . 32
4.1 Schematic of the Gas-Vapor Generator. . . . . . . . . . . . . . . . 44
4.2 Diagram of GVG. . . . . . . . . . . . . . . . . . . . . . . . . . . . 45
4.3 Several pictures of the Gas-Vapor Generator. . . . . . . . . . . . . 50
4.4 Images of the control system guages, control system readout and
pump unit for the Gas-Vapor Generator (Geotechnica). . . . . . . 51
vii

List of Tables
2.1 Results of field tests of prototype TGDF technology in Perm oilfields. 21
3.1 Results of reaction of acid/FOM mixtures with rock-oil samples at
varying pressures. . . . . . . . . . . . . . . . . . . . . . . . . . . . 35
3.2 Further optimisation of acid/FOM mixtures delivery with rock-oil
samples. . . . . . . . . . . . . . . . . . . . . . . . . . . . . . . . . 36
4.1 Parameters for basic generator operating mode. . . . . . . . . . . 42
4.2 Rock sample tests in the absence of water. . . . . . . . . . . . . . 48
4.3 Rock sample tests in the presence of water. . . . . . . . . . . . . . 49
viii

Nomenclature
CP volumetric specific heat capacity of rock matrix
CoilP specific heat capacity of oil
E total heat input to oil-bearing rock within annular volume
I fluid conductivity
L pay zone thickness, m
M mass of oil extracted, kg
P pressure, Pa
Q well productivity, m3.s−1
T temperature, K
T0 background temperature, K
U Darcy flux, m.s−1
V (∗) volume, m3
∆T temperature rise over background temperature, K
ix

LIST OF TABLES
α porosity, dimensionless
χ thermal diffusivity
γ fluid weight per unit volume of rock matrix
κ heat conducitivity of rock
µ dynamic viscosity, Pa.s or poise
ρ density, kg.m−3
ρoil oil density, kg.m−3
τ1/2 time (half–life), s
d coefficient of permeability, D or cm2
k pore fluid conductivity
r wellbore radius, m
Roman Symbols
a excess air factor, dimensionless
CT cyclic treatment
FOM fuel–oxidizing mixture
PT pulse treatment
VT vibration treatment
WV working-fluid volume, m3
TDGF Thermochemically Driven Gas–dynamic Fracturing
x

CHAPTER 1
Background and introduction
1.1 Enhancing oil recovery rates
In partially depleted oil reservoirs, hundreds of thousands of wells produce oil at
low rates. The costs of stimulation the rate of oil recovery may not be covered
by the existing revenues. Therefore, inexpensive new treatment technologies are
required. Furthermore, the global oil reserves include about 50% of high-viscosity
and bitumen oil. Its extraction is impeded by high costs. Specialists predict that
the relative amount of high-viscosity oil gained in situ in 10 to 15 years may reach
50% in some countries.
The decrease in the productivity and cost-effectiveness of an oil well is ex-
plained, in part, by the accumulation of highly viscous oil deposited on the sur-
face of pores and cracks in the near-borehole zone of the pay. This process takes
place in the vicinity of any borehole in conventional and heavy/viscous-oil reser-
voirs. The inflow of oil is blocked by these deposits, which are difficult to remove
without heating.
1

1.2 Hydraulic fracturing
1.2 Hydraulic fracturing
The most effective current method for stimulating oil wells is the (physical) tech-
nology of hydraulic fracturing developed in the USA. In hydraulic fracturing, a
working fluid (oil, water, or carbon dioxide) is pumped down a well under high
pressure to fracture a pay and create cracks of large length and volume. Typically,
the hydraulic fracturing working-fluid volume (WV) is about 10-20 cubic meters.
The pumps which are on the surface, create cracks, increase their volume and
ramified area inside a layer until the system is dynamically balanced, after which
the growth of cracks stops. All pumped liquid leaves through lateral surfaces of
new cracks in a layer.
The hydraulic well-stimulation methods currently used to enhance oil pro-
duction are very efficient, but may be further improved. In commonly deployed
hydraulic fracturing technology, the work done to create fractures is provided by
a fluid-injection system with a pumping power of up to 5,000 hp. In terms of
efficiency, this may be compared to the use of a fuel pump as the only source of
energy for rotating the wheels of a car without combustion of fuel, i.e. powerful
pumps are required in order to introduce the inert liquid into a well. A better
solution is to find an economical system to introduce fuel and an oxidizer using
precise binary mixes, via a machine capable of directing their reaction. Such
binary mixtures combust when combined, which has a beneficial effect upon the
rate of oil recover. This is known as Thermochemically Driven Gas dynamic
Fracturing (TDGF) technology.
1.3 Thermochemically Driven Gas dynamic Frac-
turing (TDGF) technology
In the controlled Thermochemically Driven Gas dynamic Fracturing (TDGF)
technology developed by More Oil, high-temperature foaming reacting agents are
injected into a pay instead of an inert fluid. A special apparatus has been con-
structed to increase the working volume (WV) of the foaming agents introduced
2

1.3 Thermochemically Driven Gas dynamic Fracturing (TDGF)technology
into a well compared to a typical hydraulic fracturing WV. The TDGF technol-
ogy provides an efficient solution to this problem as it combines heating of oil by
chemical reaction with formation of new cracks.
The TDGF technology is an effort to dramatically improve on the current
technology of hydraulic fracturing by combining the fracturing capabilities of the
latter with the benefits of thermally heating the well. This is achieved by pump-
ing a large volume of gas and liquid chemical reagents into a formation, warming
the formation via high-pressure combustion, and increasing oil production.
Thermal technologies are receiving increasing attention as methods for in-
creasing oil extraction, creating thoroughgoing changes in traditional schemes of
oil production while being commercially viable. For example, Canada, who dur-
ing recent years successfully regenerated an older method of heating bituminous
layers with steam, uses a technology that burns part of produced carbohydrates
(15-20%) to markedly speed the extraction of the remainder.
TDGF is a multistage treatment:
• Vibration-treatment stage, which entails fracturing driven by vibration com-
bustion.
• Pulse-treatment stage, which involves expanding cracks caused by the gas
produced in a continuing chemical reaction.
• Cyclic-treatment stage, which causes further expansion by high-temperature,
foaming reacting agents.
Documented increases in the permeability of formations treated with the gases
released by the chemical reactions used in the TDGF technology suggest that
a solution to the problem of thermochemical stimulation can be found through
a drastic increase in the amount of hot gas introduced into the pay zone. The
entire low-permeability zone can be heated so that the heaviest fractions around
the wellbore (also known as the stagnation zone) will be removed.
3

1.4 Project goals
Calculations and results of the works at four wells, which were heated with
chemicals, convinced More Oil that at fields with usual oil it becomes immensely
profitable to pump the heat into the productive layer if we heat a big amount
of rock (not less than 15 thousand tons) not less than up to 100 ℃. The mode
of cracking and heating of the productive layer that will guarantee the increase
of oil flow rate up to 10-15 times was calculated. This maintains a rapid rate of
production (as in Canada) until almost the end of the oil at that field. In such
case, it would take about 2 years to empty a medium field. The amount of not
extracted oil should minimize in 2 - 3 times by our estimation. With this tech-
nology, to keep a high speed of oil production, it is necessary to make cracking
and heating of the layer immediately after a new well has begun to operate, and
then repeat the operation every 1 - 2 years at fields with usual and heavy oil.
These calculations were verified in laboratory conditions by applying chem-
icals at core samples containing oil. Experiments proved that heating of the
reservoir with usual oil up to 100 ℃ will decrease thickness of the oil 10 - 20 fold.
1.4 Project goals
The overall initial goal of the project was to build, test, and field demonstrate
a Chemical Generator using the TDGF technology on a sample of oil wells. In
the course of a TDGF treatment, high-temperature foaming agents produced by
a liquid-phase reaction would be injected into a pay zone instead of an inert fluid.
An advanced version of the TDGF technology was envisaged, where introduc-
tion of chemical reagents into the well would be automated. The diagnostic gas
generator and automatic chemical supply system were planned to be constructed
under subcontracts with two Russian companies. The final system was planned
for field tests in U.S. wells.
The technology has the potential to become a supremely valuable for the oil
business in particular. Every model of oil production shows a significant increase
4

1.4 Project goals
in the production of oil as heat is provided to the reservoir. The TDGF technol-
ogy will combine the power of hydraulic fracturing with the heating capabilities
of the thermal process.
This report covers a summary of the TGDF process followed over the course
of this project. The theoretical background behind TGDF is set out in Chapter
2. Following this, two approaches to achieving TGDF are discussed: firstly, a
chemical generator approach (Chapter 3), and following further cost analysis, a
diesel-fuel gas generator which was the focus of the major part of the project
(Chapter 4). While final deployment of this generator could not be accomplished
by the end of the project timescale (owing to several geopolitical factors out of the
control of the participants), the theoretical and testing work undertaken during
the course of the project will lay a solid foundation for further TGDF technologies
in the future.
5

CHAPTER 2
Theoretical background:
Heating the Depleted Well Vicinity to Enhance Oil Output
2.1 Introduction
This chapter outlines the theoretical basis behind the TDGF technology via the
modeling of well productivity and oil viscosity dependence upon temperature,
and other associated factors.
2.2 Modeling the thermal stimulation of oil-bearing
formations
Large-scale thermal stimulation of an oil-bearing formation in the perforation
zone is a promising method for increasing well productivity. In this method,
the formation temperature is raised by about 100 K or higher within a radial
distance of several tens of meters from the wellbore. Practical implementations
of large-scale thermal stimulation require substantial energy input. Therefore,
preliminary theoretical estimates and calculations should be performed with a
view to minimizing the energy input depending on the formation characteristics
6
2.3 Darcy Equation
and well operating parameters. Previous literature has not tackled this problem,
rather focusing on processes in the vicinity of the borehole [1] and thermal stim-
ulation of reservoirs [2].
To determine the dependence of well productivity on relevant parameters,
such as oil viscosity, consider the flow regime in the pseudo-steady state attained
after the leading edge of a cylindrically symmetric thermal disturbance (heating
wave) propagating through rock from the perforated zone of a wellbore of radius
r1 has stopped at r = r2. Further propagation may be impossible due to the
effect of neighboring producing wells or the finite horizontal extent of the pay.
The cylindrically symmetric approximation is valid when the perforation in-
terval coincides with the pay-zone thickness L.
The boundary conditions are set by specifying the pressure values P1 and P2
at r1 and r2, respectively. These values slowly vary with production time, depend-
ing on the horizontal extent of the pay. The analysis that follows is restricted
to relatively short time intervals, and both P1 and P2 are treated as constant
parameters.
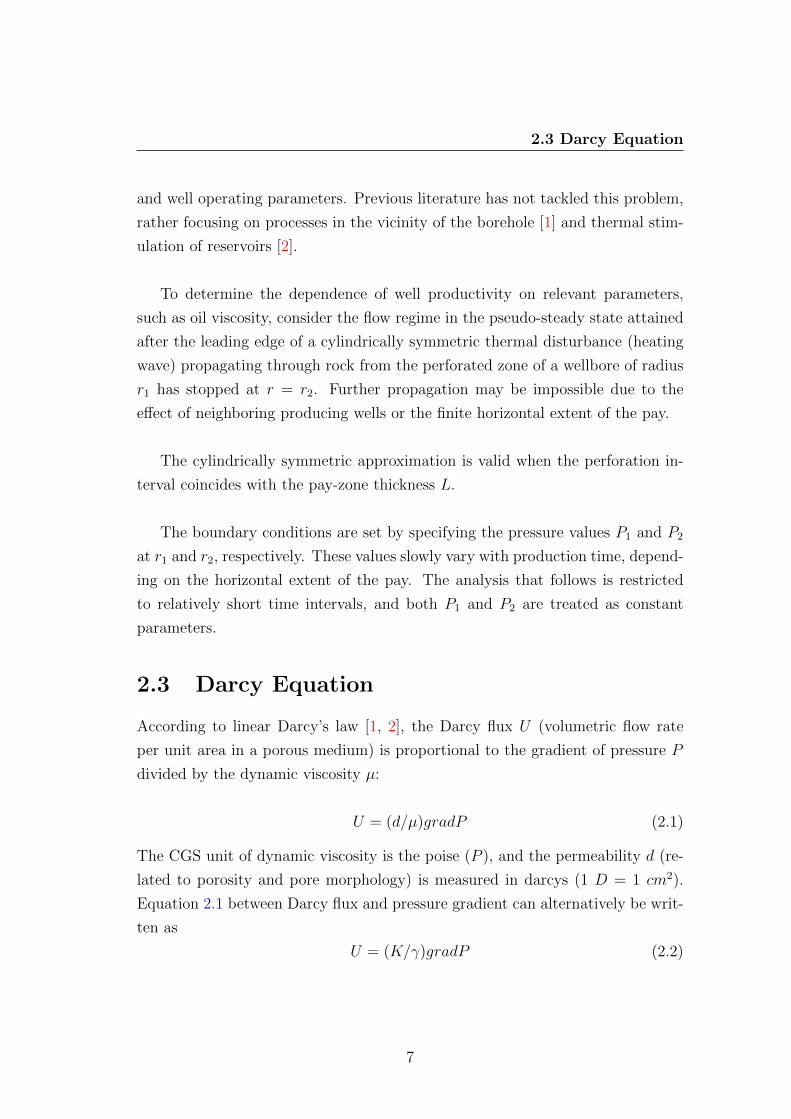
2.3 Darcy Equation
According to linear Darcy’s law [1, 2], the Darcy flux U (volumetric flow rate
per unit area in a porous medium) is proportional to the gradient of pressure P
divided by the dynamic viscosity µ:
U = (d/µ)gradP (2.1)
The CGS unit of dynamic viscosity is the poise (P ), and the permeability d (re-
lated to porosity and pore morphology) is measured in darcys (1 D = 1 cm2).
Equation 2.1 between Darcy flux and pressure gradient can alternatively be writ-
ten as
U = (K/γ)gradP (2.2)
7
2.4 Pseudo-Steady-State Well Operation: Productivity Dependenceon Oil Viscosity and Other Parameters
where γ is the weight of fluid per unit volume of the rock matrix, and the pore
fluid conductivity K is related to permeability as
K = (γ/µ)d (2.3)
2.4 Pseudo-Steady-State Well Operation: Pro-
ductivity Dependence on Oil Viscosity and
Other Parameters
To find the dependence of the productivity Q on P1, P2, r1, and r2, note that it
equals the radial flow rate across the cylindrical surface of area 2rL in a pseudo-
steady-state regime:
Q = 2πrLU (2.4)
Substituting the expression 2.4 for U into 2.1, integrating the resulting equation,
and assuming that the ratio µ/d is independent of r, we obtain
P (r) = (Q/2πL)(µ/d)ln(r2/r1) + const. (2.5)
The unknown integration constant and Q are determined by using the boundary
conditions P (r1) = P1 and P (r2) = P2. As a result, we have const. = P1 and
Q = 2πL(d/µ)(P2 − P1)/ln(r2/r1) (2.6)
(A formula analogous to 2.6 was given in [1]. Recall that Q is the fluid vol-
ume extracted from the well per unit time.) If all quantities on the right-hand
side of 2.6 are expressed in CGS units, then Q will be measured in cm3/s. This
numerical value of Q will remain invariant if permeability and pressure are mea-
sured in darcys and atmospheres, respectively. An example of calculation of Q is
given below. However, the following important observation must be made about
the time variation of any quantity characterizing the well operating conditions
and the thermally disturbed pay. Since time enters the governing equations only
through the ratio t/µ, the solution corresponding to a particular value of dynamic
8

2.4 Pseudo-Steady-State Well Operation: Productivity Dependenceon Oil Viscosity and Other Parameters
viscosity can easily be rescaled in time to obtain the solution for another value
of µ. In particular, it is clear from 2.6 that Q is inversely proportional to µ. This
scaling property can be used to determine the change in productivity caused by
thermal stimulation of the surrounding pay zone. When the initial temperature
is relatively low, the viscosity of oil is drastically reduced by heating (e.g., for
an oil with density 0.96 g/cm3, viscosity decreases from approximately 400 to 25
cP as the temperature rises from 40 to 100 ℃ [1]). When the temperature field
in a nonuniformly heated region is known, the value of Q can be calculated as a
one-dimensional integral over r (see below).
The value of Q given by 2.6 increases with decreasing viscosity.
The temperature dependence of the ratio µ/d is dominated by the steep de-
crease in oil viscosity with increasing temperature, since d is a slowly varying
function of temperature. To facilitate further calculations, the graphic represen-
tations given in [1] for the density dependence of the viscosity of a gas-free oil at
15.15 ℃ and 13.6 ℃ and a pressure of 1 atm were used along with its temper-
ature dependence to obtain an interpolation formula valid for oil of density 0.96
g/cm3:
µ = Aexp(B/T ); A = 2.625 × 10⁻⁷P, B = 5135K (2.7)
Because of the exponential form of 2.7, even a relatively small temperature
rise in the oil-bearing formation will lead to a substantial increase in Q. This be-
havior of oil viscosity underlies the improvement of well productivity by thermal
stimulation.
If µ/d varies with r, then analytical expressions analogous to 2.5 and 2.6
cannot be obtained by direct integration. However, the results can be written in
quadratures:
P2 − P1 = (Q/2πL)I; Q = 2π.L(P2 − P1)/I (2.8)
where
I ≡r2∫
r1
(µ/d)r−1 dr (2.9)
9

2.5 Well Productivity Dependence on Temperature Distribution for aGiven Total Thermal Energy Input
Integral 2.9 can be calculated if µ/d is known as a function of r (see next section).
2.5 Well Productivity Dependence on Tempera-
ture Distribution for a Given Total Thermal
Energy Input
The total heat input to the oil-bearing rock occupying the annular volume within
r1 ≤ r ≤ r2 is related to the temperature distribution as follows:
E = 2πLCP
r2∫r1
∆T (r).r dr (2.10)
where
∆T (r) = T (r) − T0 (2.11)
is the temperature rise over the background temperature T0 and the volumet-
ric specific heat CP of the rock matrix is assumed to be temperature independent.
Temperature dependence of specific heat may be taken into account in 2.10 by
replacing CP∆T in 2.10 withT0+∆T∫T0
CP dT .
Each particular value of E corresponds to infinitely many functions T (r) sat-
isfying 2.10. Each function corresponds to a certain viscosity distribution and a
certain value of Q. Formally, a solution to this variational problem is determined
by imposing an additional constraint. However, it can easily be solved when the
maximum value of Q is sought. Here, particular solutions are found correspond-
ing to the maximum attainable Q and a uniform temperature rise (∆T = const.).
In the case of a uniform temperature rise, the well productivities calculated
for ∆T = 0 and 100 K were compared. Specifically, the following parameters
were set: P2 − P1 = 20 atm, L = 20 m, r1= 0.2 m, r2 = 40 m, T0 = 300 K, and
d = 0.001 D. According to 2.7, µ = 7.13 and 0.099 P at 300 and 400 K, respec-
10
2.5 Well Productivity Dependence on Temperature Distribution for aGiven Total Thermal Energy Input
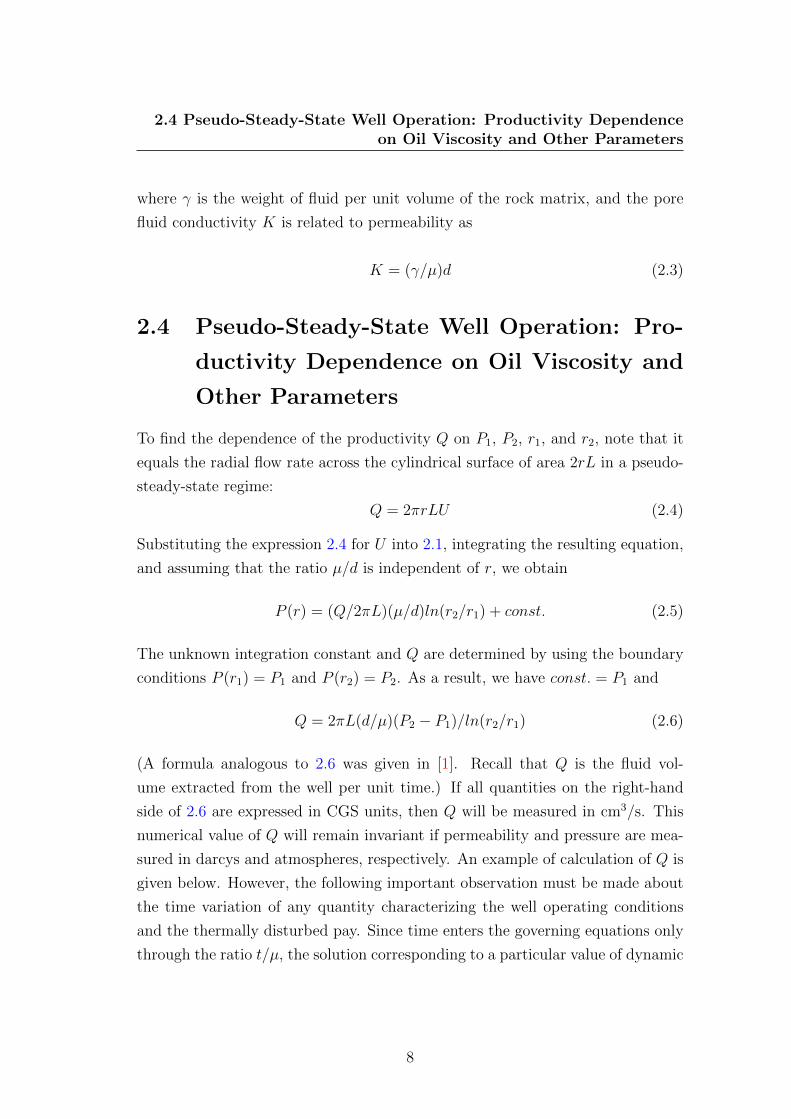
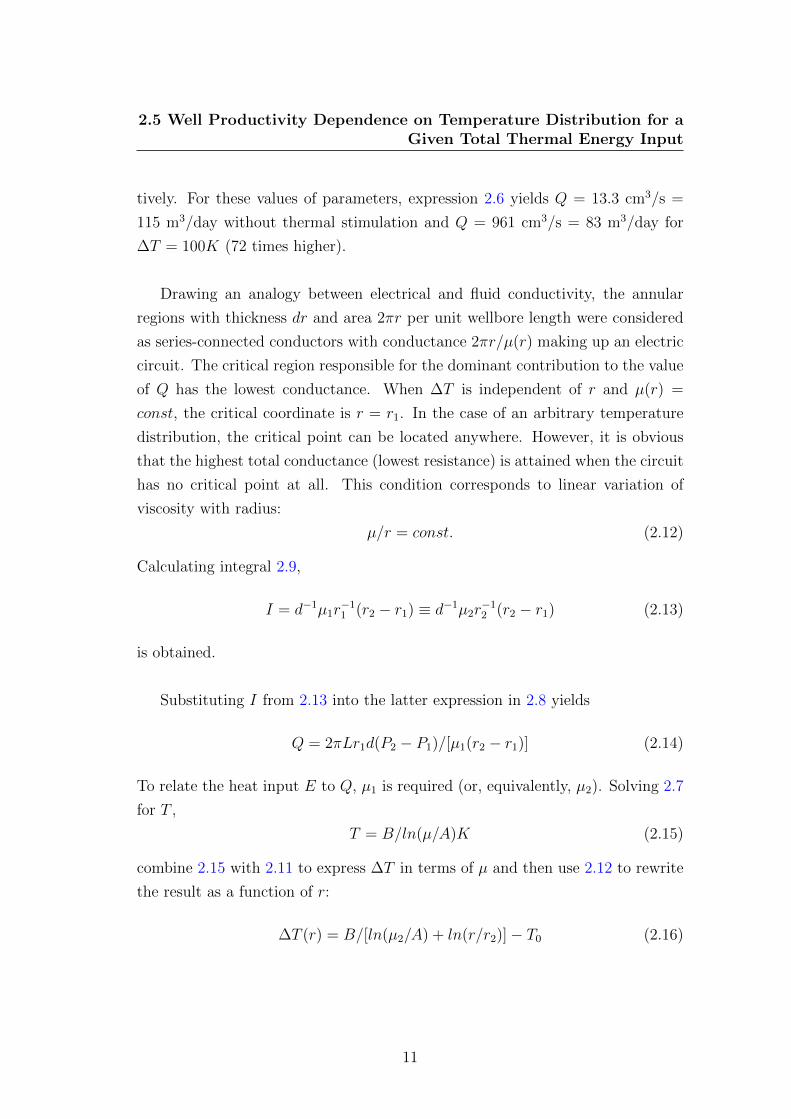
tively. For these values of parameters, expression 2.6 yields Q = 13.3 cm3/s =
115 m3/day without thermal stimulation and Q = 961 cm3/s = 83 m3/day for
∆T = 100K (72 times higher).
Drawing an analogy between electrical and fluid conductivity, the annular
regions with thickness dr and area 2πr per unit wellbore length were considered
as series-connected conductors with conductance 2πr/µ(r) making up an electric
circuit. The critical region responsible for the dominant contribution to the value
of Q has the lowest conductance. When ∆T is independent of r and µ(r) =
const, the critical coordinate is r = r1. In the case of an arbitrary temperature
distribution, the critical point can be located anywhere. However, it is obvious
that the highest total conductance (lowest resistance) is attained when the circuit
has no critical point at all. This condition corresponds to linear variation of
viscosity with radius:
µ/r = const. (2.12)
Calculating integral 2.9,
I = d−1µ1r−11 (r2 − r1) ≡ d−1µ2r
−12 (r2 − r1) (2.13)
is obtained.
Substituting I from 2.13 into the latter expression in 2.8 yields
Q = 2πLr1d(P2 − P1)/[µ1(r2 − r1)] (2.14)
To relate the heat input E to Q, µ1 is required (or, equivalently, µ2). Solving 2.7
for T ,
T = B/ln(µ/A)K (2.15)
combine 2.15 with 2.11 to express ∆T in terms of µ and then use 2.12 to rewrite
the result as a function of r:
∆T (r) = B/[ln(µ2/A) + ln(r/r2)] − T0 (2.16)
11

2.5 Well Productivity Dependence on Temperature Distribution for aGiven Total Thermal Energy Input
By virtue of condition 2.15 applied to the point indexed by 2,
∆T (r) = B/[B/T2 + ln(r/r2)] − T0 (2.17)
is obtained.
Substituting ∆T (r) given by 2.17 into 2.10, a relation between the total heat
input E and T2 is obtained:
E = 2πLCP
T2∫T1
B/[B/T2 + ln(r/r2)] − T0r dr (2.18)
For a given value of E, it is a transcendental equation for the parameter T2 in the
integrand. Equation 2.18 is easy to compute by iteration. Below, its solution for
E/CP = 100πL(r22 − r2
1)Km3 = 2.01107Km3 is given. (In the case of a uniform
thermal disturbance, this value of E/CP corresponds to a temperature rise of 100
K in the entire domain of volume πL(r22 − r2
1). Calculating T2 for r1 = 0.2 m,
r2 = 40 m, T0 = 300 K, A = 2.625 × 10⁻⁷P , and B = 5135K,the following are
obtained: T2 = 384.4K, µ2 = 0.166P , µ1 = 8.3110 − 4P , and T1 = 637K. The
following are the resulting distributions of µ(r) and T (r):
µ(r) = 0.166(r/r2)P, T (r) = B/ln[µ(r)/A] (2.19)
The well productivity given by expression 2.14 with µ1 = 8.3110 − 4P is
Q1 = 2πLr1d(P2 − P1)/[µ1(r2 − r1)] (2.20)
It follows from 2.6 and 2.20 that
Q1/Q = [r2/(r2 − r1)](µ/µ2)ln(r2/r1) (2.21)
where µ = 0.099P (see above). Note that ratio 2.21 is independent of the pressure
drop P2 − P1 and conductivity K. For µ2 = 0.166P , expression 2.21 yields
Q1/Q = 3.16 (2.22)
12

2.6 Relaxation of a Thermally Stimulated Reservoir and Dependenceof Well Productivity on the Cooling Regime
It can be seen that the productivity can be increased by a factor of 3 for the same
preset value of the total heat input E by optimizing the temperature distribution.
This result is obtained by assuming cylindrical symmetry, which is justified in
the case of a relatively small pay-zone thickness. Calculations performed for
formations with larger pay-zone thicknesses by using an analogous spherical model
yield Q1/Q ≈ 4. Substituting d = 0.001D, P2 − P1 = 20 atm, r1 = 20 cm, r2 =
4000 cm, and µ2 = 0.166P into 2.20 yields
Q1 = 3030 cm3/s = 262m3/day (2.23)
For the uniform temperature rise considered above, Q = 83 m3/day (see above).
As expected, the ratio 262/83 agrees with 2.22 [4]. The optimal temperature
distribution found here is of interest with regard to low-porosity oil-bearing for-
mations, where the injected heat is mostly absorbed by the solid rock matrix and
is therefore retained for a relatively long time. In the case of a highly porous
rock, the temperature distribution rapidly decays as the heated oil is extracted.
2.6 Relaxation of a Thermally Stimulated Reser-
voir and Dependence of Well Productivity
on the Cooling Regime
A thermally stimulated pay zone (or a region including the pay zone and sur-
rounding barren rock) cools down via two mechanisms of heat transfer: heat
conduction and thermal convection. The former means diffusion of heat to the
periphery. The latter means heat transfer by oil percolating through the non-
uniformly heated formation to a producing well. Oil that flows to the wellbore
from the unheated periphery draws heat from the stimulated zone and is then
extracted. A numerical technique has been developed for simulating these pro-
cesses, which can be used to calculate the cooldown time for a thermally stimu-
lated pay for given initial parameters, including the amount of heat injected into
the formation, the heated volume, the specific heat and heat conductivity of the
13
2.6 Relaxation of a Thermally Stimulated Reservoir and Dependenceof Well Productivity on the Cooling Regime
oil-bearing rock, the temperature-dependent oil viscosity, the starting productiv-
ity of the well that has been thermally and hydraulically stimulated by using our
technology, and other parameters.
In addition to detailed computations, simple approximate formulae to esti-
mate the relation between well productivity, cooldown time, heated-volume size,
and other characteristics were used. As examples, the cooldown times for shut-in
and producing wells were estimated. In the case of a shut-in well, the cooling is
controlled by conductive heat transfer.
2.6.1 Conductive Cooling of a Thermally Stimulated Pay
Zone
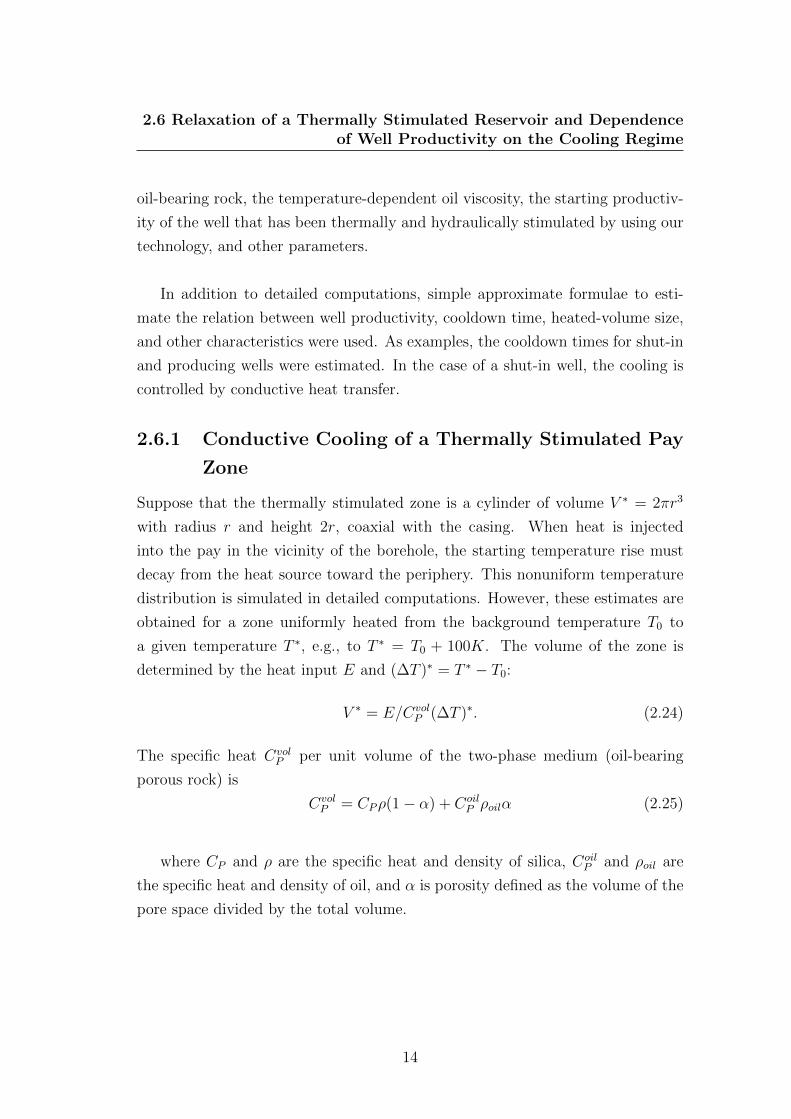
Suppose that the thermally stimulated zone is a cylinder of volume V ∗ = 2πr3
with radius r and height 2r, coaxial with the casing. When heat is injected
into the pay in the vicinity of the borehole, the starting temperature rise must
decay from the heat source toward the periphery. This nonuniform temperature
distribution is simulated in detailed computations. However, these estimates are
obtained for a zone uniformly heated from the background temperature T0 to
a given temperature T ∗, e.g., to T ∗ = T0 + 100K. The volume of the zone is
determined by the heat input E and (∆T )∗ = T ∗ − T0:
V ∗ = E/CvolP (∆T )∗. (2.24)
The specific heat CvolP per unit volume of the two-phase medium (oil-bearing
porous rock) is
CvolP = CPρ(1 − α) + Coil
P ρoilα (2.25)
where CP and ρ are the specific heat and density of silica, CoilP and ρoil are
the specific heat and density of oil, and α is porosity defined as the volume of the
pore space divided by the total volume.
14

2.6 Relaxation of a Thermally Stimulated Reservoir and Dependenceof Well Productivity on the Cooling Regime
For a shut-in well, the time τ1/2 required for the temperature rise to drop from
∆T to ∆T/2 (e.g., from 100 K to 50 K) can be approximately expressed as
τ1/2 = 0.132/3r2/χ (2.26)
where χ is thermal diffusivity, i.e., the ratio of heat conductivity κ of the rock
to its volumetric specific heat at constant pressure (density multiplied by specific
heat at constant pressure). To evaluate the cooldown time, the value of χ in
2.26 can be taken for porous silica of density 2.22 g/cm3. At 300 and 500 K, the
thermal conductivity of dense sandstone is close to that of polycrystalline silica:
1.36 and 1.63 W/mK, respectively [3]. Using linear interpolation, the thermal
conductivity was shown to be 1.5 W/mK at 400 K. For porous silica, we have
κp = κρp/ρ. The specific heat of silica at 400 K is 53.4 J/molK. Hence, its thermal
diffusivity at 400 K is
χ = κp/ρpCP = κ/ρCP ≈ 6.4 × 10⁻³cm2/s (2.27)
(Note that thermal diffusivity is independent of porosity in the low-porosity limit,
since both thermal conductivity and volumetric specific heat are proportional to
density.) Combining 2.26 with 2.27 , we obtain
τ1/2 ≈ 3.76r2m days (2.28)
where rm is the radius r measured in meters, For rm = 5 and 10, formula 2.28
yields 94 and 380 days, respectively.
2.6.2 Convective Cooling of a Thermally Stimulated Pay
Zone
Before the conductive and convective contributions to heat transfer were com-
pared, the cooldown time was estimated by neglecting the former. In the case
of a quasi-steady Darcy flux, the rate of extraction of heated oil equals the flow
rate of unheated oil coming from the periphery, and the mean temperature of the
15

2.6 Relaxation of a Thermally Stimulated Reservoir and Dependenceof Well Productivity on the Cooling Regime
heated zone satisfies the energy balance equation
CoilP (T − T0)dM/dt = V ∗Cvol
P dT/dt (2.29)
which entails
dT/(T − T0) = [CoilP /V ∗Cvol
P ]dM (2.30)
where M is the mass of oil extracted over the time elapsed after stimulation.
Integrating Eq. 2.30 subject to the initial condition T = T ∗ at t = 0,
T − T0 = (∆T )∗exp(−λM) (2.31)
λ = CoilP /V ∗Cvol
P (2.32)
Suppose that the temperature rise in the pay zone has dropped by half: T −T0 =
(∆T )∗/2. Then, it follows from 2.31 that
M = ln2/λ (2.33)
Substituting the values of specific heat and density for silica and oil [3], CP =
0.89J/gK, CoilP = 2.10J/gK, ρ = 2.65g/cm3, and ρoil = 0.73 − 0.94g/cm3, into
2.25 and 2.32 and setting α = 0.2 and V ∗ = 2πr3,
1/λ = (6.56 − 6.83)r3m tonnes
Then, 2.33 yields
M = (4.5 − 4.7)r3m tonnes (2.34)
For oil with an average density of 0.8 g/cm3,
M = 4.6r3m tonnes (2.35)
For rm = 5 and 10,
M = 575 tonnes and 4600 tonnes (2.36)
16
2.6 Relaxation of a Thermally Stimulated Reservoir and Dependenceof Well Productivity on the Cooling Regime
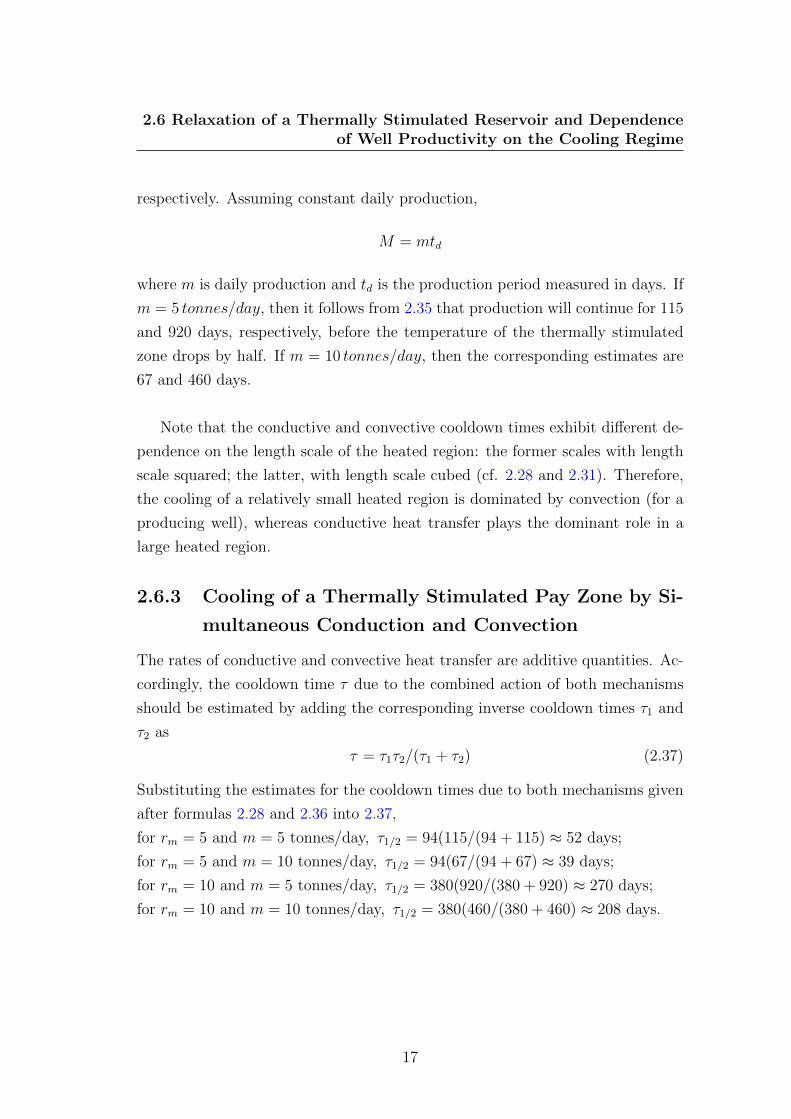
respectively. Assuming constant daily production,
M = mtd
where m is daily production and td is the production period measured in days. If
m = 5 tonnes/day, then it follows from 2.35 that production will continue for 115
and 920 days, respectively, before the temperature of the thermally stimulated
zone drops by half. If m = 10 tonnes/day, then the corresponding estimates are
67 and 460 days.
Note that the conductive and convective cooldown times exhibit different de-
pendence on the length scale of the heated region: the former scales with length
scale squared; the latter, with length scale cubed (cf. 2.28 and 2.31). Therefore,
the cooling of a relatively small heated region is dominated by convection (for a
producing well), whereas conductive heat transfer plays the dominant role in a
large heated region.
2.6.3 Cooling of a Thermally Stimulated Pay Zone by Si-
multaneous Conduction and Convection
The rates of conductive and convective heat transfer are additive quantities. Ac-
cordingly, the cooldown time τ due to the combined action of both mechanisms
should be estimated by adding the corresponding inverse cooldown times τ1 and
τ2 as
τ = τ1τ2/(τ1 + τ2) (2.37)
Substituting the estimates for the cooldown times due to both mechanisms given
after formulas 2.28 and 2.36 into 2.37,
for rm = 5 and m = 5 tonnes/day, τ1/2 = 94(115/(94 + 115) ≈ 52 days;
for rm = 5 and m = 10 tonnes/day, τ1/2 = 94(67/(94 + 67) ≈ 39 days;
for rm = 10 and m = 5 tonnes/day, τ1/2 = 380(920/(380 + 920) ≈ 270 days;
for rm = 10 and m = 10 tonnes/day, τ1/2 = 380(460/(380 + 460) ≈ 208 days.
17

2.7 Analysis and Conclusions
2.7 Analysis and Conclusions
What are the prospects of increasing the flow of the conventional oil after warming
up of the depleted wells? In Russia such oilfields retain up to 50% of the original
deposits in the productive layer, in the USA the fraction is approximately one
third. The treatment outlined above analyzes the stimulation of oil output after
warming up the well vicinity using vapor or the mixture of vapor and heated gas
(CO2). This heated mixture (produced by the kerosene or diesel-run generator)
can be pumped right from the surface into the oil wells with the depth up to
700-800 meters. In this respect the output rate of useful energy is approximately
50%. This implies that warming up the layer takes half of the heat produced in
the generator compression chamber. In order to ensure heat delivery at greater
depth it is necessary to use gas and vapor mixture generator dropping it into the
oil well. In this case the output can reach 80-90%.
Take as an example an oil well with the primary flow rate prior to warming
up amounting to 0.3–0.6 tons per day, situated in a conventional depleted oilfield
with a layer up to 10–20 meters, the original temperature 40 ℃ and the porosity
20%.
A non-sophisticated calculation was been made here using the numbers from
[3] presupposing the rate of pore oil-infillement amounting to 40%. The results
indicated that in this hypothetical case after warming up the layer to 140 ℃ the
oil viscosity is reduced 15–25–fold.
The equality
Q = 2πLr1d(P2 − P1)/[µ1(r2 − r1)] (2.14)
where
P2 − P1 = 20atm (2.38)
refers to the conditions of very depleted well.
18

2.7 Analysis and Conclusions
Since at the same time the layer permeability and pressure stay approximately
the same, the oil extraction process will become 15–25 times as fast and the pe-
riod of time the oilfield needs maintaining is thus 15–25 times shorter .
During long periods of oil extraction from depleted oilfields the oil flow in the
well is hampered by the more viscous hydrocarbons accumulating at the entrance
of the well. In the process of warming this mass up to 100-120 ℃ and obliterat-
ing the braking zone, maintaining the oil well may become commercially viable
simply through periodic heating in this fashion. A simplified calculation, taken
in part from [2, 3] is below.
The layer thermal capacity (sandstone) is recognized equal to 0.2 large calo-
rie per kg/degree, oil thermal capacity 0.52 Kcalkg−1/℃ [3]. The rock thermal
capacity (92%) with oil (8%) amounts in this case to 0.24 Kcalkg−1/℃. The
diesel calorific value is 10000 Kcalkg−1/℃. The sandstone density equals to 2.6
kg/liter. It is presupposed that a layer part having a cylindrical form with the
diameter and the height of 20 meters, the volume of 6248 m3 and the mass of
16245 tons situated in the vicinity of the well was heated. The whole process
consumes 64 tons of fuel with the output of 50% and 40 tons with the one of
80%. Under the condition of the heated braking zone and oil viscosity reduced
by 15-25 times the flow can be expected to increase from 0.3–0.6 to 5–10 tons
per day. According to [3] the temperature reduction from 140 ℃ to 90 ℃ during
208–270 days leads to the flow decreasing by 2–3 times. The second and next
heating cycles will consume up to 32 tons of diesel fuel if pumped from the surface
(with the output of 50%) and 20 tons if pumped from the generator dropped into
the well (with the entailing output of 80%).
In the process of every cooling cycle from 140 to 90 ℃ the quantity of the
additional oil can be expected to amount to 900–1350 tons. In this respect the
diesel fuel expenses during the first (40–64 tons) and the entailing heating (20-
32 tons) are quite acceptable. The price correlation between the diesel fuel and
crude oil is approximately 2.5, which means that the fuel expenses for the layer
19

2.7 Analysis and Conclusions
heating lie within 6–15% of the additional oil cost.
In summary, the following observations need emphasizing: in the process of
warming of the productive layer rock in the oil well vicinity the oil extraction
in the depleted oilfields is highly likely to become profitable, even more so than
the commercially lucrative bitumen extraction with the burning of 20% of the
extracted hydrocarbons.
Calculations were verified against the results of thermochemical treatments
of oil-bearing rock samples in laboratory tests. In field tests, binary mixtures
of aqueous solutions supplied into the borehole through two separate ducts were
used. The solutions mixed and reacted exothermally as they entered the sur-
rounding region. Four wells were treated by this method in Perm oil fields. The
highest increase in the permeability of a thermally stimulated pay (by a factor
of 50) was attained for heavy oil (0.96 g/cm3) by treating well no. 9043 of the
Shumovskoe field in 2004. (Permeability was estimated from the water imbibition
rate at driving pressures of 120-140 atm measured with a pump pressure gauge.)
In summary, both laboratory and field tests have shown that a temperature rise
of 100 degrees can lead to an increase in productivity by about one to two orders
of magnitude due to reduction of oil viscosity (see Table 2.1).
The most promising thermal stimulation techniques may provide a basis for
drastic improvement in production schemes not only for highly viscous oil, but
also for conventional oils. The results of work on wells treated with chemically
reacting mixtures [4], supported by laboratory test results, demonstrate that
thermal stimulation of conventional oil reservoirs can be made cost-effective if a
reservoir region of radius 15–20 m around the well is heated one to two times per
year.
The cost of a treatment by large-scale thermal stimulation can be estimated
by noting that the oil-bearing rock mass to be heated around the well must be
at least 15,000–20,000 tonnes. In the case of successful periodic thermal stimula-
tion, the production period can continue for 2 to 3 years for an average reservoir.
20

2.7 Analysis and Conclusions
Oil field re-gion (Perm)
Well type(no.)
Quantitymeasured(units)
Rate beforetreatment(date)
Rate aftertreatment(date)
Kurbatovskoe production(169)
daily produc-tion (tonnes)
0.7 (Jun-04) 4.2–5.0 (lateOct-04)
Logovskoe production(140)
daily produc-tion (tonnes)
0.6 (Jun-04) 4.4 (Nov-04)
Un’vinskoewater–flooding(250)
daily waterinflux (m3)
14.8 (Aug-04) 67 (Nov-04)
from 8–12 m3 (Nov-03) to 172 m3 (Dec-04) and to 88 m3 (Apr-04)
Table 2.1: Results of field tests of prototype TGDF technology in Perm oilfields(Certificate of Test Results, Ural–Dizain, Perm, 3 Nov 2004).
(Recall thermal stimulation of bitumen-laden sands in Canada, which resulted in
cost-effective production rates.)
A thermally stimulated reservoir will produce more oil, as compared to an
unheated one, for at least three reasons:
A. The viscosity of the extracted oil is drastically reduced.
B. Asphaltene, paraffin, and other deposits impeding the influx of oil are much
less likely to form around the drawdown cone.
C. Gas release from the oil contained in a large heated rock mass gives rise to
a higher reservoir pressure, increasing the production rate.
Finally, it is to be noted that the present analysis of optimal temperature
distribution can also be helpful when the energy E is injected into the formation
through only one well. In this case, a near-optimum temperature distribution
analogous to 2.19 can be created by controlling the rate of heat injection.
E. N. Aleksandrov∗
M. Goodwin∗∗ and
N. M. Kuznetsov∗∗∗
21
CHAPTER 3
Experimental Results & Discussion I:
Initial Binary Chemical Approach
3.1 Introduction
The initial approach taken on this project was to use a chemical generator to
create the TDGF process. This would be used in tandem with hydraulic and
vibration processes to maximise oil recovery from depleted wells.
The Chemical Generator, as distinct from propellant-based gas generators
was envisaged to operate in continuous mode, in the same manner as a torpedo
or rocket engine. The generator will be employed to stimulate the use of a pay
zone in a well as a reaction chamber fed through a chemicals supply system.
With such a generator, further improvement of stimulation efficiency could be
achieved by combining the advantages of hydraulic and thermo chemical frac-
turing schemes (high power, continuous mode of operation, and high efficiency)
in a single engine-like device fed with fuel and oxidizer through separate supply
lines. Unlike automotive, aircraft, or marine engines, the device must produce a
jet of burned gas at an ambient pressure of up to hundreds of atmospheres. As a
22

3.2 TGDF summary
result, the useful power output can be increased by up to ten times as compared
to existing stimulation devices.
A borehole-mounted gas jet generator was designed on analogies to the tor-
pedo engine that can produce the required effect at a depth of up to 2.5 km
(see Fig. 3.1). The borehole-mounted gas jet generator was expected to be par-
ticularly useful as a source of the high-temperature gas required to stimulate
production of conventional, heavy and even bitumen-rich oils, which are key re-
sources abundant in North America.
The generator was intended to be multipurpose. While working on low power
in a pulse mode, by pressurizing and depressurizing a small bubble of the gas
which is situated in a liquid opposite the seam, it may be used for diagnostics of
injectivity (porosity) of separate layers and seams. At medium power, it would
appear to be suitable for cracking research of the viscous oil in a well, for exam-
ple, for the reducing the proportion of sand carried out from layers with bitumen
heated oil on fields where such a problem exists.
3.2 TGDF summary
The core TDGF technology involves the following key processes:
• The first portion of the high-temperature foam penetrates the pay, driven
by a pressure head much lower than required to inject an inert fluid at am-
bient temperature.
• The pay is fractured and heated by the large amount of gas produced in a
continuing intense reaction.
23

3.2 TGDF summary
• The inflow of oil into the borehole from the cracks treated with a chemically
active gas increases as the oil viscosity decreases and permeability increases.
• The increase in permeability must be combined with quick extraction of oil
before the heated pay cools down. Therefore, special post-treatment and
operational standards must be developed and strictly followed.
TDGF technology is optimally implemented in a multistage treatment proce-
dure:
1. At the vibration–treatment (VT) stage, 100 to 200 kg of heated gas are in-
jected into the pay by means of vibrational combustion, with a frequency of
5–19 kHz and an amplitude of 1–5 bar, to create initial cracks and facilitate
subsequent gas injection;
2. At the pulse–treatment (PT) stage, up to a ton of hot gas is injected into
the pay to expand the vibration-induced cracks;
3. At the cyclic–treatment (CT) stage, up to several tens of tons of high-
temperature foaming reacting agents may be injected into the pay at a
high pressure. A very large increase in the permeability of a layer was no-
ticed when it was heated on a field with heavy oil.
Working at deposits with normal levels of oil, heating up a layer and remov-
ing the heated oil around the well before it cooled made it possible to increase
the permeability of the productive layer and oil–production many times over in
comparison with the initial permeability of the layer and initial productivity of
the well. All tests before the start of this project were on wells on very depleted
fields where the layer pressure was not more than 50–60% of the initial pressure
24

3.3 Chemical generator design and prototype
and the average speed of extraction was 1–3 tons a day.
Usually on such fields the period of extraction of additional oil after a stimula-
tion of a well lasts not more than a year and the cost of the next annual additive,
as a rule appears to be much less than $100,000. The average treatment costs
estimated for four wells in depleted reservoirs were found to be a factor of 1.5
lower than the cost of the additional oil produced during the year that followed
after treatment (see Table 2.1, Chapter 2)).
Heating up wells with a small debit for processing by using cheap chemicals
is more profitable than steaming: an internal combustion engine working at the
bottom of the well will have considerably higher efficiency than tools producing
steam from the surface. This also opens the possibility for the removal of heavy
oil from deeper wells where the effectiveness of steam procedures is greatly di-
minished.
3.3 Chemical generator design and prototype
The requirements for the chemical generator were as follows:
1. Reactor
2. Device to mix reagents.
3. Reservoir to receive products of the reaction.
4. Device to measure the amount and speed of receiving solutions through the
first channel.
5. Device to measure the amount and speed of receiving solutions through the
second channel.
6. Dispenser (regulator) of the pressure in the supply reagents channels.
25

3.3 Chemical generator design and prototype
Figure 3.1: Schematic diagram of the proposed chemical generator design. Note:Design of generator prototype presented Patent No 36855 from 27.03.04 (priorityfrom 05.11.03), ), Facility for treatment of pay zone,authors: E.N. Aleksandrov,V.V. Dozhdev, E.M. Timohin, patent owners E.N. Aleksandrov, V.V. Dozhdev,E.M. Timohin.
Technical ratings and parameters:1. Fuel: liquid2. Fuel supply: pumping3. Total fuel consumption rate: 0.8–1.0 kg/s4. Working pressure: 6–30 MPa5. Operation time: up to 2 hours
No. Item Qty Comments1 Casing2 Injection unit 1 Zone I3 Nozzle unit 14 Tubular rod 1 Zone II and III5 Bluff-body flameholder-thrown-off 36 Blank flange 17 Thermal insulation 48 Joint 19 Ignition unit 1
Figure 3.2: Main units and parts
A prototype machine with manually controlled chemical supply valves was
constructed and new FOM chemicals were developed for it (Figs 3.1, 3.2). This
generator was used as a prototype rig as a 1000:1 scale prototype of the well gen-
erator by volumetric flow rate. It was used to test the delivery of binary chemical
26

3.3 Chemical generator design and prototype
mixtures through separate flow channels. The chemical supply system seal was
checked using the testing rig at a temperature of 100 ℃ and under changing
pressure up to 500 atmospheres at the entrance gate, under the control of the
chemists D. Lemenovski and G. Melik-Gaikazov and the technologists V. Dojdev
and A. Polovnev.
The first test of such machine with manually controlled chemicals supply sys-
tem applied to the injection of binary chemical mixes into a working well was
done in December, 2003 on a field with heavy oil in the Perm area, Shumovskoe
oil field.The reaction zone was heated to not higher than 200 ℃ to preserve the
concrete stone fixing external pipe that was required by local technologists. Di-
luted binary chemical mixes were used. Speed of reception by the layer of liquids,
pumped into the well, in process of increasing of speed of reaction and heating up
at constant pressure of the liquid at the exit from the pump, increased from 0.078
L/s up to 4 L/s. Therefore the permeability speed of the heated solution into
the heated layer during the heating process increased fifty times. After pumping
about 2 tons of binary mixes and after the the chemical reaction inside the well
was depleted, the production schedule was halted because of an unforeseen side
effect: The heated part of the layer cooled before the thickest oil that gathered
around the well was taken out, as was intially desired. The permeability of the
cooled layer returned to the initial level.
This technology was subsequently applied to stimulate three wells in depleted
conventional-oil reservoirs, which resulted in higher production rate that lasted
for 6 to 12 months (see Table 2.1, Chapter 2)). The big difference in permeability
of a layer between the heated and cooled states was promising.
This thermal approach using cheap binary chemical mixes appears to be of use
in processing not only depleted reservoirs, but also for newly operational reser-
voirs. The TDGF approach has universal applicability because it combines a
passive method of increasing extraction (heating) with an active physical method
of stimulation such as hydraulic fracturing. Furthermore, we anticipate that its
27

3.4 Optimizing FOM
effectiveness can be considerably increased from current levels.
3.4 Optimizing FOM
Relying on the experience of our commercial partners in developing rocket and
torpedo propellants, a new FOM composition well suited for utilization in oil
wells was proposed. The proposed FOM does not explode at any percentage of
dilution with water. The process can be reliably initiated at FOM water concen-
trations ranging from 0 to 50%. In other words, the interval of admissible water
concentration has been increased fivefold. However, there were difficulties to be
resolved connected with additional dilution of chemicals, pumped into a well with
a fluid (including additional water), leaking from around well layers.
New primers, which produce hydrogen when reacting with water, were also de-
veloped. These primers initiate the treatment process by means of a fast exother-
mic reaction developing upon their contact with the FOM. The reaction starts
immediately after the primer-containing ampoules immersed in the FOM are bro-
ken and proceeds until the primer is consumed completely. The water content is
not an important factor in this scheme, because the primer reacts with both water
and FOM. As a result, the reliability of treatment has been significantly improved.
3.5 Preparation of recommended fuel-oxidizer
mixture compositions based on theoretical
and numerical analysis
To create the diagnostic system and to be able to make prognostic results of
processing of the productive layer at depths up to 5 km, a test rig was calculated,
developed, designed and manufactured. The scheme of a new generator of gases
that are created during the reaction of binary mixtures is shown in Figure 3.3.
Such generator is able to work under the pressure up to 500 atm. The generator
28

3.5 Preparation of recommended fuel-oxidizer mixture compositionsbased on theoretical and numerical analysis
Figure 3.3: Schematic of the revised generator. The picture shows schemati-cally: (1) Reactor, (2) Space to receive the reaction products, (3) Device to mixthe reagents, (4) Device to measure the amount and speed of supplied solutionsthrough the first channel, (5) Device to measure the amount and speed of sup-plied solutions through the second channel, (6) Distributor of the pressure insidethe channels of reagents supply, (7 -9) Faucets, (10) Container with compressedgas (nitrogen)
29

3.5 Preparation of recommended fuel-oxidizer mixture compositionsbased on theoretical and numerical analysis
was installed in an armor chamber of the Institute of biochemical physics of
Russian academy of science. The picture shows schematically: (1) Reactor, (2)
Space to receive the reaction products, (3) Device to mix the reagents, (4) Device
to measure the amount and speed of supplied solutions through the first channel,
(5) Device to measure the amount and speed of supplied solutions through the
second channel, (6) Distributor of the pressure inside the channels of reagents
supply, (7-9) Faucets, (10) Container with compressed gas (nitrogen).
Evaluation tests with binary mixtures were made under the pressure of 450
atm in the working chamber and they showed that at such high pressures the
gas bubbles in pores and cracks, at slow gas fluids, directed into the depth of
the rock, partly slow down the movements of the FOM reaction because the gas
present in the pores prevents the binary solutions from contacting and initiating
the reaction.
It is possible create a FOM capable of a variable-level combustion. During
demonstrations in Saratov region in August 2001, a 120 meters deep column of
solution of such FOM, placed at a depth of 4 km, was ignited from below and
burned down during 105 seconds. As this has not been reliably achieved for
patented chemical mixtures, this research was hoped to bring an improvement in
this particular application of FOM.
3.5.1 Measurement of reaction rates and analysis of regimes
of reaction in high-pressure chemical reactor and
test facility
As it was necessary to check the effectiveness of new chemical additions that would
raise the effectiveness of binary mixtures in the test rig, several experiments with
the binary mixtures were conducted in the laboratory of E. Aleksandrov:
1. Mono-ethanolamine-nitrate + solution of sodium borohydride.
2. ammonium nitrate + solution of sodium borohydride.
3. ammonium nitrate + solution of sodium nitrite.
30

3.5 Preparation of recommended fuel-oxidizer mixture compositionsbased on theoretical and numerical analysis
4. Mono-ethanolamine-nitrate + solution of sodium nitrite.
Other experiments utilised equipment from laboratories of E. Aleksandrov
and D. Lemenovski.
Equipment:
• A resonance fluorescence spectrometer with high near and vacuum UV sen-
sitivity (Russian made, $20,000).
• A high-pressure chamber for testing rock and oil samples fed through a
chemical supply system and equipped with high-speed pressure and tem-
perature measurement systems (Made in the USSR, approx. $420,000).
• A Hitachi IR spectrophotometer ($82,000).
3.5.2 Parameters measured
The parameters measured during these experiments were: Temperature (T ), heat
(∆T ), initial permeability of the sample and its permeability after its treatment
with chemicals.
The relative permeability of the sample is equal to ratio of permeability of the
sample after processing (ΠE) to permeability of the sample before the processing
(Π0):
ΠE/Π0 = t0/te. (3.1)
3.5.3 Description of the chamber and conditions of the
experiments.
The pressure chamber used in these experiments is shown in Figure 3.4.
1. Each sample was formed as a cylinder with sides 60 × 60× 100 mm. A hole
with diameter 10 mm and 75 mm deep was drilled in the center from the
side 60 × 60 of the sample.
31

3.5 Preparation of recommended fuel-oxidizer mixture compositionsbased on theoretical and numerical analysis
Figure 3.4: Schematic of the testing chamber.
2. The device to supply reagents consisted from two coaxial tubes of different
diameters made from stainless steel. A tube with the diameter 10 mm (wall
1 mm), having inside tube diameter 5 mm, was inserted into the 10 mm hole
that was made in the sample into the depth of 25 mm and then was sealed
with a heat-resistant silicone sealant, thus creating two separate channels
to supply reagents to the sample.
3. The outside tube supplied water (0.5 L) and a water solution of the activator
of the reaction that created nitric acid (0.5 L). Then the FOM and the liquid
initiator of the reaction were supplied simultaneously into the sample that
was impregnated with the activator. A fast thermocouple was inserted from
the outside side of the sample to measure its temperature. The work was
done under chemical “traction” pumping out gas products of the reaction.
The size of the sample vessel was increased from 1.2 up to 3 L.
4. The FOM used was mono-ethanolamine-nitrate; the activator was either an
aqueous solution of sodium borohydride or of sodium nitrite.
32

3.5 Preparation of recommended fuel-oxidizer mixture compositionsbased on theoretical and numerical analysis
5. The heating and permeability of the sample was measured before and after
its processing, in the presence and absence of the nitric acid activator. This
permitted comparison of the influence of different kinds of treatment on the
permeability of the sample.
• Water + oil + FOM and liquid initiator.
• Water + oil + activator + FOM and liquid initiator.
3.5.4 Experimental procedure
The experiments took took place at a temperature of 100 ℃ and a maximum
pressure of 2.5 atm. As the reaction chamber approached 90 ℃ the speed of
pumping was varied to hold the pressure below 2.5 atm. The pumping rate was
varied to keep the reaction chamber below 100 ℃.
When the pumping speed for the reagents was increased, with changing pres-
sure on the sample more than 4-5 atm, the sample lost its strength and began to
fall apart during its heating up to 120 ℃. To avoid this, the reagents were slowly
pumped at a constant change of the pressure 2.5 atm and heating not more than
100 ℃ .
3.5.5 Modelling well parameters
This pressure chamber was used to model of the well conditions at the depth of
2 km (pressure 200-205 atm., initial temperature 35 ℃).
The relative permeability of the sample is equal to the ratio of permeabil-
ity of the sample after the processing to its permeability before the processing
ΠE/Π0 = t0/tE., where t0 is time of bleeding from calibrated amount through a
sample of rare gas (argon) from overpressure 1 atm. till overpressure 0.2 atm. ;
tE is time of bleeding from calibrated one through a processed sample of rare gas
(argon) from overpressure 1 atm. till overpressure 0.2 atm.
33

3.6 Experimental analysis
A pressure chamber was used to study this reactions at high pressure, was
filled with argon up to the pressure of 100 atm. Sample processing occured as
described above. Bleeding of the products of the reaction from chamber after the
safety valve was closed happened at a pressure of 205 atm. It means that the
reaction was going at almost constant pressure, equal to hydrostatic one at the
entrance to the well of 2 km deep and filled with water.
This experiment implies that the permeability of the sample is almost invari-
ant going from atmospheric pressure to that of a well at 2 km depth.
3.6 Experimental analysis
Experiments were conducted to check the effectiveness of the FOM reaction at
different pressures. The experimental procedures were as follows: a sample of oil-
bearing rock was exposed to sulphuric or nitric acids, with appropriate additives.
The maximum temperature (Tmax) for the subsequent reaction was measured,
and used to evaluate the degree of chemical transformation which had occurred.
These experiments were used to determine the optimal combination of acid and
oxidizer, and the optimal length of contact time between the FOM and the oil to
maximise the temperature increase.
The rock samples were shaped as cylinders with diameter of 5.5 cm and height
of 6 cm. In the center of the cylinder drilled a “cup” with diameter of 25 mm and
5cm deep was drilled in which the acid/FOM mixture was introduced. The acid
went into the sample through a press-fit tube with external diameter of 24.5 mm
and with walls 1 mm thick, made from non-corrosive steel. The reactor capacity
was 1 L and the size of each sandstone rock sample was 120 cm3, with a mass of
310 g. A mass of oil equivalent to 22 g was pumped into the reaction chamber
and the temperature increase measured with a thermocouple. After leaving the
sample, the chemical mixture entered a draft tube of inside diameter 2 cm and
length 120 cm. The remainder of the liquid then entered a waste tank. Experi-
ments were conducted at room temperature (22 ℃). The results are presented in
34

3.6 Experimental analysis
sulphuric acid nitric acidPressure(atm.)
transformation(%)
Tmax(℃) transformation(%)
Tmax(℃)
1 22 35 57 7810 20 43 68 8850 20 36.5 65 95.580 20 47 77a 87a
800 20 37 71a 91a
Table 3.1: Results of reaction of acid/FOM mixtures with rock-oil samples atvarying pressures. The degree of transformation of the oil mixture (%) and themaximum temperature reached by the reaction (Tmax, ℃) are given. The massof acid mixture added to the sample in each case was 40 g. The contact timebetween the FOM fix and the oil was 10 minutes, except for a, where the reactiontime was 5 minutes.
Table 3.1.
The larger Tmax for the nitric acid samples corresponded to a high degree of
transformation of those oil samples, implying an effective reaction, especially at
shorter contact times. Carbon dioxide gas and water were liberated as waste prod-
ucts, with hydrogen gas (4.5%) and carbon monoxide (6%) as minor by-products.
The smaller degree of transformation of the sulphuric acid samples is thought
to be due to the build up of an acidic sludge, which acted as a cork and prevented
dispersion of the FOM mixture through the rock sample.
These experiments were repeated using a sand trap within the “cup” to slow
the dispersion speed of the chemical mixture. The results of these experiments
are shown in Table 3.2, marked with a, as against the unimpeded samples.
The results in Table 3.2 demonstrate the reactivity of the nitric acid mixture
increases markedly when the sand trap is used to slow down the rate of disper-
sion. However, such an effect is not seen using the sulphuric acid mixture.
35

3.7 Conclusions
Acid Pressure(atm.)
transformation(%)
Tmax
(℃)sulphuric 1 20.5 42.5sulphurica 1 23 45.5sulphuric 80 17.0 34.7nitric 1 53.5 57nitrica 1 67.5 77.5nitric 80 79.7 93.3
Table 3.2: Further optimisation of acid/FOM mixtures delivery with rock-oilsamples. The amount of acid sample introduced into the reaction chamber was50 g in each case. The contact time between reagents and oil sample was 10minutes. Samples marked with a were impeded with a sand plug to slow downtheir dispersion into the rock-oil sample.
The implication of this finding is that the nitric acid mixture will have sub-
stantially greater effect on the TDGF procedure when its application is preceded
by applying pressure to the oil layer, in order to increase the network of cracks
in the layer for the acid mixture to disperse into.
3.7 Conclusions
The initial results of design of both the chemical generator and the optimising
FOM chemicals were promising. However, at this stage in the project the eco-
nomic advantages of using another generator method became overwhelmingly
apparent. For this reason, the main focus of the project moved from using a
chemical generator approach to TGDF technology to a diesel-fuelled, gas-vapor
generator solution to TGDF. This is covered in the next chapter.
36

CHAPTER 4
Experimental Results & Discussion II:
Generator Approach
4.1 Introduction
After commencing work on the binary chemical solution outlined in the previous
chapter, consultation with our Russian colleagues, particularly Professor Aleksan-
drov led to the alterion of the final stage of the project from a chemical solution
to a diesel-fueled generator solution. This is a particularly attractive move from
a cost perspective.
The Russian team had previous experience with building rocket engines and
similar gas generators. The revised design for this generator focused upon the
ability for a machine to operate on diesel fuel to a depth of 2 km, producing
approximately 2 tons of hot gas per hour. There were expected to be numerous
technical hurdles to this approach, not least being the construction of a dual
cooling system for the generator. This would be expected to both maintain the
generator operating temperature within acceptable levels, and also provide gas
and steam to the well. Notwithstanding these issues, it was anticipated that a
37

4.1 Introduction
gas generator would be markedly cheaper than a binary chemical approach to
providing the third stage of the TGDF technology.
The rationale behind this change, notwithstanding the alteration of the project
goals mid–project, is that the cheaper the process, the greater number of exist-
ing depleted wells will be candidates for the technology. Increasing this number
will have a very positive impact on domestic production as wells can be made to
produce longer and at a higher level than before.
The three stage technology was created in Russia, which was intended to be
improved and applied in the USA. The technology included the following:
• In the first stage, at the productive layer, up to 100 kg of powder checkers
was burnt in the vibro-wave mode that led to formation of a network of not
deep cracks around the well.
• In the second stage, at the productive layer, 1 ton of the mixture was burnt,
giving in an impulse pressure of 600-700 atm., therefore short cracks were
extended up to 10-20 meters.
• The third stage included pumping of binary mixtures in a big amount into
the layer, that is character for HFL, therefore cracks were extended and
enlarged.
The cost of the processing of a well in the US was assumed to be not more
than $50,000 because of more expensive chemicals in the US. Therefore, the pos-
sibility to replace more expensive chemicals by a cheaper fuel was investigated. A
test processing was made using the experiment rig, by heating the rock with hot
gases resulting from a jet rocket engine. Such methods can be used to heat the
layer, but the temperature of the gases that go out of the nozzle (1000 ℃) is too
high and risks oil pipes being blocked by coke build–up. Therefore methods of
reducing the gas temperature were investigated, principally by the introduction
of water into the hot gas stream at the exit from the nozzle. This temperature
38
4.1 Introduction
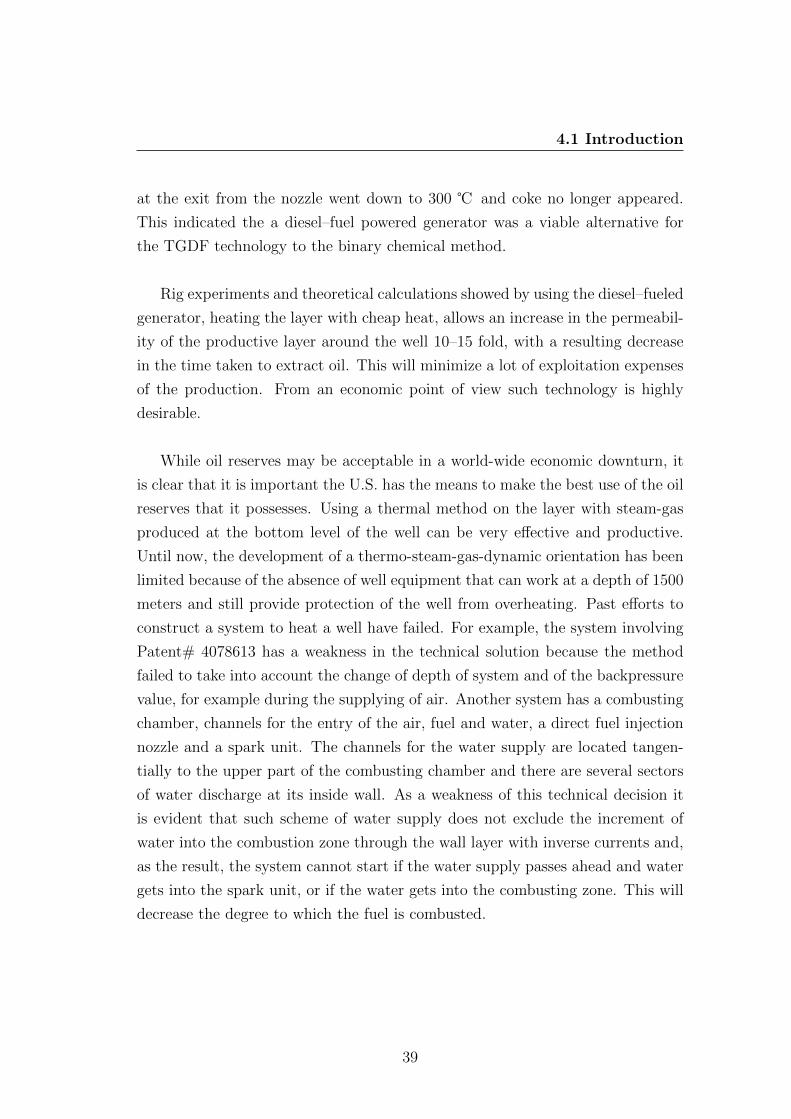
at the exit from the nozzle went down to 300 ℃ and coke no longer appeared.
This indicated the a diesel–fuel powered generator was a viable alternative for
the TGDF technology to the binary chemical method.
Rig experiments and theoretical calculations showed by using the diesel–fueled
generator, heating the layer with cheap heat, allows an increase in the permeabil-
ity of the productive layer around the well 10–15 fold, with a resulting decrease
in the time taken to extract oil. This will minimize a lot of exploitation expenses
of the production. From an economic point of view such technology is highly
desirable.
While oil reserves may be acceptable in a world-wide economic downturn, it
is clear that it is important the U.S. has the means to make the best use of the oil
reserves that it possesses. Using a thermal method on the layer with steam-gas
produced at the bottom level of the well can be very effective and productive.
Until now, the development of a thermo-steam-gas-dynamic orientation has been
limited because of the absence of well equipment that can work at a depth of 1500
meters and still provide protection of the well from overheating. Past efforts to
construct a system to heat a well have failed. For example, the system involving
Patent# 4078613 has a weakness in the technical solution because the method
failed to take into account the change of depth of system and of the backpressure
value, for example during the supplying of air. Another system has a combusting
chamber, channels for the entry of the air, fuel and water, a direct fuel injection
nozzle and a spark unit. The channels for the water supply are located tangen-
tially to the upper part of the combusting chamber and there are several sectors
of water discharge at its inside wall. As a weakness of this technical decision it
is evident that such scheme of water supply does not exclude the increment of
water into the combustion zone through the wall layer with inverse currents and,
as the result, the system cannot start if the water supply passes ahead and water
gets into the spark unit, or if the water gets into the combusting zone. This will
decrease the degree to which the fuel is combusted.
39

4.1 Introduction
An alternative design involves injecting a heated liquid fuel from a reservoir.
The fuel injecting point into the channel is located before a tangentially located
branch tube. This system of carburetion has problems because at rotational
movements a centrifugal force exists that causes discontinuity of the flow i.e.
heavier particles are throwing away into periphery and they do not get high plen-
itude of combustion of the fuel. There is another system for thermal influence at
the layer where a sprayer to inject water is executed as a circular nozzle created
with outside and inside jackets of outlet nozzle. The problem of this technical
proposal is that minimum open flow area of the cone part of the outlet nozzle has
very high temperature (more than 1500 ℃) because of high speed of combusting
products and small surface of heat interchange and as the result there is a prob-
lem of cooling it down.
The technical task of this project is to raise dependability of the start at any
depth of the well where the steam-gas generator will be immersed and to provide
safety and high combustion efficiency of fuel due to diminishing of influencing of
row of external and internal factors at the working process.
The problem can be solved using the following method. In the proposed vari-
ant of receiving the steam-gas through the well gas-generator at any depth of
its immersion, first air is supplied into the combusting chamber with a maxi-
mum consumption through the cooling tract of the combusting chamber and the
through the open flow area, that is manufactured with bottleneck of the current
for the maximum mode of work. Then supply the water and fuel are supplied
with maximum intensity of flow, at the same time fuel is injected into the section
with the critical parameters of the air flow at a condition that there is a certain
amount of water flow. After that the formatted air-fuel mixture is ingnited and
mix water with combusting products after combusting front in a low pressure
zone that is created by narrowing and enlarging the running section of the com-
busting chamber.
In this zone the air is supplied coaxially through the cooling tract of the com-
busting chamber first along the flow of combusting products, then against the
40

4.1 Introduction
flow of combusting products. The fuel is injected along the section axis with
the critical parameters of flow of air. After the part where the running section
narrows, the water mixes with combusting products on the surface of the inside
wall of the combusting chamber. Then water is introduced into the combusting
products with help of a falloff ring that is installed after the enlarged part of the
running section, at the same time as the running processes are controlled with
temperature and pressure detectors.
The body of the device comprises: a combusting chamber, an atomizer flanked
to the combusting chamber, a mixing chamber, an automatic ignition supply,
channels of water, air and fuel supply, measuring apparatuses. Constitutionally,
the combusting chamber is manufactured with three coaxial situated cylinders.
The cavity between outside and middle cylinders is intercommunicating with the
air supply. The cavity between the middle and inside cylinders is intercommu-
nicating with a cavity of the combusting chamber through an atomizer. The
atomizer is manufactured with a channel for the air flow like a diffuser with a
cylindrical nozzle for fuel supply, situated coaxially at the entrance part. At the
same time the channel of the fuel supply has a starting- cutoff valve with a sen-
sitive element. Cavities of the element are connected before and after throttling
element situated on the water supply channel. And the mixing chamber is man-
ufactured as consecutive located narrowing and enlarging channels, connected
between themselves forming a circular slot connected with the water supply and
it has a falloff ring, situated after an enlarging channel. At the same time, a part
of the body is manufactured as a cylindrical shell with releasable connections
along the generating line. Channels of supply of air, fuel and water, aggregate of
automatics, combusting chamber, mixing chamber, information block and an au-
tomatic ignition supply are placed on it. The split part of the body is connected
with the block of filters from one side and with the discharge jet from another side.
In essence, the design attempts to achieve what has not been achieved before.
A generator that can provide heat effectively into a well at any depth up to 1500
meters. There are still many engineers who are aware of the attempts to do such
things with the tests that were primarily done in the 1970s. And although a well
41

4.2 Gas-vapor generator (GVG): technical specifications
Ma Mdf Mw Tcp Tkg/s K
0.35a 0.024 0.14–0.27b 2360 423–673
Table 4.1: Parameters for basic operating mode. Ma is mass flow of the air(kg/s). Mdf is the mass flow of the diesel fuel (kg/s). Mw is the mass flow ofthe water (kg/s). Tcp is the temperature of the combusting products (K) and Tis the outgoing temperature at the exit from the nozzle (K). a using compressorCD-18/251. b Minimum and maximum values.
test has not yet been conducted,it is thought to be highly likely that this design
will resolve the problems mentioned earlier and allow the productive transfer of
heat into the zone with the resultant increased oil production.
4.2 Gas-vapor generator (GVG): technical spec-
ifications
. The work on this equipment was contracted to three separate companies. Prom-
etey was to build the generator and ChemAuto to construct the chemical supply
and cooling system. Geotechnica was to develop the operating and control equip-
ment for the generator.
The proposed well generator was intended to work in combination with a mo-
bile complex providing pressure up to 250 atm at the exit and providing 0.35 kg
of air per second. A calculation of parameters for the basic operation mode was
made, taking into account parameters of the compressor CD-18/251, expenditure
of the fuel at the excess air factor a = 1.0 and the temperature of the steam-gas
150 ℃and 400 ℃. Results of the calculations are in Table 4.1.
In this proposed scheme it is necessary to use a nozzle with a critical section
installed at the exit of the compressor, i.e. at the wellhead. Accuracy of mainte-
nance of pressure by the compressor ± 5 kg/cm2 at nominal value of 250kg/cm2
should provide change of the expenditure of air only ± 2%. The installation of
such a nozzle after the compressor is because it is necessary to exclude the influ-
42

4.2 Gas-vapor generator (GVG): technical specifications
ence (pipe PCP) on the start and the compressor could work at the basic mode.
If there is a regulator of the fuel expenditure, the change of difference in the fuel
highway from adjusting value in a range from 5 up to 50 kg/cm2 will change the
amount of fuel only for 10 - 15%. Going from the above-stated under the offered
scheme it is possible to provide factor of surplus of air in a limit a = 1.05−−1.25.
To start the machine automatically at big depths, it is necessary to raise the
pressure at the moment of water supply at the pay zone, prior to commencing
operation of the rig. (Calculations showed that, for example, at the depth of
1500 m it is necessary to raise the pressure up to 33.5 kg/cm2) During the basic
operating mode of the generator after the initial starting period, water flow rate
will be steadily increasing. As a result, the rate of change of the water pressure on
the wellhead needs to be automatically controlled after the start of the machine
(to keep the temperature of the gas in a planned range).
It is necessary also to install a packer at 100-200 m above the productive
layer so as not to effect the speed of submission of heated gas into the layer. For
maintenance of the specified expenditure of fuel at the start, the pressure at the
wellhead must also be considered, as well as the density of the fuel, resistance of
the fuel path and the depth of generator immersion.
4.2.1 Overall generator specifications
The design of the generator can be seen in Figures 4.1 & 4.2. Full technical
specifications of the generator design are below:
At the pay zone level it produces the hot steam-gas with specified parameters
of temperature and pressure.
The product works as a part of an energy-plant that contains:
1. Air compressor, CD-18/251 (in Russia) manufactured by “Compressor plant”,
Krasnodar.
43

4.2 Gas-vapor generator (GVG): technical specifications
Figure 4.1: Schematic of the Gas-Vapor Generator.
2. Fuel supply system with a pumping station and pipe-line with the diameter
of the open flow area not less than 8 mm.
3. Water supply system with a pumping station connected to the tube space
through the wellhead of the well.
4. Block of automatic control that guarantees the start, operating regime with
maintenance of the specified expenditure of the air from compressor and
turn off at the command of the operator if the pressure in the well rises
higher than an allowed value.
5. PCP with round-trip equipment.
44
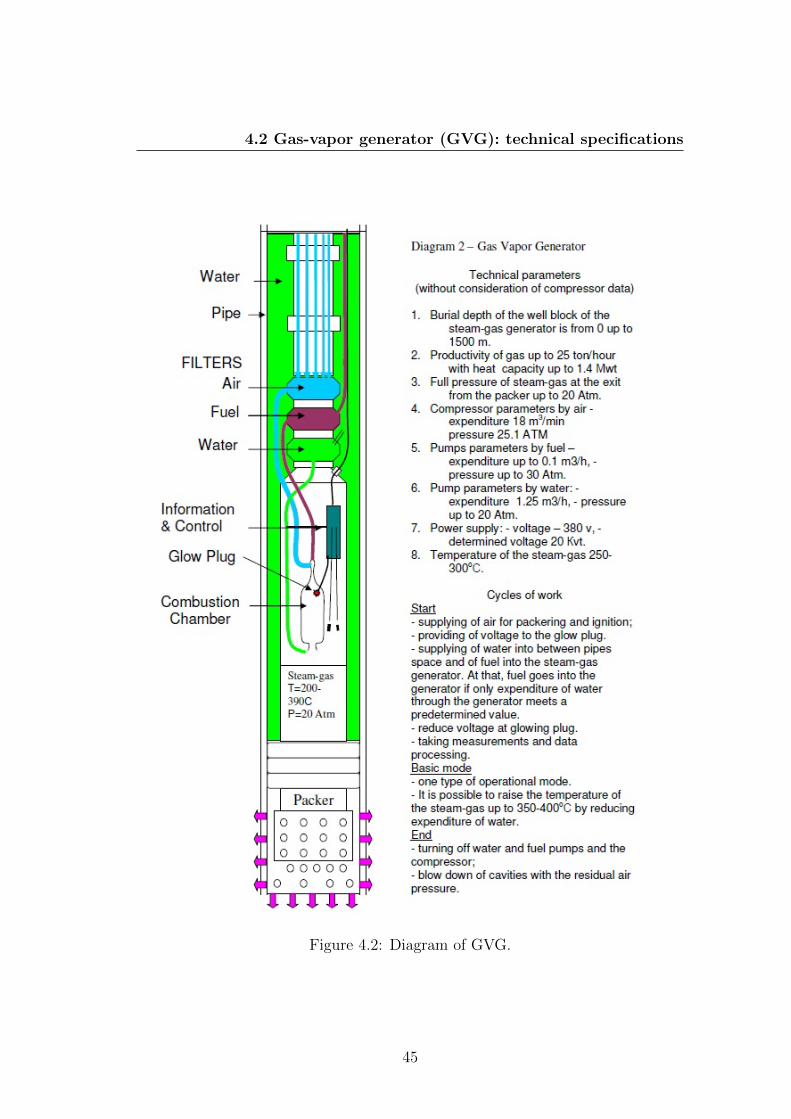
4.2 Gas-vapor generator (GVG): technical specifications
Figure 4.2: Diagram of GVG.
45

4.2 Gas-vapor generator (GVG): technical specifications
6. High temperature packer with a check valve at the exit.
7. Geophysical armored cable (four cords) with round-trip equipment.
• The product was intended for production of the steam-gas in the well at
any depth up to 1500 meters, as well as at the pay zone of the well.
• The product provides a remote start (opens the valves and enables plugs)
at one command.
• Stabilizes specified expenditure of the fuel and water at different depth.
• Automatic turn off if the water expenditure gets down from specified amount.
• Register the pressure and temperature of the outgoing steam-gas.
• The product goes into the well placed on the PCP through which the air is
supplied.
• The product takes water from the tube space.
• The product contains and unit to connect to the pipe line of furl supply.
• The product has a sealed electrical connector for the cable.
• The product must have a clutch coupling to connect the packer at the exit.
4.2.2 Composition of the well product
• Combusting chamber with an ignite device,
• Block of filters for air, fuel and water,
• Automatic aggregates,
• Informative block.
• All the specified aggregates are situated in a commune protecting pipe.
46

4.2 Gas-vapor generator (GVG): technical specifications
Outgoing parameters of the product:
• Amount of steam-gas produced: 2.0 Tons/hour.
• Outgoing pressure of the steam-gas, not more than 19.5 atm (195 kg/m2).
Overall and weight characteristics:
• Maximum diameter of the block along the protecting pipe: 130 mm.
• Length of the assembled device: not more than 10 m.
• Weight of the block: not more than 180 kg.
Specifications of the steam - gas generator.
• Depth of immersing of the well block of the steam - gas generator - from 0
up to 1900 m.
• Productivity of steam-gas up to 2.5 tons/hour with thermal capacity up to
1.4 vt
• Full pressure of the steam-gas at the output from nozzle under the packer
- up to 20 mPa.
Parameters of the air compressor:
• Expenditure of 18 m3/min
• Pressure 25.1 MPa
Parameters of the fuel pump:
• Expenditure up to 0.1 m3/hour
• Pressure up to 30 MPa.
Parameters of the water pump:
47

4.3 Results: Combustion of oil-saturated rock samples
No. κi κf κi/κf Gas temperature Gas used(mDarcy) (mDarcy) ℃
1 22 12.0 1.83 500 Ar2 22 4.0 5.50 600 Ar3 22 0.6 36.70 750 CO2
4 22 0.2 110.00 1020 CO2
Table 4.2: Rock sample tests in the absence of water.
• Expenditure 1.25 m3/hour,
• Pressure up to 20 MPa.
Electro supply:
• Power - 380 V,
• Capacity - 20 kV.
• Temperature of the steam-gas 250-300 ℃.
4.3 Results: Combustion of oil-saturated rock
samples
The results of the processing of samples of the rock, saturated with oil, reacting
with products of the combusting reaction of the mixture of diesel fuel and air are
displayed in Tables 4.2 & 4.3.
The testing rig was used to measure the impact of hot rare gases on a sample
of the rock both in the presence and the absence of water at the combusting
zone. Table 4.2 shows that the permeability of a sample of the rock decreased af-
ter high temperature processing (from 500 up to 1020 ℃) in the absence of water.
By contrast, Table 4.3 shows that the permeability of a rock sample increased
after treatment with the mixture of hot gas and water steam at two temperatures.
48

4.4 Testing the prototype generator
No. κi κf κi/κf Gas temperature Gas used(mDarcy) (mDarcy) ℃
1 22 14 1.57 520 50% Ar + 50% steam2 22 44 0.50 400 50% Ar + 50% steam3 22 66 0.33 300 50% CO2 + 50% steam4 22 110 0.20 210 50% CO2 + 50% steam
Table 4.3: Rock sample tests in the presence of water.
It can be seen from both Tables 4.2 and 4.3 that the time taken to heat of the
rock and the subsequent permeability increase depend largely upon temperature
of the treatment, and that this should not be higher than 400 ℃.
4.4 Testing the prototype generator
By late January 2007, the generator was at a factory shop in its assembled con-
dition but a part of its protective outer body was taken off. After a preliminary
test, there was a decision to replace an incandescent plug for a more dependable
one, because the previous one did not show stable results at maximal pressure (it
depended on the depth of the immersion). All other units and blocks of water,
fuel and air filters passed tests and worked well. The control system was not
able to be tested because the generator was already tested and connected to the
stand. The testing of the control system could only occur after assembly of the
entire installation on a platform in its autonomous mode. Another problem, that
had to be fixed involved some component parts that were received from other
companies had connections that did not fit the ones that were already being
used. Arrangements were made to manufacture new connection units. Decisions
were also required about connections for water fuel and air at the well. Universal
connections were fabricated, since each field can be using different equipment.
Several pictures of the generator system mounted to the stand and also operating
are shown in Figure 4.4.
49

4.4 Testing the prototype generator
Figure 4.3: Several pictures of the Gas-Vapor Generator.
There were substantial issues with the control system that had to be re-
solved. Excessive vibrations were initially experienced in the system during op-
erational tests. Additionally, the control system was too aggressive in making
minor changes to the fuel, air, and water mixtures based on very minute changes
in temperature and pressure. Unfortunately, the modifications to the generator
that were anticipated to solve this problem could not be completed before the
50

4.4 Testing the prototype generator
Figure 4.4: Images of the control system guages, control system readout andpump unit for the Gas-Vapor Generator (Geotechnica).
cancellation of the project.
Stand testing continued along with evaluation of continual minor problems
that were preventing the planned complete run testing (30 - 50 hours) involv-
ing continuous operation.Problems with the spark plugs, condensation in the air
lines related to the stand testing system, the size of the transformator and other
matters required resolution. The Generator did undergo an effective and pow-
erful stand test where all systems appeared to operate correctly with consistent
temperature of 240 ℃ and 200 atm. A problem was encountered at the head of
the generator where the metal was actually melted on the inside from the heat
flow in the combustion chamber. The issue was recognized from the outset with
the expectation that the air supply would help to solve this problem. In retro-
spect, it would require a more robust solution that will likely require a new design
with a cooling jacket surrounding it. This problem requires a reevaluation of the
surface shape and metal used at this point to resolve the problem. However, it
51

4.5 Conclusions
was considered major milestone to have had it operating for about 2 continuous
hours. This test substantiated confidence that the problems previously encoun-
tered, although nagging, could be resolved.
The system engineers raised the issue of a housing container to mount the
control system and allow an operator to safely operate the system in spite of any
inclement weather. The container system would also allow a sensible approach to
the routine transport of the above ground components. Although it was always
understood that this issue would need to be resolved, it was never fully recognized
at the project conception that this control and pumping system would be as big
and complex as they have become. This was considered for future iterations of
the generator design.
4.5 Conclusions
Having reached a stage in the project where the foundation for the remainder
of the research has been laid - in that all supplier contracts had been placed
and funded, while encountering significant issues troubleshooting the prototype
generator, the combination of the Russia-Georgia conflict and the economic down-
turn led to the sudden cancellation of the project. While these geopolitical and
economic factors were large and unavoidable complications to the project, the
groundwork laid by this project and the preliminary results achieved are worthy
of further exploration when the economic and political climate permits. TGDF
technology, as this report has shown, is an embryonic technique with massive
potential benefits to the efficiency and longevity of oil wells in both new and
established oil fields. It is to be hoped that the findings of this project provide a
starting point for future research into this topic.
52

CHAPTER 5
Conclusions
In summary, this report has demonstrated the need for new technologies to in-
crease the productive lifespan of oil wells, not least for economic reasons. The
merits of Thermochemically Driven Gas-Dynamic Fracturing have been put for-
ward as a possible method whereby oil production is increased within a well by
heating of the rock containing the oil deposit, thus decreasing the viscosity of the
oil and increasing its flow rate. Initial testing of this concept in Russian oil fields
showed promising results.
Two approaches to achieving the increase in rock temperature have been put
forward: a chemical approach, whereby a combination of a fuel-oxidizing mixture
(FOM) and chemical activator is used to create a exothermic chemical reaction
within the well payload, thus heating the rock; and a fuel approach, where a
diesel-fuel generator is used to ignite fuel at the bottom of the well-head, thus
raising the temperature.
Although this latter approach consumed most of the time and resources of
the project, it is to be hoped that the results of the initial chemical testing will
53

bear fruit for future research avenues.
This latter approach was investigated via the designing and construction of a
diesel-fuel generator which could operate at the depths obtaining in a well-head,
which relevant control apparatus to monitor and sustain the rock heating process
as required. Construction of a prototype generator was accomplished, and initial
testing was commenced, with positive results for increasing the viscosity of rock-
oil samples using this fuel generator, both in the presence and absence of water.
As is to be expected in such a complex project, there were a number of issues
relating to the smooth operation of the prototype generator which proved difficult
to resolve. In the event of the project cancellation, these were still unresolved,
but the generator has proved its ability to operate at temperatures of 240 ℃ and
200 atm. This is a promising result, and merits further exploration by future
researchers in this area.
Owing to the difficult geopolitical climate, with the Russian-Georgia conflict
occurring during the latter half of this project, as well as the economic down-
turn, the project was summarily cancelled before prototype testing was complete.
While such a decision is comprehensible, such large factors being out of our con-
trol, combined with the promising intial test results for the diesel generator, it
appears clear to us that this project is worth further exploration. The preliminary
results outlined in this report have demonstrated its viability, and the economic
need for such technology is clear. It is to be hoped that Thermochemical Gas-
Dynamic Fracturing such as has been outlined in this report will be the subject
of future research, building on the foundations laid here, and will bear fruit for
the oil industry in years to come.
54

References
[1] V.N. Shchelkachev and B.B. Lapuk, Underground Hydraulics, Moscow-
Izhevsk: RKhD, 2001. 7, 8, 9
[2] M.A. Pudovkin Ed., Steam Flooding of Oil Reservoirs, Kazan: Kazan State
University, 1971. 7, 19
[3] I.S. Grigor’ev and E.Z. Meilikhov (Eds.), Physical Quantities: A Handbook,
Moscow: Energoatomizdat, 1991. 16, 18, 19
[4] E.N. Aleksandrov and N.M. Kuznetsov, Dokl. Akad. Nauk, in press. 13, 20
55