thermo-mechanical properties of polystyrene-based shape memory nanocomposites
TRANSCRIPT

PAPER www.rsc.org/materials | Journal of Materials Chemistry
Publ
ishe
d on
29
Janu
ary
2010
. Dow
nloa
ded
by R
MIT
Uni
on
05/0
9/20
13 2
2:38
:00.
View Article Online / Journal Homepage / Table of Contents for this issue
Thermo-mechanical properties of polystyrene-based shape memorynanocomposites†
B. Xu,a Y. Q. Fu,*a M. Ahmad,b J. K. Luo,b W. M. Huang,c A. Kraft,a R. Reuben,a Y. T. Pei,d Z. G. Chend
and J. Th. M. De Hossond
Received 6th November 2009, Accepted 11th December 2009
First published as an Advance Article on the web 29th January 2010
DOI: 10.1039/b923238a
Shape memory nanocomposites were fabricated using chemically cross-linked polystyrene (PS)
copolymer as a matrix and different nanofillers (including alumina, silica and clay) as the reinforcing
agents. Their thermo-mechanical properties and shape memory effects were characterized.
Experimental results revealed that the nanofillers provide significant reinforcement of the PS, and the
nanocomposites exhibit better thermal and mechanical properties, including shape memory properties,
than unreinforced PS. Both experimental and theoretical analyses have shown that the rod-shaped clay
nanofillers offer better reinforcement than spherical nanoparticles, because of their high aspect ratio
and ability to reinforce in multiple directions.
1. Introduction
After large deformations followed by a period at low tempera-
ture, a shape memory polymer (SMP) can recover its original
shape, triggered by external stimuli such as heat,1 electric fields,2
magnetic fields3 and light.4 The basic shape memory mechanism
is based on reversible energy conversion in polymer chain
movement. For example, thermal triggering can occur with
a transition temperature equal to the melting temperature or
glass transition temperature, depending on the nature of the
shape memory polymer.5 SMPs offer a much higher degree of
deformation and a wider scope of mechanical properties than
shape memory alloys (SMAs), in addition to their inherent
advantages of cheapness, biocompatibility, light weight, and easy
processing.6 However, the low strength of polymers limits their
applications. To overcome this disadvantage, a range of nano-
fillers have been introduced into SMP matrices, and nano-
composites made from dispersed particles of sizes smaller than
100 nm have been shown to improve the strength and elastic
modulus of the matrix.7,8 Polystyrene (PS) has been widely used
as the hard segment in copolymers for nanocomposite design and
applications because of its low cost compared to other strong
polymers such as PMMA, polyurethane, and polycarbonate.
Although some studies have been carried out on the shape
memory properties of PS-based SMPs,9,10 there has been no
comprehensive study of the underpinning physical and
aDepartment of Mechanical Engineering, School of Engineering andPhysical Sciences, Heriot-Watt University, Edinburgh, UK EH14 4AS.E-mail: [email protected] for Materials Research & Innovation, University of Bolton, Bolton,UK BL3 5ABcSchool of Mechanical and Aerospace Engineering, Nanyang TechnologicalUniversity, 50 Nanyang Avenue, Singapore 639798dDepartment of Applied Physics, The Netherlands Materials InnovationInstitute, University of Groningen, Nijenborgh 4, 9747 AG Groningen,The Netherlands
† This paper is part of a Journal of Materials Chemistry themed issue onActively Moving Polymers. Guest editor: Andreas Lendlein.
3442 | J. Mater. Chem., 2010, 20, 3442–3448
mechanical enhancement mechanisms of PS-based shape
memory nanocomposites. This paper presents a systematic
investigation of the PS-based shape memory nanocomposites
with different types of nanofillers. A theoretical analysis of the
observed mechanical enhancement of the nanocomposite SMPs
is also performed.
2. Experimental
The matrix was prepared for a styrene-based prepolymer with
benzyl peroxide (BPO) curing agent (CRG Company, USA). The
nanofillers were attapulgite clay, silica (SiO2, average grain size
�15 nm) and alumina (Al2O3, average grain size �80 nm). The
heat treatment of the attapulgite clay powder (850 �C for 2 h) was
reported in ref. 11. All of the nanofillers were dried in an oven at
120 �C for 24 h to remove moisture. They were then mixed with
the prepolymer for 15 min by stirring at a rotation speed of 1000
rpm, followed by treatment for 45 min with ultrasonic mixer. The
curing agent was then added and the mixture again stirred at
1000 rpm for 15 min, followed by ultrasonic agitation for 45 min.
Samples were prepared by casting the mixture into PTFE moulds
and baking at 75 �C for 36 h.
Scanning electron microscopy (SEM, Philips XL30-FEG) and
high resolution transmission electron microscopy (HR-TEM,
JEOL 2010F operating at 200 kV) were used to characterize the
nanofillers. The powder samples were dispersed in isopropanol in
an ultrasonic bath for 10 min before SEM and TEM observa-
tions. The TEM micrograph in Fig. 1 shows spherical Al2O3
particles of diameter ranging from 25 nm to 120 nm. Fig. 2 shows
that the nanoclay exhibits a fibre-like amorphous structure in the
as-received state and becomes a 3-D bundled rod-structure after
heat treatment at 850 �C for 2 h.11 The diffraction spots of the
selected area electron diffraction pattern reveal the nano-
crystalline nature of the heat-treated clay as shown by the inset in
Fig. 2(b).
Micro-hardness (Vickers) tests were performed, with the
measured hardness averaged from at least five indentation tests.
The indentation load was fixed at 245 mN and held for 20 s for
This journal is ª The Royal Society of Chemistry 2010

Fig. 1 TEM micrograph showing the morphology of Al2O3 nano-
particles.
Fig. 2 TEM micrograph of as-received (a) and heat-treated (b) clay
powders, with selected area diffraction pattern shown in the inset.
Fig. 3 Schematic drawings of cyclic tensile testing: (a) 2-D and (b) 3-D,
There are four steps in each cycle: (1) stretching to 3m at Thigh; (2) cooling
to Tlow with holding strain; (3) Unloading and keeping shape at Tlow; (4)
heating up to Thigh; then start of next cycle.
Publ
ishe
d on
29
Janu
ary
2010
. Dow
nloa
ded
by R
MIT
Uni
on
05/0
9/20
13 2
2:38
:00.
View Article Online
each test. Differential scanning calorimetry (DSC) analysis was
performed using a Thermal Advantage DSC 2010 at a heating
rate of 10 �C min�1 under a constant nitrogen flow. Dynamic
mechanical thermal analyses (DMTA) were carried out in tensile
mode with a TA Instruments DMA 2980 at a frequency of 1 Hz,
a heating rate of 2 �C min�1 and a temperature range from 25 to
120 �C. Tensile tests were carried out using an Instron universal
tensile instrument (Instron 5567) at a constant crosshead speed
of 5 mm min�1 at room temperature (�20 �C). The experimental
set-up and dimensions of the specimens followed British Stan-
dards (BS ISO 20753:2008 Plastics—Test specimens, BS EN ISO
This journal is ª The Royal Society of Chemistry 2010
527-1:1996 Plastics—Determination of tensile properties: Part 1
and BS EN ISO 527-5:2009 Plastics—Determination of tensile
properties: Part 5). Thermo-mechanical cyclic tests (one cycle of
which is shown schematically in Fig. 3) were also performed to
investigate the shape memory effect of the SMP and nano-
composites. These tests consisted of loading the specimen to
a strain (3m) at a constant crosshead speed of 5 mm min�1 at
a temperature Thigh (stage 1), and then cooling down to the
temperature Tlow while holding the same strain 3m (stage 2). After
5 min at the temperature Tlow, the specimen was unloaded
J. Mater. Chem., 2010, 20, 3442–3448 | 3443
Publ
ishe
d on
29
Janu
ary
2010
. Dow
nloa
ded
by R
MIT
Uni
on
05/0
9/20
13 2
2:38
:00.
View Article Online
(stage 3) and reached a strain 3e. The unloaded specimen was
immediately heated from Tlow to Thigh in 5 min (stage 4), which
left a permanent strain 3p. This four-stage thermo-mechanical
cycle was repeated for a total of 4 cycles. The fixed conditions of
the cyclic test were: 3m ¼ 100%; Thigh ¼ 60 �C, and Tlow ¼ 20 �C,
and 3e (the strain after unloading) and 3p (the permanent strain)
were both recorded for each specimen.
3. Results
3.1 Mechanical properties
Fig. 4(a) shows the recorded Vickers hardness for the three
nanocomposites as a function of nanofiller content. Clearly,
a significant increase in hardness was observed with the addition
of the nanoparticles. With the addition of 4 wt% of the nanoclay
powder, the microhardness reaches a maximum value of about
75 MPa, which is nearly 400% improvement compared to that of
the pure PS. The Al2O3 nanoparticles show similar hardness
enhancement as the nanoclay; whereas the SiO2 nanoparticles
demonstrate the weakest enhancement effect: the hardness is
only doubled when the SiO2 content reaches 4 wt%. It is also
noticeable that the hardening effect is greatest for the first
0.5 wt% addition and is approximately the same for all three
reinforcement materials thereafter.
Composites with 1 wt% nanofillers were selected for tensile
tests to compare their stress–strain behaviour at room tempera-
ture (20 �C), typical stress–strain curves are shown in Fig. 4(b).
From the maximum stress and strain results shown in Fig. 4(c),
the SiO2/PS composites show a nearly 16% increase in the
maximum strength, and the Al2O3/PS and clay/PS composites
present a much better enhancement, reflecting the hardness
results. The Young’s moduli (shown in Fig. 4(d)) measured from
the tensile tests confirm that the clay/PS composites gave rise to
the best enhancement, nearly 300% of the pure PS.
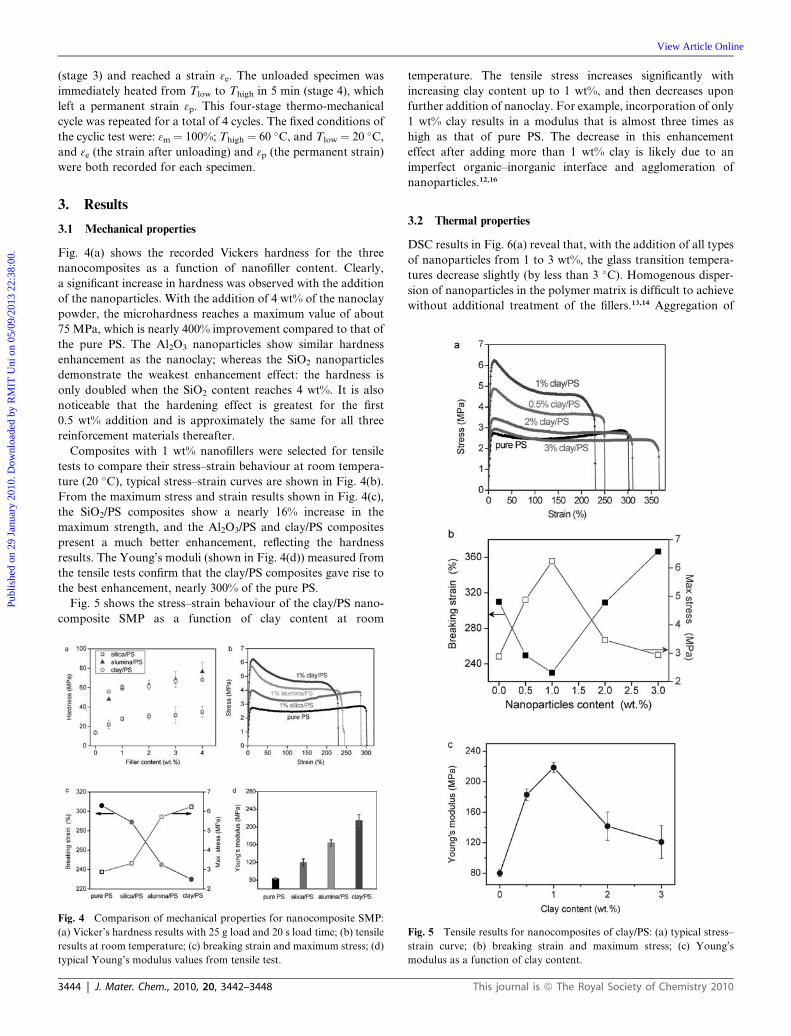
Fig. 5 shows the stress–strain behaviour of the clay/PS nano-
composite SMP as a function of clay content at room
Fig. 4 Comparison of mechanical properties for nanocomposite SMP:
(a) Vicker’s hardness results with 25 g load and 20 s load time; (b) tensile
results at room temperature; (c) breaking strain and maximum stress; (d)
typical Young’s modulus values from tensile test.
3444 | J. Mater. Chem., 2010, 20, 3442–3448
temperature. The tensile stress increases significantly with
increasing clay content up to 1 wt%, and then decreases upon
further addition of nanoclay. For example, incorporation of only
1 wt% clay results in a modulus that is almost three times as
high as that of pure PS. The decrease in this enhancement
effect after adding more than 1 wt% clay is likely due to an
imperfect organic–inorganic interface and agglomeration of
nanoparticles.12,16
3.2 Thermal properties
DSC results in Fig. 6(a) reveal that, with the addition of all types
of nanoparticles from 1 to 3 wt%, the glass transition tempera-
tures decrease slightly (by less than 3 �C). Homogenous disper-
sion of nanoparticles in the polymer matrix is difficult to achieve
without additional treatment of the fillers.13,14 Aggregation of
Fig. 5 Tensile results for nanocomposites of clay/PS: (a) typical stress–
strain curve; (b) breaking strain and maximum stress; (c) Young’s
modulus as a function of clay content.
This journal is ª The Royal Society of Chemistry 2010

Fig. 6 Thermal property investigation on Ttrans of nanoclay-based SMP
composites (a) DSC results; (b) storage modulus versus temperature
curves; (c) tan d versus temperature results.
Fig. 7 Thermal mechanical cyclic testing results: (a) pure PS; (b) 0.5 wt%
clay/PS composites; (c) 1 wt% clay/PS composites; (d) 2 wt% clay/PS
composites.
Publ
ishe
d on
29
Janu
ary
2010
. Dow
nloa
ded
by R
MIT
Uni
on
05/0
9/20
13 2
2:38
:00.
View Article Online
nanofillers in the nanocomposites was reported to cause some
negative effects, such as a slight decrease in the transition
temperature.15 The clay/PS composites showed the smallest
decrease in the transition temperature of the nanocomposites
studied.
The clay/PS samples were selected to investigate the dynamic
mechanical properties of the nanocomposites using DMTA.
Fig. 6(b) shows the storage modulus (E0) for the composites
with different clay contents. The storage modulus obtained
from DMTA tests has a maximum value for the SMP nano-
composite with 1 wt% clay, indicating that the stiffness of
1 wt% clay/PS nanocomposite is the highest among all the
tested samples. A sharp drop in modulus is observed above Tg
within a narrow temperature range, which has been frequently
reported.16 The tan d curves shown in Fig. 6(c) reveal that the
transition temperatures of the nanocomposites slightly increase
with addition of clay content, which reflects what was observed
in the DSC analysis. The nanocomposite with 0.1 wt% clay also
shows the highest tan d value, which reveals the best energy
This journal is ª The Royal Society of Chemistry 2010
absorption capacity among these samples.17 The damping effect
depends strongly on the hard segment content, crystallization of
the soft segment and cross-linking rate.18,19 The best damping
effect was achieved with 1 wt% clay content, as the incorpo-
ration of nanofiller maximizes the hard segments’ content.
However, with 2 wt% addition of clay, due to the poor
dispersion of nanofillers, the energy absorption during defor-
mation has been reduced, thus leading to a reduction in the
damping effect.
3.3 Thermo-mechanical cyclic results
When an external stress is applied to the SMP, soft/flexible
segments will be preferentially extended in the stress direction
relative to the hard/fixed segment. The SMP studied in this
paper is a cross-linked polystyrene where both cross-linking and
nanofiller particles act as the hard/fixed segment. The shape
memory properties are normally evaluated in terms of
percentage shape recovery.20,21 As can be seen from Fig. 7, the
maximum stress of pure PS (1.45 MPa) at 60 �C is about half of
that at room temperature (Fig. 5(b)). A similar behavior is also
observed in the nanocomposites. This can be understood by the
chains of shape memory polymer becoming flexible above
the transition temperature, which results in a reduction of the
maximum stress. The maximum stress of 1 wt% clay/PS nano-
composite was the highest among all the samples, showing
a good enhancement even at temperatures above Ttrans. When
the cyclic tensile process proceeds, the residual strain 3p
increases (see Fig. 7), which could be attributed to such possi-
bilities as: (1) random breaking of covalent cross-link bonds, (2)
energy storing by the fillers,22 (3) a blocking effect by incorpo-
rated nanofillers,12 etc.
J. Mater. Chem., 2010, 20, 3442–3448 | 3445

Fig. 9 Recovery of a pure PS SMP sheet in 60 �C hot water.
Publ
ishe
d on
29
Janu
ary
2010
. Dow
nloa
ded
by R
MIT
Uni
on
05/0
9/20
13 2
2:38
:00.
View Article Online
The shape memory effect can be quantified using the strain
recovery ratio as a function of cycle number N, defined by eqn
(1):20
RrðNÞ ¼3eðNÞ � 3pðNÞ
3e ðNÞ � 3pðN � 1Þ(1)
where Rr(N) is the strain recovery ratio in the cycle number N,
3e(N) is the unloading strain at Tlow in the cycle number N, 3p(N)
and 3p(N � 1) are residual strains at cycle number N and N � 1,
respectively. Fig. 8 summarizes the recovery ratio of the clay/PS
composite SMPs for the cyclic tests. It has been found that the
recovery rates of all the samples are above 85%. The recovery
ratio for 2 wt% clay nanocomposite is nearly 15% lower than that
of the pure PS, and this can be attributed to significant
agglomeration of nanofillers in the polymer, and random
breaking of covalent cross-link bonds. There seems to be a slight
decrease in the recovery rate with cycle numbers, but then a slight
increase after two or three cycles. This is a typical ‘‘learning
phase’’ seen in many shape-memory polymers.4,6 After the first
tensile cycle, some of the cross-link points will break in the SMP
and composites, which could freeze the free movement of the
molecular chain, thus causing the reduction in the recovery rate.
The recovery strain becomes stable as more molecular chains
function as the soft segment, leading to an increase in the
reversible recovery rate.
3.4 Shape memory recovery
SMP and nanocomposite samples with a thickness of 0.6 mm and
width of 10 mm were rolled after heating to 90 �C, and kept the
shape fixed during cooling to room temperature (20 �C).
The shape recovery test was carried out in hot water at 60 �C.
The pure PS sample (see Fig. 9) exhibited a prompt response in
hot water and almost reached 90% recovery within 20 s. The
nanocomposites also showed good shape memory recovery but
with a faster recovery speed (recovering within 12 s) than that of
the pure PS. The reason could be that the Ttrans of the nano-
composite SMPs decreases with addition of nanoclay filler. As
a further assessment of the capacity of the materials, a micro-
gripper based on pure PS was manufactured using laser beam
micromachining as shown in Fig. 10. A good shape recovery of
Fig. 8 Recovery rate versus cyclic number of pure PS and clay/PS
samples.
3446 | J. Mater. Chem., 2010, 20, 3442–3448
the gripper at 80 �C was demonstrated. A five penny coin was
used as a comparison of the dimension changing. The demon-
stration of the SMP microgripper shows a potential biomedical
or microassembly application.
4. Discussion
Generally, when nanofillers with high modulus are added into
a lower modulus polymer matrix, the modulus and strength of
the nanocomposites will be enhanced through an improved load
transfer from the matrix to the filler. Fig. 11 illustrates the
microstructure of nanofillers in a polymer matrix. Nanofillers
dispersed in the polymer matrix reinforce the soft matrix through
load transfer. When the aspect ratio of the particles equals unity
(spherical nanoparticles), the composite modulus is dependent
on a number of particle characteristics such as their modulus,
density, the particle size and shape, the volume fraction, and the
nature of the interface. As the modulus and density of Al2O3 is
much larger than that of SiO2, the enhancement effect for the
Al2O3/PS sample is more significant, as shown in Fig. 4. The rod-
like nanofillers may bridge more polymer chains and afford more
effective load transfer, leading to an improvement in strength.
Upon adding a critical volume fraction of nanorods (such as
nanoclay), the nanorods stretch and perturb the polymer matrix,
and the polymer blend confines the nanorods, generating elon-
gated domains that are reinforced by these fillers.23 Nanofillers
with rod-like structures, as compared with spherical nano-
particles, have been predicted to be better in homopolymer
systems because the stress concentration was reduced, and the
stress was transferred by the high aspect ratio and specific
geometry of the fillers.24 In this study, the remarkable improve-
ment of mechanical properties of SMPs reinforced with 1 wt%
clay in comparison with other spherical fillers (see Fig. 4)
confirms this prediction.
This journal is ª The Royal Society of Chemistry 2010

Fig. 10 Shape recovery of a micro-gripper based on a pure PS copolymer (the edge of a five pence coin is also shown for comparison).
Fig. 11 3-D schematic demonstration of nanocomposite systems: (a)
with spherical fillers (such as Al2O3 and SiO2), (b) with rod-like filler
(such as clay or carbon nanotubes).
Fig. 12 Comparison of predicted Young’s modulus with experimentally
measured data for 0.5 wt% fillers/PS nanocomposite SMPs.
Publ
ishe
d on
29
Janu
ary
2010
. Dow
nloa
ded
by R
MIT
Uni
on
05/0
9/20
13 2
2:38
:00.
View Article Online
Many empirical or semi-empirical equations have been
proposed to predict the modulus of composites. Einstein gave
a simple equation to predict the Young’s modulus of composites
reinforced with rigid particles:25
E
Em
¼ 1þ 2:5ff (2)
where E and Em represent the Young’s modulus of the composite
and matrix, ff is the volume fraction of filler (vol%). Einstein’s
equation is applicable only at low concentrations of filler and
assumes perfect interface combination between filler and matrix,
as well as perfect dispersion of individual filler particles.26 Halpin
and Tsai27,28 proposed a similar analytical equation, adapted for
a variety of reinforcement geometries, including discontinuous
filler reinforcement:
E
Em
¼ 1þ zhff
1� hff
(3)
where z is a shape parameter, decided by filler geometry and
loading direction, and h is given by:
h ¼ Ef=Em � 1
Ef=Em � 1þ z(4)
where Ef is the Young’s modulus of the filler. Following Halpin
and Kardos,27 a shape parameter based on aspect ratio z¼ 2 (l/d)
will be used in this study.
Mori and Tanaka considered the effect of an infinite volume
fraction of inclusions in an aligned short-fiber composite in their
models.29–31 Tandon and Weng31 have derived comprehensive
analytical expressions for the elastic modulus of an isotropic
matrix filled with spheroidal and unidirectionally aligned non-
This journal is ª The Royal Society of Chemistry 2010
spherical inclusions. The longitudinal (along the inclusion
alignment direction) and transverse elastic moduli can be
generated through examining the influence of aspect ratio, from
zero to infinity, on the offload transfer in a transversely isotropic
composite:29
E11
Em
¼ A
Aþ ffðA1 þ 2ymA2Þ(5)
E22
Em
¼ 2A
2Aþ ffð � 2y0A3 þ ð1� ymÞA4 þ ð1þ ymÞA5AÞ (6)
where E11 is the longitudinal modulus and E22 is the transverse
modulus, y0 is the Poisson’s ratio of the matrix, A1, A2, A3, A4,
A5, and A are functions of the Eshelby’s tensor, related to the
properties of the filler and the matrix.26 Eqn (5) and (6) account
of the effect of filler shape, for example, rod-like, plate-like, or
disc-like, etc. Given that nanofillers are rarely aligned, Fornes
et al.32 suggested equations for random orientation in all three
orthogonal directions:
Efibersran�3D ¼ 0.184E11 + 0.816E22 (7)
Eplatelesran�3D ¼ 0.49E11 + 0.51E22 (8)
Fig. 12 compares the calculated and measured moduli for the
SMPs studied. Two models, the Halpin–Tsai model and the
Mori–Tanaka model, were used to calculate the reinforcement.
The Halpin–Tsai model considerably over-estimates the effect of
silica reinforcement and under-estimates a little the effect of clay
reinforcement. The Mori–Tanaka model predicts the observed
ranking of the three fillers, but over-estimates all of the effects.
The better performance of the Mori–Tanaka model is attributed
J. Mater. Chem., 2010, 20, 3442–3448 | 3447

Fig. 13 Prediction of Young’s modulus of nanocomposite SMPs versus
experimental data.
Publ
ishe
d on
29
Janu
ary
2010
. Dow
nloa
ded
by R
MIT
Uni
on
05/0
9/20
13 2
2:38
:00.
View Article Online
to its considering the sample expansion and the effect of an
infinite volume fraction of inclusions. The considerable differ-
ence between the calculated and measured Young’s modulus for
silica/PS composites may be attributed to the agglomeration of
nanofillers caused by the surface hydro-groups, an effect that has
been observed by others in nano-SiO2.33,34
Fig. 13 shows calculated results of Young’s modulus of
composites with different shapes of fillers based on eqn (7) and
(8) (Mori–Tanaka model). Of the three forms considered, platelet
fillers are more effective, even for the same aspect ratio, as the
platelet filler shows the ideal reinforcement because of its high
aspect ratio and multi-direction load transfer ability.23,32 The
experimental results (average data only) for the treated clay
follow a similar trend to the high aspect ratio platelets model for
low filler contents, consistent with the TEM observation in
Fig. 2b, where the rod-like clay forms a more plate-like structure
after heat treatment. The deviation from the predicted curve at
higher filler contents (beyond 1 wt%) may be due to increased
agglomeration during fabrication of the nanocomposites.
5. Conclusion
Thermo-mechanical properties of the PS-based nanocomposites
were studied. Nanofillers exhibit an effective enhancement in the
strength and modulus of composite SMPs, at the expense of
slightly reduced recovery rate. Among the three types of nano-
filler, the heat-treated nanoclay achieved the best improvement in
strength. DMTA results indicated that the 1 wt% clay composites
had the highest storage modulus and the best energy absorption
capacity. Thermal cyclic tests indicated that the recovery rates of
all the nanocomposite SMPs are above 85%, and good shape
recovery ability was demonstrated. Two theoretical models were
adopted to evaluate the reinforcement effects, and the analysis
results revealed that the Mori–Tanaka model provides a better
description by taking into account the influence of the aspect
ratio of nanofillers on thermo-mechanical properties, such as
Young’s moduli of composite SMPs.
3448 | J. Mater. Chem., 2010, 20, 3442–3448
Acknowledgements
We thank Prof. D. Hand, Dr P. Jonathan, Steven Fuhrmann and
Mr W. L. Chang for their experimental help and the Carnegie
Trust for financial support. The nanoclay was kindly provided by
Prof. G. H. Pan from the Southeast University, China. W. M
Huang would like to acknowledge the support from A*STAR,
Singapore (SERC No: 092 137 0016).
References
1 B. S. Lee, B. C. Chun, Y. C. Chuang, K. I. Sul and J. W. Chos,Macromolecules, 2001, 34, 6431.
2 N. G. Sahoo, Y. C. Jung, H. J. Yoo and J. W. Cho, Compos. Sci.Technol., 2007, 67, 1920.
3 R. Mohr, K. Kratz, T. Weigel, M. Lucka-Gabor, M. Moneke andA. Lendlein, Proc. Natl. Acad. Sci. U. S. A., 2006, 103, 3540.
4 A. Lendlein, H. Jiang, O. J€unger and R. Langer, Nature, 2005, 434,879.
5 S. Hayashi, S. Kondo, P. Kapadia and E. Ushioda, Plast. Eng., 1995,51, 29.
6 M. Behl and A. Lendlein, Mater. Today, 2007, 10, 20.7 C. Liang, C. A. Rogers and E. Malafeew, J. Intell. Mater. Syst.
Struct., 1997, 8, 380.8 K. Gall, M. L. Dunn, Y. P. Liu, D. Finch, M. Lake and
N. A. Munshi, Acta. Mater., 2002, 50, 5115.9 K. Sakurai, Y. Shirakawa, T. Kashiwagi and T. Takahashi, Polymer,
1994, 35, 4238.10 F. Li and R. C. Larock, Biomacromolecules, 2003, 4, 1018.11 B. Xu, W. M. Huang, Y. T. Pei, Z. G. Chen, A. Kraft, R. Reuben,
J. Th. M. De Hosson and Y. Q. Fu, Eur. Polym. J., 2009, 45, 1904.12 H. Fischer, Mater. Sci. Eng., C, 2003, 23, 763.13 H. Tobushi, T. Hashimoto, N. Ito, S. Hayashi and E. Yamada,
J. Intell. Mater. Syst. Struct., 1998, 9, 127.14 Q. H. Meng, J. L. Hu and S. Mondal, J. Membr. Sci., 2008, 319, 102.15 C. D. Liu, S. B. Chun, P. T. Mather, L. Zhang, E. H. Haley and
E. B. Coughlin, Macromolecules, 2002, 35, 9868.16 B. K. Kim, Y. J. Shin, S. M. Cho and H. M. Jeong, J. Polym. Sci.,
Part B: Polym. Phys., 2000, 38, 2652.17 B. S. Lee, B. C. Chun, Y. C. Chung, K. I. Sul and J. W. Chos,
Macromolecules, 2001, 34, 6431.18 T. Takahashi, N. Hayashi and S. Hayashi, J. Appl. Polym. Sci., 1996,
60, 1061.19 P. Pissis, L. Apekis, C. Christtodoulides, M. Niaounakis, A. Kyritsis
and J. Nedbal, J. Polym. Sci., Part B: Polym. Phys., 1996, 34, 1529.20 Q. Q. Ni, C. S. Zhang, Y. Fu, G. Dai and T. Kimura, Compos. Struct.,
2007, 81, 176.21 J. D. Merline, C. P. Reghunadhan, C. Gouri, R. Sadhana and
K. N. Ninan, Eur. Polym. J., 2007, 43, 3629.22 Q. H. Meng, J. L. Hu and Y. Zhu, J. Appl. Polym. Sci., 2007, 106, 837.23 G. A. Buxton and A. C. Balazs, Mol. Simul., 2004, 30, 249.24 G. A. Buxton and A. C. Balazs, J. Chem. Phys., 2002, 117, 7649.25 A. Einstein, Ann. Phys. (Leipzig), 1905, 17, 549.26 C. H. Hsueh and P. F. Becher, J. Am. Ceram. Soc., 2005, 88, 1046.27 J. C. Halpin, Compos. Mater., 1969, 3, 732.28 J. C. Halpin and J. L. Kardos, Polym. Eng. Sci., 1976, 16, 344.29 T. Mori and K. Tanaka, Acta Metall., 1973, 21, 571.30 C. H. Hsueh, J. Am. Ceram. Soc., 1989, 72, 344.31 G. P. Tandon and G. J. Weng, Polym. Compos., 1984, 5, 327.32 T. D. Fornes, P. J. Yoon, D. L. Hunter, H. Keskkula and D. R. Paul,
Polymer, 2002, 43, 5915.33 M. Z. Rong, M. Q. Zhang, S. L. Pan, B. Lehmann and K. Friedrich,
Polym. Int., 2004, 53, 176.34 S. Gupta, Q. L. Zhang, T. Emrick, A. C. Balazs and T. P. Russell,
Nat. Mater., 2006, 5, 229.
This journal is ª The Royal Society of Chemistry 2010