thermal performance of an insulated and ...jestec.taylors.edu.my/vol 13 issue 4 april...
TRANSCRIPT
Journal of Engineering Science and Technology Vol. 13, No. 4 (2018) 1090 - 1110 © School of Engineering, Taylor’s University
1090
THERMAL PERFORMANCE OF AN INSULATED AND WINDOW AREA OPTIMIZED HOUSE
R. K. PAL
Department of Mechanical Engineering,
Panjab University SSG Regional Centre, Hoshiarpur
E-mail: [email protected]
Abstract
Space heating and cooling inside the building consume a lot of energy. Energy
efficient buildings can reduce this energy consumption. Thermal insulators reduce
the heat flow into and out of the buildings. Providing air gap and optimizing
window area also reduce the cooling load. Present work is the comparison of
thermal performance of an uninsulated and an insulated & window area of a house
occupied during summer. The indoor air temperature is much lesser for summer
season in case of house with insulation on inside and smaller window area as
compared to an uninsulated house. The maximum indoor air temperature
difference for insulated house as compared to uninsulated house is 5.73°C,
5.65°C, 2.96°C, 3.23°C and 3.08°C for the months from May to September
respectively. There are energy savings for an insulated house as compared to an
uninsulated house for the summer season. The total energy savings for the
summer season are 4514 units. There are money savings also for the insulated
house for the summer season. The total money savings for the summer season are
Rs. 22574. The carbon dioxide (CO2) emission is also reduced for the insulated
house for each month of the summer season. Total reduction in carbon dioxide
emission for the summer season is 7078 kg. The thermal performance of an
insulated and window area optimized house is better than an uninsulated house. In
addition to the better human comfort the insulated house also offers money and
energy savings. Also the insulated house is environment friendly.
Keywords: Energy efficient buildings, Thermal insulation, Cooling load, Indoor
air temperature.
1. Introduction
The total energy consumption in India is rising. The growth rate of energy
consumption in India was highest amongst the major economies at 7.1% in 2014-
15 [1]. The total energy consumption in India in 2015 was 770 million tonnes of oil

Thermal Performance of an Insulated and Window Area Optimized House 1091
Journal of Engineering Science and Technology April 2018, Vol. 13(4)
Nomenclatures
a Coefficient of room air temperature Ar Area of roof, m2 Awa Area of wall, m2 Awi Area of window, m2 B1 Runge-Kutta coefficient one B2 Runge-Kutta coefficient two B3 Runge-Kutta coefficient three B4 Runge-Kutta coefficient four C Carbon dioxide emission reduction, kg Cef Carbon dioxide emission factor, kg/kWh Cra Specific heat of room air, kJ/kg K Es Energy savings, kWh Fd Losses in distribution Ft Losses in transmission h Interval of time, h hi Film co-efficient of indoor air, W/m2-K ho Film co-efficient over the building, W/m2-K It Total incident solar load, W/m2 K1 Thermal conductivity of cement layer, W/m-K K2 Thermal conductivity of cement concrete layer, W/m-K K3 Thermal conductivity of brick layer, W/m-K K4 Thermal conductivity of air layer, W/m-K K5 Thermal conductivity of wood layer, W/m-K Mra Mass of room air, kg Ms Money saved, Rs. N Number of air changes per hour, h-1 Qgt Total heat gain, kJ/s Qlt Total heat loss, kJ/s Qnet Net heat loss, kJ/s Qr Heat gain through roof, kJ/s Qv Heat loss due to ventilation, kJ/s Qwa Heat gain through wall, kJ/s Qwi Heat gain through window, kJ/s R Cost of energy, Rs./kWh Ta Current dry bulb temperature, °C Tira Insulated roof room air Temperature, °C Tra Current room air temperature, °C Tsa Solar-air temperature, °C Tsa_r Solar-air temperature of roof , °C Tsa_wa Solar-air temperature for wall, °C Tsa_wi Solar-air temperature for window, °C Tura Uninsulated roof room air Temperature, °C Uir Overall heat transfer coefficient for insulated roof, W/m2-K Uiw Overall heat transfer coefficient for insulated window, W/m2-K Ur Overall heat transfer coefficient for roof, W/m2-K u(t) Function of time comprising time dependent terms Uur Overall heat transfer coefficient for uninsulated roof, W/m2-K Uuw Overall heat transfer coefficient for uninsulated window, W/m2-K Vra Volume of room air, m3 Greek Symbols

1092 R. K. Pal
Journal of Engineering Science and Technology April 2018, Vol. 13(4)
Surface absorptance for solar radiation.
Transmissivity of glass δ1 Thickness of cement layer, m δ2 Thickness of cement-concrete layer, m δ3 Thickness of brick layer, m δ4 Thickness of air layer, m δ5 Thickness of wood layer, m ρra Density of room air, kg/m3 εδR/ho Longwave radiation factor.
equivalent [2]. Residential buildings consume a large amount of energy of total
energy consumption [3]. An increase in building energy consumption of 700%
may be experienced in India by 2050 in comparison to the year 2005 [4]. Major
energy consumption in this sector is in space heating and cooling. This large
amount of energy consumption in space heating and cooling can be decreased by
applying energy efficient technology and building design. Energy efficiency in
buildings is main concern for governments now a day [5]. Techniques like
improving the building envelope, better ventilation and using environment
friendly technologies can decrease the energy consumption in buildings [6]. The
building envelope can be improved by utilizing thermal insulators as the building
materials. Thermal insulators reduce the heat flow because of its large thermal
resistance. Thermal insulation can reduce the energy consumption in buildings by
20-40% [7]. Utilizing movable insulation can decrease the heating and cooling
load of buildings [8]. The thermal insulation can aid in achieving energy
efficiency [9]. Air spaces can also be used as insulation layers. The optimum air
space thickness is around 20 mm [10]. Also the thermal storage of the building
materials should be considered while designing the energy efficient buildings for
winters and summers [11].
Thermal storage is suitable where the diurnal variation of ambient temperature
is more than 10 K [12]. In regions with severe hot summers the time lag in heat
transfer from outside to inside can be increased using a material with higher
thermal mass. Higher thermal mass can delay or reduce the peak indoor load [13,
14]. Furthermore natural ventilation utilization can increase the indoor air quality
and the thermal comfort in summers without any energy expenditure [15]. Passive
cooling can also be used to cool the buildings. This is because a passive house is
the most energy efficient [16]. Passive cooling can be used for thermal comfort
and to reduce energy expenditure in India [17]. Passive design of buildings can
reduce the world energy consumption by 2.35% [18]. Passive technologies like
optimization of windows and insulating the buildings etc. can be utilized to make
the buildings energy efficient. The energy efficient buildings are also environment
friendly. The environmental effect occurs during processing of raw materials,
construction, life cycle and demolition of the buildings [19]. But the most
significant environmental effect occurs during the life cycle of the buildings [20,
21]. Electricity is consumed in cooling the buildings with the help of air
conditioners. In India the main source of electricity generation is coal. Coal
mining is harmful to the environment and it causes air and water pollution [22]. In
India 1710.3 million metric tons of carbon dioxide is emitted due to residential
sector [23]. Therefore the energy efficient buildings can reduce the environmental
effect as it causes a reduction in energy consumption during life cycle of the
buildings. Additionally the energy efficient buildings should be designed after

Thermal Performance of an Insulated and Window Area Optimized House 1093
Journal of Engineering Science and Technology April 2018, Vol. 13(4)
considering parameters like solar heat gain in summer season, heat loss in winter
season and ventilation in transitional season [11].
In south Asia mostly masonry houses with reinforced cement concrete roof are
built [24]. In summers these houses have high roof temperature and longer heat
retaining capacity which affects the indoor air temperature. The solar air
temperature of roof is reported around 62°C at various places [11]. This causes
the indoor air temperature to exceed 40°C [25]. This high indoor temperature is
very uncomfortable to live in. Thermal insulation can be utilized to reduce the
heat transferred through a concrete roof [26].
The state of Punjab in India comes under severe hot summer zone. Summer
season here lasts for around five months from May to September. Hot and dry
summers last for May & June, humid summer season exists for July & August
and in September both the temperature and humidity are high. Large variation in
outside temperature causes huge fluctuation in indoor temperature. The effect of
these climatic conditions can be negated by using insulating materials and
optimizing the window area. In the present work the combined effect of insulation
and window area optimization for a house is evaluated. Also the performance of
an uninsulated house and the same house with insulation on inside and with
reduced window area is compared by parameters like indoor air temperature,
energy savings, money savings and carbon dioxide emission reduction computed
from solar irradiation, ambient air temperature, thermal conductivities of various
materials and film coefficients of inside and outside air etc.
The construction of two types of houses considered for the study is shown in
Fig. 1. The first house is made from common construction material (Figs. 1(a), (b)
and (c)) and the second house is the same house except an insulation layer of
wood and air gap (Figs. 1(d), (e) and (f)) employed inside and reduced window
area. The optimum thickness of wooden layer insulation on inside of the insulated
house is 0.06 m in the present investigation. The common house construction
material in India is a composite brick and cement-concrete. The exterior wall
consists of brick layer with plaster on inside and outside. The roof has a layer of
cement and concrete, a layer of brick on the upper side and layer of cement on the
outer and inner surface. The thermal performance of these types of houses is not
good for extreme hot climate [25].
In the present work this common house made up of cement, concrete and bricks
are compared with an insulated and window area optimized house. An actual house
was used for the study. The indoor air temperature was measured as well as
calculated analytically with Microsoft Excel software for the month of June for the
uninsulated house and the two were compared. The schematic sketch for measuring
the indoor air temperature for the month of June is given in Fig. 2. Mercury in glass
thermometer with an accuracy of ± 0.07°C was used for measuring air temperature.
After getting satisfactory results from the analytical method for the month of June, it
was used for calculating the indoor air temperature for all the cases. Various
dimensions and properties of the house, construction materials and insulation layer
are listed in Table 1. The construction of roof of the uninsulated and insulated
houses is shown in Figs. 1(a) and (d) respectively. The construction of walls for the
uninsulated and insulated houses is shown in Figs. 1(b) and (e). The window area
without optimization and with optimization is shown in Figs. 1(c) and (f). The
window area of the house is decreased after optimization to reduce the inflow of

1094 R. K. Pal
Journal of Engineering Science and Technology April 2018, Vol. 13(4)
heat during the severe sunshine. The optimized window area was obtained by
varying the area to get minimum indoor air temperature. The position of the
windows was not changed as the windows are already well placed in east and west
direction of the house under study. This is due to the fact that there is no space
available for windows on the north and south side of the house because of
construction on these sides. The thermal performance of the two houses is
compared. Further energy and money savings were calculated. Furthermore the
carbon dioxide emission reduction was computed from the energy savings. The
carbon dioxide emission factor for thermal power plant was taken as 0.98 kg/kWh
[27, 28]. The transmission and distribution loss factor for electricity In India are
taken as 0.4 and 0.2 respectively [29].
(a) House roof without insulation
layer.
(d) House roof with insulation layer.
(b) House wall without insulation
layer.
(e) House wall with insulation layer.
(c) Window area without optimization. (f) Window area optimized.
Fig. 1. Roof, walls and window area of two types of houses.

Thermal Performance of an Insulated and Window Area Optimized House 1095
Journal of Engineering Science and Technology April 2018, Vol. 13(4)
Fig. 2. Schematics of indoor air temperature measurement setup.
Table 1. Parameters used for the analysis.
Parameter Value Area of the house 54 m2 Height of the ceiling 3 m Dimensions of window 1 m × 1.5 m
ho 22.8 W/m2K hi 6 W/m2K
K1 0.721 W/mK
K2 1.58 W/mK K3 0.798 W/mK
K4 0.027 W/mK K5 0.072 W/mK
R 6 Rs./kWh δ1 0.01 m
δ2 0.12 m
δ3 0.04 m δ4 0.02 m
δ5 0.06 m ρra 1.14 kg/m3
0.86
Absorptance of wall and roof surface 0.4 Absorptance of window glass 0.1
2. Methods for computing indoor air temperature, energy savings,
money savings and carbon dioxide reduction
In this section analytical methods for computing various parameters like solar air
temperature, total heat gain, total heat loss, indoor air temperature, energy
savings, money savings and carbon dioxide reduction are presented. The various
methods used are as follows: -
2.1. Solar air temperature
The solar-air temperature is computed from (Eq. (1)) the ambient air temperature,
surface absorptance for solar radiation, total incident solar load, outside air film
coefficient and long wave radiation factor [29]. The ambient air temperature was
noted down and the other parameters were taken from available literature.
oo
tasa
h
R
h
ITT
- (1)

1096 R. K. Pal
Journal of Engineering Science and Technology April 2018, Vol. 13(4)
2.2. Overall heat transfer coefficient
The overall heat transfer co-efficient for uninsulated roof and insulated roof is
given by Eqs. (2) and (3) respectively. It is reciprocal of sum of thermal
resistances of inside & outside air, inside and outside layer of cement, brick layer
and cement-concrete layer for uninsulated roof. In case of the insulated roof the
thermal resistances of the air gap and the wooden layer are also added to the
resistances of the uninsulated roof. The overall heat transfer co-efficient for
uninsulated wall and insulated wall is given by Eqs. (4) and (5) respectively. It is
reciprocal of sum of thermal resistances of inside & outside air, inside and outside
layer of cement and brick layer uninsulated wall. In case of the insulated wall the
thermal resistances of the air gap and the wooden layer are also added to the
resistances of the uninsulated wall. The overall heat transfer coefficients
calculated in this section are used to calculate the heat transfer from roof & wall
for uninsulated and insulated house.
oi
ur
hKKKKh
U1
1
1
1
1
3
3
2
2
1
1
(2)
oi
ir
hKKKKKKh
U1
1
1
1
1
5
5
4
4
3
3
2
2
1
1
(3)
oi
uw
hKKKh
U1
1
1
1
1
3
3
1
1
(4)
oi
iw
hKKKKKh
U1
1
1
5
5
4
4
1
1
3
3
1
1
(5)
2.3. Indoor air temperature
The buildings gain heat through roof, wall and window and heat is lost due to
ventilation. Total heat gain by the building is given by Eq. (6) and total heat loss
by the building is given by Eq. (7). Total heat gain is the sum of heat gain from
roof given by Eq. (8), heat gain from the walls given by Eq. (9) and heat gain
from the windows given by Eq. (10) [29]. Total heat loss from the building is
equal to heat loss by ventilation and is given by Eq. (11) [22]. Heat gain from roof
is calculated from the solar air temperature for roof, room air temperature, area of
roof and overall heat transfer coefficient for roof. Heat gain from wall is
determined from the solar air temperature for wall, room air temperature, area of
wall and overall heat transfer coefficient for wall. Heat gain from window is the
sum of heat transmitted through glass and heat conducted in due to solar air
temperature of the window. Heat loss due ventilation is computed from inside and
outside air temperature, number of air charges, density of room air, volume of
room air and specific heat of room air. All these heat gains and losses are used to
calculate the net heat gain by the house. The net heat gain by the house is given
Eq. (12) which is the difference of total heat gain and total heat loss.

Thermal Performance of an Insulated and Window Area Optimized House 1097
Journal of Engineering Science and Technology April 2018, Vol. 13(4)
wiwargt QQQQ (6)
vlt QQ (7)
) (* _ rarsarrr TTAUQ (8)
) (* _ rawasawawawa TTAUQ (9)
) (*** _ rawisawiwitwiwi TTAUIAQ
(10)
3600
) (**** ararararav
TTNCVQ
(11)
ltgtnet QQQ (12)
The net heat gain is useful in computing the indoor air temperature of the
house by heat balance. Heat balance for the house is given by Eq. (13) showing
that net heat gain by the house is equal to heat gain by the air inside the house.
netra
rara Qdt
dTCM )(* (13)
Substituting the values of all the heat gain and loss terms in Eq. (13), we get
Eq. (14) which can be written as Eq. (15) or Eq. (16).
3600
) (****) (***
) (*) (**
_
__)(
arararararawisawiwitwi
rawasawawararsarrra
rara
TTNCVTTAUIA
TTAUTTAUdt
dTCM
(14)
or
))(, ( tuTfdt
dTra
ra (15)
or
))( tuTadt
dTra
ra (16)
The solution of Eq. (16) for indoor air temperature can be obtained by Runge-
Kutta fourth order method for the next hour [29]. The solution for indoor air
temperature is given by Eq. (17) below.
hBBBB
tTtT rara *6
22)( )1( )( 4321 (17)
Runge-Kutta coefficients [29] used in Eq. (17) were computed from the
following expressions (Eqs. (18) - (21)).
httaTB ra *)( u)( )(1 (18)
htB
tTaB ra *)( u)2
)(( )( 12 (19)

1098 R. K. Pal
Journal of Engineering Science and Technology April 2018, Vol. 13(4)
htB
tTaB ra *)( u)2
)(( )( 23 (20)
htBtTaB ra *)( u))(( )( 34 (21)
2.4. Energy savings
The energy savings for the insulated house is given by Eq. (22). It is the product
of difference of room temperature in uninsulated & insulated houses and mass
and specific heat of room air.
3600
) (* iraurarara
s
TTCME
(22)
2.5. Money savings
Money savings are obtained from Eq. (23) by multiplying the energy savings for
insulated house with cost of energy.
REM ss * (23)
2.6. Reduction in carbon dioxide emission
The reduction in carbon dioxide emission due to the energy saving potential
of the insulated house is given by Eq. (24) [29]. It is obtained from energy
savings by multiplying carbon dioxide emission factor and losses
(transmission & distribution).
stdef EFFCC *)1(* (24)
3. Results and Discussion
The parameters like solar air temperature, various heat interactions, indoor air
temperature, optimized window area, energy savings, money savings and
reduction in carbon dioxide emission computed from various equations are
presented in the following sections: -
3.1. Solar air temperature
The solar air temperature variation for roof, wall and window from May to
September is given in Figs. 3(a), (b) and (c) respectively. The solar air
temperature is same for roof, wall and window for uninsulated & insulated
house as it is the outside temperature. The solar air temperature is more during
the day as compared to that in the evening or night. This is because of solar
irradiance during the day which also increases the ambient air temperature as
the time progresses. The solar air temperature during evening or night is lesser
because of no solar irradiance which also decreases the ambient air temperature
with passage of time. The solar air temperature for roof, wall and window from
May to September increases from 10 am to 6 pm due to daytime. It decreases
from 6 pm to 5 am due to evening and night time. Then it increases again from
5 am to 9 am due to sunrise. The solar air temperature is higher for roof as
compared to wall and window for all the months because of longer time of solar

Thermal Performance of an Insulated and Window Area Optimized House 1099
Journal of Engineering Science and Technology April 2018, Vol. 13(4)
irradiance on roof as compared to wall and window. It is slightly higher for
wall than that for window due to more absorptance for solar radiation of
wall material.
The maximum solar air temperature occurs around 6 pm in the evening for
roof, wall and window for all the months. It is slightly higher for June as
compared to May for roof, wall and window because of somewhat higher
ambient air temperature in June. The solar air temperature for August is
higher than September and lesser than July for roof, wall and window. This is
because ambient air temperature is slightly lesser in September and slightly
higher July as compared to August. The solar air temperature is higher for
May and June than that for July to September due to higher ambient air
temperature and solar irradiance in May and June. The maximum solar air
temperature for roof is around 61.6°C, 62.2°C, 53.3°C, 51.4°C and 49.9°C for
the month of May to September respectively. Its maximum value for wall is
around 46.8°C, 47.8°C, 41.2°C, 39.8°C and 37.8°C for the month of May to
September respectively. In case of window it has maximum value around
44.5°C, 45.1°C, 39.5°C, 37.4°C and 35.3°C for the month of May to
September respectively.
(a) Solar air temperature variation
for roof.
(b) Solar air temperature variation
for wall.
(c) Solar air temperature variation for window.
Fig. 3. Solar air temperature for roof, wall
and window for summer season.
20253035404550
10
:00
AM
1:0
0 P
M
4:0
0 P
M
7:0
0 P
M
10
:00
PM
1:0
0 A
M
4:0
0 A
M
7:0
0 A
M
May JuneJuly Aug.Sept.
Tem
per
ature
(°C
)
20253035404550
10
:00
AM
1:0
0 P
M
4:0
0 P
M
7:0
0 P
M
10
:00
PM
1:0
0 A
M
4:0
0 A
M
7:0
0 A
M
May JuneJuly Aug.Sept.
Tem
per
ature
(°C
)
20253035404550
10
:00
AM
1:0
0 P
M
4:0
0 P
M
7:0
0 P
M
10
:00
PM
1:0
0 A
M
4:0
0 A
M
7:0
0 A
M
May JuneJuly Aug.Sept.
Tem
per
ature
(°C
)

1100 R. K. Pal
Journal of Engineering Science and Technology April 2018, Vol. 13(4)
3.2. Heat interactions
The results of various heat interactions like heat gain from roof, wall and
window and heat loss due to ventilation for uninsulated and insulated &
window area optimized house are presented in Fig. 4. The heat gain from roof,
wall and window for uninsulated house (Figs. 4(a), (b) and (c)) is much higher
than that for insulated house (Figs. 4(f), (g) and (h)) from May to September
during the daytime. This is due to less overall heat transfer co-efficient for the
insulated house for roof and wall because of which less heat is transferred to the
house. In case of window due to smaller area of window after optimization
lesser amount of solar radiation enters the house. Due to the same reason
the heat loss from roof, wall and window is more during the night for
uninsulated house as compared to insulated & window area optimized house
from May to September.
In the uninsulated house the heat gain during the day and heat loss during
night for roof, wall and window is more for May and June as compared to July-
September. The heat gain is more in May and June because of higher solar air
temperature in May and June. The heat loss in the night is more in May and
June because of higher indoor air temperature due which higher temperature
difference exists between inside and outside. In the insulated house the heat
gain during the day for wall and window is more for May and June because of
higher solar air temperature in May and June. The heat for roof during the day
is almost same for all the months because of lesser overall heat transfer
coefficient for roof. Heat loss for the insulated house during the night is almost
same for all the months for roof, wall and window because of insulation and
window area optimization.
Heat gain due to ventilation during the day is slightly more in insulated
house (Fig. 4(d)) in comparison to uninsulated house (Fig. 4(i)) for May to
September. This is because the indoor air temperature is less in case of
insulated house as compared to uninsulated house which causes more
temperature difference in inside and outside of house. The heat loss due to
ventilation during the night is almost same for the uninsulated and the insulated
house for all the months during summers. The net heat gain during the day and
net heat loss during the night is more for the uninsulated house (Fig. 4(e)) as
compared to the insulated & window area optimized house (Fig. 4(j)) for all the
months of summers. This is because of the insulation for roof & wall and
smaller area for the window after optimization.
The net heat interaction for the insulated and the window area optimized
house is very less due the reason already explained. The reduction in heat gain
due to insulation and window area optimization is about 48% and 52%
respectively. Therefore very less fluctuation in indoor air temperature occurs in
the insulated house during the day and night as the heat gain or heat loss is very
less. Hence insulated house is more comfortable to live in throughout the day and
the night.

Thermal Performance of an Insulated and Window Area Optimized House 1101
Journal of Engineering Science and Technology April 2018, Vol. 13(4)
(a) Heat gain from roof for uninsulated
house.
(f) Heat gain from roof for insulated
house.
(b) Heat gain from wall for uninsulated
house.
(g) Heat gain from wall for insulated
house.
(c) Heat gain from window for
uninsulated house.
(h) Heat gain from window for
insulated house.
-0.6-0.10.40.91.41.92.4
10
:00
AM
1:0
0 P
M
4:0
0 P
M
7:0
0 P
M
10
:00
PM
1:0
0 A
M
4:0
0 A
M
7:0
0 A
M
May June
July Aug.
Sep.H
eat
gai
n(k
W)
-0.6-0.10.40.91.41.92.4
10
:00
AM
1:0
0 P
M4
:00
PM
7:0
0 P
M1
0:0
0 P
M1
:00
AM
4:0
0 A
M7
:00
AM
May June
July Aug.
Sep.
Hea
tgai
n(k
W)
-1-0.5
00.5
1
10
:00
AM
1:0
0 P
M
4:0
0 P
M
7:0
0 P
M
10
:00
PM
1:0
0 A
M
4:0
0 A
M
7:0
0 A
M
May June
July Aug.
Sep.
Hea
tgai
n(k
W)
-1-0.5
00.5
1
10
:00
AM
1:0
0 P
M
4:0
0 P
M
7:0
0 P
M
10
:00
PM
1:0
0 A
M
4:0
0 A
M
7:0
0 A
M
May June
July Aug.
Sep.
Hea
tgai
n(k
W)
-10
-5
0
5
10
10
:00
AM
1:0
0 P
M
4:0
0 P
M
7:0
0 P
M
10
:00
PM
1:0
0 A
M
4:0
0 A
M
7:0
0 A
M
May June July Aug. Sep.
Hea
tgai
n(k
W)
-10
-5
0
5
10
10
:00
AM
1:0
0 P
M
4:0
0 P
M
7:0
0 P
M
10
:00
PM
1:0
0 A
M
4:0
0 A
M
7:0
0 A
M
May June
July Aug.
Sep.
Hea
tgai
n(k
W)

1102 R. K. Pal
Journal of Engineering Science and Technology April 2018, Vol. 13(4)
(d) Heat loss due to ventilation for
uninsulated house.
(i) Heat loss due to ventilation for
insulated house.
(e) Net heat gain for uninsulated
house.
(j) Net heat gain for insulated
house.
Fig. 4. Various heat interactions for two types of houses for summer season.
3.3. Optimized window area
The window area was varied in the Eq. (14) to get the minimum value of indoor
air temperature (Fig. 5) for the month of June. Indoor air temperature decreases
with reduction in window area due to lesser heat inflow through the window. The
optimum value of window area is taken as 1.5 m2 as below this there will be
problem in day lighting as lesser sunlight will enter the house due to reduced
window area. The value of optimized area is then applied to all the months to
compute the indoor air temperature.
3.4. Indoor air temperature
The indoor air temperature measured and calculated analytically for the
uninsulated house for the month of June is presented in Fig. 6. The indoor air
temperature in both the cases is almost same during the day. The analytically
computed indoor air temperature is slightly higher than measured value during 6
pm to 10 pm.
-2-1.5
-1-0.5
00.5
11.5
2
10
:00
AM
1:0
0 P
M
4:0
0 P
M
7:0
0 P
M
10
:00
PM
1:0
0 A
M
4:0
0 A
M
7:0
0 A
M
May June
July Aug.
Sep.H
eat
loss
(kW
)
-2-1.5
-1-0.5
00.5
11.5
2
10
:00
AM
1:0
0 P
M
4:0
0 P
M
7:0
0 P
M
10
:00
PM
1:0
0 A
M
4:0
0 A
M
7:0
0 A
M
May June
July Aug.
Sep.
Hea
tlo
ss(k
W)
-15-10
-505
1015
10
:00
AM
1:0
0 P
M
4:0
0 P
M
7:0
0 P
M
10
:00
PM
1:0
0 A
M
4:0
0 A
M
7:0
0 A
M
May June
July Aug.
Sep.
Hea
tgai
n(k
W)
-15-10
-505
1015
10
:00
AM
1:0
0 P
M
4:0
0 P
M
7:0
0 P
M
10
:00
PM
1:0
0 A
M
4:0
0 A
M
7:0
0 A
M
May June
July Aug.
Sep.H
eat
gai
n(k
W)

Thermal Performance of an Insulated and Window Area Optimized House 1103
Journal of Engineering Science and Technology April 2018, Vol. 13(4)
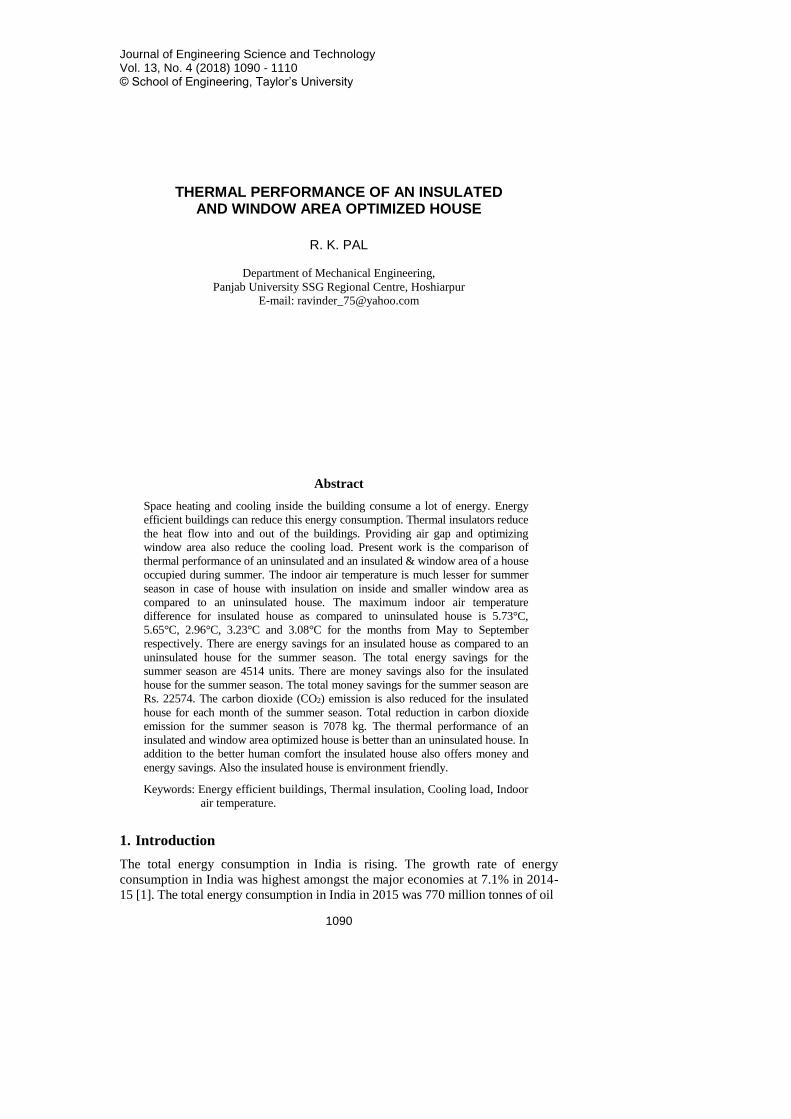
The comparison of indoor air temperature computed analytically in a house
made from common construction material and same house with an air gap & a
wooden layer on inside and smaller window area for the summer season is shown
in Fig. 7 and Tables 2 and 3. The indoor air temperature is much lesser in case of
house with insulation on inside and smaller window area for the whole day and
night except from 5 am to 9 am in the morning. During 5 am to 9 am the indoor
air temperature is slightly higher in the insulated houses. Lesser amount of net
heat gets transferred inside due to insulation layer which reduces the overall heat
transfer coefficient for most of the day and night. This reduces the indoor air
temperature in insulated house. Due to same reason the air temperature is slightly
higher in insulated house in the morning as the heat transfer is lesser from inside
to outside due to lesser heat transfer coefficient.
The reduction in indoor air temperature due to insulation and window area
optimization is about 48% and 52% respectively. The indoor air temperature
increases as the day progresses and decreases in the night due to higher solar air
temperature and higher amount of net heat gain in the day and lesser solar air
temperature and net heat loss during night for the uninsulated and insulated house.
The variation in the indoor air temperature is much higher for the uninsulated
house as compared to the insulated house. The difference in indoor air
temperature is more for the month of May and June due to higher outside
temperature. The difference in indoor temperature is slightly lesser for the month
of July to September as the outside temperature decreases for these months. The
maximum indoor air temperature difference for insulated house as compared to
uninsulated house is 5.73°C, 5.65°C, 2.96°C, 3.23°C and 3.08°C for the months
from May to September respectively.
Fig. 5. Window area optimization for
the insulated house in June.
Fig. 6. Indoor air temperature for
uninsulated house in June.
3.5. Energy savings
There are energy savings in an insulated and window area optimized house (Fig.
8(a) and Table 4) as compared to an uninsulated house for the summer season. This
is because of lesser indoor air temperature existing in case of an insulated house.
The energy savings are more for the month of May and June and lesser for the
months of July, August and September. This is because of more indoor temperature
difference for the insulated house as compared to uninsulated house for the months
303234363840424446
10
:00
AM
1:0
0 P
M
4:0
0 P
M
7:0
0 P
M
10
:00
PM
1:0
0 A
M
4:0
0 A
M
7:0
0 A
M
2.7 sq. m 2.4 sq. m2.1 sq. m 1.8 sq. m1.5 sq. m
Tem
per
ature
(°C
)
0
10
20
30
40
50
60
10
:00
AM
1:0
0 P
M
4:0
0 P
M
7:0
0 P
M
10
:00
PM
1:0
0 A
M
4:0
0 A
M
7:0
0 A
M
Measured Analytical
Tem
per
ature
(°C
)
1104 R. K. Pal
Journal of Engineering Science and Technology April 2018, Vol. 13(4)
of May and June. The amount of energy savings from the month May to the month
of September are 1170, 1240, 652, 762 and 690 units respectively. The maximum
energy saving for the insulated house is for the month of June due to maximum
indoor air temperature difference for this month as compared to an uninsulated
house. The total energy savings for the summer season is 4514 units.
(a) Indoor temperature variation in
May.
(d) Indoor temperature variation for
two houses in August.
(b) Indoor temperature variation in
June.
(e) Indoor temperature variation for
two houses in September.
(c) Indoor temperature variation for
two houses in July.
Fig. 7. Indoor air temperature for two types of houses for summer season.
27
32
37
42
10
:00
AM
1:0
0 P
M
4:0
0 P
M
7:0
0 P
M
10
:00
PM
1:0
0 A
M
4:0
0 A
M
7:0
0 A
M
Uninsulated Insulated
Tem
per
ature
(°C
)
27
32
37
42
10
:00
AM
1:0
0 P
M
4:0
0 P
M
7:0
0 P
M
10
:00
PM
1:0
0 A
M
4:0
0 A
M
7:0
0 A
M
Uninsulated Insulated
Tem
per
ature
(°C
)
27
32
37
42
10
:00
AM
1:0
0 P
M
4:0
0 P
M
7:0
0 P
M
10
:00
PM
1:0
0 A
M
4:0
0 A
M
7:0
0 A
M
Uninsulated Insulated
Tem
per
ature
(°C
)
27
32
37
42
10
:00
AM
1:0
0 P
M
4:0
0 P
M
7:0
0 P
M
10
:00
PM
1:0
0 A
M
4:0
0 A
M
7:0
0 A
M
Uninsulated Insulated
Tem
per
ature
(°C
)
27
32
37
42
10
:00
AM
1:0
0 P
M
4:0
0 P
M
7:0
0 P
M
10
:00
PM
1:0
0 A
M
4:0
0 A
M
7:0
0 A
M
Uninsulated Insulated
Tem
per
ature
(°C
)
Thermal Performance of an Insulated and Window Area Optimized House 1105
Journal of Engineering Science and Technology April 2018, Vol. 13(4)
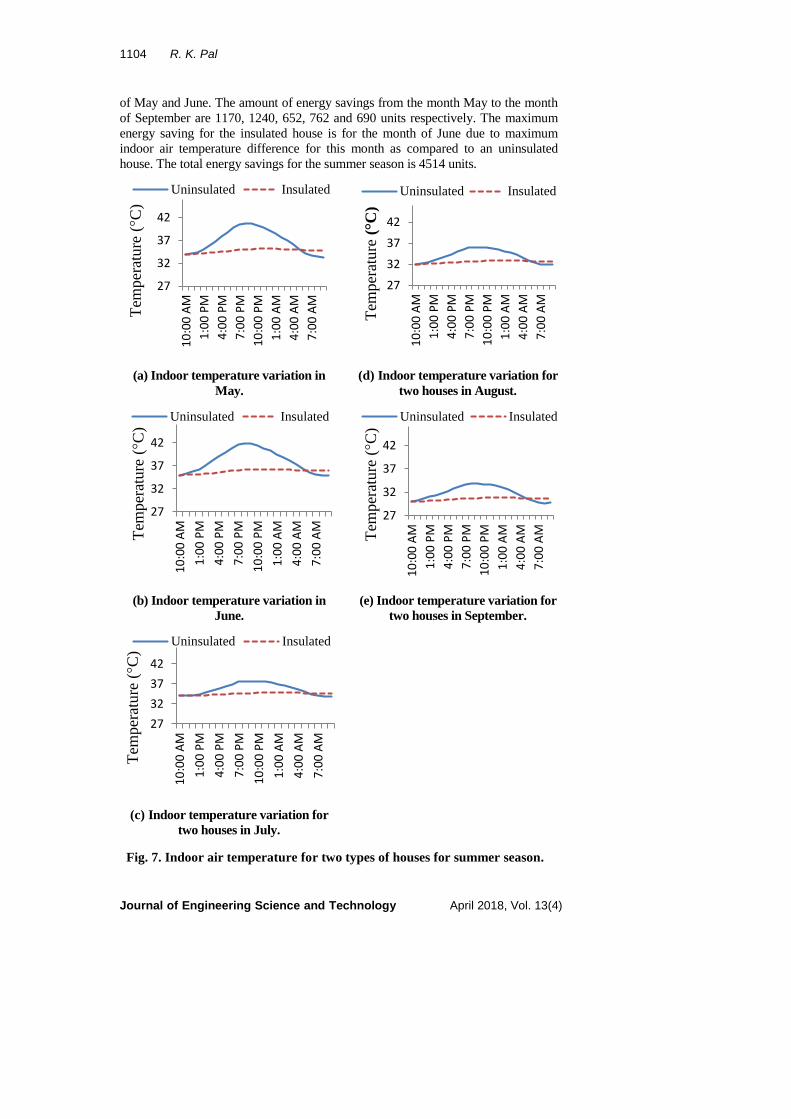
Table 2. Indoor air temperature variation from May to July.
3.6. Money savings
Money savings also attainable for the summer season (Fig. 8(b) and Table 4)
because of energy savings for an insulated and window area optimized house. The
money savings are more for the month of May and June due to more energy
savings for these months. The money savings are slightly lesser for other months.
The value of money savings from the month of May to the month of September
are 5851, 6200, 3261, 3810 and 3452 Rs. respectively. The maximum savings are
for the month of June due to more energy savings for this month. The total money
savings for the summer season are Rs. 22574.
3.7. Reduction in Carbon dioxide emission
Reduction in carbon dioxide emission (Fig. 8(c) and Table 4) is achievable for
each month of the summer season for an insulated and window area optimized
house. This is because of energy savings for each month of the summer season in
an insulated house. Which in turn will reduce the carbon dioxide emission as
lesser amount of energy is spent for cooling the house. The value of carbon
dioxide emission reduction for the months from May to September is 1835, 1944,
1022, 1195 and 1082 kg respectively. The total amount of carbon dioxide
emission reduction for the summer season is 7078 kg.
Time May June July
Tura (°C) Tira (°C) Tura (°C) Tira (°C) Tura (°C) Tira(°C)
10:00 AM 34 34 35 35 34 34
11:00 AM 34.12 34.04 35.22 35.05 34.05 34.03
12:00 PM 34.45 34.1 35.64 35.11 34.2 34.07
1:00 PM 34.99 34.17 36.24 35.19 34.46 34.12
2:00 PM 35.8 34.27 37.05 35.3 34.85 34.19
3:00 PM 36.78 34.4 37.98 35.42 35.35 34.26
4:00 PM 37.79 34.54 38.93 35.55 35.87 34.34
5:00 PM 38.8 34.68 39.85 35.69 36.41 34.43
6:00 PM 39.75 34.83 40.73 35.83 36.98 34.53
7:00 PM 40.54 34.97 41.46 35.97 37.49 34.62
8:00 PM 40.78 35.05 41.7 36.05 37.63 34.67
9:00 PM 40.75 35.11 41.67 36.1 37.67 34.7
10:00 PM 40.39 35.14 41.32 36.13 37.62 34.74
11:00 PM 39.83 35.15 40.78 36.14 37.49 34.76
12:00 AM 39.2 35.14 40.17 36.14 37.26 34.77
1:00 AM 38.49 35.13 39.5 36.13 36.95 34.78
2:00 AM 37.72 35.1 38.78 36.11 36.56 34.77
3:00 AM 36.89 35.07 38.02 36.08 36.1 34.76
4:00 AM 36.01 35.02 37.21 36.04 35.59 34.74
5:00 AM 35.09 34.96 36.37 35.98 35.03 34.71
6:00 AM 34.25 34.9 35.6 35.93 34.48 34.67
7:00 AM 33.6 34.84 35.04 35.89 34.05 34.64
8:00 AM 33.39 34.85 34.86 35.9 33.92 34.65
9:00 AM 33.34 34.86 34.84 35.92 33.87 34.68

1106 R. K. Pal
Journal of Engineering Science and Technology April 2018, Vol. 13(4)
Table 3. Indoor air temperature variation from August to September.
Time August September
Tura (°C) Tira (°C) Tura (°C) Tira (°C)
10:00 AM 32 32 30 30
11:00 AM 32.25 32.05 30.26 30.05
12:00 PM 32.55 32.1 30.61 30.11
1:00 PM 32.91 32.16 30.98 30.17
2:00 PM 33.37 32.24 31.38 30.24
3:00 PM 33.9 32.32 31.8 30.31
4:00 PM 34.42 32.41 32.23 30.39
5:00 PM 34.94 32.5 32.69 30.48
6:00 PM 35.46 32.59 33.21 30.57
7:00 PM 35.91 32.68 33.69 30.66
8:00 PM 36 32.73 33.81 30.71
9:00 PM 36 32.77 33.83 30.74
10:00 PM 35.92 32.8 33.76 30.78
11:00 PM 35.75 32.82 33.61 30.8
12:00 AM 35.49 32.83 33.37 30.81
1:00 AM 35.15 32.84 33.02 30.81
2:00 AM 34.74 32.83 32.55 30.8
3:00 AM 34.25 32.82 31.99 30.78
4:00 AM 33.67 32.79 31.38 30.75
5:00 AM 33.01 32.75 30.72 30.71
6:00 AM 32.39 32.71 30.14 30.67
7:00 AM 31.95 32.68 29.73 30.63
8:00 AM 31.88 32.69 29.68 30.65
9:00 AM 31.94 32.72 29.77 30.68
Table 4. Energy savings, money savings and carbon dioxide reduction.
Es (kWh) Ms (Rs.) C (kg)
May 1170 5851 1835
June 1240 6200 1944
July 652 3261 1022
Aug 762 3810 1195
Sep 690 3452 1082
Total 4514 22574 7078

Thermal Performance of an Insulated and Window Area Optimized House 1107
Journal of Engineering Science and Technology April 2018, Vol. 13(4)
(a) Energy savings. (c) Carbon dioxide emission
reduction.
(b) Money savings.
Fig. 8. Energy savings, money savings and carbon dioxide emission reduction
for house with insulation layer and reduced window area.
4. Conclusions
In the present work performance of an uninsulated house is compared with an
insulated and window area reduced house. Following conclusions are drawn.
The solar air temperature is highest for the month of June for roof, wall and
window and is same for the uninsulated and insulated and window area
optimized house.
The net heat gain for the uninsulated house is very high as compared to
the insulated and window area optimized house for the month of May
to September.
The thermal comfort of an insulated and window area optimized house is
better than an uninsulated house. In addition to the human comfort provided,
the insulated house provides the energy and the money savings. Also the
insulated house is friendlier to the environment.
The indoor air temperature is lesser in the insulated and window area
optimized house as compared to the uninsulated house. The maximum indoor
0
1000
2000
3000
4000
5000
6000
May
Jun
e
July
Au
g
Sep
Energy
Ener
gy
(kW
h)
0
500
1000
1500
2000
2500
May
Jun
e
July
Au
g
Sep
Carbon Dioxide
Red
uct
ion (
kg)
-1000
1000
3000
5000
7000
9000
May
Jun
e
July
Au
g
Sep
Money
Money
(R
s)

1108 R. K. Pal
Journal of Engineering Science and Technology April 2018, Vol. 13(4)
air temperature difference for the insulated house in comparison to the
uninsulated house is 5.73°C, 5.65°C, 2.96°C, 3.23°C and 3.08°C for the
month of May to September respectively.
Energy savings can be obtained for the insulated and window area optimized
house as compared to the uninsulated house for the summer season. The
amount of energy savings for the months from May to September are 1170,
1240, 652, 762 and 690 units respectively. The total energy savings for the
summer season are 4514 units.
Money can be saved for the insulated and window area optimized house for
the summer season. The value of money savings for the months from May to
September are 5851, 6200, 3261, 3810 and 3452 Rs. respectively. The total
savings for the summer season are Rs. 22574.
Reduction in carbon dioxide emission can be achieved for each month of the
summer season. The reduction in carbon dioxide emission for the months
from May to September is 1835, 1944, 1022, 1195 and 1082 kg respectively.
The total amount reduction in carbon dioxide emission for the summer
season is 7078 kg.
References
1. Anon. (2015). India beats major ecos in energy demand growth. Retrieved
June 3, 2017, from http://timesofindia. indiatimes.com/business/india-
business/India-beats-major-ecos-in-energy-demand-growth/articleshow/
47621066.cms.
2. Sahoo, S.K.; Varma, P.; Lall, K.P.; and Talwar, C.K. (2016). Energy
efficiency in India: achievements, challenges and legality. Energy Policy, 88,
495-503.
3. Sadineni, S.B.; Madala S.; and Boehm R.F. (2011). Passive building energy
savings: a review of building envelope components. Renewable and
Sustainable Energy Reviews, 15, 3617-3631.
4. Rawal, R.; and Shukla, Y. (2014). Residential buildings in India: Energy use
projections and savings potentials. Retrieved June 3, 2017, from
http://www.gbpn.org/sites/default/files/08.%20INDIA%20Baseline_TR_low.pdf.
5. Ionescu, C.; Baracu, T.; Gabriela-Elena, V.; Necula, H.; and Badea, A.
(2015). The historical evolution of the energy efficient buildings. Renewable
and Sustainable Energy Reviews, 49, 243-253.
6. Chwieduk, D. (2003). Towards sustainable energy buildings. Applied Energy,
76, 211-217.
7. Balaras, C.A.; Droutsa, K.; Argiriou, A.A.; and Asimakopoulos, D.N. (2000).
Potential for energy conservation in apartment buildings. Energy and
Buildings, 31(2), 143-54.
8. Raeissi, S.; and Taheri, M. (2000). Skytherm: an approach to year-round
thermal energy sufficient houses. Renewable Energy, 19, 527-43.
9. Al-Homoud, M.S. (2005). Performance characteristics and practical
applications of common building thermal insulation materials. Building and
Environment, 40, 353-366.

Thermal Performance of an Insulated and Window Area Optimized House 1109
Journal of Engineering Science and Technology April 2018, Vol. 13(4)
10. Nisson, J.D.; and Dutt, G. (1985). The super insulated home book. New
York: Wiley.
11. Feng, Y. (2004). Thermal design standards for energy efficiency of
residential buildings in hot summer/cold winter zones. Energy and Buildings,
36, 1309-1312.
12. Szokolay, S. (1984). Passive and low energy design for thermal and visual
comfort. Passive and Low Energy Ecotechniques, 3rd International PLEA,
Conference. Mexico City, Mex, 11-28.
13. Antinucci, M.; Asiain, D.; Fleury, B.; Lopez, J.; Maldonado, E.; Santamouris,
M.; Tombazis, A.; and Yannas, S. (1992). Passive and hybrid cooling of
buildings - state of the art. International Journal of Solar Energy, 11(3), 251.
14. Balaras, C.A. (1996). The role of thermal mass on the cooling load of
buildings. An overview of computational methods. Energy and Buildings,
24(1), 1-10.
15. Schulze, T.; and Eicker, U. (2013). Controlled natural ventilation for energy
efficient buildings. Energy and Buildings, 56, 221-232.
16. Sartori, I.; and Hestnes, A.G. (2007). Energy use in the life cycle of
conventional and low-energy buildings: a review article. Energy and
Buildings, 39, 249-257.
17. Panchabikesan, K.; Vellaisamy, K.; and Ramalingam V. (2017). Passive
cooling potential in buildings under various climatic conditions in India.
Renewable and Sustainable Energy Reviews, 78, 1236-1252.
18. Aggarwal, P.C. (1992). Review of passive systems and passive strategies for
natural heating and cooling of buildings in Libya. International Journal of
Energy Research, 16, 101-117.
19. Horsley, A.; France, C; and Quatermass, B. (2003), Delivering energy
efficient buildings: a design procedure to demonstrate environmental and
economic benefits. Construction Management and Economics, 21, 345-356.
20. Eaton, K.J.; and Amato, A. (1998). A comparative environmental life cycle
assessment of modern office buildings. Ascot: The Steel Construction Institute.
21. Smith, M.; Whitelegg, J.; and Williams, N. (1997). Life cycle analysis of
housing. Housing Studies, 12, 215-29.
22. Manju, S.; and Sagar, N. (2017). Progressing towards the development of
sustainable energy: A critical review on the current status, applications,
developmental barriers and prospects of solar photovoltaic systems in India.
Renewable and Sustainable Energy Reviews, 70, 298-313.
23. Chandel, S.S.; Sharma, A.; and Marwaha, B.M. (2016). Review of energy
efficiency initiatives and regulations for residential buildings in India.
Renewable and Sustainable Energy Reviews, 54, 1443-1458.
24. Halwatura, R.U.; and Jayasinghe, M.T.R. (2008). Thermal performance of
insulated roof slabs in tropical climates. Energy and Buildings, 40(7), 1153-60.
25. Pal, R.K. (2016). Analysis of a house with mud layer in roof for summers.
Journal of Mechanical Engineering and Technology, 8 (1), 31- 40.
26. Alvarado, J.L.; Terrell, J.W.; and Johnson, M.D. (2009). Passive cooling
systems for cement-based roofs. Building and Environment, 44(9), 1869-75.

1110 R. K. Pal
Journal of Engineering Science and Technology April 2018, Vol. 13(4)
27. Watt, M.; Johnson, A.; Ellis, M.; and Outhred, H. (1998). Life cycle air
emission from PV power systems. Progress in Photovoltaics Research
Applications, 6, 127-137.
28. Chel, A.; Nayak, J.K.; and Kaushik, G. (2008). Energy conservation in honey
storage building using trombe wall. Energy and Buildings, 40(9), 1643-1650.
29. Chel, A.; and Tiwari, G.N. (2009). Performance evaluation and life cycle cost
analysis of earth to air heat exchanger integrated with adobe building for
New Delhi composite climate. Energy and Buildings, 41, 56-66.