thermal imaging for pests detecting a review imaging for pests detecting ... a thermographic camera...
TRANSCRIPT

International Journal of Agriculture, Forestry and Plantation, Vol. 2 (February.)
ISSN 2462-1757 2016
10
THERMAL IMAGING FOR PESTS DETECTING—A REVIEW
Jwan Al-doski
Department of Civil Engineering,
Faculty of Engineering,Universiti Putra Malaysia,
43400, Serdang, Selangor, Malaysia
Email: [email protected]
Shattri Bin. Mansor
Department of Civil Engineering,
Faculty of Engineering, Universiti Putra Malaysia,
43400, Serdang, Selangor, Malaysia
Email: [email protected]
Helmi Zulhai Bin Mohd Shafri
Department of Civil Engineering,
Faculty of Engineering, Universiti Putra Malaysia,
43400, Serdang, Selangor, Malaysia
Email: [email protected]
ABSTRACT
Thermal remote sensing technology (thermography) is a non-destructive technique used to determine thermal properties of any
objects of interest. The principle of thermal remote sensing is the invisible radiation patterns of objects converted into visible
images and these images are called thermal images. These images can be acquired using portable, handheld or thermal sensors
that are coupled with optical systems mounted on an airplane or satellite. This technology has grown into an important
technology that is applied directly or indirectly in many applications such as civil engineering and industrial maintenance, etc.
The potential use of thermal remote sensing in agriculture includes nursery and greenhouse monitoring, irrigation scheduling,
plant disease detection, estimating fruit yield, evaluating the maturity of fruits and bruise detection in fruits and vegetables.
However, in recent years, the usage of thermal imaging is gaining popularity in pest detection due to the reductions in the cost of
the equipment and simple operating procedure. The purpose of this paper is two parts, the first part discusses about thermal
remote sensing system while the second part epitomize various studies conducted on the potential application of thermal imaging
system in pest detection.
Key words: Thermal Remote Sensing, Thermal Imaging, Pest Detection
Introduction
Global food security as determined by the balance of global food production and demand has become an important international
matter in recent years (Chen, et al. 2011; Dyson. 1999; Andersen, et al. 1999). In 2008, a rise in food prices brought about a
global crisis that caused political and economic instability in some developing countries (Timmer. 2008). It was estimated that
the request for food will continue to increase for another 40 years due to the continuous increase in human population. The
projections also indicate that an additional 70% of food production is required by 2050 to meet the needs (Timmer. 2008).
Currently, over one billion people are suffering from different situations of malnutrition due to lack of food supply and
approximately twice that population does not have access to sufficient nutrients or vitamins to meet their daily nutrition needs
(Conway. 2012) . The situation can be attributed to the continuous decline in the agricultural land area that causes a decrease in
productivity.
Although the decrease in agricultural productivity can be attributed to a variety of reasons, damages that caused by pests and
pathogens play a significant role in crop losses throughout the world. The losses in crop yield due to pest’s infections range
between 20% and 40% (Savary et al. 2012) . On average as can see in table 1, pests-induced losses of maize, rice and soybean
are estimated to be around 11%, potato is estimated to be around 10.9% and wheat and cotton are estimated to be around 8% and
12%, respectively (Oerke. 2006). As can see in figure 1 that insect can cause about 30% as total. In order to minimize the pests
induced damage in crops during growth, harvest and postharvest processing, as well as to maximize productivity and ensure
agricultural sustainability, advanced pests detection and prevention in crops are highly important.
Table1. Average global crop losses (%) due to various categories of pests in major crops
Crops Pests Weeds Pathogens Viruses Total
Cotton 12.3 8.6 7.2 0.7 28.8
Maize 9.6 10.5 8.5 2.7 31.3

International Journal of Agriculture, Forestry and Plantation, Vol. 2 (February.)
ISSN 2462-1757 2016
11
Rice 15.1 10.2 10.8 1.4 37.
Potato 10.9 8.3 14.5 6.6 40.3
Soybean 8.8 7.5 8.9 1.2 26.4
Wheat 7.9 7.7 10.2 2.4 28.2
Average 10.8 8.8 10 25
Source (Oerke. 2006)
Detection and identification of pests could be realized via both direct and indirect methods. Direct detection of pest’s methods
includes visual inspection approach, acoustic detection approach and chemical detection (Barber and Black. 2007). In these
methods, they are directly used to provide accurate identification the insect. However, they are considered unreliable for
measuring physical and chemical parameters, labor intensive, time consuming and only practical for areas of limited size
(Barber and Black. 2007). While, indirect methods are used to identify the pest’s infection through various remote sensing
techniques which include spectrophotometry, spectral line imaging, spectrometry, imaging of fluorescence, thermos-radiometry
and thermography (Barber and Black. 2007). Recently the thermography has been used for the identification, pest infestation
(Grossman. 2006). In this paper the thermal imaging that becomes a common detection method in insect detection is presented.
Figure1. Total annual loss in agriculture produce (%)
Source (Oerke. 2006)
Remote Sensing Systems
Remote sensing is the science or technology of acquiring information about the earth’s surface without physically touching it as
can see in figure 2. It uses sensors to measure and record the reflected and emitted electromagnetic radiation from the target area
in the field of view of the sensor instrument (Campbell. 2002; Lillesand and Chipman. 2014). The photographic cameras, video
and digital cameras, thermal camera and sensors, electro-mechanical scanners, and radar systems are most common remote
sensors and instruments that detect and record electromagnetic radiation from the target (John. 1999).
Figure 2. Optical remote sensing
Based on remote sensors, remote sensing system has been grouped in six groups as can see in figure3. During the last decades,
most of these systems for plant pest detection are been used (Roselyne and Ahmed. 2014; Rajendran. 2005). Because of, these
systems can provide information on both physiological processes such as passive fluorescence effects or thermal energy
dissipation, and chemical parameters of plant (leaf pigments, water content, and chlorophyll content) ongoing under stress as a
result of pest conditions. However, the thermal remote sensing is been used slightly.
Figure 3. Remote sensing system
International Journal of Agriculture, Forestry and Plantation, Vol. 2 (February.)
ISSN 2462-1757 2016
12
(Lillesand and Chipman. 2014)
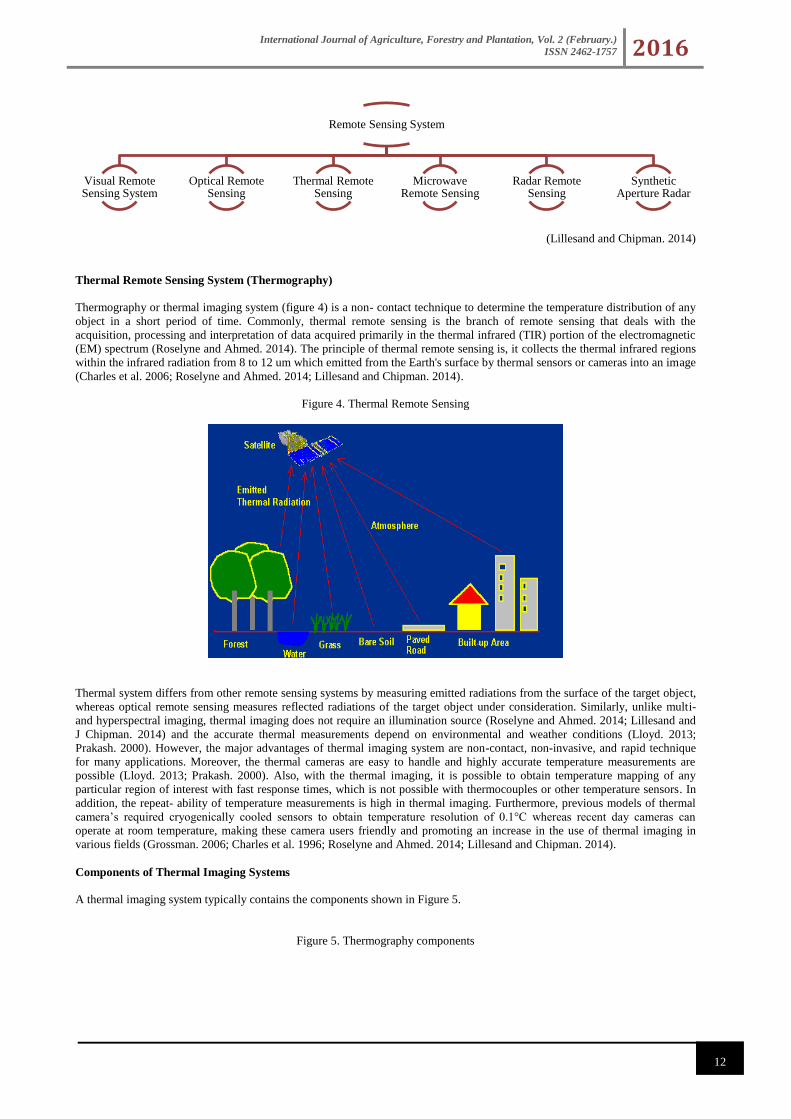
Thermal Remote Sensing System (Thermography)
Thermography or thermal imaging system (figure 4) is a non- contact technique to determine the temperature distribution of any
object in a short period of time. Commonly, thermal remote sensing is the branch of remote sensing that deals with the
acquisition, processing and interpretation of data acquired primarily in the thermal infrared (TIR) portion of the electromagnetic
(EM) spectrum (Roselyne and Ahmed. 2014). The principle of thermal remote sensing is, it collects the thermal infrared regions
within the infrared radiation from 8 to 12 um which emitted from the Earth's surface by thermal sensors or cameras into an image
(Charles et al. 2006; Roselyne and Ahmed. 2014; Lillesand and Chipman. 2014).
Figure 4. Thermal Remote Sensing
Thermal system differs from other remote sensing systems by measuring emitted radiations from the surface of the target object,
whereas optical remote sensing measures reflected radiations of the target object under consideration. Similarly, unlike multi-
and hyperspectral imaging, thermal imaging does not require an illumination source (Roselyne and Ahmed. 2014; Lillesand and
J Chipman. 2014) and the accurate thermal measurements depend on environmental and weather conditions (Lloyd. 2013;
Prakash. 2000). However, the major advantages of thermal imaging system are non-contact, non-invasive, and rapid technique
for many applications. Moreover, the thermal cameras are easy to handle and highly accurate temperature measurements are
possible (Lloyd. 2013; Prakash. 2000). Also, with the thermal imaging, it is possible to obtain temperature mapping of any
particular region of interest with fast response times, which is not possible with thermocouples or other temperature sensors. In
addition, the repeat- ability of temperature measurements is high in thermal imaging. Furthermore, previous models of thermal
camera’s required cryogenically cooled sensors to obtain temperature resolution of 0.1°C whereas recent day cameras can
operate at room temperature, making these camera users friendly and promoting an increase in the use of thermal imaging in
various fields (Grossman. 2006; Charles et al. 1996; Roselyne and Ahmed. 2014; Lillesand and Chipman. 2014).
Components of Thermal Imaging Systems
A thermal imaging system typically contains the components shown in Figure 5.
Figure 5. Thermography components
Remote Sensing System
Visual Remote Sensing System
Optical Remote Sensing
Thermal Remote Sensing
Microwave Remote Sensing
Radar Remote Sensing
Synthetic Aperture Radar

International Journal of Agriculture, Forestry and Plantation, Vol. 2 (February.)
ISSN 2462-1757 2016
13
1. Detectors and Lenses
Thermal imaging detectors operate on the principle, that when heated by incoming IR radiation their temperature increases and
the temperature changes are measured by any temperature-dependent mechanism, such as thermo-electric voltage, resistance or
pyroelectric voltage (Rogalski. 2003). The detectors used in thermal cameras may be broadly classified into three categories:
classic semi-conductors, novel semi-conductors, and thermal detectors (Holst. 2000). The classic semi-conductor includes
photoconductive and photovoltaic detector types. Schottky barrier photodiode (SBD) and bandgap engineered photodetectors are
the two types in the novel semi-conductor detectors. Similarly, bolometer and pyroelectric are the two available types of thermal
detectors (Holst. 2000). The lenses for thermal cameras are usually made of silicon (Si) or germanium (Ge) materials. In general,
Si is used for MWIR cameras and Ge is used in LWIR cameras. Both materials have good mechanical properties (non-
hygroscopic and do not break easily). While making proper design, infrared camera lenses can transmit close to 100% of incident
radiation (Holst. 2000).
2. Thermal Imaging Cameras
A thermographic camera (also called an infrared camera or thermal imaging camera) is a device that forms an image using
infrared radiation that similar to an image forms by a common camera using visible light. Thermal camera is designed to detect
radiation emitted from a sample in a specified waveband into an electrical signal which is then processed into an image.
Radiation in this part of the electromagnetic spectrum is referred to as infrared, or commonly IR, which is just beyond what the
human eye can see (Lloyd. 2013; Prakash. 2000). On the other hand, camera sensors can be built to detect and make use of this
type of radiation. A so-called day-and-night camera uses an IR-cut filter during daytime to filter out IR-light so it will not distort
the colors of images as perceived by the human eye. When the camera is in night mode, the IR-cut filter is removed.
Since the human eye is unable to see infrared light the camera displays the image in black and white. Near infrared light also
requires some kind of light source, either natural, such as moonlight, or man-made, such as street lights or a dedicated IR-lamp.
With advancement in electronics and instrumentation technology, there are several thermal camera models available in the
market at wide price ranges (Lloyd. 2013). Table2 explains various models of thermal cameras.
Table 2. Various models of thermal cameras
Camera Model Manufacturer Spectral
Range, mm
Temperature
Range
Thermal
Sensitivity
Detector Type Image
Size
Frame
Rate
AGEMA 570 LW FLIR Systems,
Oregon, USA
8–12 −20°C to 500°C;
−20°C to 1,500°C
(with filter)
0.1°C at
30°C
FPA, uncooled
microbolometer
320×240 60 Hz
AGEMA 880 LW FLIR Systems,
Oregon, USA
8−12 20°C to 1,500°C − 0.7 K at
30°C
HgCdTe, liquid
nitrogen, or
stirling cooled
NA 25 Hz
Infra-Eye 102A
Fujitsu, Tokyo, Japan 8−14 NA NA HgCdTe, liquid
nitrogen cooled
NA NA
Inframetrics
Model 760
Inframetrics,
Massachusetts, USA
8–12 −20°C to 400°C;
20°C to 1,500°C
(with filter)
0.1°C at
30°C
HgCdTe,
stirling cooled
NA 30 Hz
IR Snapshot 525 Alpine Components,
East Sussex, UK
8–12 0°C to 350°C;
−50°C to 650°C
0.1°C at
30°C
Uncooled 120×120 NA
Model D500 Raytheon Inc.,
Waltham, MA
7–14 NA NA NA 320×240 NA
ThermaCam
P25
FLIR Systems, Italy 7.5–13 −40°C to 120°C;
0°C to 500°C;
optional: 2,000°C
0.08°C at
30°C
FPA, uncooled
microbolometer
320×240 50– 60
Hz
ThermaCam
P65HS
FLIR Systems,
Oregon, USA
7.5–13 −40°C to 120°C ;
0°C to 500°C;
optional: 2,000°C
0.5 K at
30°C
FPA, uncooled
microbolometer
320×240
50–60
Hz

International Journal of Agriculture, Forestry and Plantation, Vol. 2 (February.)
ISSN 2462-1757 2016
14
ThermaCamTM
PM390;
ThermaCam
PM250
FLIR Systems,
Oregon, USA; FLIR
Systems;
Massachusetts, USA
3.4–5 −10°C to 450°C;
−20°C to 1,500°C
(with filter)
0.07°C at
30°C
Platinum
silicide;Stirling
cycle
256×256 60 Hz
ThermaCAM
SC500
FLIR Systems,
Ontario, Canada
7.5–13 −20°C to 500°C
optional: 2,000°C
0.07 K at
30°C
FPA
FPA, uncooled
microbolometer
320×240 50 Hz
ThermaCAM
SC545
FLIR Systems,
Oregon, USA
7.5–13 −20°C to 350°C
optional: 1,000°C
0.1°C at
30°C
FPA, uncooled
microbolometer
320×240
50–60
Hz
ThermaCAM
SC2000
FLIR Systems,
Oregon, USA
7.5–13 −40°C to 2,000°C 0.1°C at
30°C
FPA, uncooled
microbolometer
320×240 50–60
Hz
TH7102MX NEC, Tokyo, Japan 8–14 −40°C to 2,000°C 0.08°C at
30°C
Uncooled FPA 320×240 60 Hz
hermosensorik
CMT 384SM/M
TThermosensorik
GmbH, Germany
1.5–5 &
3.4– 5.0
NA NA HgCdTe,
stirling cooled
384×288 50–
60 Hz
Thermovision
A40M
FLIR Systems,
Danderyd, Sweden
7.5–13
−40°C to 120°C ;
0°C to 500°C;
optional: 2,000°C
0.08°C at
30°C
FPA, uncooled
microbolometer
320×240 50–
60 Hz
Thermovision
550
AGEMA Infrared
Systems, New Jersey,
USA
3.6–5 -20°C to 250°C;
1,500°C (with
filter)
0.1°C at
30°C
FPA, uncooled
microbolometer
320×240 50–
60 Hz
VARIOSCAN
2011
Jenoptic Laser, Jena,
Germany
10 −40°C to 1,200°C 0.1 K at
30°C
HgCdTe, liquid
nitrogen cooled
NA NA
VARIOSCAN
3021 ST
Jenoptic Laser, Jena,
Germany
8-12 −40C to 1,200°C 0.03 K at
30°C
HgCdTe,
stirling cooled
360×240 NA
VIGOcam v50 Vigo Systems,
Warsaw, Poland
8–14 −10°C to 100°C
or 0 to 350°C,
optional: 1,500°C
0.08°C at
30°C
FPAUncooled
microbolometer
384×288 30–
60 Hz
Source (Roselyne and Ahmed. 2014)
3. Data
Generally, the data has collected by thermal remote sensing systems are recorded on film and/or magnetic tape and the
temperature resolution of current sensors can reach 0.1 °C. For analysis, an image of relative radiant temperatures (a
thermography) is depicted in gray levels, with warmer temperatures shown in light tones, and cooler temperatures in dark tones.
The Each pixel of the image is related to the temperature value of the object’s surface and may be illustrated and analyzed in
false color images (figure 6.). The performance of thermographic cameras is characterized by thermal sensitivity (thermal range,
measurement precision) image resolution (image’s pixel size, number of image pixels, depth of focus) and scan speed (Lloyd.
2013; Prakash. 2000).
Figure 6. The Plant false color images from FLIR SC645 thermal camera
Concepts of Thermography
In thermal remote sensing, radiations emitted by ground objects are measured for temperature estimation. These measurements
give the radiant temperature of a body which depends on two factors; kinetic temperature and emissivity (Prakash. 2000). Figure
7 presents the various factors affecting the radiant temperature and these are further discussed in the following paragraphs.
Figure 7. Factors controlling radiant temperature

International Journal of Agriculture, Forestry and Plantation, Vol. 2 (February.)
ISSN 2462-1757 2016
15
Source (Prakash. 2000)
a) Thermal Region of the Electromagnetic (EM) Spectrum /Wavelength / Spectral Range
Primarily, thermal remote sensing collects data acquired in the thermal infrared (TIR) portion of the electromagnetic (EM)
spectrum. Commonly, the EM ranges from the very short wavelengths of the gamma-ray region (measured in fractions of
nanometers) to the long wavelengths of the radio region (measured in hundreds of meters) (Lillesand and Chipman. 2014; Frank
and Samson. 2015). This is divided on the basis of wavelength into regions that are described in table 3 and shows the various
regions in figure 8. The portion of the electromagnetic spectrum, which is of interest in thermal remote sensing is the infrared
(IR) region (Frank and Samson. 2015). It covers the wavelength range from approximately 0.7 µm to 100 µm - more than 100
times as wide as the visible portion (Frank and Samson. 2015).
Figure 8. Electromagnetic (EM) Spectrum
Visible Infrared
The infrared region can be divided into two categories based on their radiation properties the reflected IR, and the emitted
or thermal IR as can see in table 3. Radiation in the reflected IR region covers wavelengths from approximately 0.7 µm to 3.0
µm, and is used for remote sensing purposes in ways very similar to radiation in the visible portion. While, the region from 0.7 to
0.9 µm is detectable with film and is called the photographic IR band. The Infrared region is further divided into the following
bands: Near Infrared (NIR): 0.7 to 1.3 µm; Short Wavelength Infrared (SWIR): 1.3 to 3 µm; Mid Wavelength Infrared (MWIR):
3 to 8 µm; Thermal: 8 to 14 µm; Far Infrared (FIR): longer than 14 µm-1mm. The thermal IR region, covering a range of 3.0 µm
to 100 µm is quite different than the visible and reflected IR portions, as this energy is essentially the radiation that is emitted
from the Earth's surface in the form of heat. A thermal wavelength region in terrestrial remote sensing ranges from 3 to 35 µm
Radiant
Temperature
Emissivity
Kinetic
temperature
Heat Budget
Thermal
properties
Solar heating
Longwave upwelling
radiation
Downwelling
radiation
Anomalous heat
sources
Solar elevation
Cloud cover
Atmospheric
conditions
Topographic
altitude
Thermal
conductivity
Specific heat
Heat capacity
Thermal diffusivity
Thermal inertia

International Journal of Agriculture, Forestry and Plantation, Vol. 2 (February.)
ISSN 2462-1757 2016
16
but interpretation of the data in 3 - 5 µm is complicated due to overlap with solar reflection in day imagery and 17 - 25 µm
regions are still not well investigated. As a consequence 8 - 14 µm regions have been of greatest interest in thermal remote
sensing since this is where the atmosphere is fairly transparent and the signal is only lightly attenuated by atmospheric absorption
(Frank and Samson. 2015). A number of factors affect the amount of thermal infrared radiation reflected or emitted from the
land surface. These include; variations in sun angle, composition, density, and texture of the components of the land, topography,
moisture at the surface, climate, vegetation canopy characteristics and land cover (Lloyd. 2013; Prakash. 2000b; Frank and
Samson. 2015).
Table 3. Electromagnetic (EM) Spectrum regions
Regions Wavelength Frequency
Gamma Rays <1 × 10-11 nm >3 × 10¹⁹
X- Rays 1 × 10-11 -1 × 10⁻⁸ 3 × 10¹⁶ -3 × 10¹⁹
Ultraviolet 0.001—0.4 um 750—3000 THz
Visible 0.4—0.7 um 430—750 THz
Infr
are
d Reflected IR Near Infrared
Shortwave Infrared
0.7—1.3 um
1.3—3.0 um
230—430 THz
100—230 THz
Thermal IR Intermediate Infrared 3—8 um 38—100 THz
Thermal Infrared
Far Infrared
8—14 um
14 um —1 mm
22—38 THz
0.3--22 THz
Ra
dio
wa
ve
Microwave Millimeter 1—10mm 30--300 GHz
Centimeter 1—10 cm 3—30 GHz
Decimeter 0.1—1 m 0.3—3 MHz
Very Shot Wave 1-10 m 30—300MHz
Short Wave 10—100m 3—30MHz
Medium Wave 0.1—1 km 0.3-3MHZ
Long Wave 1—10 km 30-300KHz
Very Long Wave 10—100km 3—30KHz
Source (Frank and Samson. 2015)
b) Spectral Emissivity and Kinetic Temperature
Thermal remote sensing exploits the fact that everything above absolute zero (0 K or -273.15 °C or –459 °F) emits radiation in
the infrared range of the electromagnetic spectrum. How much energy is radiated, and at which wavelengths, depends on the
emissivity of the surface and on its kinetic temperature (Prakash. 2000). Emissivity is the emitting ability of a real material
compared to that of a black body, and is a spectral property that varies with composition of material and the geometric
configuration of the surface. Emissivity denoted by epsilon (ε) is a ratio and varies between 0 and 1. For most natural materials,
it ranges between 0.7 and 0.95. Kinetic temperature is the surface temperature of a body/ground and is a measure of the amount
of heat energy contained in it. It is measured in different units, such as in Kelvin (K); degrees Centigrade (°C); degrees
Fahrenheit (°F).
The black body is a theoretical object that absorbs and then emits all incident energy at all wavelengths. This means that the
emissivity of such an object is by definition 1. Needless to say, such an object is only imaginary and no natural substance is an
ideal black body (Prakash. 2000). Factors Affecting the Kinetic Temperature can be categorized in two broad groups - heat
energy budget and thermal properties of the materials. The heat energy budget includes factors such as solar heating, longwave
upwelling and down welling radiations, heat transfer at the earth-atmosphere interface and active thermal sources such as fires,
volcanoes, etc. Thermal properties of materials include factors such as thermal conductivity, specific heat, density, heat capacity,
thermal diffusivity and thermal inertia of the material (Prakash. 2000).
c) Atmospheric windows
Because of the barriers, particles and gases, the earth’s atmosphere is not completely transparent to electromagnetic radiation. It
selectively transmits radiation of certain wavelengths (Lillesand and Chipman. 2014). Those wavelengths that are relatively
easily transmitted through the atmosphere are referred to as atmospheric windows. Positions, extents and effectiveness of
atmospheric windows are determined by the absorption spectra of atmosphere gases. Atmospheric windows define the
wavelengths that can be used for remote sensing (as can see in figure 9). Absorption by the atmosphere has its maximum
influence on wavelengths shorter than 0.3 µm and a minimum impact on wavelengths greater than 6 mm. Between the two
wavelengths, there are a number of important windows that coincide with significant levels of solar radiation and heat energy
emitted by the earth. These windows include UV and visible to NIR (0.3–1.1 µm), mid-infrared (1.5–1.8 µm and 2.0–2.4 µm),
thermal (3–5 µm and 8–14 µm) and microwave (>6 µm) (Lillesand and Chipman. 2014).
Figure 9. Atmospheric transmittance window

International Journal of Agriculture, Forestry and Plantation, Vol. 2 (February.)
ISSN 2462-1757 2016
17
d) Radiant Temperature
The radiant temperature (TR) is the actual temperature obtained in a remote sensing measurement and, as mentioned earlier,
depends on actual or kinetic temperature (TK) of the body and the its emissivity (ε) (Prakash. 2000). The total radiations emitted
by the nonblack body (natural surfaces) are given by
(1)
Where σ is the Stefan-Boltzmann's constant. This describes the relation between the radiant temperature and kinetic temperature
of a body as
(2)
From the above equation, and the knowledge that all natural materials are non-black bodies with emissivity less than one, it is
clear that the radiant temperature (temperature estimated from remote sensing data) is always less than the actual surface
temperature of the body by a factor e 1/4. The total amount of radiations emitted by a body can also be measured using Planck'
equation which gives:
(3)
Where
Wl is the spectral emittance, h is the Planck's constant (6.62 ⋅10−34 Js), c is the speed of light (3⋅10 8 ms -1), l is the wavelength
in metres, k is Boltzmann's constant (1.38 ⋅10 −23 JK -1), T is the temperature in K and e l is the spectral emissivity. This
formula also implies that with the rise in temperature of the ground objects, there is an increase in the intensity of the emitted
radiations, with the peak shifting towards shorter wavelengths. Inverting Planck's equation, we get
(4)
Issues of Thermograph

International Journal of Agriculture, Forestry and Plantation, Vol. 2 (February.)
ISSN 2462-1757 2016
18
Due to the fundamental difference between remote sensing in the thermal infrared region and the other regions of the EM
spectrum, there are some issues peculiar and pertinent for thermal remote sensing (Prakash. 2000). Some of these relate to the
mode of acquisition, calibration, radiometric and geometric correction, and are discussed in the following sections:
1. Data acquisition: Modes and platforms
Prakash, (2000) mentioned, there are three different aspects which must be considered while talking about the mode of thermal
data acquisition. These are:
a) Active versus passive mode:
Most of the thermal sensors acquire data passively, i.e. they measure the radiations emitted naturally from the target/ground.
Data can also be acquired in the TIR actively deploying laser beams (LIDAR). However, these techniques are not well
researched and are only in the infancy.
b) Broadband versus multispectral mode:
For the broadband thermal sensing, in general the 8 to 14 µm atmospheric window is utilized. However, some space borne
thermal sensors such as Landsat Thematic Mapper Band 6 operate in the wavelength range of 10.4 to 12.6 µm to avoid the ozone
absorption peak which is located at 9.6 µm. The multispectral thermal channels, such as those in the ASTER platform, are
targeted especially for geological applications.
c) Daytime versus night-time acquisition:
Thermal data can be acquired during the day and during the night. For some applications, it is useful to have data from both the
times. However, for many applications night-time or more specifically pre-dawn images are preferred as during this time the
effect of differential solar heating is the minimal. The platforms for such data acquisitions range from satellites, aircrafts to
ground based scanners (Prakash. 2000).
2. Spatial resolution and geometric correction
Most thermal sensors / camera have onboard recording and calibration systems. Two black bodies (BB) commonly known as
BB1 and BB2 are setup which controls the radiometric calibration of the acquired data (Prakash. 2000). As the sensors measure
emitted radiations, there is also a heating effect and constant cooling of the sensors is required. This poses a physical limit to the
measuring capability of the sensors. The coarse spatial resolution, especially of satellite borne broadband thermal data poses
some additional problems in geometrically registering it to other data, especially when the latter has a much higher spatial
resolution. Identification of corresponding reliable control points on data sets with such wide differences in spatial resolution is
not only difficult, but when tried may result in unacceptable transformation results. Alternate approaches of co-registration must
be thought of. This may be done by first registering the thermal image to another image with intermediate spatial resolution and
in the next step to the target high resolution image (Prakash. 2000).
Thermal Remote Sensing Applications
Since the applications of thermography developed in the1960th for civil sector, it was mainly used to monitor thermal bridging in
buildings and overheating processes, like engines and devices in electronics and the energy industry. Further, thermal imaging
has a wide application in various fields such as Global Sea Surface Temperature (SST) Field (figure11), Civil Engineering,
Industrial Maintenance, Aero-Space, Medicine, Fire Area (figure10), Pharmacy, Electrical, Mechanical, Veterinary and Civil
Engineering for a long time (Lloyd. 2013; Prakash. 2000; Michael and Möllmann. 2010).Due to the reductions in the cost of the
equipment and simple operating procedure that have created opportunities for its application in several fields of agricultural and
it is presently refined for integration into precision farming (Lloyd. 2013; Prakash. 2000). Therefore, thermal imaging has
become a potential tool for many applications in agriculture, starting from pre-harvesting operations like field nursery, irrigation
scheduling (Jones, 1999), yield forecasting (Stajnko et al., 2004), harvesting, green houses, termite attack, farm machinery and
post-harvest operations like maturity evaluation, bruise detection (Varith et al., 2003), detection of foreign bodies in food,
determining heat distribution in the cooking of food, and wood drying etc. Today, several utilizations in metrology and
especially pest management can be observed. However, there is slight applications of this technology in detecting insect.
Figure 10. This is a true-color image (at 500 m resolution) acquired by MODIS on 9 July 2001, over the Sumatra and Peninsular
Malaysia area. Hotspots detected by the MODIS thermal infrared bands are indicated as red dots in the image. Smoke plumes
can be seen spreading northwards from the fire area towards the Northern part of Peninsular Malaysia.

International Journal of Agriculture, Forestry and Plantation, Vol. 2 (February.)
ISSN 2462-1757 2016
19
Figure 11. 50-km resolution Global Sea Surface Temperature (SST) Field for the period 11 to 14 August 2001 derived from
NOAA AVHRR thermal infrared data. Occurrence of abnormal climatic conditions such as the El-Nino can be predicted by the
observations of the SST anomaly, i.e. the deviation of the daily SST, from the mean SST. (Credit: NOAA/NESDIS)
Grain Storage Insect Detection
The on time detection and tracing insect infestation in stored grains play a vital role in order to take necessary action for insect
control. Several methods been used for insect detection in grain such as traditional methods which include visual inspection,
sieving, insect traps, insect fragment inspection, and floatation. Most of these methods have one or several drawbacks such as
being subjective, destructive, inaccurate, time consuming, and unable to detect internal insect infestation. Moreover, they are
powerless to detect low-level internal infestations and have not shown the potential for automated inspection. Additionally, the
methods that cited by Singh et al. (2009) namely enzyme-linked immunosorbent assays (Brader et al., 2002), carbon dioxide and
uric acid measurement (Karunakaran et al., 2004), electronic nose (Zhang and Wang, 2007), acid hydrolysis (Brader et al., 2002),
electrical conductance (Pearson and Brabec, 2007), magnetic resonance imaging (MRI) (Chambers et al., 1984), computed
tomography (Toews et al., 2006), acoustic impact emissions (Pearson et al., 2007) are used for insect detection in grain most of
them are time consuming. For real-time detection of insect-damaged grain, non-destructive, rapid, and accurate method is
required. Consequently, thermal imaging offers a new approach to detect the insects in grain storage. It is easier and better to
prevent an insect infestation than to treat an established infestation. Some examples of the major insects of stored grain are been
detected using thermal imaging are summarized in the following enumeration:
a) Rusty Grain Beetle
The rusty grain beetle, Cryptolestes ferrugineus (Stephens) (Coleoptera: Cucujidae), is the most serious and common insect pest
of stored grain in western Canada (White et al., 1995; Agriculture and Agri-Food Canada, 2002). The adults of this species,
when acclimatized, can withstand -10 C for several weeks (White et al., 1995). In some storage seasons, the infestation by this
species is severe. For example, during 1983, up to 45% of farm granaries in Manitoba were infested by C. ferrugineus
(Agriculture and Agri-Food Canada, 2002). If the grain is infested with one or more detectable live stored-product insects, then it
is not allowed to enter the Canadian grain handling system.
Figure12. Rusty grain beetle in wheat

International Journal of Agriculture, Forestry and Plantation, Vol. 2 (February.)
ISSN 2462-1757 2016
20
The use of thermal imaging offers an alternative method to detect an insect infestation. Because, the respiration of insects results
heat production, higher than that of the grain (Cofie-Agblor et al., 1995a, b, 1996a, b; Damcevski et al., 1998;Emekci et al.,
2002, 2004). Therefore, while mapping the surface temperature of the grain, the insect may be detected. Based on what is stated,
Manickavasagan et al., 2008 used an infrared thermal imaging system consists of camera ThermaCAM SC500, Control panel,
Microwave applicator, Conveyor, Thermal camera and Data acquisition system as can see in figure 13 to detect infestation by C.
ferrugineus inside wheat kernels. This system was developed to detect infestation by six developmental stages (four larval
instars, pupae and adults) of C. ferrugineus under the seed coat on the germ of the wheat kernels. The artificially infested wheat
kernels were removed from the incubation room (30C0), refrigerated (5 C0) for 60 s, maintained at ambient conditions for 20 s,
and imaged using a thermal camera to identify each developmental stage (n= 283). The means of the highest 5% and 10% of all
temperature values on the surface of the grain were significantly higher (α=0.05) for grains having young larvae inside and lower
for grains having pupae inside. Temperature distribution on the surface of the infested kernels with different stages of C.
ferrugineus was highly correlated with the respiration rate of each developmental stage (r=0.83–0.91). The overall classification
accuracy for a quadratic function was 83.5% and 77.7% for infested and sound kernels, respectively, and for a linear function, it
was 77.6% and 83.0% for infested and sound kernels, respectively, in pairwise discriminations. They concluded that thermal
imaging has the potential to identify whether the grain is infested or not, but is less effective in identifying which developmental
stage is present.
Figure13. Thermal imaging system for rusty grain beetle detection, 1. Control panel 2. Microwave applicator 3. Conveyor 4.
Thermal camera 5. Data acquisition system
b) Cowpea Seed Beetle
Cowpea seed beetle Callosobruchus maculatus, is a species of beetle known generally as the cowpea weevil or cowpea seed
beetle. It is a member of the leaf beetle family, Chrysomelidae. This common pest of stored legumes has a cosmopolitan
distribution, occurring on every continent except Antarctica. The beetle most likely originated in West Africa and moved around
the globe with the trade of legumes and other crops (Tran and Credland. 1995). In the southern United States, cowpea seed beetle
infestation is one of the major reasons for the losses pulse loss during storage as can see in figure14. The cowpea weevil is an
internal feeder. The life cycle starts when the female deposits her eggs on the outside of the bean. The larvae bore into the bean
and several larvae infest the same bean. Upon maturity, the larvae pupate near the surface of the bean and then emerge from the
bean leaving numerous holes in the bean. Huge populations can quickly develop, especially under ideal conditions of 90ºF and
90% humidity. The first indication of an infestation is often the presence of numerous flying weevils. Usually, the infested bag,
box or storage bin of cowpeas or other beans is so infested that weevils are forced to leave the container in search of fresh beans
on which to lay their eggs. Cowpea weevils “play dead” when disturbed and may take up to five minutes to resume movement
(Raina, 1970; Handbook on Bean Beetles). In India, Cowpea seed beetle causes a major portion of storage losses in pulses
especially in Mung bean (Vigna radiata). The mung bean is a major pulse crop grown in India and other parts of the world and
consumed by human beings for its high protein content. Detection of cowpea seed beetle at early stages of its life stages could
help to implement suitable control practices for insect disinfestations in order to minimize the storage losses.
Figure14. Bean cowpea weevils in the bean

International Journal of Agriculture, Forestry and Plantation, Vol. 2 (February.)
ISSN 2462-1757 2016
21
Conventional techniques to detect cowpea seed beetle infestation are destructive and time intensive processes. This issue been
addressed by Chelladurai et al., (2012). They applied thermal images of un-infested mung beans and beans infested with egg,
larval, pupal stages of Cowpea seed beetle along with completely infested mung beans (hollowed out) were acquired using an
infrared thermal camera. The thermal system consist of; Plate heater, thermal camera, Close-up lens, Thermocol box with ice,
PID controller, and Data acquisition system as can see in figure 15. Furthermore, the classification models (linear and quadratic
discriminant (LDA and QDA) classification models) were developed based on the extracted features as image processing
techniques from thermal images. LDA models gave 55.24-77.84% classification accuracies, and QDA classifiers had
classification accuracies of 75.45-91%. The QDA classification model correctly identified more than 80% mung beans infested
with initial stages of C. maculatus infestation. In conclusion, the results have proven that thermal imaging has a potential to
detect the C. maculatus infestation in mung beans. Classification accuracies of the LDA models were low (55.24-77.84%)
compared with the QDA classifiers (75.45-91%). The QDA classification model correctly identified more than 80% mung beans
infested with initial stages of C. maculatus infestation.
Figure 15. Thermal imaging system for cowpea seed beetle; 1. Plate heater, 2. Thermal camera, 3. Close-up lens, 4. Thermocol
box with ice 5. PID controller, 6. Data acquisition system
Young Trees, Insect Detection
Trees and shrubs can tolerate substantial foliar, loss caused by feeding insects. In fact, healthy plants can have every single leaf
eaten off and still survive. Plants have latent buds which do not sprout into leaves unless needed. So, of a leaf is eaten away or
extensively damaged by insects, the latent bud sprouts to form a new leaf. If a leaf is only half eaten away, the remaining green
tissue will continue to conduct photosynthesis and provide food for the plant. Because trees and shrubs have so many leaves,
losing a few, or parts of many leaves, is really not harmful. However, if a tree or shrub is subjected to repeated defoliation by
insects, it can stress the plant and make it more susceptible to infestation by other insects. Severe, repeated insect infestation may
warrant treatment. Insects are less likely to attack healthy trees and shrubs. However, a plant that is already under stress for some
reason, such as drought, flooding, climate, poor pruning, etc., is much more likely to have problems with insects. Young, newly
planted trees may also be at higher risk for damage from insects. While large trees are usually able to handle the stress of
defoliation by insect feeding, young trees with few leaves are more susceptible to long-term damage. Because young, newly
planted trees are already stressed from being transplanted, insecticide treatments may be warranted to reduce further stress.
Detection insect in young tree is very difficult, Thermal imagery remote sensing been used recently for detecting some of
common insect, for example:
a) White Pine Cone Beetle
The white pine cone beetle Conophthorus coniperda, is found throughout the range of eastern white pine, from eastern Canada
(Quebec, Ontario, Nova Scotia), south to North Carolina, and west to Minnesota. The white pine cone beetle infests cones of

International Journal of Agriculture, Forestry and Plantation, Vol. 2 (February.)
ISSN 2462-1757 2016
22
eastern white pine (Pinus strobus L.) and is an important pest of seed production in natural stands and in seed orchards (figure
16). Cones are initially attacked by adult female beetles that start tunneling in the cone stalk or base. This severs the conductive
tissue that connects the twig and cone, killing the cone. A small pitch tube generally marks the entry point. Individual female
beetles extend an egg gallery down the central axis of a cone. Eggs are laid along this gallery. Larvae feed on seeds and
associated tissues until they reach maturity. The larvae then pupate, and later emerge as adults, which darken over a few days
(Stephen Takács et al. 2008).
Figure16. White pine cone beetle
Development from egg to adult occurs in one growing season, and there is one generation per year. Female beetles can attack and
oviposit in more than one cone. Infested cones stop growing in length after they are attacked. So, cones attacked in the early
spring will be very small when they die, while cones attacked late in the summer are much larger in size. Infested cones shrivel,
turn brown, and become hard. Because stalks of infested cones are severed, they can easily be removed by hand from a branch.
Un-infested cones or cones attacked by other seed and cone insects, in contrast, adhere tightly to branches and may require a
hand-clipper to remove. Infested cones eventually fall from trees, and beetles spend the winter within infested cones on the forest
floor. In early spring, beetles chew emergence holes and fly from cones on the ground into tree crowns where they locate the new
host material. This is the most important pest of white pine seed orchards, sometimes destroying most or all of a developing seed
crop. Damage is concentrated on second year cones, but first year cone lets are also attacked. (Stephen Takács et al. 2008).
Detection of beetle attacks in white pine seed orchards have been addressed using thermal remote sensing by Stephen Takács et
al., in 2008. They discovered that the white pine cone beetle dines on pine cone seeds, it uses a special ability to find its next
meal. It senses the pine cones temperature. As part of being alive, all living things give off heat and infrared light energy. While
this wavelength of light cannot be seen by humans, they have found that the white pine cone seed-eating beetle is able to detect
infrared energy (figure 18). The camera’s lens showed that the pine cones actually are hotter than the needles as can see in figure
17. The cones run 15 degrees Celsius warmer than the surrounding needles all year around. In conclusion, there is a difference in
temperature between pine cones and the needles about 15 degrees Celsius warmer than the surrounding needles. In addition, the
beetles are able to detect infrared energy which is used typically to find pine cones as a next meal.
Figure 17. The pine cones temperature and needles
Figure 18. The cones of white pine that attach by beetles

International Journal of Agriculture, Forestry and Plantation, Vol. 2 (February.)
ISSN 2462-1757 2016
23
Thermal image Natural color image
b) Australian ‘fire-beetle’
The Australian ‘fire-beetle’ Merimna atrata (Buprestidae) bears its name because this so-called pyrophilous beetle head for
forest fires (figure 19), (Schmitz and Schmitz 2002). M. atrata is the only species of the genus Merimna and is distributed all
over Australia, but has not been found outside the Australian mainland (Hawkeswood 2007). M. atrata has two pairs of infrared
(IR) organs on the ventrolateral sides of the abdomen. Each IR organ consists of a specialized IR-absorbing area which is
innervated by one thermosensitive multipolar neuron. The primary dendritic branches ramify into more than 800 closely packed
terminal endings which contain a large number of mitochondria. It is being called the special morphology of the dendritic region
a terminal dendritic mass. The type of IR receptor found in M. atrata is unique in insects (Schmitz. 2015; Schmitz and
Bleckmann. 2000). The Australian buprestid beetle approaches forest fires because its larvae develop in freshly burnt wood. So
far, nothing is known about possible sensory systems, enabling the beetles to detect fires and to cope with the thermal
environment close to the flames. Beetles of both sexes are most probably attracted by the smell of burning eucalyptus trees and
invade a freshly burnt area as early as possible. Nearly the entire cycle of reproduction, including mate finding, copulation and
oviposition takes place, and the beetles are most likely protected from predators by heat and smoke. This is possible because M.
atrata has developed special infrared receptors on the abdomen, which serve for the detection of hot spots. As the burnt area gets
cooler and the smell of burning declines, beetles disappear within about 3 days. Observations on burnt areas over a period of 12
years also have revealed that M. atrata is a diurnal sun-loving beetle, which prefers high body temperatures above 40°C
(Schmitz. 2015).
Figure 19. The Australian ‘fire-beetle’ Merimna atrata
Thermal imagery, remote sensing has a great rule for this insect, it had been used to study the Australian ‘fire-beetle’ behaviour
in burnt areas after the bushfires and detection and progression of beetle activity after the fire. Schmitz, (2015) applied thermal
imagery used to describe the behaviour of M. atrata on a freshly burnt area after a fire. Thermal imaging of resting beetles and
their surroundings were taken with an IR FlexCam T IR camera (Goratec Inc.). The radiometric camera is equipped with a 160 x
120 pixel vanadium oxide focal plane array and a 20 mm germanium lens. Thermal imaging system was visualised and analysed
with GTS Thermography Studio V. 5.1. Software (Goratec Inc.). The accuracy of the camera was checked against a blackbody
radiator, heated to 100, 200, and 300°C (CS 500, DIAS Infrared, Dresden, Germany). Deviations from respective temperatures
set at the blackbody radiator were always smaller than 1°K. The result, as can see in figure 20, indicate that the thoracic surface
temperature 46°C of a sun basking beetle, while the thoracic surface temperature was 36°C of the beetle resting on the border
between the sunny and shaded region of a burnt stem.

International Journal of Agriculture, Forestry and Plantation, Vol. 2 (February.)
ISSN 2462-1757 2016
24
Figure 20. A, M. atrata sun basking on burnt bark; B, thermal image of a sun basking beetle; head oriented downwards; thoracic
surface temperature 46°C; C, thermal image of a beetle resting at the border between the sunny and shaded region of a burnt
stem; thoracic surface temperature 36°C
Detection and progression of beetle activity after the fire been studied using thermal remote sensing by Schmitz, (2015). From
figure 21, Schmitz (2015) concludes that, in the first hours after a fire, many beetles can be found on the burnt area. As long as
the running, fire is burning and hot spots on the freshly burnt area emit heat and smoke, further beetles will be attracted. This can
be observed at the boundary of smaller burnt areas when beetles fly in from unburnt terrain. On the first day after the fire, the
number of beetles in a given burnt area shows a distinct peak. Even if the firefighters had extinguished all hot spots on smaller
burnt areas, beetles stay on the scorched site and display the entire behavior described above.
Figure 21. Progression of beetle activity in a single tree over a period of three days: eucalyptus tree with many basal side
branches on a burnt area in the Gnangara-Moore River State Forest, Pinjar, Western Australia, near Higgins Road at 31°37′42′′S,
115°52′07′′E. On day 1 after the fire two hot spots were still active (see red asterisks) and emitted some smoke. Inset shows an
IR image
c) Citrus Long-horned Beetle
The citrus long-horned beetle (CLHB), Anoplophora chinenis (Forster), is a serious pest of citrus in China but did not occur in
the U.S. until it was detected in a Washington nursery in 2001. An eradication program was immediately implemented in
Washington and there have subsequently been no new infestation reports (Anonymous 2005). However, with the increasing
global trade and movement of plant materials, there is an imminent risk of establishment of CLHB in new areas. With a host
range of more than 40 hardwood species, CLHB is a potential threat to natural areas as well as fruit trees and woody ornamental
plants (Anonymous 2002). Unlike many other native borer pests that primarily attack dead trees, CLHB attacks apparently
healthy trees (Chambers 2002). Once established, it can be extremely difficult and expensive to eradicate. A closely related
species, the Asian long-horned beetle caused the destruction of thousands of trees in New York and Chicago and cost $369
million for eradication efforts (Anonymous 2005).
Figure 22. Adults of Citrus Long-horned Beetle and Goat Moth
Citrus Long-horned Beetle Goat Moth

International Journal of Agriculture, Forestry and Plantation, Vol. 2 (February.)
ISSN 2462-1757 2016
25
The majority of damage associated with CLHB is caused by the larval stages which feeds and tunnel on the woody portion of the
host plant trunk. The wounds created during the course of feeding increase the host susceptibility to various secondary plant
pathogens. Later instar larvae have stronger mouthparts and are able to burrow deep into the wood and create irregular tunnels
that interfere with the water and nutrient transportation resulting in rapid tree decline. As compared to the younger trees, older
trees with larger trunk diameters are able to sustain more damage. Although adults do feed on leaves, and bark of twigs, the
damage is usually not considered severe (Anonymous 2005). Living stages of the quarantine pest of CLHB, have been detected
repeatedly during import inspections of young trees in several European Union member states. CLB infested plants show almost
no external symptoms for identification by visual inspection. Therefore, according to the European Union plant health legislation
(EU-Commission-Implementing Decision 2012/138/EG), destructive sampling of the plants at random is required. Nils
Hoffmann et al. (2013), the thermography has been assessed as an alternative, non-destructive testing method for detection larva
stages. Due to the quarantine status of CLB, the native goat moth, Cossus cossus L., was used as a surrogate for the studies. The
thermal system (figure 23), three types of thermography cameras (VarioCAM®hr research 600, ThermaCAM TM B20 and
Geminis 327k ML (dual – band)) have been tested. This system used for detection goat moth base on using standardized wooden
samples during two long-term measurements (figure 24). Neither passive nor active thermographic methods were able to
visualize enough differences in temperatures to detect larvae, boreholes or bore dust inside of wood samples. Therefore, infrared
thermography with its currently available technology seems to be no appropriate technique for detecting insect stages or defects
in young trees.
Figure23. Thermal system
Figure 24. Solid wood samples (Acer platanoides, Salix caprea) with axial bore holes in the center and inserted goat moth larvae
in each sample
Color image with marked positions at
the end of bore- holes.
Thermal image (grey color) with
measurement setup of thermal
determination lines (s1 to s6). Test
object l1 shows one of two “free”
larvae
Thermal image 1: blue regions resulted from
cooling processes induced by evaporation at
front plane. 2: “head” of a moving larva with
bore dust around. A back segment inside of
wood was not recognizable. 3: Plugs for
preventing larval escape (not to be confused
with larvae)
d) Wood worm
Woodworm Anobium punctatum L. (Coleoptera: Ptinidae), is a generic description given to the infestation of a wooden item
(normally part of a dwelling or the furniture in it) by the wood-eating larvae of any of many species of beetle. The term
‘woodworm’ covers many types of wood boring beetles, some with wonderful names like Deathwatch Beetle and House

International Journal of Agriculture, Forestry and Plantation, Vol. 2 (February.)
ISSN 2462-1757 2016
26
Longhorn Beetle. The first sign of the wood worm is the appearance of neat round holes, 2mm across, in wooden surfaces, often
accompanied by tiny piles of wood dust beneath them. Fresh holes show clean white wood inside. The holes are made by
emerging adult beetles, immature grubs may still be tunneling away inside the wood. The adult Furniture Beetle is a small brown
insect 3mm to 6mm long which flies quite readily. It lays eggs on rough, unpolished wood and the grubs bore straight into the
wood - leaving no trace until they emerge as beetles, three years or so later, usually between May and September (Maldague,
2001).
Figure 25. Adults of wood worm
Maldague, 2001 applied thermal imagery to detect and recognize the wood worm in a dried lath using active thermography (WKI
intern). The system consists of, infrared cameras, optional heating and cooling (active scheme), Data acquisition system and
wood samples. As can see in figure 26. Thermal imagery was able to detect and recognize the wood worm as can see clearly
from figure27.
Figure 26. Thermography system
Source (Maldague, 2001)
Figure 27. Detect galleries of a wood worm using active thermography
e) Red Palm Weevil (RPW)
The weevil is considered to be the world’s worst pest of palm trees. An infestation typically results in the death of the tree. The
red palm weevil (figure28), scientific name Rhynchophorus ferrugineus, is a major pest of palm trees, many of which are highly
valued as landscaping plants, generating approximately $70 million in nursery plant sales in California annually. Female red
palm weevils bore into a palm tree to form a hole into which they lay eggs. Each female may lay an average of 250 eggs, which
take about three days to hatch. Larvae emerge and tunnel toward the interior of the tree, inhibiting the tree’s ability to transport
water and nutrients upward to the crown. After about two months of feeding, larvae pupate inside the tree for an average of three
weeks before the reddish-brown adults emerge (Hetzroni et al. 2004). Adults live for two to three months, during which time
they feed on palms, mate multiple times and lay eggs. Adult weevils are considered strong fliers, venturing more than a half-mile
in search of host trees. With repeated flights over three to five days, weevils are reportedly capable of traveling nearly four-and-
a-half miles from their hatch site. They are attracted to dying or damaged palms, but can also attack undamaged host trees.
Symptoms of the weevil and the larval entry holes are often difficult to detect because the entry sites can be covered with

International Journal of Agriculture, Forestry and Plantation, Vol. 2 (February.)
ISSN 2462-1757 2016
27
offshoots and tree fibers. Careful inspection of infested palms may show holes in the crown or trunk, possibly along with oozing
brown liquid and chewed fibers. In heavily infested trees, fallen pupal cases and dead adult weevils may be found around the
base of the tree (Soroker, 2013).
Figure 28. Adult of red palm weevil
Since direct visual detection of the infestation is quite difficult, alternatives have been evaluated. Soroker, 2013 developed a
system to detect RPW larvae, the canopy temperature based on aerial thermal images using semi-automated procedures used to
map potential infestation of RPW in palm trees in homogeneous plantations on a wide area scale. The result showed that in some
infested palm trees the RPW larvae caused water stress, which was reflected by both higher canopy temperature (extracted from
thermal images) and lower stomatal conductance compared with healthy trees. The water stress was detected 25 days after
infestation, three weeks before visual symptoms were observed (Figure29). The thermal system (figure 30) is used in green
house to collect thermal images, while Golomb (2015), applied thermal system in the field, the main goal of the study was to
examine the ability to detect infected trees using thermal images. By measurements, imaging and analyzing of infected and
uninfected trees over multi-year experiments in quarantine and commercial orchards, results was (partially showed that the RPW
creates water stress and affects canopy temperature. Analysis of the aerial thermal image above date palm plantation successfully
detected the infected trees, which was similar to Soroker (2013) results.
Figure 29. Thermal images of palm trees infected and uninfected by RPW
Figure 30. Thermal system for RPW detection

International Journal of Agriculture, Forestry and Plantation, Vol. 2 (February.)
ISSN 2462-1757 2016
28
Field Greenhouse
Conclusion
Use of thermal imaging in the pest detection is not gaining popularity, and rare researches have been accompanied to establish
that IR imaging could be a valuable tool for insect detection. Besides the inimitable advantages offered by the thermal imaging
for pest (insect) detection as see in these few researches, there are many reasons which led reduce in using. Thermal imaging was
seen as an expensive system, the cost prohibitive the system, camera price, thus limits its application only to laboratory settings
and high value target analyses. In addition, in the laboratory-based detection techniques need to be used for on-field detection.
When it comes to indirect pest detection methods, thermal imaging its ability in detecting pest with high sensitivity because
weather condition have a high effects on data, however, it involves designing system as well as limiting the automation of
thermal data processing and often Imaging sensor calibration and atmospheric correction are essential. Certainly, thermal
imaging system has its own limitations, but with time and more research, IR imaging may become a reasonable technique for
pest detection. One more fact that is new and enhanced thermal sensors, cameras nowadays will potential to bring more interest
and challenge in this relatively less explored field. Therefore, now there is a definite need to promote the understanding and the
use of thermal data by the scientific and application community. These developments should encompass among other things;
fundamental research in the principles of thermal remote sensing, laboratory measurements of spectral response of natural
materials in the thermal infrared region, development of more sophisticated sensor technology, finally to application oriented
research where the thermal imagery already explored application fields can be refined and new application areas can be tapped.
Acknowledgment
The authors would like to gratefully acknowledge the invaluable assistance of the Department of civil Engineering and the GIS
Research Centre, Universiti Putra Malaysia for the facilities provided throughout the accomplishment of this work.
References
Anonymous. (2002). Washington's tree slayer: The citrus longhorned beetle. Citrus longhorned beetle eradication project.
Washington State Department of Agriculture.
http://agr.wa.gov/PlantsInsects/InsectPests/CLHB/docs/Tukwila/TreeSlayer_final. pdf (20 March 2005).
Anonymous. (2005). Citrus longhorned beetles found in Tukwila. http://www.ci.tukwila.wa.us/beetle.htm (12 June 2005).
A Handbook on Bean Beetles, Callosobruchus maculatus. beanbeetles.org, Emory University and Morehouse College.
Agriculture and Agri-Food Canada, 2002. Predicting rusty grain beetle infestations: Don’t let the rusty grain beetle ruin wheat in
storage
Barber, D. T., & Black, D. (2007a). Detection and Control of Pests,
Battalwar, P., Gokhale, J., & Bansod, U. Infrared thermography and IR camera. History, 1(2)
Brader et al., 2002 B. Brader, R.C. Lee, R. Plarre, W. Burkholder, G.B. Kitto, C. Kao, L. Polston, E. Dorneanu, I. Szabof, B.
Mead, B. Rouse, D. Sullins, R. Denning A comparison of screening methods for insect contamination in wheat
Journal of Stored Products Research, 38 (2002), pp. 75–86
Campbell, J. B. (2002). Introduction to remote sensing CRC Press.
Chambers B. (2002). Citrus longhorned beetle program, King County, Washington: Environmental Assessment, April 2002.
http://www.aphis.usda.gov/ppd/es/pdf files/clb.pdf (20 March 2005)
Chambers et al., 1984 J. Chambers, N.J. McKevitt, M.R. Stubbs Nuclear magnetic resonance spectroscopy for studying the
development and detection of the grain weevil, Sitophilus granarius (L.) (Coleoptera: Curculionidae), within wheat
kernels Bulletin of Entomological Research, 74 (1984), pp. 707–724
Chelladurai, V., Kaliramesh, S.J., Digvir, S.J., 2012. Detection of Callosobruchus Maculatus (F.) Infestation in Mung Bean
(Vigna radiata) using Thermal Imaging Technique. NABEC/CSBE 12-121

International Journal of Agriculture, Forestry and Plantation, Vol. 2 (February.)
ISSN 2462-1757 2016
29
Chen, X. P., Cui, Z. L., Vitousek, P. M., Cassman, K. G., Matson, P. A., Bai, J. S., et al. (2011). Integrated soil-crop system
management for food security. Proceedings of the National Academy of Sciences of the United States of America,
108(16), 6399-6404.
Cofie-Agblor, R., Muir, W., Sinha, R., & Fields, P. (1996). Heat production by adult cryptolestes ferrugineus (stephens) of
different ages and densities. Postharvest Biology and Technology, 7(4), 371-380.
Cofie-Agblor, R., Muir, W., Zhang, Q., & Sinha, R. (1996). Heat of respiration of cryptolestes ferrugineus (stephens) adults and
larvae in stored wheat. Canadian Agricultural Engineering, 38(1), 37-44.
Conway, G. (2012). One billion hungry: Can we feed the world? Cornell University Press.
Credland, P. F., & Wright, A. W. (1989). Factors affecting female fecundity in the cowpea seed beetle, callosobruchus maculatus
(coleoptera: Bruchidae). Journal of Stored Products Research, 25(3), 125-136.
Damcevski, K.A.,Annis, P.C., &Waterford, C.J. (1998). Effect of grain on apparent respiration of adult stored product
Coleopterain an air tight system: Implications for fumigation testing. Journal of Stored Products Research, 34(4), 331–
339.
Dyson, T. (1999). World food trends and prospects to 2025. Proceedings of the National Academy of Sciences of the United
States of America, 96(11), 5929-5936.
Elachi, C., & Van Zyl, J. J. (2006). Introduction to the physics and techniques of remote sensing John Wiley & Sons.
Emekci, M., Navarro, S.,Donahaye, E.,Rindner, M., & Azrieli, A. (2002). Respiration of Triboliumcastaneum at reduced oxygen
concentrations. Journal of Stored Products Research, 38(5), 413–425.
Emekci, M., Navarro, S.,Donahaye, E.,Rindner, M., & Azrieli, A. (2004). Respiration of Rhyzoperthadominica (F.) at reduced
oxygen concentrations. Journal of Stored Products Research, 40:27–38.
Golomb, O., Alchanatis, V., Cohen, Y., Levin, N., & Soroker, V. (2015). Detection of red palm weevil infected trees using
thermal imaging. Precision agriculture'15 (pp. 322-337) Wageningen Academic Publishers.
Gowen, A., Tiwari, B., Cullen, P., McDonnell, K., & O'Donnell, C. (2010). Applications of thermal imaging in food quality and
safety assessment. Trends in Food Science & Technology, 21(4), 190-200.
Grant, O. M., Tronina, L., Jones, H. G., & Chaves, M. M. (2007). Exploring thermal imaging variables for the detection of stress
responses in grapevine under different irrigation regimes. Journal of Experimental Botany, 58(4), 815-825.
Grossman, J. L. (2006). Advanced techniques in IR thermography as a tool for the pest management professional. Defense and
Security Symposium, pp. 620512-620512-15.
Hanson, C. M., Dudley, D., & Robinson, J. E. (1996). Thermal Imaging System with Integrated Thermal Chopper,
Hawkeswood, T.J. (2007). Review of the biology of the genus Merimna Saunders, 1868 (Coleoptera: Buprestidae). Calodema 9:
12–13
Headey, D., & Fan, S. (2008). Anatomy of a crisis: The causes and consequences of surging food prices. Agricultural
Economics, 39(s1), 375-391.
Hetzroni A., Mizrach A., Nakache Y., Soroker V., 2004 -Developing spectral model to monitor activity of red palm weevil. Alon
Hanotea,58, 466-469.
Holst, G. C. (2000). Common sense approach to thermal imaging SPIE Optical Engineering Press Washington, DC, USA:.
Ishimwe, R., Abutaleb, K., & Ahmed, F. (2014). Applications of thermal imaging in Agriculture—A review. Advances in
Remote Sensing, 3(03), 128.
Jones, H.G. 1999. Use of infrared thermometry for estimation of stomatal conductance as a possible aid to irrigation scheduling.
Agricultural and Forest Meteorology 95:139-149.
Lillesand, T., Kiefer, R. W., & Chipman, J. (2014). Remote sensing and image interpretation John Wiley & Sons.
Lloyd, J. M. (2013). Thermal imaging systems Springer Science & Business Media.
Maldague , X.P.V., 2001: Theory and practice of infrared technology for nondestructive testing. New York, Wiley, 684 p.
Manickavasagan, A., Jayas, D., & White, N. (2008). Thermal imaging to detect infestation by cryptolestes ferrugineus inside
wheat kernels. Journal of Stored Products Research, 44(2), 186-192.
Meola, C., & Carlomagno, G. M. (2004). Recent advances in the use of infrared thermography. Measurement Science and
Technology, 15(9), R27.
Moller, M., Alchanatis, V., Cohen, Y., Meron, M., Tsipris, J., Naor, A., et al. (2007). Use of thermal and visible imagery for
estimating crop water status of irrigated grapevine. Journal of Experimental Botany, 58(4), 827-838.
Nanje Gowda, N., & Alagusundaram, K. Use of thermal imaging to improve the food grains quality during storage.
Neethirajan, S., Karunakaran, C., Jayas, D., & White, N. (2007). Detection techniques for stored-product insects in grain. Food
Control, 18(2), 157-162.
Nils Hoffmann, T HOMAS S CHRÖDER et al. 2013, Potential of infrared thermographyto detect insect stages and defects in
young trees Journal Für K Ulturpflanzen , 65 (9). S. 337–346,
Oerke, E. (2006). Crop losses to pests. The Journal of Agricultural Science, 144(01), 31-43.
Pinstrup-Andersen, P., Pandya-Lorch, R., & Rosegrant, M. W. (1999). World food prospects: Critical issues for the early twenty-
first century.
Prakash, A. (2000a). Thermal remote sensing: Concepts, issues and applications. International Archives of Photogrammetry and
Remote Sensing, 33(B1; PART 1), 239-243.
Prakash, A. (2000b). Thermal remote sensing: Concepts, issues and applications. International Archives of Photogrammetry and
Remote Sensing, 33(B1; PART 1), 239-243.
Pearson and Brabec, 2007 T.C. Pearson, D.L. Brabec Detection of wheat kernels with hidden insect infestations with an
electrically conductive roller mill Applied Engineering in Agriculture, 23 (2007), pp. 639–645
Pearson et al., 2007 T.C. Pearson, A.E. Cetin, A.H. Tewfik, R.P. Haff Feasibility of impact-acoustic emissions for detection of
damaged wheat kernels Digital Signal Processing, 17 (2007), pp. 617–633
Raina, A. K. (1970). Callosobruchus spp. infesting stored pulses (grain legumes) in India and comparative study of their biology.
Indian Journal of Entomology 32(4), 303-10.

International Journal of Agriculture, Forestry and Plantation, Vol. 2 (February.)
ISSN 2462-1757 2016
30
Rajendran, S. (2005). Detection of insect infestation in stored foods. Advances in Food and Nutrition Research, 49, 163-232.
Richards, J. A., & Richards, J. (1999). Remote sensing digital image analysis Springer.
Rogalski, A. (2003). Infrared detectors: Status and trends. Progress in Quantum Electronics, 27(2), 59-210.
Savary, S., Ficke, A., Aubertot, J., & Hollier, C. (2012). Crop losses due to diseases and their implications for global food
production losses and food security. Food Security, 4(4), 519-537.
Schmitz, A., Schneider, E. S., & Schmitz, H. (2015). Behaviour of the australian'fire-beetle'merimna atrata (coleoptera:
Buprestidae) on burnt areas after bushfires. RECORDS OF The Western Australian Museum, 1(011), 011.
Schmitz, H., Schmitz, A., & Bleckmann, H. (2000). A new type of infrared organ in the australian" fire-beetle" merimna atrata
(coleoptera: Buprestidae). Naturwissenschaften, 87(12), 542-545.
Schmitz, H. and Schmitz, A. (2002). Australian fire-beetles. Landscope Spring 2002: 36-41.
Singh, C., Jayas, D., Paliwal, J., & White, N. (2009). Detection of insect-damaged wheat kernels using near-infrared
hyperspectral imaging. Journal of Stored Products Research, 45(3), 151-158.
Stajnko, D., M. Lakota and M. Hocevar. 2004. Estimation of number and diameter of apple fruits in an orchard during the
growing season by thermal imaging. Computer and Electronics in Agriculture 42(1):31-42
Soroker, V., Suma, P., Pergola, A. l., Cohen, Y., Alchanatis, V., Golomb, O., et al. (2013). Early detection and monitoring of red
palm weevil: Approaches and challenges. Colloque Méditerranéen Sur Les Ravageurs Des Palmiers, Nice, France, 16-
18 Janvier 2013,
Timmer, C. P. (2008). Causes of High Food Prices,
Toews et al., 2006 M.D. Toews, T.C. Pearson, J.F. Campbell Imaging and automated detection of Sitophilus oryzae L.
(Coleoptera: Curculionidae) pupae in hard red winter wheat Journal of Economic Entomology, 99 (2006), pp. 583–592
Tran, B. M. D. and P. F. Credland. (1995). Consequences of inbreeding for the cowpea seed beetle, Callosobruchus maculatus
(F.) (Coleoptera: Bruchidae). Biological Journal of the Linnean Society 56 483-503.
Usamentiaga, R., Venegas, P., Guerediaga, J., Vega, L., Molleda, J., & Bulnes, F. G. (2014). Infrared thermography for
temperature measurement and non-destructive testing. Sensors, 14(7), 12305-12348.
Varith, J., G.M. Hyde, A.L. Baritelle, J.K. Fellman and T. Sattabongkot. 2003. Non- contact bruise detection in apples by
thermal imaging. Innovative Food Science and Emerging Technologies 4:211-218.
Veroustraete, F., & Samson, R. (2015). Basic principles of remote sensing.
Vollmer, M., & Möllmann, K. (2010). Infrared thermal imaging: Fundamentals, research and applications John Wiley & Sons.
Wallen, V., Jackson, H., & MacDiarmid, S. (1976). Remote sensing of corn aphid infestation, 1974 (hemiptera: Aphididae). The
Canadian Entomologist, 108(07), 751-754.
White, N. D., Demianyk, C. J., Kawamoto, H., & Sinha, R. N. (1995). Population growth of cryptolestes ferrugineus and C.
pusillus (coleoptera: Cucujidae) alone, or in competition in stored wheat or maize at different temperatures. Bulletin of
Entomological Research, 85(03), 425-429.
Zhang and Wang, 2007 H. Zhang, J. Wang Detection of age and insect damage incurred by wheat, with an electronic nose
Journal of Stored Products Research, 43 (2007), pp. 489–495.