thermal-hydraulic characteristics during ingress-of ... · thermal-hydraulic characteristics during...
TRANSCRIPT

1
THERMAL-HYDRAULIC CHARACTERISTICS DURING INGRESS-OF-COOLANT
AND LOSS-OF-VACUUM EVENTS IN FUSION REACTORS
K. TAKASEa, T. KUNUGIb, Y. SEKIc, H. AKIMOTOa
Department of Energy System Research, Tokai Research Establishment,
a Tokai Research Establishment, Japan Atomic Energy Research Institute, Tokai-mura, Ibaraki-ken
b Faculty of Engineering, Tokai University, Hiratsuka-shi, Kanagawa-ken,
c Naka Fusion Research Establishment, Japan Atomic Energy Research Institute, Naka-machi,
Ibaraki-ken
Japan

2
ABSTRACT
The thermal-hydraulic characteristics in a vacuum vessel (VV) of a fusion reactor under an
ingress-of-coolant event (ICE) and loss-of-vacuum event (LOVA) were investigated quantitatively
using preliminary experimental apparatuses.
In the ICE experiments, pressure rise characteristics in the VV were clarified for
experimental parameters of the wall temperature, water temperature and with/without a
blowdown tank. Furthermore, the functional performance of a blowdown with/without a water
cooling system was examined and it was confirmed that the blowdown tank with the water cooling
system is effective to suppress the pressure rise during the ICE event.
In the LOVA experiments, the saturation time in the VV from vacuum to atmosphere was
investigated for various breach sizes and it was found that the saturation time is in inverse
proportion to the breach size. In addition, the exchange flow characteristics through breaches were
clarified for the different breach positions on the VV. It was proven from the experimental
results that the exchange flow becomes a counter-current flow when the breach was positioned at
the roof on the VV and a stratified flow when it is formed at the side of the VV, and then the flow
exchange under the stratified flow condition is smoother than that under the counter-current flow.
Based on these, the severest breach condition in ITER was changed from the top-break case to the
side-break case.
In addition, to predict with high accuracy the thermal-hydraulic characteristics during the
ICE and LOVA events under the ITER condition, the necessity of a large-scale test facility was
mentioned. The current conceptual design of the combined ICE/LOVA test facility with a scaling
factor of 1/1000 in comparison with the ITER volume was expressed.
1. INTRODUCTION
Two experimental studies on an ingress-of-coolant event (ICE) and loss-of-vacuum event
(LOVA) have been carried out as International Thermonuclear Experimental Reactor (ITER) [1]
safety R&D subtasks so as to obtain verifying data for the fusion safety analysis codes during
transient events [2].
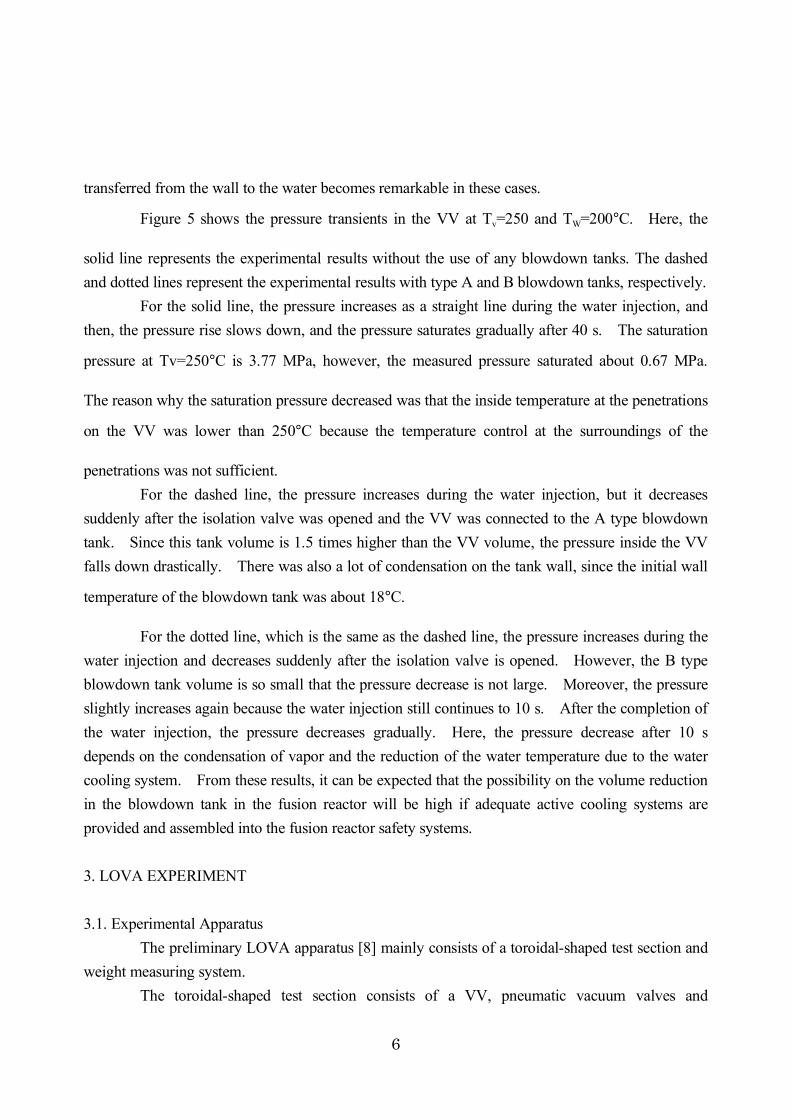
A scenario of the ICE and LOVA events in the fusion reactor can be seen in Fig. 1. If
cooling tubes installed into plasma-facing components (PFCs) in a Tokamak vacuum vessel (VV)
are broken due to some damage, water under high temperature and pressure in the cooling tubes will
be discharged into the VV. Then, the discharged water will impinge on the hot surface of the

3
PFCs and evaporate. As a result, the VV will be filled with steam and the pressure in the VV will
increase rapidly. The rapid pressure rise will make a shock wave and lead to high pressurization.
Moreover, chemical reactions between the steam and PFC materials could occur. This is called the
ICE event.
On the other hand, if the pressurization speed in the VV after the ICE event is faster than
operating speeds of some safety devices (i.e., rupture disks and safety valves), the VV and some
penetration ducts may be broken as a results of the rapid pressure rise. If the penetration duct is
broken as can be seen in Fig. 1, buoyancy-driven exchange flows caused by the temperature
difference between the inside and outside of the VV will take place through breaches. In addition,
the activated dust accumulated inside the VV and the tritium retained in the PFCs may be entrained
by the exchange flows through the breaches to the outside of the VV. This is called the LOVA
event.
Some studies [3]-[6] regarding the thermofluid safety for nuclear reactors have been
performed at more than atmospheric pressure, however, thermal-hydraulic characteristics during the
ICE and LOVA events have not been reported yet because those events occur under a vacuum
condition. Then, the ICE and LOVA experiments were carried out using the preliminary test
apparatuses to understand the physical phenomena in the VV during ICE and LOVA events and
obtain the verifying data for the fusion safety analysis codes. Furthermore, a combined
ICE/LOVA test facility was planned to extrapolate the ITER condition with respect to the
ICE/LOVA events and its necessity was requested from the code analysts. The volume of the
combined ICE/LOVA test facility is around 10 times larger than the preliminary ICE/LOVA
apparatuses and corresponds to 1/1000 of the ITER volume. This paper describes the ICE and
LOVA experimental results and a conceptual design of the combined ICE/LOVA test.
2. ICE EXPERIMENT
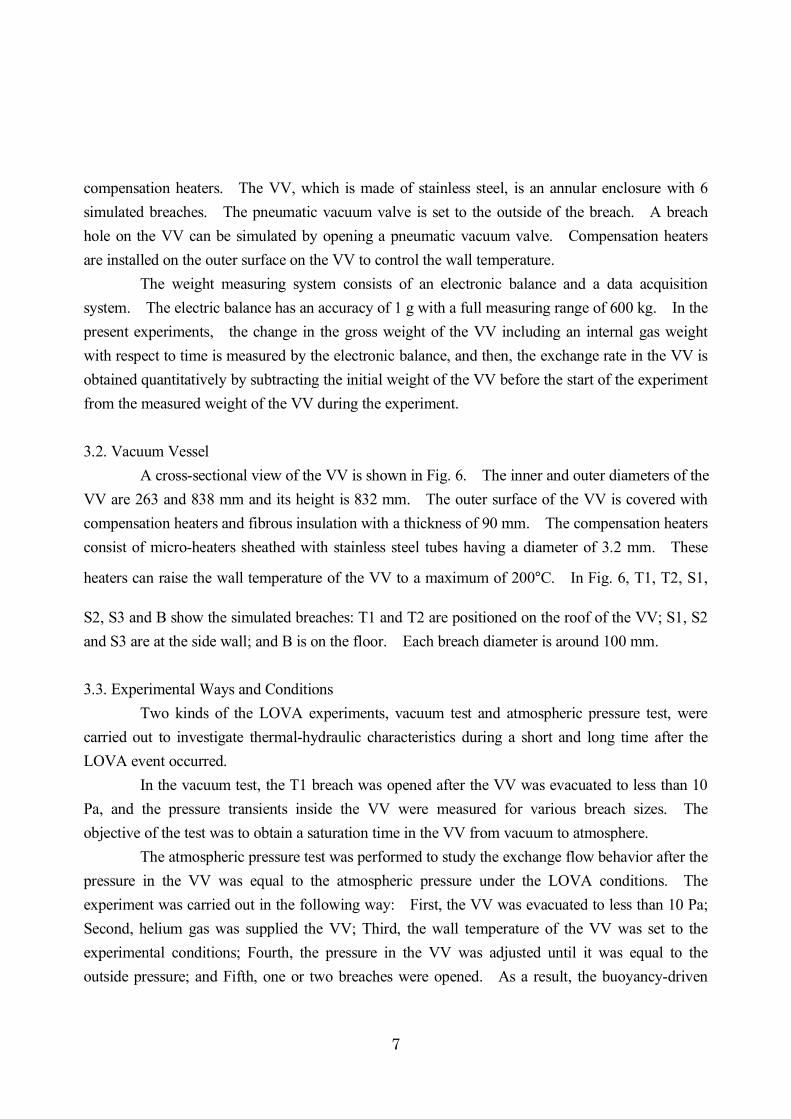
2.1 Experimental Apparatus
A schematic of the preliminary ICE apparatus [7] is shown in Fig. 2. It mainly consists of
a VV, boiler, water injector, isolation valve, vacuum pump and blowdown tank.
The VV of stainless steel is a cylindrical enclosure and its diameter and height are 900 and
600 mm. Heating walls, consisting of brass plates and sheath heaters, are set to the inner surface
of the VV to control the wall temperature. The VV can be heated to a maximum of 400°C by the
heating walls. The target plate, which was made of brass, is a circular plate and its diameter and

4
thickness are 900 and 12 mm. The target plate is installed on the opposite side of the water
injector in the VV. The water under high temperature and pressure impinges on the front surface
of the target plate. The VV is covered with fibrous insulation with a thickness of 0.2 m. A
pressure transducer of a strain-gage type was set to the inside wall of the VV to measure the
pressure transients during the ICE event, as shown in Fig. 2.
The boiler consists of a cylinder, electric heaters and piping. The cylinder volume is 0.1
m3. In the boiler, water is heated to 250°C in maximum by the electric heaters and pressurized to
3.5 MPa in maximum by pressurized N2 gas. The piping connects the boiler with the VV through
the water injector.
The water injector consists of a pneumatic cylinder and water nozzle. The water under
high temperature and pressure made by the boiler is injected into the VV through the water nozzle.
The water nozzle is set to the edge of the VV.
The blowdown tank is connected to the VV with piping through an isolation valve. The
piping diameter is 50 mm. The objective of this tank is to relieve high pressure in the VV during
the ICE event. The following two types of the blowdown tanks were used:
- A type is a large circular cylinder and the volume (0.57 m3) is 150% larger than the VV
volume, and its outside is atmosphere;
- B type is a small chamber and the volume (0.045 m3) corresponds to around 12% of the VV
volume, and it is enclosed with a water cooling system as can be seen in Fig. 3.
The objective of the water cooling system for the B type is to reduce the saturation pressure
inside the blowdown tank by decreasing the water and vapor temperatures and enhancing the
condensation.
2.2. Experimental Procedure and Conditions
The ICE experiments were carried out in the following ways: First, the water in the
boiler was set to the values of the experimental conditions; Second, the wall inside the VV was
heated to the desired temperature by the heating walls and at the same time the inside of the VV was
exhausted to the desired pressure using the vacuum pump; Third, the high temperature and
pressure water was injected into the inside of the VV through the water injector at a constant flow
rate; Fourth, the injected water impinged on the target plate; Fifth, the injected water boiled and
evaporated; and sixth, as this result the inside pressure increased rapidly.
The ICE experimental conditions were as follows: the initial wall temperature, Tv, varied
from 100 to 250°C; the initial pressure in the VV was less than 10 Pa; the diameter of the water

5
nozzle was 2 mm; the injection time was 10 s; the initial water pressure was 3.5 MPa; and the initial
water temperature, Tw, varied from 100 to 200°C. According to the current ITER design, the wall
temperature inside the VV is 230°C and the coolant temperature and pressure in the PFCs are 160°C
and 3.5 MPa, respectively. In addition, the isolation valve was opened when the pressure inside
the VV became 0.2 MPa. Here, this operating pressure corresponds to the pressure set value of the
engineering safety device (i.e., a double-rapture disk system) in ITER. The present experimental
conditions were considered based on these ITER conditions.
2.3. ICE Experimental Results and Discussion
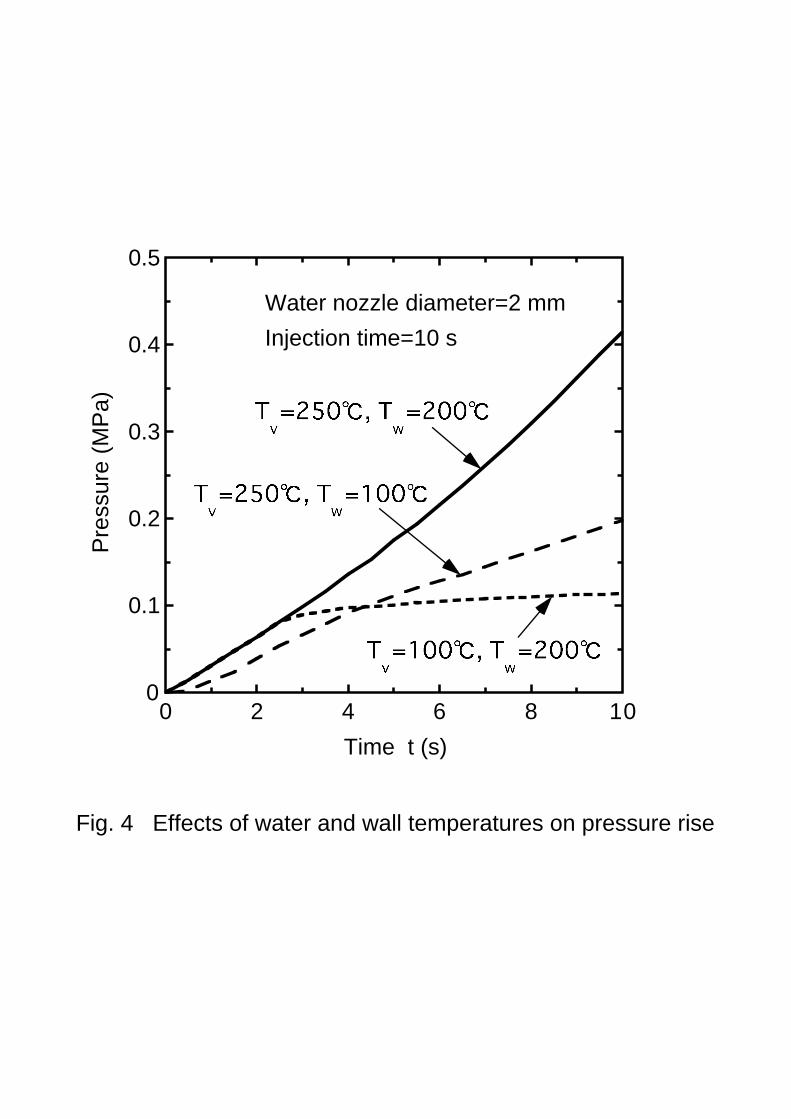
Figure 4 shows the pressure transients in the VV during the ICE conditions. Here, Tv and
Tw represent the initial wall temperatures inside the VV and the initial water temperature,
respectively, and t denotes the time from the start of the experiment. In the figure, the solid line
shows the experimental results under the condition of Tv=250 and Tw=200°C. Similarly, the
dashed and dotted lines show the experimental results under the conditions of Tv=250 and
Tw=100°C, and then, Tv=100 and Tw=200°C, respectively.
For the solid and dashed lines (i.e., the case in which Tv is the same but Tw is different), the
pressure transients increase rapidly with the water injection and those pressures at t=10 s reach
around 0.42 MPa at the solid line and 0.2 MPa at the dashed line.
The heat transfer rate, Q, from the wall in the VV to the injected water is generally defined
as Q=α(Tv-Tw). Here, α denotes the heat transfer coefficient. Just after the break of vacuum due
to the water injection, the water temperature accumulated in the VV decreases down to the
saturation temperature that is determined by the pressure inside the VV. Therefore, Tv-Tw will be
almost similar for each Tw when Tv is constant. This reason was derived from the measured
temperature distributions inside the VV. Thus, it can be presumed that the pressure difference
between the solid and dashed lines depends on flashing which is specified by Tw. Here, the
flashing means that water changes from liquid to vapor under vacuum because the water can not
maintain the liquid.
For the solid and dotted lines (i.e., the case that Tw is the same but Tv is different), an effect
of the flashing will be similar for both cases because Tw is constant. Therefore, it can be expected
that a pressure difference between both lines depends on Tv. That is, the effect of the heat
6
transferred from the wall to the water becomes remarkable in these cases.
Figure 5 shows the pressure transients in the VV at Tv=250 and TW=200°C. Here, the
solid line represents the experimental results without the use of any blowdown tanks. The dashed
and dotted lines represent the experimental results with type A and B blowdown tanks, respectively.
For the solid line, the pressure increases as a straight line during the water injection, and
then, the pressure rise slows down, and the pressure saturates gradually after 40 s. The saturation
pressure at Tv=250°C is 3.77 MPa, however, the measured pressure saturated about 0.67 MPa.
The reason why the saturation pressure decreased was that the inside temperature at the penetrations
on the VV was lower than 250°C because the temperature control at the surroundings of the
penetrations was not sufficient.
For the dashed line, the pressure increases during the water injection, but it decreases
suddenly after the isolation valve was opened and the VV was connected to the A type blowdown
tank. Since this tank volume is 1.5 times higher than the VV volume, the pressure inside the VV
falls down drastically. There was also a lot of condensation on the tank wall, since the initial wall
temperature of the blowdown tank was about 18°C.
For the dotted line, which is the same as the dashed line, the pressure increases during the
water injection and decreases suddenly after the isolation valve is opened. However, the B type
blowdown tank volume is so small that the pressure decrease is not large. Moreover, the pressure
slightly increases again because the water injection still continues to 10 s. After the completion of
the water injection, the pressure decreases gradually. Here, the pressure decrease after 10 s
depends on the condensation of vapor and the reduction of the water temperature due to the water
cooling system. From these results, it can be expected that the possibility on the volume reduction
in the blowdown tank in the fusion reactor will be high if adequate active cooling systems are
provided and assembled into the fusion reactor safety systems.
3. LOVA EXPERIMENT
3.1. Experimental Apparatus
The preliminary LOVA apparatus [8] mainly consists of a toroidal-shaped test section and
weight measuring system.
The toroidal-shaped test section consists of a VV, pneumatic vacuum valves and
7
compensation heaters. The VV, which is made of stainless steel, is an annular enclosure with 6
simulated breaches. The pneumatic vacuum valve is set to the outside of the breach. A breach
hole on the VV can be simulated by opening a pneumatic vacuum valve. Compensation heaters
are installed on the outer surface on the VV to control the wall temperature.
The weight measuring system consists of an electronic balance and a data acquisition
system. The electric balance has an accuracy of 1 g with a full measuring range of 600 kg. In the
present experiments, the change in the gross weight of the VV including an internal gas weight
with respect to time is measured by the electronic balance, and then, the exchange rate in the VV is
obtained quantitatively by subtracting the initial weight of the VV before the start of the experiment
from the measured weight of the VV during the experiment.
3.2. Vacuum Vessel
A cross-sectional view of the VV is shown in Fig. 6. The inner and outer diameters of the
VV are 263 and 838 mm and its height is 832 mm. The outer surface of the VV is covered with
compensation heaters and fibrous insulation with a thickness of 90 mm. The compensation heaters
consist of micro-heaters sheathed with stainless steel tubes having a diameter of 3.2 mm. These
heaters can raise the wall temperature of the VV to a maximum of 200°C. In Fig. 6, T1, T2, S1,
S2, S3 and B show the simulated breaches: T1 and T2 are positioned on the roof of the VV; S1, S2
and S3 are at the side wall; and B is on the floor. Each breach diameter is around 100 mm.
3.3. Experimental Ways and Conditions
Two kinds of the LOVA experiments, vacuum test and atmospheric pressure test, were
carried out to investigate thermal-hydraulic characteristics during a short and long time after the
LOVA event occurred.
In the vacuum test, the T1 breach was opened after the VV was evacuated to less than 10
Pa, and the pressure transients inside the VV were measured for various breach sizes. The
objective of the test was to obtain a saturation time in the VV from vacuum to atmosphere.
The atmospheric pressure test was performed to study the exchange flow behavior after the
pressure in the VV was equal to the atmospheric pressure under the LOVA conditions. The
experiment was carried out in the following way: First, the VV was evacuated to less than 10 Pa;
Second, helium gas was supplied the VV; Third, the wall temperature of the VV was set to the
experimental conditions; Fourth, the pressure in the VV was adjusted until it was equal to the
outside pressure; and Fifth, one or two breaches were opened. As a result, the buoyancy-driven
8
exchange flows through the breaches take place. Namely, helium gas goes out of the VV through
the breaches to the outside, and simultaneously, air comes into the inside from the outside. Finally,
the exchange mass in the VV is calculated from the change in the gross weight of the VV.
Helium gas and air were used in the present experiments. As conservative estimation, it
can be considered that: air flowing from the outside of the VV through the breaches into the inside
will reach 1000°C during a short time after the LOVA event occurs because the maximum
temperature of the PFCs in ITER is 1000°C at the divertor. But, it is difficult to heat up the air to
1000°C using only electric heaters. The buoyancy-driven exchange flow strongly receives the effect
of the fluid density. Fortunately, the density of helium gas at a room temperature condition was
nearly equal to that of air at the temperature range of more than 1000°C. Therefore, helium gas
was chosen as the working fluid of the present experimental study.
3.4. LOVA Experimental Results and Discussion
Figure 7 shows the pressure transients in the VV under the vacuum test condition when
the T1 breach was opened. Here, a solid line represents the experimental results when breach
diameter, d, is 100 mm, and ∆t denotes the time until the VV is filled with air and the inside of the
VV reaches atmospheric pressure, and then, t shows the time since the experiment started. In this
figure, ∆t was around 0.5 s.
Figure 8 shows the relationship between ∆t and d at the vacuum tests. ∆t is in inverse
proportion to the breach size. Namely, the VV is exchanged immediately to atmosphere when d is
large, and ∆t becomes very long when d is small. In the figure, ∆t at d=1 mm needs about an hour.
The VV volume excluding penetration volume in ITER is around 3800 m3 and it corresponds to
approximately 9,200 times larger than that of the present LOVA apparatus. Therefore, it can be
estimated that: if the LOVA event occurs in ITER and the breach size is very small, finding the
breach position will be very difficult because the pressure rise in the VV is very slow.
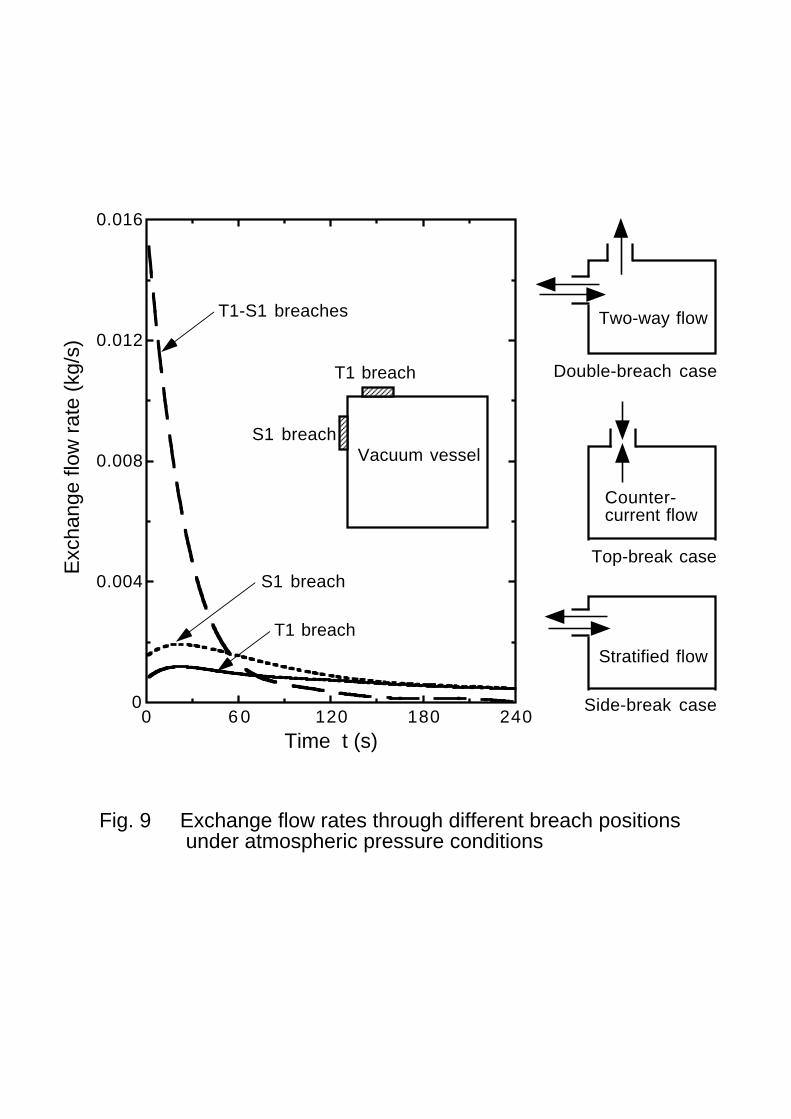
Figure 9 shows the changes in exchange flow rates through the breaches at the atmospheric
pressure tests. In this figure, T1-S1 means the double breach case in which T1 and S1 breaches are

9
opened simultaneously, and T1 means the single breach case in which T1 breach is only opened,
and also S1 means the case in which the S1 breach is only opened. Here, the exchange flow rates
were calculated from the exchange mass inside the VV measured by the electronic balance, and t is
the time from the start of the experiments.
From these results, it can be concluded that: the flow exchange at the double-breach case is
almost completed in a short time in comparison with that at the single-breach case because a two-
way flow occurs through both breaches. On the other hand, the flow exchange at the single breach
case takes lots of time until its completion. The flow exchange at the T1 breach case is suppressed
because the exchange flow through the T1 breach becomes a counter-current flow. Moreover, the
flow exchange at the S1 breach case is carried out smoothly in comparison with the T1 breach case
because the exchange flow through the S1 breach becomes a stratified flow. These flow patterns
through breaches as can be seen in Fig. 9 were visualized and confirmed using the smoke. Based
on the above, the severest breach condition in ITER was changed from the top-break case (i.e., T1
breach case) to the side-break case (i.e., S1 breach case).
4. FUTURE PLANS OF ICE/LOVA EXPERIMENTS
4.1. Overall Objectives
The thermal-hydraulic characteristics during the ICE and LOVA events could be
understood quantitatively from the preliminary ICE and LOVA experiments. However, since each
size of those apparatuses was very small in comparison with ITER, it is not easy to extrapolate the
ICE and LOVA behavior under the ITER conditions from the preliminary experimental results.
Therefore, combined ICE/LOVA tests were needed.
The overall objectives for the combined ICE/LOVA test facility are:
- To demonstrate that the ITER safety design approach and design parameters are adequate
for mitigation of the ICE and LOVA events; and
- To provide experimental data for validation of safety analysis codes and methodologies that
will be used for regulatory quality analyses.
For demonstration of the adequacy of safety design approach and design parameters, the
simulation test was focussed on the Category IV multiple FW pipes break event, where is the
highest pressure of the plasma chamber is predicted in the NSSR-2 analyses [2]. More detailed
experimental objectives are to get integrated test data to make sure that the code-predicted
accidental over-pressure is correct including the effect of steam generation in plasma and vacuum
chambers, two-phase pressure drop through the divertor and the divertor ports, and the condensation

10
in the suppression tank.
The following thermal-hydraulic phenomena have been investigated for the code
validation:
- steam generation due to flashing in the plasma chamber;
- steam generation due to boiling on the superheated wall surface;
- two-phase flow pressure drop through the divertor; and
- direct-contact condensation effect in the suppression tank.
4.2. Sizing of the Combined ICE/LOVA Test Facility
The scaling factor of main components is around 1/1000 (test facility/ITER). Table 1
shows the design parameters of the combined ICE/LOVA test facility. The basic policy of the
scaling is to functionally simulate the ICE/LOVA phenomena, such as by scaling based on volume
and mass, without modeling the actual shape of ITER machine. The proposed basic scaling laws
between the test facility and ITER are: the volume size is 1/1000; and flow velocity, pressure and
temperature are simulated by the scaling factor of 1/1, respectively.
4.3. Design Descriptions
Figure 10 shows a schematic of the conceptual design of the combined ICE/LOVA test
facility. The test facility mainly consists of a plasma chamber, simulated divertor, simplified
vacuum vessel, divertor port, relief pipe and suppression tank.
The plasma chamber is a cylinder with a diameter of 1200 mm and length of 2500 mm. It
can be heated up to 270°C using electrical heaters, which are enclosed around the chamber. Some
water injection mechanisms are put into the plasma chamber to simulate the primary pipe break
conditions. Here, the direction of the water injection nozzle can be changed to investigate the
effect of the wall-impingement jet heat transfer.
The simulated divertor has an orifice plate with multiple holes as can be seen in Fig. 10.
The orifice plate simulates open holes (i.e., gaps between the plasma chamber and VV) at the
divertor cassette. By changing the orifice plates, the effects of hole size and pitch on the two-
phase flow behavior through the divertor can be investigated. The overall pressure drop
characteristics through the divertor can be obtained.
A generic bypass line is also connected to the plasma chamber and the other end is
atmosphere. This line consists of a window, gap adjuster, valves and piping. The window is set
up to measure exchange flow velocities under the LOVA conditions using a laser technique. The

11
gap adjuster simulates the choking effect by the gas baffle plate.
Figure 11 shows the elevation of a plasma chamber, simulated divertor, simplified VV,
divertor port and suppression tank. The simplified vacuum vessel is set up the bottom of the
plasma chamber through the simulated divertor. The simplified vacuum vessel simulates the
bottom small part of the VV in ITER. The wall temperature is controlled separately from the
plasma chamber to make test conditions. Three observation windows are set to the simplified
vacuum vessel to understand visually the two-phase flow behavior.
The divertor port is connected to the simplified vacuum vessel as can be seen in Fig. 11.
This is a cylinder with a diameter of 300 mm and length of 2000 mm. This divertor port is
connected to a suppression tank through the relief pipe as same as the ITER design.
The suppression tank consists of a cylindrical tank, plenum distributor and many organ
pipes. This tank is set up just under the divertor port through the relief pipe. A magnetic valve is
set up to the relief pipe. The suppression tank is connected to the divertor port by opening the
magnetic valve. Using this suppression tank, direct-contact condensation characteristics during the
ICE event can be investigated.
The boiler consists of a cylindrical tank and electric heaters. Water is pressurized by
nitrogen gas and heated up by the electric heaters. Its volume and maximum water holdup will be
around 1Êand 0.8 m3, and those values were determined to satisfy the coolant inventory of Category
IV multiple in-vessel leakage case based on a scaling factor of 1/1000. The pressurized water in
the boiler circulates the circulation loop to prevent from a temperature decrease at the tip of the
water nozzle in the water injection mechanism. The water circulation is stopped before the
experiment and then the pressurized water is injected into the plasma chamber.
5. CONCLUSIONS
The thermal-hydraulic characteristics in the VV of a fusion reactor under the ICE and
LOVA events were investigated quantitatively. In the preliminary ICE experiments, the pressure
rise characteristics in the VV were clarified and the performance of the blowdown tank was
confirmed. In the preliminary LOVA experiments, the relationship between the saturation time
and breach size in the VV was obtained from the results of the vacuum tests and the exchange flow
characteristics through the breaches were understood from the results of the atmospheric pressure
tests. The present experimental data were very useful to validate the thermofluid safety analysis
codes for fusion reactors. In addition, to predict with high accuracy the thermal-hydraulic
characteristics during the ICE and LOVA events under the ITER condition, the necessity of a large-

12
scale test facility was mentioned. The current conceptual design of the combined ICE/LOVA test
facility with a scaling factor of 1/1000 in comparison with the ITER volume was expressed. The
authors are planning on performing numerical simulations regarding the ICE and LOVA
phenomena after the combined ICE/LOVA test facility has been set up.
ACKNOWLEDGMENTS
The authors would like to express their gratitude to Mr. Shibata and Mr. Takahashi of
JAERI for their contributions to the present research.
REFERENCES
[1] ITER Conceptual Design Report, IAEA/ITER/DS/No.18, IAEA(1991).
[2] ITER NON-SITE SPECIFIC SAFETY REPORT (NSRR-2), Executive Summary, Dec., (1997).
[3] V. P. Carey, ÒLiquid-Vapor Phase-Change PhenomenaÓ, Taylor & Francis, (1992).
[4] C. W. Hirt and N. C. Romero, Application of a Drift-Flux Model to Flashing in Straight
Pipes,Ó LA-6005-MS, (1995).
[5] A. Mercer and H. Thompson, ÒAn Experimental Investigation of Some Further Aspects of
the Buoyancy-Driven Exchange Flow Between Carbon Dioxide and Air Following a
Depressurization Accident in a Magnox Reactor, Part 1: The Exchange Flow in Inclined
DuctsÓ, J. Br. Nuclear Energy Society., 14-4, (1975) 327-335.
[6] M. Epstein, Buoyancy-Driven Exchange Flow through Small Opening in Horizontal
Partitions,Ó Trans. ASME, J. Heat Transfer, 110, (1988) 885-894.
[7] K. Takase, et al., ÒA Fundamental Study on a Water Jet Injected into a Vacuum Vessel of
Fusion Reactor under the Ingress of Coolant EventÓ, Fusion Technology, 30-3, (1996)
1453-1458.
[8] K. Takase, et al., ÒExperimental Study on Buoyancy-Driven Exchange Flow Though Breaches
of a Tokamak Vacuum Vessel in a Fusion Reactor Under the LOVA ConditionÓ,
Nuclear Science and Engineering, 125-3, (1996) 223-231.

Table 1 Comparison of design parameters between ITER and test facility
ITER design parameters Test facility design parameters
- Plasma chamber - Plasma chamber Volume (including divertor pocket Diameter: 1200 mm volume) : 2640 m3 Length: 2500 mm Coolant outlet temp.(normal): 191°C Volume: 2.9 m3
Coolant outlet temp.(baking): 240°C Maximum temperature: 270°C Resisting pressure: 1 MPa
- Vacuum vessel - Simplified vacuum vessel Volume (including penetration Diameter: 300 mm volume): 4592 m3 Length: 2500 mm Volume (excluding penetration Volume: 0.2 m3
volume): 3800 m3 Maximum temperature: 270°C
Coolant temp.(normal): 111°C Resisting pressure: 1 MPa
Coolant temp.(normal): 200°C
- Divertor port - Divertor port Height: 2545 mm Diameter: 300 mm
Width: 1544 mm(upper) Length: 2000 mm 810 mm(lower) Volume: 0.15 m3
Maximum temperature: 270°C Resisting pressure: 1 MPa
- Primary water cooling system - BoilerDesign pressure: 5.8 MPa Diameter: 800 mmOperating pressure: 4.7 MPa Length: 2000 mmDesign temperature: 270°C Volume: 1.0 m3
Coolant inventory at Categort IV Maximum water holdup: 0.8 m3
event: 757 m3 Maximum water temperature: 270°CMaximum breach area at Maximum water pressure: 5 MPaCategory IV event: 0.6 m2 Water nozzle diameter: changeable
- Suppression tank - Suppression volumeInternal volume: 2246 m3 Diameter: 900 mmWater volume: 1055 m3 Length: 2500 mmExpansion volume: Max. 75 m3 Volume: 1.6 m3
Total organ pipe flow area: 8.3 m2 Resisting pressure: 1 MPa Relief pipe diameter: 100 mm
Plasma-facing component
Buoyancy-driven exchange flow
Break of coolant tubes
Release of dust from walls
Divertor
Penetration duct
Toroidal-shaped vacuum vessel
Breach
Rapid pressure rise
Water injection
F
i
g
.
1
S
c
e
n
a
r
i
o
o
f
t
h
e
I
C
E
a
n
d
L
O
V
A
e
v
e
n
t
s
i
n
f
u
s
i
o
n
r
e
a
c
t
o
r
s

600 mm
900
mm
φ
Vacuum vessel
Isolation valve
Blowdown tank
Vacuum pump
Water nozzle
Boiler
Target plate
N2 gas
Heating wall
Pressure transducer
Insulation
Electric heater
Flowmeter
Fig. 2 Schematic of the preliminary ICE apparatus

From VV
Cooling water
Water pot
Vacuumchamber
260
mm
293
mm
φ
200
mm
610
mm
165 mm
1420
mm
490 mm
50 m
m
755 mm
790 mm
34 mm
Wat
er ta
nk
Cooling water
Constant-temperature water bath
Connecting tube
Fig. 3 Schematic of B type suppression tank
φφ
φ
φ
φ
0
0.1
0.2
0.3
0.4
0.5
0 2 4 6 8 10
Pre
ssur
e (M
Pa)
Time t (s)
Fig. 4 Effects of water and wall temperatures on pressure rise
Water nozzle diameter=2 mm
Injection time=10 s

0
0.2
0.4
0.6
0.8
0 10 20 30 40 50 60
Pre
ssur
e (M
Pa)
Time t (s)
Injection time=10 s
Water nozzle diameter=2 mm
A type blowdown tank
B type blowdown tank
Without blowdown tank
Fig. 5 Pressure transients with/without a blowdown tank

Insulation
812
mm
213
mm
195
mm
T1
B
S3
263 mm
838 mm
S2
T2
φφ
φ540 mm
Heater
S3S1
Fig. 6 Schematic of the toroidal-shaped vacuum vessel in the LOVA apparatus

0
0.05
0.1
0.15
0 0.1 0.2 0.3 0.4 0.5 0.6
Pre
ssur
e (M
Pa)
Time t (s)
Experimental results
d=100 mm
t∆
Fig. 7 Pressure transients in the VV during vacuum test under T1 breaching condition

10-4
10-3
10-2
10-1
100
10-1 100 101 102 103 104
d (m
)
t (s)
T1 breach
∆
Vacuum vessel
Fig. 8 Relationship between d and t during vacuum tests under T1 breaching condition
∆
: Experimental data
0
0.004
0.008
0.012
0.016
0 6 0 120 180 240
Exc
hang
e flo
w r
ate
(kg/
s)
Time t (s)
T1 breach
S1 breach
S1 breach
T1 breach
T1-S1 breaches
Fig. 9 Exchange flow rates through different breach positions under atmospheric pressure conditions
Vacuum vessel
Top-break case
Side-break case
Double-breach case
Two-way flow
Counter-current flow
Stratified flow

Divertor port
Plasma chamber
Multiple holesGap adjuster
WindowLaser
Simulated divertor
Simplified vacuum vessel
Ground
Flow meterMagnet valve
Boiler
Pump Suppression tank
2000 mmφ800 mm
2500 mm, φ1200 mm
2500 mm, φ300 mm
2500 mm, φ1200 mm
2500 mmφ900 mm
Fig. 10 Schematic of the combined ICE/LOVA test facility
Gap adjuster
Generic bypass line

Window
Plasma chamber
Simplified vacuum vessel
Magnet valve
Relief pipe
Suppression tank
Divertor port
Window
Simulated divertor
Window
Section A-A
Window
A
A
φ120
0 m
m
φ300
mm
100
mm
φ250
0 m
m
φ900 mm
150 mm
2500 mm
Fig. 11 Elevation of plasma chamber, simulated divertor, simplified vacuum vessel, divertor port and suppression tank in the combined ICE/LOVA test facility