thermal conductivity of nano zno doped cafe
TRANSCRIPT
701xml GINF_A_1062682 June 26, 2015 15:12
GINF #1062682, VOL 16, ISS 1
Thermal Conductivity of Nano ZnO Doped CaFe2O4
WATSAYOD ANANPREECHAKORN AND TOSAWATSEETAWAN
QUERY SHEET
This page lists questions we have about your paper. The numbers displayed at left can befound in the text of the paper for reference. In addition, please review your paper as a wholefor correctness.
There are no Editor Queries for this paper.
TABLE OF CONTENTS LISTING
The table of contents for the journal will list your paper exactly as it appears below:
Thermal Conductivity of Nano ZnO Doped CaFe2O4
Watsayod Ananpreechakorn and Tosawat Seetawan
701xml GINF_A_1062682 June 26, 2015 15:12
Integrated Ferroelectrics, 16:1–8, 2015Copyright © Taylor & Francis Group, LLCISSN: 1058-4587 print / 1607-8489 onlineDOI: 10.1080/10584587.2015.1062682
Thermal Conductivity of Nano ZnO Doped CaFe2O41
WATSAYOD ANANPREECHAKORN12
AND TOSAWAT SEETAWAN2,∗3
1Program of Physics, Faculty of Science and Technology, Sakon Nakhon4Rajabhat University, 680 Nittayo Rd., Muang District, Sakon Nakhon, 47000,5Thailand62Thermoelectrics Research Center, Research and Development Institution, Sakon7Nakhon Rajabhat University, 680 Nittayo Rd., Muang District, Sakon Nakhon,847000, Thailand9
The research objective of this study was to examine whether Zn was an effective doping10element for thermal conductivity. Ca1-xZnxFe2O4 (x = 0.0–0.5) were synthesized by11solid state reaction method. The XRD results showed that all samples were mixed phase12of CaFe2O4 and ZnFe2O4. The structure of Ca1-xZnxFe2O4 (x = 0.0–0.5) belonged to13a group of an orthorhombic system (space group: Pbnm). It was observed that all the14samples of Ca1-xZnxFe2O4 (x = 0.0–0.5) had positive Seebeck coefficient as shown15on p-type semiconductor behavior. Thus thermal conductivity tended to decrease with16increasing x value. The Ca0.6Zn0.4Fe2O4 showed lowest thermal conductivity of 6.52 W17m−1 K−1 at 473 K, which was lower than 50.81% of CaFe2O4. These results suggested18that Zn was an effective doping element for improving the thermal conductivity of19Ca1-xZnxFe2O4.20
Key words Ca1-xZnxFe2O4; thermal conductivity; solid state reaction method;21orthorhombic22
1. Introduction23
Good thermoelectric materials should have large thermoelectric power and high electrical24conductivity as well as low thermal conductivity. The thermoelectric materials could be25
evaluated by the figure of merit, ZT, which is defined as ZT = S2σκ
T , where S is the26thermoelectric power, σ is the electrical conductivity, κ is the thermal conductivity, and T27is the absolute temperature. Much research have focused on materials with special structure28that are filled with atoms to scatter phonons and then reduce the lattice thermal conductivity29[1–2].30
The prototype of CaFe2O4 (Calcium ferrite) crystallization in an orthorhombic structure31with lattice constants a = 9.238Å, b = 10.716Å, and c = 3.023Å (the space group is Pnma32No.62[3], JCPDS Card No. 32-0168) is built up of eight-fold coordinated Ca atoms, and33distorted FeO6 octahedra. The electrical conductivity of CaFe2O4 has low 3–210 S cm−134at 1123–1273 K in air. Z is in the range (12.0–13.9) 10−6 K−1[4].35
Received December 22, 2014; in final form May 22, 2015.∗Corresponding author. E-mail: t [email protected] versions of one or more of the figures in the article can be found online at
www.tandfonline.com/ginf.
1
701xml GINF_A_1062682 June 26, 2015 15:12
2 W. Ananpreechakorn et al.
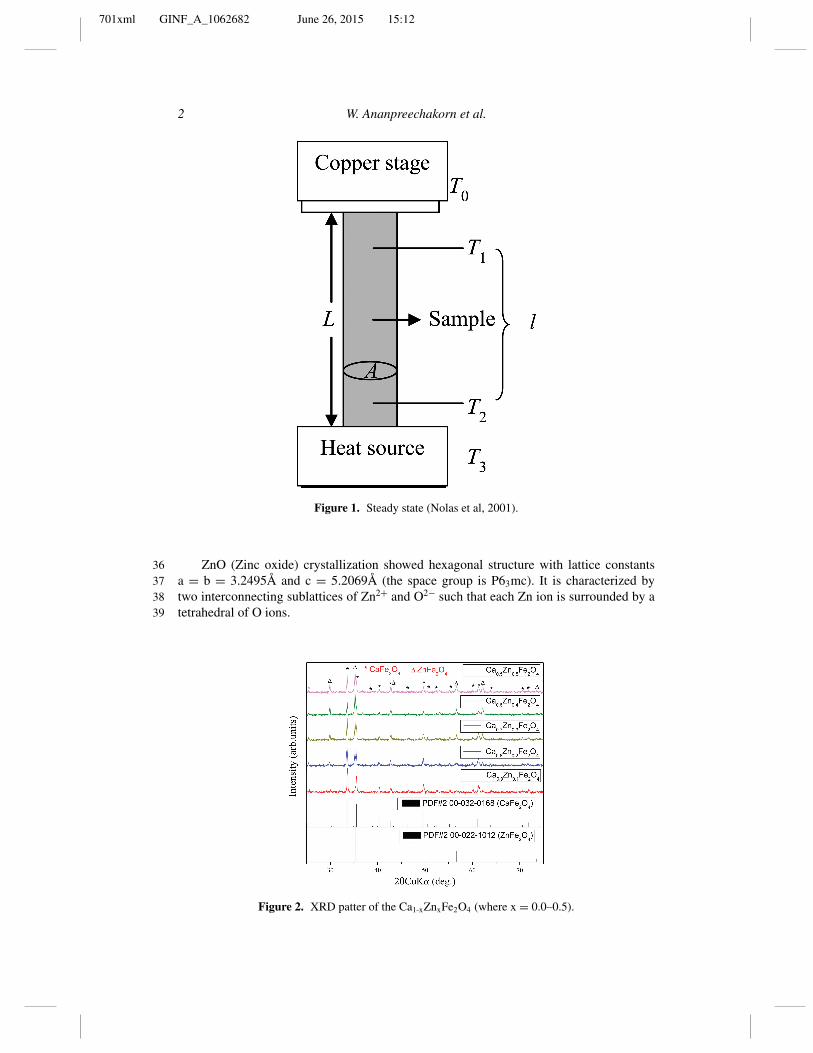
Figure 1. Steady state (Nolas et al, 2001).
ZnO (Zinc oxide) crystallization showed hexagonal structure with lattice constants36a = b = 3.2495Å and c = 5.2069Å (the space group is P63mc). It is characterized by37two interconnecting sublattices of Zn2+ and O2− such that each Zn ion is surrounded by a38tetrahedral of O ions.39
Figure 2. XRD patter of the Ca1-xZnxFe2O4 (where x = 0.0–0.5).

701xml GINF_A_1062682 June 26, 2015 15:12
Thermal Conductivity of Nano ZnO Doped CaFe2O4 3
Table 1The physical of bulk Ca1-xZnxFe2O4 (x = 0.0–0.5)
Order Samples Color Bulk material
1 CaFe2O4 Black
2 Ca0.9Zn0.1Fe2O4 Black
3 Ca0.8Zn0.2Fe2O4 Brown
4 Ca0.7Zn0.3Fe2O4 Auburn
5 Ca0.6Zn0.4Fe2O4 Auburn
6 Ca0.5Zn0.5Fe2O4 Crimson
The thermal conductivity, κ(W cm−1 K−1) of a semiconductor is an important property40when considering high-power/high temperature devices. It is a kinetic property influenced41by the vibrational, rotational and electronic degrees of freedom and is predominately limited42by phonon-phonon scattering in a pure crystal. ZnO, like most other semiconductors,43contains a large number of point defects, which have a significant effect on the thermal44conductivity. The highest measured values of thermal conductivity come from a study done45on vapour-phase grown samples which measured the conductivity on the polar faces of46ZnO [5]. This study gives the values of κ = 1.02 ± 0.07and 1.16 ± 0.08W cm−1 K−1 from47the Zn face of two different samples, and κ = 1.10 ± 0.09 and 0.98 ± 0.08W cm−1 K−148from the O face of the two samples. These values are considerably higher than other values49measured from ZnO which typically falls in the range κ = 0.6 − 1.0W cm−1 K−1 [6].50
In this work we investigated thermal conductivity of CaFe2O4 doped ZnO nanopowder51prepared by solid state reaction method.52
53
Table 2Shows the lattice parameter, unit cell volume and density of Ca1-xZnxFe2O4 (x = 0.0–0.5)
Unit Measured Relativea b c cell density density
Sample Lattice (Å) (Å) (Å) volume (Å)3 (g/cm−3) %
CaFe2O4 Orthorhombic 9.238 10.716 3.023 299.260 4.51 94.41Ca0.9Zn0.1Fe2O4 Orthorhombic 9.232 10.707 3.018 298.320 4.30 90.52Ca0.8Zn0.2Fe2O4 Orthorhombic 9.224 10.701 3.020 298.092 4.34 92.34Ca0.7Zn0.3Fe2O4 Orthorhombic 9.221 10.699 3.021 298.038 4.36 93.69Ca0.6Zn0.4Fe2O4 Orthorhombic 9.218 10.699 3.022 297.941 4.47 97.38Ca0.5Zn0.5Fe2O4 Orthorhombic 9.218 10.699 3.463 341.532 4.09 90.08
701xml GINF_A_1062682 June 26, 2015 15:12
4 W. Ananpreechakorn et al.
2. Experimental Details54
CaCO3 (95.0%, powder), ZnO (95.0%, powder), Fe2O3 (95.0%, powder) were used as the55starting materials. The polycrystalline zinc substituted calcium ferrite having the composi-56tional formula Ca1-xZnxFe2O4 (where x = 0.0, 0.1, 0.2, 0.3, 0.4 and 0.5). The preparation of57Ca1-xZnxFe2O4 (x = 0.0–0.5) started from calcined at 1073 K for 12 hr in air. The powder58then was mixed and heat treated at 1173 K for 12 hr in air, and pressed at 14.70 MPa. The59synthesized Ca1-xZnxFe2O4-type powder was ground in an agate ball milling tank for 2460hr at a speed of 1,430 revolutions per minute (rpm).61
The mixture transforms to mainly Calcium ferrite (CaFe2O4) were described by the fol-62lowing equation: CaCO3+Fe2O3 = CaFe2O4+CO2.The phase composition and morpholo-63gies of the products were analyzed through X-ray diffractometer and scanning electron64microscope.65
The thermal conductivity was calculated using the relation:66
Qcond = κA
L�T
When κ is thermal conductivity (W m−1 K−1), Ais cross-sectional area of the sample67(m2), Lis length of the sample (m), �T denotes difference in temperature (K)68
In a cross-sectional area of Fig. 1, A and the reference temperature is T0 when the69temperature high T3 was calculated using the relation as follows:70
κ = Q
A
l
(T2 − T1)
71When Q is amount of heat transmitted of the sample, l is the distance between the72
measured temperature T1 and T2.73
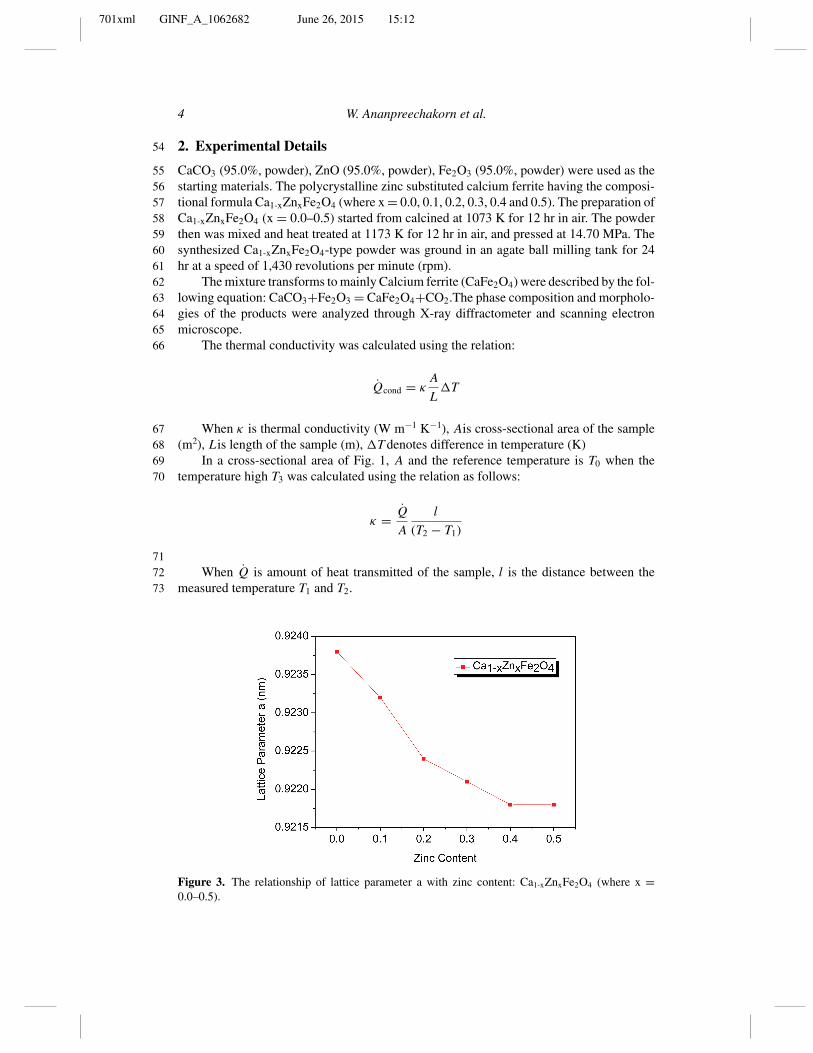
Figure 3. The relationship of lattice parameter a with zinc content: Ca1-xZnxFe2O4 (where x =0.0–0.5).
701xml GINF_A_1062682 June 26, 2015 15:12
Thermal Conductivity of Nano ZnO Doped CaFe2O4 5
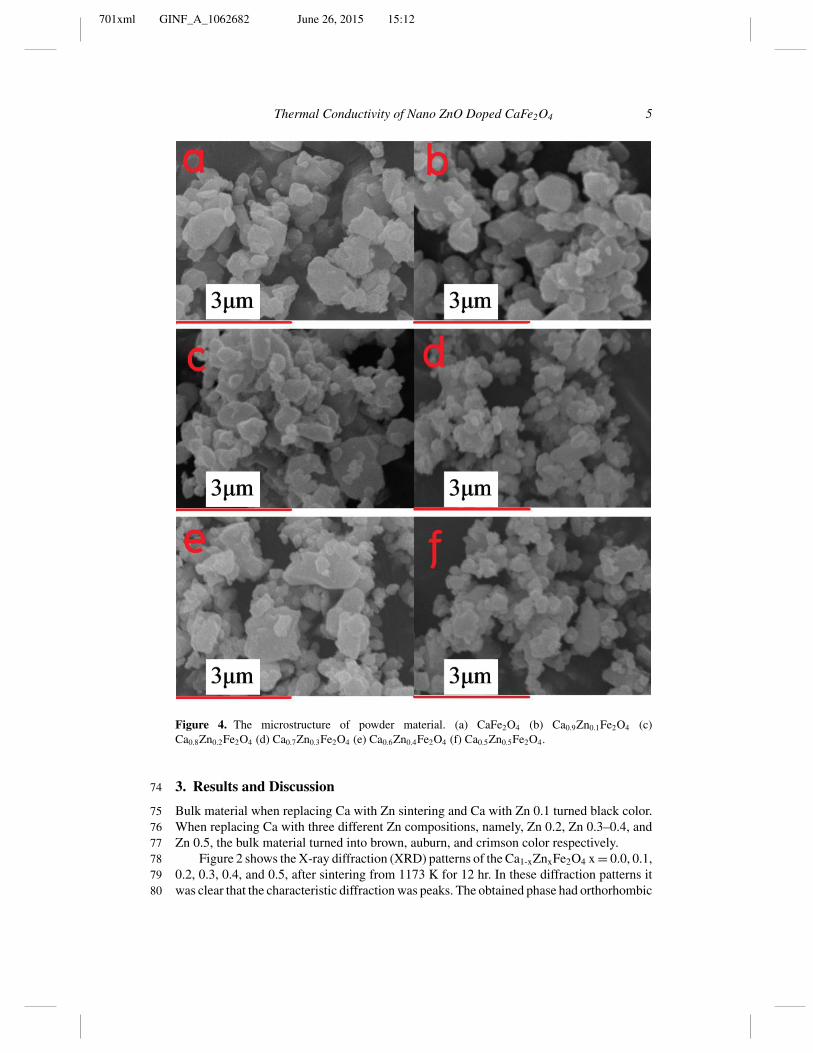
Figure 4. The microstructure of powder material. (a) CaFe2O4 (b) Ca0.9Zn0.1Fe2O4 (c)Ca0.8Zn0.2Fe2O4 (d) Ca0.7Zn0.3Fe2O4 (e) Ca0.6Zn0.4Fe2O4 (f) Ca0.5Zn0.5Fe2O4.
3. Results and Discussion74
Bulk material when replacing Ca with Zn sintering and Ca with Zn 0.1 turned black color.75When replacing Ca with three different Zn compositions, namely, Zn 0.2, Zn 0.3–0.4, and76Zn 0.5, the bulk material turned into brown, auburn, and crimson color respectively.77
Figure 2 shows the X-ray diffraction (XRD) patterns of the Ca1-xZnxFe2O4 x = 0.0, 0.1,780.2, 0.3, 0.4, and 0.5, after sintering from 1173 K for 12 hr. In these diffraction patterns it79was clear that the characteristic diffraction was peaks. The obtained phase had orthorhombic80
701xml GINF_A_1062682 June 26, 2015 15:12
6 W. Ananpreechakorn et al.
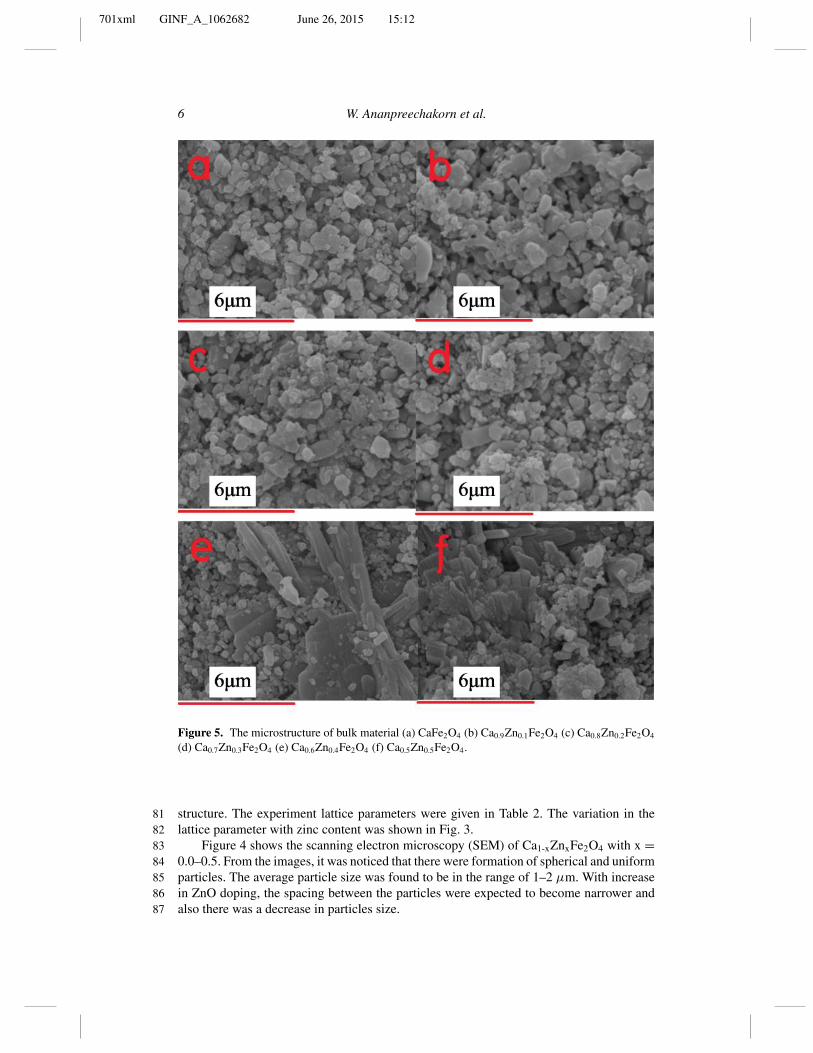
Figure 5. The microstructure of bulk material (a) CaFe2O4 (b) Ca0.9Zn0.1Fe2O4 (c) Ca0.8Zn0.2Fe2O4
(d) Ca0.7Zn0.3Fe2O4 (e) Ca0.6Zn0.4Fe2O4 (f) Ca0.5Zn0.5Fe2O4.
structure. The experiment lattice parameters were given in Table 2. The variation in the81lattice parameter with zinc content was shown in Fig. 3.82
Figure 4 shows the scanning electron microscopy (SEM) of Ca1-xZnxFe2O4 with x =830.0–0.5. From the images, it was noticed that there were formation of spherical and uniform84particles. The average particle size was found to be in the range of 1–2 μm. With increase85in ZnO doping, the spacing between the particles were expected to become narrower and86also there was a decrease in particles size.87
701xml GINF_A_1062682 June 26, 2015 15:12
Thermal Conductivity of Nano ZnO Doped CaFe2O4 7
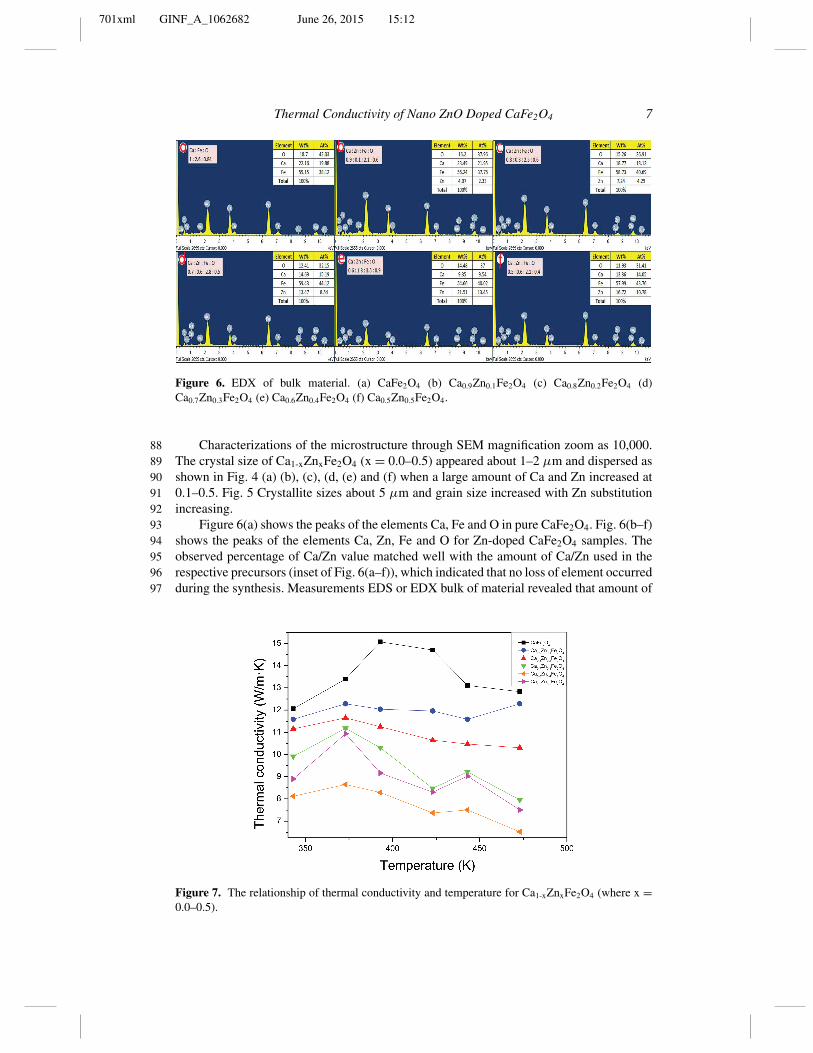
Figure 6. EDX of bulk material. (a) CaFe2O4 (b) Ca0.9Zn0.1Fe2O4 (c) Ca0.8Zn0.2Fe2O4 (d)Ca0.7Zn0.3Fe2O4 (e) Ca0.6Zn0.4Fe2O4 (f) Ca0.5Zn0.5Fe2O4.
Characterizations of the microstructure through SEM magnification zoom as 10,000.88The crystal size of Ca1-xZnxFe2O4 (x = 0.0–0.5) appeared about 1–2 μm and dispersed as89shown in Fig. 4 (a) (b), (c), (d, (e) and (f) when a large amount of Ca and Zn increased at900.1–0.5. Fig. 5 Crystallite sizes about 5 μm and grain size increased with Zn substitution91increasing.92
Figure 6(a) shows the peaks of the elements Ca, Fe and O in pure CaFe2O4. Fig. 6(b–f)93shows the peaks of the elements Ca, Zn, Fe and O for Zn-doped CaFe2O4 samples. The94observed percentage of Ca/Zn value matched well with the amount of Ca/Zn used in the95respective precursors (inset of Fig. 6(a–f)), which indicated that no loss of element occurred96during the synthesis. Measurements EDS or EDX bulk of material revealed that amount of97
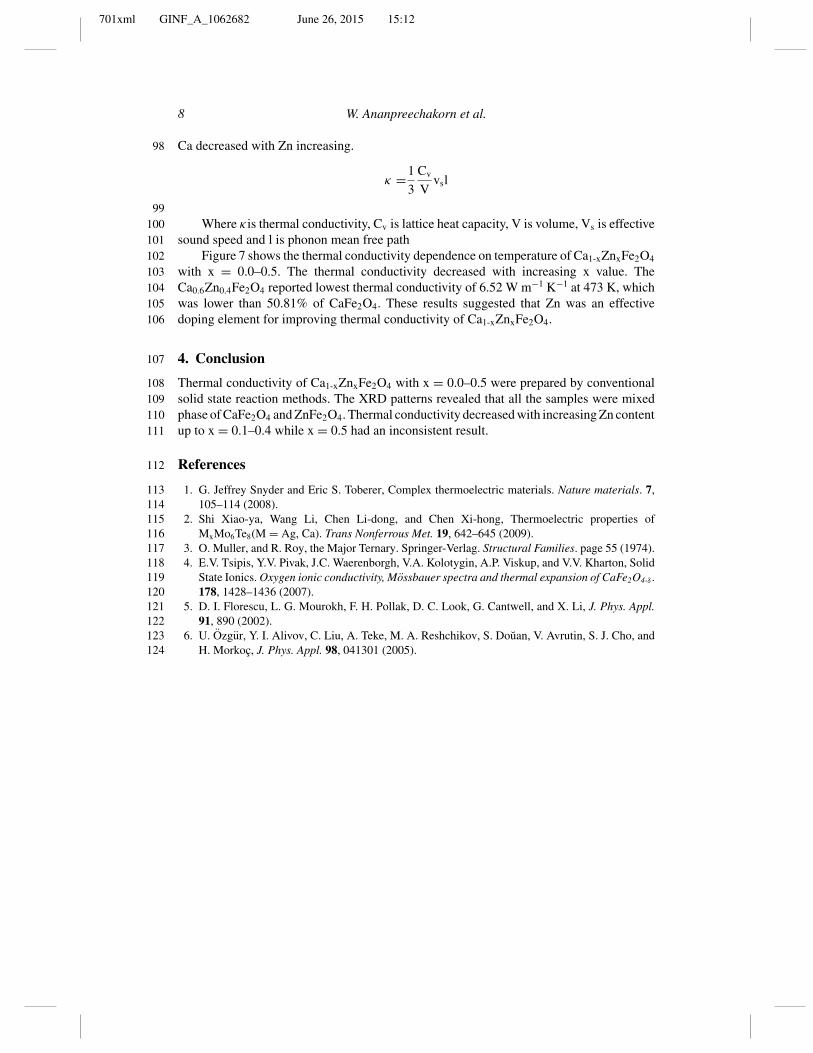
Figure 7. The relationship of thermal conductivity and temperature for Ca1-xZnxFe2O4 (where x =0.0–0.5).
701xml GINF_A_1062682 June 26, 2015 15:12
8 W. Ananpreechakorn et al.
Ca decreased with Zn increasing.98
κ =1
3
Cv
Vvsl
99Where κis thermal conductivity, Cv is lattice heat capacity, V is volume, Vs is effective100
sound speed and l is phonon mean free path101Figure 7 shows the thermal conductivity dependence on temperature of Ca1-xZnxFe2O4102
with x = 0.0–0.5. The thermal conductivity decreased with increasing x value. The103Ca0.6Zn0.4Fe2O4 reported lowest thermal conductivity of 6.52 W m−1 K−1 at 473 K, which104was lower than 50.81% of CaFe2O4. These results suggested that Zn was an effective105doping element for improving thermal conductivity of Ca1-xZnxFe2O4.106
4. Conclusion107
Thermal conductivity of Ca1-xZnxFe2O4 with x = 0.0–0.5 were prepared by conventional108solid state reaction methods. The XRD patterns revealed that all the samples were mixed109phase of CaFe2O4 and ZnFe2O4. Thermal conductivity decreased with increasing Zn content110up to x = 0.1–0.4 while x = 0.5 had an inconsistent result.111
References112
1. G. Jeffrey Snyder and Eric S. Toberer, Complex thermoelectric materials. Nature materials. 7,113105–114 (2008).114
2. Shi Xiao-ya, Wang Li, Chen Li-dong, and Chen Xi-hong, Thermoelectric properties of115MxMo6Te8(M = Ag, Ca). Trans Nonferrous Met. 19, 642–645 (2009).116
3. O. Muller, and R. Roy, the Major Ternary. Springer-Verlag. Structural Families. page 55 (1974).1174. E.V. Tsipis, Y.V. Pivak, J.C. Waerenborgh, V.A. Kolotygin, A.P. Viskup, and V.V. Kharton, Solid118
State Ionics. Oxygen ionic conductivity, Mossbauer spectra and thermal expansion of CaFe2O4-δ .119178, 1428–1436 (2007).120
5. D. I. Florescu, L. G. Mourokh, F. H. Pollak, D. C. Look, G. Cantwell, and X. Li, J. Phys. Appl.12191, 890 (2002).122
6. U. Ozgur, Y. I. Alivov, C. Liu, A. Teke, M. A. Reshchikov, S. Douan, V. Avrutin, S. J. Cho, and123H. Morkoc, J. Phys. Appl. 98, 041301 (2005).124