thermal conductivity experiment
TRANSCRIPT
CONDUCTION PROCESS AND THE MEASUREMENT OF THERMAL CONDUCTIVITY
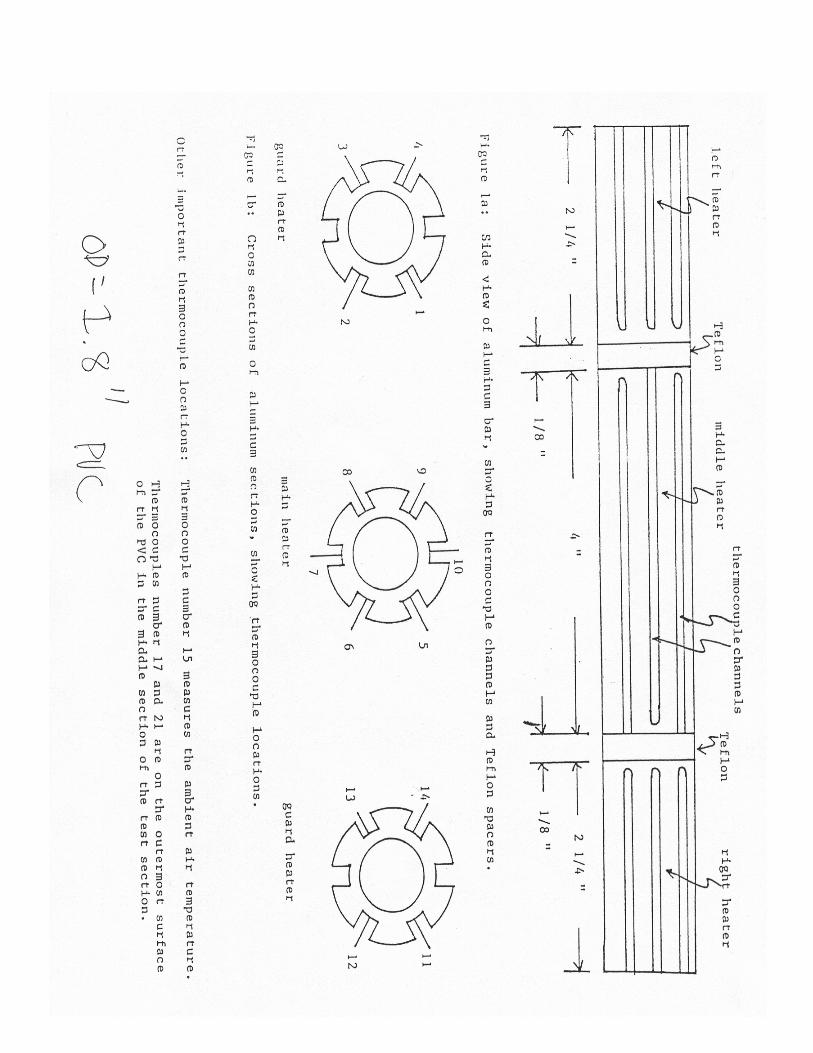
Objective: We will use this lab to investigate conduction in a cylindrical geometry and to measure thermal conductivity of a PVC material. Description: Three heaters wrap around the inside of a hollow aluminum cylinder which is itself separated from the surroundings by a wrapping PVC. The so-called guard heaters on the two ends of the rod can be adjusted individually, as can the heater on the middle (test) section. As the cylinder is axisymmetric, a proper adjustment of the end heaters will give one-dimensional heat flow in the test section. Sketches of the test section and thermocouple locations are shown in Fig1. Prelab check: 1. Read the lab manual in detail. 2. Check that the room is open, and the center heater is on at a value of 5 volts, and the two end heaters are both off. 3. Check that there is paper in the datalogger. If it is very low, inform a technician, the TA, or the professor. The datalogger must be reset when the paper is changed. Procedures: 1. The center heater should be on at a voltage setting of 5V. Check and record the current supplied for that voltage setting. The heat dissipated by the heater is the product of the voltage and the current. Check that the two end (guard) heaters are off, and also check the wires and thermocouples to be sure the locations correspond to the sketch (locations may be easier to determine while adjustments are being made.) 2. Turn on the datalogger switch in the back (it will probably beep). After a few minutes, start the recording by the following sequence, using the key board on the datalogger front: a) Press OPER; the display will read OPERATION MODE STANDBYE. b) Press NEXT; the display will read OPERATION MODE OPERATION/ AUTO. c) Press Enter-, the display will start flashing times and temperature, and time and thermocouple, values will be printed on the paper every five minutes. 3. Check for steady state conditions. Steady state conditions are achieved when three successive readings indicate that the temperature at a thermocouple is constant, or at most oscillating- or rising by 0.2 C. If the

temperature is rising, be sure to examine the ambient temperature to help you make a descision. You will need to justify in the lab report that the conditions were steady state. 4. Mark the steady state time on the datalogger output. 5. Adjust the guard heaters to obtain one-dimensional radial heat flow in the test section. Suggested starting voltages for the right heater is 7.3 volts, and 7.5 volts for the left hand guard heater. 6. When the system is again steady state, test for one-dimensional heat flow by comparing temperature 7 to temperature 14, comparing temperature 10 to temperature 3, and comparing temperature 10 to temperature 7. When these temperature pairs are equal (within an array say of 0.3 Q, then the heat flow in the test section is one-dimensional in the radial direction. 7. If heat flow is not one-dimensional, then adjust the heaters appropriately, and wait for steady state conditions again. To make this adjustment process as quick as possible, generally you will want to adjust one end heater at a time, in small increments. Do not readjust the heaters until the system has stabilized, so you do not overadjust: Do not alter the setting on the center heater, 8. When heat flow is one-dimensional, mark the time on the datalogger output, and record the voltages and the currents of all three heaters. 9. Turn off the end heaters, first resetting the voltages to zero. 10. Shut down the datalogger by the following: a) Press OPER; the display will read OPERTAION MODE OPERATE/ AUTO. b) Press NEXT; the display will read OPERATION MODE STANDBYE. c) Press ENTER-, the datalogger is now standby. Use the paper advance key to advance the chart paper until the data can be detached. On the lab report list who you did the lab with, and who will submit the original data with their report. The remaining students should photocopy the data, and submit the photocopy. On Lab Reports: Use the data you collected to answer the following question. Clearly, show any calculations that you perform, and discuss the validity of any assumptions or estimates. 1. Use an overall balance on the test section and Fourier's law to verify that one-dimensional heat transfer does indeed occur when the temperature pairs stated in section six above are equal. 2. Use an overall balance on the test section and determine the radial heat flux. 3. Using steady state data and a one-dimensional heat transfer solution, find the thermal conductivity of the PVC material.