thermal characteristics of tube bundles in ultra
TRANSCRIPT

energies
Article
Thermal Characteristics of Tube Bundles inUltra-Supercritical Boilers
Seok Min Choi 1, Jun Su Park 2, Ho-Seong Sohn 1, Seon Ho Kim 1 and Hyung Hee Cho 1,*1 Department of Mechanical Engineering, Yonsei University, Seoul 120-749, Korea;
[email protected] (S.M.C.); [email protected] (H.-S.S.); [email protected] (S.H.K.)2 Department of Energy System Engineering, Korea National University of Transportation,
Chungbuk 380-701, Korea; [email protected]* Correspondence: [email protected]; Tel.: +82-2-2123-2828
Academic Editor: Kamel HoomanReceived: 9 August 2016; Accepted: 23 September 2016; Published: 27 September 2016
Abstract: In this study, flow and thermal characteristics of tube bundles in ultra-supercritical boilerswere analyzed. The local heat transfer around the tube bundles was measured to predict the localtemperature distribution and vulnerable positions of the superheated tube bundles. The maximallysuperheated tube bundles were simulated in the laboratory and local heat transfer was measured byusing the naphthalene sublimation method. The experiment was conducted on three lines of tubebundles, all with in-line arrangements. Each line consist of six tubes. The distance in the streamwisedirection (Sx/∅) was 1.99 and that in the spanwise direction (Sz/∅) was 5.45. The Reynolds numbervaried from 5000 to 30,000, which covers a range of different operating conditions. Thermal andstress analyses were conducted numerically, based on the experimental data. The results showed thatthe flow characteristic changes the local heat transfer of the tube bundles. The flow impinged on thestagnation point of Tube 1 and reattached at 60◦ of Tube 2. The high heat transfer occurred at thosepositions of the tube bundles. The temperature and stress distributions on the surface of each tubebundle also varied. The reattachment point on Tube 2 had the highest heat transfer and temperaturedistribution. That position on Tube 2 was subjected to the highest stress due to the large temperaturegradient. This result indicates that Tube 2 of the ultra-supercritical (USC) boiler is the weakest of thetube bundles, changing the pitch of the streamwise direction of Tube 2 is one method to reduce thehighest stress in superheater tube bundles in the USC boiler.
Keywords: tube bundle; heat transfer; temperature; stress; boiler
1. Introduction
Recently, there has been significant research interest in renewable energy technologies, such asthose that enable us to generate solar and biomass energy. However, coal has provided approximately41.3% of the total power generated globally [1]. One coal power generation method uses anultra-supercritical boiler (USC boiler), as shown in Figure 1 [2]. This combines ultra-supercritical steamwith circulating fluidized bed boilers and has become the preferred coal-based power generationtechnology. Commercial supercritical steam power plants were introduced in the late 1950s. Since then,substantial research has been carried out to enhance their efficiency and performance.
Dekhtiarev [3] suggested that CO2 power cycles have an advantage to produce electricity.Feher [4] suggested a thermodynamic explanation of a supercritical CO2 Brayton cycle in powergeneration applications for high thermal efficiency. Kang et al. [5] conducted a numerical analysisto study the effects of separated overfire air (SOFA) of coal-fired boilers for the reduction of NOxemission. They found the optimum position of SOFA for low NOx emission. Pan et al. [6] carriedout a thermal-hydraulic analysis in a 600 MW supercritical circulating fluidized bed (CFB) boiler.
Energies 2016, 9, 779; doi:10.3390/en9100779 www.mdpi.com/journal/energies

Energies 2016, 9, 779 2 of 14
They suggested that water wall tubes have a good heat transfer performance and low flow resistance.Fan et al. [7] conducted the conceptual design for the CFB boiler. They reported the effect of plant sitecondition and coal for the efficient USC CFB boiler. Hou et al. [8] suggested a new modeling for theUSC power plant. They presented the T-S model identification approach to increase the performanceof the power plant. Wang et al. [9] conducted the advanced thermodynamic analysis and evaluated asupercritical power plant. They analyzed the thermodynamic efficiencies by considering the exergydestruction by splitting the components of the power plant. Xu et al. [10] suggested the novel fluegas heat recovery system for improving the power plant efficiency. With their heat recovery system,$2.6 million can be saved per year. Yang et al. [11] conducted the parametric study of a USC powerplant based on exergy evaluation. They conducted the exergy evaluation on the aspect of energysavings. Liu et al. [12] suggested a fuzzy neural network to model the 1000 MW USC power plant.They compared their network with a recursive least square method and concluded that their networksystem was more applicable for analyzing the 1000 MW USC power plant.
Energies 2016, 9, 779 2 of 14
Fan et al. [7] conducted the conceptual design for the CFB boiler. They reported the effect of plant site
condition and coal for the efficient USC CFB boiler. Hou et al. [8] suggested a new modeling for the
USC power plant. They presented the T‐S model identification approach to increase the performance
of the power plant. Wang et al. [9] conducted the advanced thermodynamic analysis and evaluated
a supercritical power plant. They analyzed the thermodynamic efficiencies by considering the exergy
destruction by splitting the components of the power plant. Xu et al. [10] suggested the novel flue
gas heat recovery system for improving the power plant efficiency. With their heat recovery system,
$2.6 million can be saved per year. Yang et al. [11] conducted the parametric study of a USC power
plant based on exergy evaluation. They conducted the exergy evaluation on the aspect of energy
savings. Liu et al. [12] suggested a fuzzy neural network to model the 1000 MW USC power plant.
They compared their network with a recursive least square method and concluded that their network
system was more applicable for analyzing the 1000 MW USC power plant.
Figure 1. Schematic of ultra‐supercritical boiler [2].
In USC boilers, there are numerous tube bundles that are used for heat exchange, as shown in
Figure 1. Extensive research has been performed with the goal of enhancing the performance of tube
bundles and analyzing their failures. Viswanathan et al. [13,14] reported materials appropriate for
use in ultra‐supercritical power plant boilers. They developed materials that are capable of operating
at 760 °C and 35 MPa steam. Castello et al. [15] studied the effect of fuel‐ash corrosion inside the
superheater tubes of USC boilers under laboratory conditions. They investigated the effect of coating
the superheater tubes. In addition, Lee et al. [16] conducted a failure analysis on boiler tubes in USC
coal power plants. They found that creep ruptures can be caused by softened structures. Furthermore,
Krauss et al. [17] investigated the momentum and energy transport in a heated rod bundle. They
found that a lower gradient‐to‐diameter ratio increased the heat transfer efficiency.
Chen et al. [18] conducted an experiment to measure heat transfer and pressure drops inside
H‐type finned tube banks. Based on their experimental results, they suggested correlations among
the fin efficiency, Nusselt number, and Euler number. Yeo et al. [19] presumed the oxide scale growth in
a high steam condition by numerical simulation. They concluded that steam temperatures up to 750 °C
are allowable in service. Yuan et al. [20] analyzed the tensile and creep deformation for a newly‐
developed Ni‐Fe‐based superalloy. They found that the new material can endure 750 °C for 5400 h.
Figure 1. Schematic of ultra-supercritical boiler [2].
In USC boilers, there are numerous tube bundles that are used for heat exchange, as shown inFigure 1. Extensive research has been performed with the goal of enhancing the performance of tubebundles and analyzing their failures. Viswanathan et al. [13,14] reported materials appropriate foruse in ultra-supercritical power plant boilers. They developed materials that are capable of operatingat 760 ◦C and 35 MPa steam. Castello et al. [15] studied the effect of fuel-ash corrosion inside thesuperheater tubes of USC boilers under laboratory conditions. They investigated the effect of coatingthe superheater tubes. In addition, Lee et al. [16] conducted a failure analysis on boiler tubes in USCcoal power plants. They found that creep ruptures can be caused by softened structures. Furthermore,Krauss et al. [17] investigated the momentum and energy transport in a heated rod bundle. They foundthat a lower gradient-to-diameter ratio increased the heat transfer efficiency.
Chen et al. [18] conducted an experiment to measure heat transfer and pressure drops inside H-typefinned tube banks. Based on their experimental results, they suggested correlations among the finefficiency, Nusselt number, and Euler number. Yeo et al. [19] presumed the oxide scale growth in a highsteam condition by numerical simulation. They concluded that steam temperatures up to 750 ◦C are

Energies 2016, 9, 779 3 of 14
allowable in service. Yuan et al. [20] analyzed the tensile and creep deformation for a newly-developedNi-Fe-based superalloy. They found that the new material can endure 750 ◦C for 5400 h.
Most research into the USC boiler tube bundles has concentrated on the effects of the materialproperties and corrosion inside the superheater tubes. As the superheater tubes have graduallybeen exposed to higher thermal loads, predicting local temperature distributions has become moreimportant. Metzger [21], Armstrong [22], Sparrow [23], Goldstein [24], and Chyu [25] studied theflow characteristics and local heat transfer distribution around the tube bundles. They found that astaggered array of tube bundles has a higher heat transfer rate than an in-line array of tube bundles.Ji et al. [26] conducted heat transfer analysis of elastic tube bundles in heat exchangers. They found thatheat transfer of each elastic tube bundles increased significantly with tube vibrations. Eter et al. [27]investigated the heat transfer of three-rod bundles in supercritical condition. They found that thesupercritical heat transfer coefficient decreased with increasing heat flux. Zhang et al. [28] measuredthe heat transfer of a tube bank with the higher oblique fluid flow. They revealed that heat transferand the friction factor increased with the oblique angle. Shen et al. [29] analyzed the heat transferperformance of horizontal tube bundles. They concluded that a greater column number of tubebundles weakens the heat transfer. Pis’mennyi et al. [30] investigated the drag of in-line finned tubesexperimentally. They found the correlation between the Reynolds number and finned tube geometries.
The tube bundles in typical USC boilers are positioned in the in-line arrangement, as shown inFigure 2. Area averaged heat transfer of the tube bundles can be predicted by correlations, however,the local heat transfer cannot be predictable. Furthermore, as the operating condition of the USCboiler has become harsh, analyzing the local thermal properties of tube bundles becomes important.Therefore, the flow and thermal properties of tube bundles were analyzed to predict the vulnerableposition of tube bundles. The local heat transfer distribution was measured using the naphthalenesublimation method for various Reynolds numbers. Based on experimental data, the thermal propertiesand stress effects of tube bundles were analyzed by numerical simulation. The most vulnerable positionof tube bundles inside the USC boilers will be predicted by the results.
Energies 2016, 9, 779 3 of 14
Most research into the USC boiler tube bundles has concentrated on the effects of the material
properties and corrosion inside the superheater tubes. As the superheater tubes have gradually been
exposed to higher thermal loads, predicting local temperature distributions has become more
important. Metzger [21], Armstrong [22], Sparrow [23], Goldstein [24], and Chyu [25] studied the
flow characteristics and local heat transfer distribution around the tube bundles. They found that a
staggered array of tube bundles has a higher heat transfer rate than an in‐line array of tube bundles.
Ji et al. [26] conducted heat transfer analysis of elastic tube bundles in heat exchangers. They found
that heat transfer of each elastic tube bundles increased significantly with tube vibrations.
Eter et al. [27] investigated the heat transfer of three‐rod bundles in supercritical condition. They
found that the supercritical heat transfer coefficient decreased with increasing heat flux.
Zhang et al. [28] measured the heat transfer of a tube bank with the higher oblique fluid flow. They
revealed that heat transfer and the friction factor increased with the oblique angle. Shen et al. [29]
analyzed the heat transfer performance of horizontal tube bundles. They concluded that a greater
column number of tube bundles weakens the heat transfer. Pis’mennyi et al. [30] investigated the
drag of in‐line finned tubes experimentally. They found the correlation between the Reynolds
number and finned tube geometries.
The tube bundles in typical USC boilers are positioned in the in‐line arrangement, as shown in
Figure 2. Area averaged heat transfer of the tube bundles can be predicted by correlations, however,
the local heat transfer cannot be predictable. Furthermore, as the operating condition of the USC
boiler has become harsh, analyzing the local thermal properties of tube bundles becomes important.
Therefore, the flow and thermal properties of tube bundles were analyzed to predict the vulnerable
position of tube bundles. The local heat transfer distribution was measured using the naphthalene
sublimation method for various Reynolds numbers. Based on experimental data, the thermal
properties and stress effects of tube bundles were analyzed by numerical simulation. The most
vulnerable position of tube bundles inside the USC boilers will be predicted by the results.
Figure 2. (a) Side view of final super heater; (b) Top view of final super heater.
2. Experimental Method
2.1. Experimental Apparatus
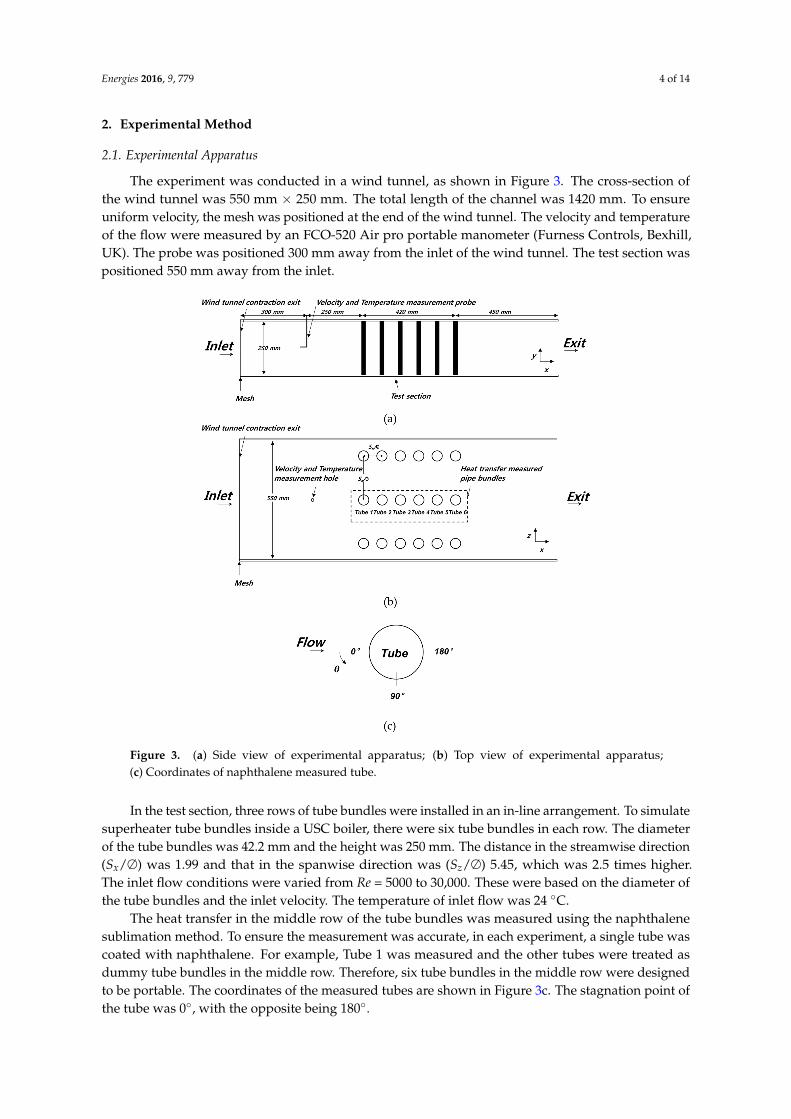
The experiment was conducted in a wind tunnel, as shown in Figure 3. The cross‐section of the
wind tunnel was 550 mm × 250 mm. The total length of the channel was 1420 mm. To ensure uniform
Figure 2. (a) Side view of final super heater; (b) Top view of final super heater.
Energies 2016, 9, 779 4 of 14
2. Experimental Method
2.1. Experimental Apparatus
The experiment was conducted in a wind tunnel, as shown in Figure 3. The cross-section ofthe wind tunnel was 550 mm × 250 mm. The total length of the channel was 1420 mm. To ensureuniform velocity, the mesh was positioned at the end of the wind tunnel. The velocity and temperatureof the flow were measured by an FCO-520 Air pro portable manometer (Furness Controls, Bexhill,UK). The probe was positioned 300 mm away from the inlet of the wind tunnel. The test section waspositioned 550 mm away from the inlet.
Energies 2016, 9, 779 4 of 14
velocity, the mesh was positioned at the end of the wind tunnel. The velocity and temperature of the
flow were measured by an FCO‐520 Air pro portable manometer (Furness Controls, Bexhill, UK). The
probe was positioned 300 mm away from the inlet of the wind tunnel. The test section was positioned
550 mm away from the inlet.
Figure 3. (a) Side view of experimental apparatus; (b) Top view of experimental apparatus;
(c) Coordinates of naphthalene measured tube.
In the test section, three rows of tube bundles were installed in an in‐line arrangement. To
simulate superheater tube bundles inside a USC boiler, there were six tube bundles in each row. The
diameter of the tube bundles was 42.2 mm and the height was 250 mm. The distance in the streamwise
direction (Sx/∅) was 1.99 and that in the spanwise direction was (Sz/∅) 5.45, which was 2.5 times
higher. The inlet flow conditions were varied from Re = 5000 to 30,000. These were based on the
diameter of the tube bundles and the inlet velocity. The temperature of inlet flow was 24 °C.
The heat transfer in the middle row of the tube bundles was measured using the naphthalene
sublimation method. To ensure the measurement was accurate, in each experiment, a single tube was
coated with naphthalene. For example, Tube 1 was measured and the other tubes were treated as
dummy tube bundles in the middle row. Therefore, six tube bundles in the middle row were designed
to be portable. The coordinates of the measured tubes are shown in Figure 3c. The stagnation point
of the tube was 0°, with the opposite being 180°.
2.2. Data Reduction
The naphthalene sublimation method has the advantage of enabling us to neglect heat loss by
both conduction and radiation. Thus, the heat transfer was measured precisely. The sublimation
depth of the naphthalene was measured using a linear variable differential transformer (LVDT). The
Figure 3. (a) Side view of experimental apparatus; (b) Top view of experimental apparatus;(c) Coordinates of naphthalene measured tube.
In the test section, three rows of tube bundles were installed in an in-line arrangement. To simulatesuperheater tube bundles inside a USC boiler, there were six tube bundles in each row. The diameterof the tube bundles was 42.2 mm and the height was 250 mm. The distance in the streamwise direction(Sx/∅) was 1.99 and that in the spanwise direction was (Sz/∅) 5.45, which was 2.5 times higher.The inlet flow conditions were varied from Re = 5000 to 30,000. These were based on the diameter ofthe tube bundles and the inlet velocity. The temperature of inlet flow was 24 ◦C.
The heat transfer in the middle row of the tube bundles was measured using the naphthalenesublimation method. To ensure the measurement was accurate, in each experiment, a single tube wascoated with naphthalene. For example, Tube 1 was measured and the other tubes were treated asdummy tube bundles in the middle row. Therefore, six tube bundles in the middle row were designedto be portable. The coordinates of the measured tubes are shown in Figure 3c. The stagnation point ofthe tube was 0◦, with the opposite being 180◦.

Energies 2016, 9, 779 5 of 14
2.2. Data Reduction
The naphthalene sublimation method has the advantage of enabling us to neglect heat loss byboth conduction and radiation. Thus, the heat transfer was measured precisely. The sublimation depthof the naphthalene was measured using a linear variable differential transformer (LVDT). The linearmotion guide and step motors moved the LVDT to measure the naphthalene sublimation depth.Therefore, the LVDT measured the spatially-resolved layer thickness of the naphthalene sublimationdepth. The mass transfer coefficient can be calculated from the sublimation depth of the naphthalene.The mass transfer coefficient is described by the following equation:
hm =
.m(
ρv,w − ρv,∞) =
ρs (∆z/∆t)ρv,w
(1)
where.
m is the mass transfer rate of naphthalene per unit area. The mass transfer coefficient (hm)was calculated using the density of solid naphthalene (ρs), the naphthalene sublimation rate (∆z/∆t),the vapor density of naphthalene on the surface (ρv,w), and the vapor density of naphthalene in bulkair (ρv,∞).
The non-dimensional form of the mass transfer coefficient (Sh) can be expressed by thefollowing equation:
Sh =hm∅Dnaph
(2)
where ∅ is the diameter of the tube bundles, hm is the mass transfer coefficient, and Dnaph isthe diffusion coefficient of naphthalene. The value of Dnaph used in this study was taken fromAmbrose et al. [31] and Goldstein and Cho [32].
The mass and heat transfer analogy observed by Eckert et al. [33] was used to calculate the heattransfer coefficient from the mass transfer coefficient. The relationship between the Sherwood number(Sh) and the Nusselt number (Nu) is described by the following equation:
NuSh
=
(PrSc
)0.4,
NuSh
= 0.624 (3)
The value of the Schmidt number (Sc) was 2.28 and the Prandtl number (Pr) was 0.7 when theair was 25 ◦C. Therefore, the ratio of Nu/Sh was 0.624. Using the uncertainty estimation method fromAbernety et al. [34], the uncertainty of the Sherwood number was calculated to be ±7.8%.
2.3. Numerical Simulation Method
Numerical analysis was conducted to enable us to characterize the flow and thermal propertiesof the system. For the flow calculation, the wind tunnel and test section were modeled usinga computer-aided design program (CATIA v.5). A grid topology was used in the numerical analysis.This was formed by the ANSYS meshing tool (ver.15). The number of grid cells was around two million.The same grid was used in three cases where only the Reynolds numbers were varied. ANSYS CFXver.15 was used for numerical analysis. The shear stress transport turbulence model (SST) was used tosolve the continuity and momentum equations. This SST model combines the k-ε turbulence modeland k-ω turbulence model. The inner region of boundary layer was solved by the k-ω turbulencemodel and free shear flow was solved by the k-ε turbulence model. Three different Reynolds numbercases were solved. The velocity of each case was varied. The velocity is based on the diameter of thetube bundle and the Reynolds number.
Thermal analysis was also performed using numerical simulation. Six hollow tube bundles, whichwere made from structural steel, were simulated. The material properties, such as thermal conductivity,thermal expansion coefficient, elasticity, and Poisson ratio, were chosen from the ANSYS engineeringdata. The measured heat transfer coefficient was applied to the outer surface of the tube bundles at

Energies 2016, 9, 779 6 of 14
an ambient temperature of 650 ◦C. On the inner side of the tube bundles, a heat transfer coefficientof 10,000 W/m2·◦C was selected at an ambient temperature of 560 ◦C. These boundary conditionswere based on the operating condition data for the USC boiler. Thermal analysis results enabled us toperform a stress analysis.
3. Results and Discussion
3.1. Flow Characteristics
Local heat transfer characteristics can be understood easily by analyzing flow characteristics.The streamwise velocity distribution of each of the three cases is shown in Figure 4. The velocity isdifferent for each case, but the flow characteristics are similar. The flow impinged on the stagnationpoint of Tube 1. The flow passed around the surface of the tube bundles smoothly until the separationof the flow began in the x/∅ = 0 region. After the flow separation, a pair of vortices appeared behindTube 1.
Energies 2016, 9, 779 6 of 14
3. Results and Discussion
3.1. Flow Characteristics
Local heat transfer characteristics can be understood easily by analyzing flow characteristics.
The streamwise velocity distribution of each of the three cases is shown in Figure 4. The velocity is
different for each case, but the flow characteristics are similar. The flow impinged on the stagnation
point of Tube 1. The flow passed around the surface of the tube bundles smoothly until the separation
of the flow began in the x/∅ = 0 region. After the flow separation, a pair of vortices appeared behind Tube 1.
Figure 4. Flow at middle row of tube bundles: (a) Re = 5000; (b) Re = 15,000; (c) Re = 30,000.
The distance in the streamwise direction is much shorter than that in the spanwise direction. For
this reason, the distance in this direction was insufficient for the flow to develop. Therefore, the flow
reattached in the x/∅ = 1.7 region of Tube 2. After the flow reattached, similar flow characteristics
occurred periodically behind Tubes 3–5. As shown in Figure 4, the three different Reynolds number
cases had similar flow characteristics in the region where the flow developed. Behind Tube 6, different
flow characteristics were observed. However, if there are more rows of tube bundles, flow characteristics
similar to those at Tubes 3–5 will be observed behind Tube 6. From these results, the flow characteristics
of the final superheater Tube 1 and USC boiler will be similar to those shown in Figure 4.
3.2. Heat Transfer Characteristics
The experimental results were compared with previously‐reported results to confirm the
conclusions regarding heat transfer. Figure 5 shows a comparison between the correlation reported
by Zukauskas [35] and measured experimental results. The Nusselt number correlation for an in‐line
array of tube bundles by Zukauskas [35] is calculated using the following formula:
Figure 4. Flow at middle row of tube bundles: (a) Re = 5000; (b) Re = 15,000; (c) Re = 30,000.
The distance in the streamwise direction is much shorter than that in the spanwise direction.For this reason, the distance in this direction was insufficient for the flow to develop. Therefore,the flow reattached in the x/∅ = 1.7 region of Tube 2. After the flow reattached, similar flowcharacteristics occurred periodically behind Tubes 3–5. As shown in Figure 4, the three differentReynolds number cases had similar flow characteristics in the region where the flow developed.Behind Tube 6, different flow characteristics were observed. However, if there are more rows of tubebundles, flow characteristics similar to those at Tubes 3–5 will be observed behind Tube 6. From theseresults, the flow characteristics of the final superheater Tube 1 and USC boiler will be similar to thoseshown in Figure 4.

Energies 2016, 9, 779 7 of 14
3.2. Heat Transfer Characteristics
The experimental results were compared with previously-reported results to confirm theconclusions regarding heat transfer. Figure 5 shows a comparison between the correlation reportedby Zukauskas [35] and measured experimental results. The Nusselt number correlation for an in-linearray of tube bundles by Zukauskas [35] is calculated using the following formula:
NuD = 0.255Re0.63D Pr0.36 (4)
where NuD is the total area-averaged Nusselt number distribution of the tube bundles, ReD is theReynolds number based on the diameter of tube bundle, and Pr is the Prandtl number. The resultsshow that the experimental results correlate well with the results reported previously [35]. Therefore,experimental results were confident.
Energies 2016, 9, 779 7 of 14
0.255 . . (4)
where is the total area‐averaged Nusselt number distribution of the tube bundles, is the
Reynolds number based on the diameter of tube bundle, and Pr is the Prandtl number. The results
show that the experimental results correlate well with the results reported previously [35]. Therefore,
experimental results were confident.
Figure 5. Comparison of experimental results.
Figure 6 shows the area‐averaged Nu/Re0.63 of each tube bundle with various Reynolds numbers.
As the experimental results correlated well with the findings of Zukauskas, Nu/Re0.63 had similar heat
transfer values in cases with different Reynolds numbers. The laminar flow impinged on Tube 1 and
flow separation occurred. The highest heat transfer occurred at Tube 2. This decreased as the flow
developed. The area‐averaged heat transfer rates at Tubes 3–6 were similar. From these results, when
the flow became fully developed, the area‐averaged values of the heat transfer were similar at each
tube. Furthermore, if more rows of tube bundles were placed beyond Tube 6, the value of the
area‐averaged heat transfer would be similar to that of Tubes 3–6.
Figure 6. Area averaged Nu/Re0.63 of each tube bundle at various Reynolds numbers.
The local mass transfer distribution which was measured by the naphthalene sublimation
method is shown in Figure 7a. Figure 7a shows the local Nusselt number distribution of Tube 1 in the
case of Re = 30,000. The variation of the local heat transfer depended on the angle. The angle was
small in the vertical direction. As the flow had a uniform velocity distribution in the vertical direction,
the heat transfer rate was similar. Other tube bundles have different Nusselt number distributions,
but the variations of the heat transfer in the vertical direction were similar to the variation
1000 10000 10000010
100
1000 Zukauskaus [25] Experiment
Nu
Re
1 2 3 4 5 60.0
0.1
0.2
0.3
0.4
0.5
Nu
/Re0.
63
Tube number
Re = 5000 Re = 15000 Re = 30000
Figure 5. Comparison of experimental results.
Figure 6 shows the area-averaged Nu/Re0.63 of each tube bundle with various Reynolds numbers.As the experimental results correlated well with the findings of Zukauskas, Nu/Re0.63 had similarheat transfer values in cases with different Reynolds numbers. The laminar flow impinged on Tube 1and flow separation occurred. The highest heat transfer occurred at Tube 2. This decreased as theflow developed. The area-averaged heat transfer rates at Tubes 3–6 were similar. From these results,when the flow became fully developed, the area-averaged values of the heat transfer were similar ateach tube. Furthermore, if more rows of tube bundles were placed beyond Tube 6, the value of thearea-averaged heat transfer would be similar to that of Tubes 3–6.
Energies 2016, 9, 779 7 of 14
0.255 . . (4)
where is the total area‐averaged Nusselt number distribution of the tube bundles, is the
Reynolds number based on the diameter of tube bundle, and Pr is the Prandtl number. The results
show that the experimental results correlate well with the results reported previously [35]. Therefore,
experimental results were confident.
Figure 5. Comparison of experimental results.
Figure 6 shows the area‐averaged Nu/Re0.63 of each tube bundle with various Reynolds numbers.
As the experimental results correlated well with the findings of Zukauskas, Nu/Re0.63 had similar heat
transfer values in cases with different Reynolds numbers. The laminar flow impinged on Tube 1 and
flow separation occurred. The highest heat transfer occurred at Tube 2. This decreased as the flow
developed. The area‐averaged heat transfer rates at Tubes 3–6 were similar. From these results, when
the flow became fully developed, the area‐averaged values of the heat transfer were similar at each
tube. Furthermore, if more rows of tube bundles were placed beyond Tube 6, the value of the
area‐averaged heat transfer would be similar to that of Tubes 3–6.
Figure 6. Area averaged Nu/Re0.63 of each tube bundle at various Reynolds numbers.
The local mass transfer distribution which was measured by the naphthalene sublimation
method is shown in Figure 7a. Figure 7a shows the local Nusselt number distribution of Tube 1 in the
case of Re = 30,000. The variation of the local heat transfer depended on the angle. The angle was
small in the vertical direction. As the flow had a uniform velocity distribution in the vertical direction,
the heat transfer rate was similar. Other tube bundles have different Nusselt number distributions,
but the variations of the heat transfer in the vertical direction were similar to the variation
1000 10000 10000010
100
1000 Zukauskaus [25] Experiment
Nu
Re
1 2 3 4 5 60.0
0.1
0.2
0.3
0.4
0.5
Nu
/Re0.
63
Tube number
Re = 5000 Re = 15000 Re = 30000
Figure 6. Area averaged Nu/Re0.63 of each tube bundle at various Reynolds numbers.

Energies 2016, 9, 779 8 of 14
The local mass transfer distribution which was measured by the naphthalene sublimation methodis shown in Figure 7a. Figure 7a shows the local Nusselt number distribution of Tube 1 in the case ofRe = 30,000. The variation of the local heat transfer depended on the angle. The angle was small in thevertical direction. As the flow had a uniform velocity distribution in the vertical direction, the heattransfer rate was similar. Other tube bundles have different Nusselt number distributions, but thevariations of the heat transfer in the vertical direction were similar to the variation characteristics ofTube 1. Therefore, the local Nusselt number distribution of Tube 1 was presented as an example.
Figure 7b,c shows the magnitude of the vertically averaged local heat transfer distributionfor Re = 30,000. The heat transfer pattern was different for Tubes 1 and 2, as shown in Figure 7b.As mentioned previously, there was a high rate of heat transfer at the reattachment point near Tube 1.At Tube 1, the heat transfer gradually decreased as the angle increased. This was much lower in theseparation region. The heat transfer in the separation region was around 45% of that in the stagnationpoint region. As the Reynolds number increased, the heat transfer decreased less. The characteristicsof Tube 1 were similar to those reported elsewhere [36].
The heat transfer characteristics of Tube 2 differed from those of Tube 1. Tube 2 had the highestheat transfer at an angle of 60◦. At this angle, the flow reattached for every Reynolds number. The heattransfer in the reattachment region was higher than that at 0◦. The reattachment region had around169% of heat transfer in the 0◦ region. After the flow reattachment, the heat transfer decreased gradually.The development of the heat transfer flow in Tubes 3–6 is shown in Figure 7c. As the flow developed,the local heat transfer varied less. The difference between the maximum and minimum heat transferat Tube 3 was around 60. However, at Tube 6 with Re = 30,000, the difference was approximately 50.Similar characteristics were observed for each of the three Reynolds numbers.
Thermal analysis based on local heat transfer distribution data was conducted, as mentionedbefore. Figure 8 shows the local temperature distribution on tube bundles with Re = 30,000. As the heattransfer distributions varied from Tube 1 to Tube 6, the temperatures varied. The highest temperaturewas observed at Tube 2. Figure 8b shows the local temperature distributions at Tubes 1 and 2.The temperature at the stagnation point was high due to the flow impingement. The temperaturegradually decreased until 90◦, after which it increased due to the effect of vortex shedding. On Tube 2,the angles 60◦ and 300◦ had the highest level of temperature flow reattachment. Figure 8c shows thelocal temperature distribution of Tubes 3–6. As the heat transfer coefficients were similar due to thedevelopment of the flow, the temperature distributions of the tube bundles were similar. At Tubes 3–5,the angles 0◦ and 180◦ had high temperatures and there were low temperatures at the angles 90◦ and270◦. However, the temperature deviation was within 1–2 ◦C. The temperature of Tube 6 was thelowest around 180◦. This was not the case for other tube bundles. This is because there are no othertube bundles after Tube 6. If there were further tube bundles after Tube 6, the temperature distributionwould be similar to that observed at Tubes 3–5.
The temperature distribution results were used to perform stress analyses. Figure 9a shows theresults of the stress analysis for each tube bundle. The stress analysis results were nondimensionalizedby the maximum stress. The results show that the highest stress occurred at Tube 2. This was due tothe high deviations in the temperature distribution. Figure 9b,c shows the local stress distributions atTubes 1–6. At Tube 2, the largest stress occurred at angles 60◦ and 300◦. The cause of the high level ofstress is the large temperature gradient and the high temperature. The stress analysis results indicatethat Tube 2 is the most vulnerable of the superheater tube bundles in the USC boiler.
The cause of large stress on Tube 2 can be released by moving the position of Tube 2. The high heattransfer occurred at 60◦ of Tube 2 where the flow reattached. Moving the position of Tube 2 aroundx/∅ = 0.5–1.0 can avoid the flow reattachment of Tube 2. The high heat transfer can be avoided, whichcauses high stress on Tube 2. However, considering other factors, such as deposition, corrosion, etc.,will be helpful in predicting the flow and heat transfer of superheater tube bundles in the USC boilermore precisely.

Energies 2016, 9, 779 9 of 14
Energies 2016, 9, 779 9 of 14
Figure 7. (a) Nusselt number distribution of Tube 1 at Re = 30,000, Vertically averaged Nusselt
number; (b) Tubes 1 and 2; (c) Tubes 3–6.
Figure 7. (a) Nusselt number distribution of Tube 1 at Re = 30,000, Vertically averaged Nusselt number;(b) Tubes 1 and 2; (c) Tubes 3–6.

Energies 2016, 9, 779 10 of 14Energies 2016, 9, 779 10 of 14
Figure 8. (a) Temperature distribution of tube bundles for Re = 30,000, Vertically averaged
temperature distribution; (b) Tubes 1 and 2; (c) Tubes 3–6.
Figure 8. (a) Temperature distribution of tube bundles for Re = 30,000, Vertically averaged temperaturedistribution; (b) Tubes 1 and 2; (c) Tubes 3–6.

Energies 2016, 9, 779 11 of 14
Energies 2016, 9, 779 11 of 14
Figure 9. (a) Stress distribution of tube bundles for Re = 30,000, Vertically averaged stress distribution;
(b) Tubes 1 and 2; (c) Tubes 3–6.
Figure 9. (a) Stress distribution of tube bundles for Re = 30,000, Vertically averaged stress distribution;(b) Tubes 1 and 2; (c) Tubes 3–6.

Energies 2016, 9, 779 12 of 14
4. Conclusions
Heat transfer in tube bundles was measured experimentally for various Reynolds numbers.The local heat transfer distributions were measured using the naphthalene sublimation method, whichis based on the analogy between heat and mass transfer. Results showed that the flow impingedon the stagnation point at Tube 1 and reattached at Tube 2. High levels of heat transfer occurred inthese regions for every Reynolds number. Subsequently, the fully-developed flow makes similar heattransfer patterns when passing through each of Tubes 3–6. The experimental results were used toanalyze the thermal and stress characteristics numerically. The results showed that the highest stressoccurred at the reattachment point of Tube 2 due to the large temperature gradient. Tube 2 is the mostvulnerable of the superheater tube bundles of the USC boilers. To release the high stress on Tube 2,moving the position of Tube 2 can avoid the flow reattachment which causes the high heat transfer.
Acknowledgments: This work was supported by the Human Resources Development program (No.20144030200560)of the Korea Institute of Energy Technology Evaluation and Planning (KETEP) grant funded by the Korea governmentMinistry of Trade, Industry and Energy.
Author Contributions: Seok Min Choi and Jun Su Park designed and conducted experiments. Hyung Hee Chocontributed to analysis and guided writing the manuscript. All authors analyzed the data. All authors discussedthe results and commented on the manuscript.
Conflicts of Interest: The authors declare no conflicts of interest.
Nomenclature
CFB circulating fluidized bedDnaph mass diffusion coefficient of naphthalene vapor in air (m2/s)hm mass transfer coefficient (m/s)LVDT linear variable differential transformer.
m local naphthalene mass transfer rate per unit area (kg/(m2·s))Nu Nusselt numberNuD Total area averaged Nusselt numberPr Prandtl numberRe Reynolds numberReD Reynolds number based on diameter of the tube bundleS distance between tube bundlesSc Schmidt numberSh Sherwood numberSOFA separated overfire airSx/D gradient of the tube bundles in the streamwise directionSz/D gradient of the tube bundles in the spanwise direction∆t run time (s)USC ultra-supercriticalx coordinate in the x-directiony coordinate in the y-directionz coordinate in the z-direction∆z sublimation depth of naphthalene surface (m)
Greek Symbols
ρs density of solid naphthalene at the surface (kg/m3)ρv,w vapor density of naphthalene at the surface (kg/m3)ρv,∞ vapor density of naphthalene in the main stream (kg/m3)θ coordinate in tangential direction∅ tube bundle diameter (mm)

Energies 2016, 9, 779 13 of 14
References
1. International Energy Agency (IEA). Key world energy statistics. 2015. Available online: https://www.iea.org/publications/freepublications/publication/KeyWorld2016.pdf (accessed on 27 July 2016).
2. Ultra Super Critical Pressure Coal Fired Boiler—State of the Art Technology Applications.Available online: https://www.yumpu.com/en/document/view/40407524/ultra-supercritical-pressure-coal-fired-boiler/1 (accessed on 23 September 2016).
3. Dekhtiarev, V.L. On designing a large, highly economical carbon dioxide power installation. Elektr. Stantsii1962, 5, 1–6.
4. Feher, E.G. The supercritical thermodynamic power cycle. Energy Convers. 1968, 8, 85–90. [CrossRef]5. Kang, K.T.; Song, J.H.; Yoon, M.J.; Lee, B.H.; Kim, S.M.; Chang, Y.J.; Jeon, C.H. A numerical study on the
effects of SOFA on NOx emission reduction in 500MW class sub-bituminous coal-fired boiler. Trans. KoreanSoc. Mech. Eng. B 2009, 33, 858–868. [CrossRef]
6. Pan, J.; Yang, D.; Chen, G.; Zhou, X.; Bi, Q. Thermal-hydraulic analysis of a 600 MW supercritical CFB boilerwith low mass flux. Appl. Therm. Eng. 2012, 32, 41–48. [CrossRef]
7. Fan, Z.; Goidich, S.; Robertson, A.; Wu, S. Ultra-supercritical pressure CFB boiler conceptual design study.Foster Wheel. Dev. 2006. [CrossRef]
8. Hou, G.; Yang, Y.; Jiang, Z.; Li, Q.; Zhang, J. A new approach of modeling an ultra-super-critical power plantfor performance improvement. Energies 2016, 9, 310. [CrossRef]
9. Wang, L.; Yang, Y.; Morosuk, T.; Tsatsaronis, G. Advanced thermodynamic analysis and evaluation ofa supercritical power plant. Energies 2012, 5, 1850–1863. [CrossRef]
10. Xu, G.; Xu, C.; Yang, Y.; Fang, Y.; Li, Y.; Song, X. A novel flue gas waste heat recovery system for coal-firedultra-supercritical power plants. Appl. Therm. Eng. 2014, 67, 240–249. [CrossRef]
11. Yang, Y.; Wang, L.; Dong, C.; Xu, G.; Morosuk, T.; Tsatsaronis, G. Comprehensive exergy-based evaluationand parametric study of a coal-fired ultra-supercritical power plant. Appl. Energy 2013, 112, 1087–1099.[CrossRef]
12. Liu, X.J.; Kong, X.B.; Hou, G.L.; Wang, J.H. Modeling of a 1000MW power plant ultra super-critical boilersystem using fuzzy-neural network methods. Energy Convers. Manag. 2013, 65, 518–527. [CrossRef]
13. Viswanathan, R.; Coleman, K.; Rao, U. Materials for ultra-supercritical coal-fired power plant boilersInternational. J. Press. Vessel. Pip. 2006, 83, 778–783. [CrossRef]
14. Viswanathan, R.; Henry, J.F.; Tanzosh, J.; Stanko, G.; Shingledecker, J.; Vitalis, B.; Purgert, R. US programon materials technology for ultra-supercritical coal power plants. J. Mater. Eng. Perform. 2005, 14, 281–292.[CrossRef]
15. Castello, P.; Guttmann, V.; Farr, N.; Smith, G. Laboratory-simulated fuel-ash corrosion of superheater tubesin coal-fired ultra-supercritical-boilers. Mater. Corros. 2000, 51, 786–790. [CrossRef]
16. Lee, N.H.; Kim, S.; Choe, B.H.; Yoon, K.B.; Kwon, D.I. Failure analysis of a boiler tube in USC coal powerplant. Eng. Fail. Anal. 2009, 16, 2031–2035. [CrossRef]
17. Krauss, T.; Meyer, L. Experimental investigation of turbulent transport of momentum and energy in a heatedrod bundle. Nucl. Eng. Des. 1998, 180, 185–206. [CrossRef]
18. Chen, H.; Wang, Y.; Zhao, Q.; Ma, H.; Li, Y.; Chen, Z. Experimental investigation of heat transfer and pressuredrop characteristics of H-type finned tube banks. Energies 2014, 7, 7094–7104. [CrossRef]
19. Yeo, W.H.; Fry, A.T.; Purbolaksono, J.; Ramesh, S.; Inayat-Hussain, J.I.; Liew, H.L.; Hamdi, M. Oxide scalegrowth and presumed exfoliation in a 700 ◦C or higher steam condition: A simulation study for futureoperations of ultra-supercritical power plants. J. Supercrit. Fluid. 2014, 92, 215–222. [CrossRef]
20. Yuan, Y.; Zhong, Z.H.; Yu, Z.S.; Yin, H.F.; Dang, Y.Y.; Zhao, X.B.; Gu, Y. Tensile and creep deformationof a newly developed Ni-Fe-based superalloy for 700 ◦C advanced ultra-supercritical boiler applications.Met. Mater. Int. 2015, 21, 659–665. [CrossRef]
21. Metzger, D.E.; Berry, R.A.; Bronson, J.P. Developing heat transfer in rectangular ducts with staggered arraysof short tube fins. J. Heat Transf. 1982, 104, 700–706. [CrossRef]
22. Armstrong, J.; Winstanley, D. A review of staggered array tube fin heat transfer for turbine coolingapplications. J. Turbomach. 1988, 110, 94–103. [CrossRef]
23. Sparrow, E.M.; Suopys, A.P.; Ansari, M.A. Effect of inlet, exit, and fin geometry on tube fins situated in aturning flow. Int. J. Heat Mass Transf. 1984, 27, 1039–1054. [CrossRef]

Energies 2016, 9, 779 14 of 14
24. Goldstein, R.J.; Chyu, M.K.; Hain, R.C. Measurement of local mass transfer on a surface in the region of thebase of a protruding cylinder with a computer-controlled data acquisition system. Int. J. Heat Mass Transf.1985, 28, 977–985. [CrossRef]
25. Chyu, M.K.; Hsing, Y.C.; Shih, T.P.; Natarajan, V. Heat transfer contributions of tubes and endwall in tube-finarrays: effects of thermal boundary condition modeling. J. Turbomach. 1999, 121, 257–263. [CrossRef]
26. Ji, J.; Ge, P.; Bi, W. Numerical analysis on shell-side flow-induced vibration and heat transfer characteristicsof elastic tube bundle in heat exchanger. Applied. Therm. Eng. 2016, 107, 544–551. [CrossRef]
27. Eter, A.; Groeneveld, D.; Tavoularis, S. An experimental investigation of supercritical heat transfer ina three-rod bundle equipped with wire-wrap and grid spacers and cooled by carbon dioxide. Nucl. Eng. Des.2016, 303, 173–191. [CrossRef]
28. Zhang, L.Z.; Ouyang, Y.W.; Zhang, Z.G.; Wang, S.F. Oblique fluid flow and convective heat transfer acrossa tube bank under uniform wall heat flux boundary conditions. Int. J. Heat Mass Transf. 2015, 91, 1259–1272.[CrossRef]
29. Shen, S.; Liu, H.; Gong, L.; Yang, Y.; Liu, R. Thermal analysis of heat transfer performance in a horizontaltube bundle. Desalination Water Treat 2015, 54, 1809–1818. [CrossRef]
30. Pis’mennyi, E.N.; Terekh, A.M.; Polupan, G.P.; Carvajal-Mariscal, I.; Sanchez-Silva, F. Universal relationsfor calculation of the drag of transversely finned tube bundles. Int. J. Heat Mass Transf. 2014, 73, 293–302.[CrossRef]
31. Ambrose, D.; Lawrenson, I.J.; Sparke, C.H.S. The vapor pressure of naphthalene. J. Chem. Thermodyn. 1975, 7,1173–1176. [CrossRef]
32. Goldstein, R.J.; Cho, H.H. A review of mass transfer measurements using naphthalene sublimation.Exp. Therm. Fluid Sci. 1995, 10, 416–434. [CrossRef]
33. Eckert, E.R.G.; Drake, R.M., Jr. Analysis of Heat and Mass Transfer; Hemisphere Publishing: New York, NY,USA, 1987; pp. 306–383.
34. Abernethy, R.B. ASME measurement uncertainty. J. Fluid. Eng. 1987, 107, 161–164. [CrossRef]35. Žkauskas, A. Heat transfer from tubes in crossflow. Adv. Heat Transf. 1987, 18, 87–159.36. Giedt, W.H. Investigation of variation of point unit heat-transfer coefficient around a cylinder normal to
an air stream. Trans. ASME 1949, 71, 375–381.
© 2016 by the authors; licensee MDPI, Basel, Switzerland. This article is an open accessarticle distributed under the terms and conditions of the Creative Commons Attribution(CC-BY) license (http://creativecommons.org/licenses/by/4.0/).