thermal analysis in foundry technology - springer analysis in foundry technology part 2....
TRANSCRIPT

Thermal analysis in foundry technology
Part 2. TG–DTG–DSC, TG–MS and TG–IR study of the new class of polymer bindersBioCo
Beata Grabowska1• Krzysztof Hodor2
• Karolina Kaczmarska1• Artur Bobrowski1 •
_Zaneta Kurleto-Kozioł1• Carolin Fischer3
Received: 1 December 2016 / Accepted: 23 May 2017 / Published online: 6 June 2017
� The Author(s) 2017. This article is an open access publication
Abstract In this study, a polymer composition of poly
(acrylic acid) and dextrin (PAA/D) cross-linked with
microwave radiation, belonging to the new BioCo group of
environmentally friendly foundry binders, was subjected to
thermal analysis (TG–DTG–DSC, TG–MS, TG–IR) in a
temperature range of 20–600 �C. A thermal analysis of
PAA/D compositions enables the determination of a tem-
perature range at which the composition is not susceptible
to thermal degradation and thus does not lose its binding
properties. The study showed that the process of thermal
degradation of PAA/D is complex and multi-stage (TG–
DTG–DSC). Within a temperature range of 20–250 �C,
physical and chemical changes take place associated with
the evaporation of the water fraction of the solvent
(20–100 �C), next with the evaporation of the water
hydration and finally with intermolecular dehydration
reactions (100–250 �C). Above a temperature of 300 �C,
the decomposition of the polymer chains takes places, and
thereafter, the intensive degradation of PAA/D occurs
together the creation of gaseous substances, primarily low
molecular weight inorganic (CO2, H2O, CO) and organic
compounds, including methane (TG–IR, TG–MS).
Keywords Polymer binders � Foundry sands � Thermal
degradation � TG–DSC � TG–IR � TG–MS
Introduction
The polymer materials, solvents and organic hardeners
used in foundry sands are the main source of hazardous
compounds emitted by these sands. Emissions of such
compounds may begin to take place as early as the mass
preparation stage, when volatile organic substances, mainly
solvents, are released. The majority of these gaseous sub-
stances, however, arise when the sand comes into contact
with the molten metal, as high temperatures lead to thermal
degradation of their organic components [1–3].
The level of gas emissions from foundry sands becomes
relevant in the context of maintaining workplace safety at
the foundry, as well as having an influence on the final
quality of the cast. Techniques which make use of organic
components containing phenyls, amines and sulphurs are
potentially harmful. The impact of the amines released
during the hardening of the sand, and of aromatic hydro-
carbons generated during the degradation of the organic
mass is not neutral for environment [4–6]. Moreover, the
technological and economic aspects must be taken into
consideration, as the gasses released during degradation
(including SO2) may enter into undesirable reactions at the
mould–foundry sand interface, leading to significant cast-
ing flaws, including deterioration of the state of the cast’s
surface [7, 8]. Foundry sands containing polymer BioCo
binders are characterised by satisfactory mechanical dura-
bility after hardening [9]. The use of these new BioCo
binders in the form of polymer compositions in the foundry
sands ensures that a mould for casting iron can be achieved
which meets the requirements both in terms of quality and
& Beata Grabowska
1 Faculty of Foundry Engineering, AGH - University of
Science and Technology, Reymonta 23, 30 059 Krakow,
Poland
2 Netzsch Instrumenty Sp. zo.o., ul. Halicka 9, 31-036 Krakow,
Poland
3 NETZSCH-Geratebau GmbH BU Analyzing and Testing,
Selb, Germany
123
J Therm Anal Calorim (2017) 130:301–309
DOI 10.1007/s10973-017-6506-y

of durability for the selected type of iron, while also cre-
ating a cast which does not present difficulties during
removal from the mould. The casts are free of flaws, and
the results of durability tests conducted on samples of casts
confirm that ductile cast iron is obtained. BioCo binders in
the form of aqueous compositions of poly(acrylic acid)
polymers and modified polysaccharide (dextrin, car-
boxymethyl starch) are environmentally friendly binding
materials (for sand grains SiO2). These materials include
polymer compositions of poly(acrylic acid) and dextrin
(PAA/D). BioCo binders do not contain harmful substances
and are soluble in water. It has been proven that in the field
of microwave radiation under via adsorption goes the
transient formation of networks as result of hydrogen
bonds. Hydrogen bonds are mainly responsible for
upholding cross-linked structures in the system binder–
sand grains. Under the influence of microwave radiation at
increased temperatures, the cross-linking reaction occurs
by the PAA dehydration and anhydride bonds are formed
(Fig. 1) [10, 11].
The benzene, toluene, ethylbenzene and xylenes
(BTEX) emission levels which take place when the molten
cast iron is poured into the mould of foundry sands con-
taining BioCo binder remain low, as indicated by experi-
mental analysis conducted in semi-technical conditions [9].
However, in order to fully understand the process of
occurrence of gaseous substances when the molten metal
comes into contact with the mould, it is essential to
understand the degradation process of the binder itself. It
can be assumed that the thermal degradation process of the
binder takes place in anaerobic conditions, although in
moulds of a non-homogeneous structure a certain amount
of trapped air may be found. Additionally, the interior of
the mould into which the molten metal is poured is filled
with air. Therefore, the thermal degradation of the binder
takes place with the limited participation of oxygen, and
the mechanism for the degradation reaction may be con-
sidered to be mixed [4, 12, 13]. Moreover, at a distance of
5–30 mm from the cast–mould interface, a temperature of
between 300 and 600 �C is maintained for approximately
1 h. This temperature range may be conducive to many
reactions, mainly to degradation, including cyclisation and
dehydrogenation [12]. Moreover, the dynamic process of
the emission of gaseous products of degradation and their
increased pressure on the mould may also cause localised
increases in pressure which are conducive to degradation
reactions. In such conditions, low molecular weight com-
pounds arising from partial degradation and also alkyl
radicals undergo further changes. These reactions may thus
lead to the occurrence of hydrocarbons, including aromatic
hydrocarbons [14].
There are several methods of measurement related to
qualitative and quantitative analysis of gasses emitted
during the process of pouring molten metal into the mould
[15]. Some of these methods permit the amount and
kinetics of the gasses emitted to be determined and allow
for the analysis of aromatic hydrocarbons, including ben-
zene, toluene, ethylbenzene and xylenes (BTEX), released
when the molten metal is poured into the mould [2]. During
this pouring process, gaseous substances are released from
the mould and conducted through the discharge system,
next through the drying system and finally onto an adsorber
(activated carbon) where the adsorption of the organic
compounds contained in the gasses flowing through the
SiO2
SiO2
OO
O
O
OO
OOO
O
O
O
O
O
O
O
O
O
O OO
O
H
H
H
H
H
H
H
H
H
H
H
H
C
C
C
H
H
H
O
OO
OC
C
Na
C CH
H
H
H
O
O
Fig. 1 Cross-linking hydrogen
bonds in the binder–sand grains
system [10]
302 B. Grabowska et al.
123
system takes place [16]. This adsorption takes place suc-
cessively in two separate layers, a measuring layer and a
control layer. The control layer serves to capture those
gasses which were not adsorbed by the first measuring
layer. The gasses which are adsorbed by the activated
carbon of the measuring and control layers, after any car-
bon disulphide (CS2) has been extracted, are subjected to
analysis by gas chromatography (GC) using a flame ioni-
sation detector (FID).
In this study, an analysis of the thermal degradation
process of polymer binders in the form of a composition of
PAA/D was conducted, based on the literature regarding
the degradation of polyacrylic acid polymers and
polysaccharides, as well as on the results of the authors’
own research (TG–DSC, TG–MS, TG–IR) [3, 17–21]. To
determine the values of degradation temperatures and the
thermal effects which took place during heating of com-
position samples, TG and DSC thermal analysis (TA)
methods were used. The results of TG–DSC analysis for
polymer compositions containing poly(acrylic acid) and
polysaccharides have already been presented in the first
part of this publication [13]. In this work, an attempt was
made to identify the thermal degradation process of the
PAA/D polymer composition based on extended TG–
DTG–DSC thermal analysis, taking into consideration
volatile products of degradation using two coupled tech-
niques; TG–MS—thermogravimetry directly coupled to
mass spectrometry and TG–IR—thermogravimetry online
coupled to Fourier transform infrared spectroscopy (FTIR).
The data obtained are also crucial in regard to the opti-
misation of conditions for cross-linking with microwave
radiation and for conventional heating methods for the
PAA/D composition, as well as in the context of the pro-
cesses taking place in the cast–mould complex associated
with the emission of gaseous products and their impact on
the quality of the cast.
Experimental
Material
Thermal analysis involved polymer composition of PAA/D
cross-linked with microwave radiation. Their characteri-
sation and cross-linking condition PAA/D are provided in
Table 1.
Thermal examinations
The NETZSCH model STA 449 F3 Jupiter� simultane-
ous thermal analyser can be used to measure the mass
change and transformation energetics of a wide range of
materials. The top-loading STA can be equipped with
various easily exchangeable TG, TG–DTA or true TG–
DSC sensors and with different furnaces to accommodate
different temperature ranges. The system employed for
this work was equipped with a silicon carbide furnace
capable of operation from room temperature to 1550 �C.
The system is vacuum tight, allowing measurements to be
conducted under pure inert, reducing or oxidising atmo-
spheres. Heating rates of up to 50 K min-1 can be
employed and the digital resolution of the balance is
1 lg digit-1. Data acquisition and evaluation, as well as
instrument control, are carried out using an MS-Windows
software package. The software allows the computation of
the rate of mass change, mass change steps, onset and
peak temperatures, inflection points and peak area
integration.
The Thermo-Microbalance NETZSCH TG 209 F1 Iris�
with an effective resolution of 0.1 lg enables highly pre-
cise measurements under pure gas atmospheres from
ambient temperatures up to 600 �C. Internal mass flow
controllers (MFC) guarantee a highly precise gas flow
adjustment of three different gases.
Data exchange between NETZSCH PROTEUS software
and Bruker OPUS software is done online during the
measurement. This guarantees simultaneous start and stop
of the measurement as well as data exchange during the
measurements.
The IR system is a commercial system of the company
Bruker (Tensor 27) with a special external gas cell for
TG coupling (TG–IR, also available from Bruker). The
TG–IR extension is equipped with a separated MCT
detector and a gas cell with an optical path length of
123 mm and an internal volume of 8.7 mL. The transfer
time between TG and IR is dependent of the selected gas
flow of the TG and covers typically a range of about
15–20 s. However, this time offset is automatically cor-
rected during the evaluation of the TG–FTIR data.
Table 1 Characteristics of compositions and their cross-linking
parameters
Polymer Composition Hardening conditions
PAA/D 62% aqueous solution of
poly(acrylic acid) (PAA,
100,000 g mol-1, BASF) and
dextrin (D, modified potato
starch, Fluka), in a mass ratio
7:8, pH 1.5
Microwave device:
RM 2001 Pc,
Plazmatronica
Microwave power of
800 W
Frequency of
2.45 GHz
Microwave action
time: 60 s
Temperature inside the
device: 100 �C
Thermal analysis in foundry technology 303
123
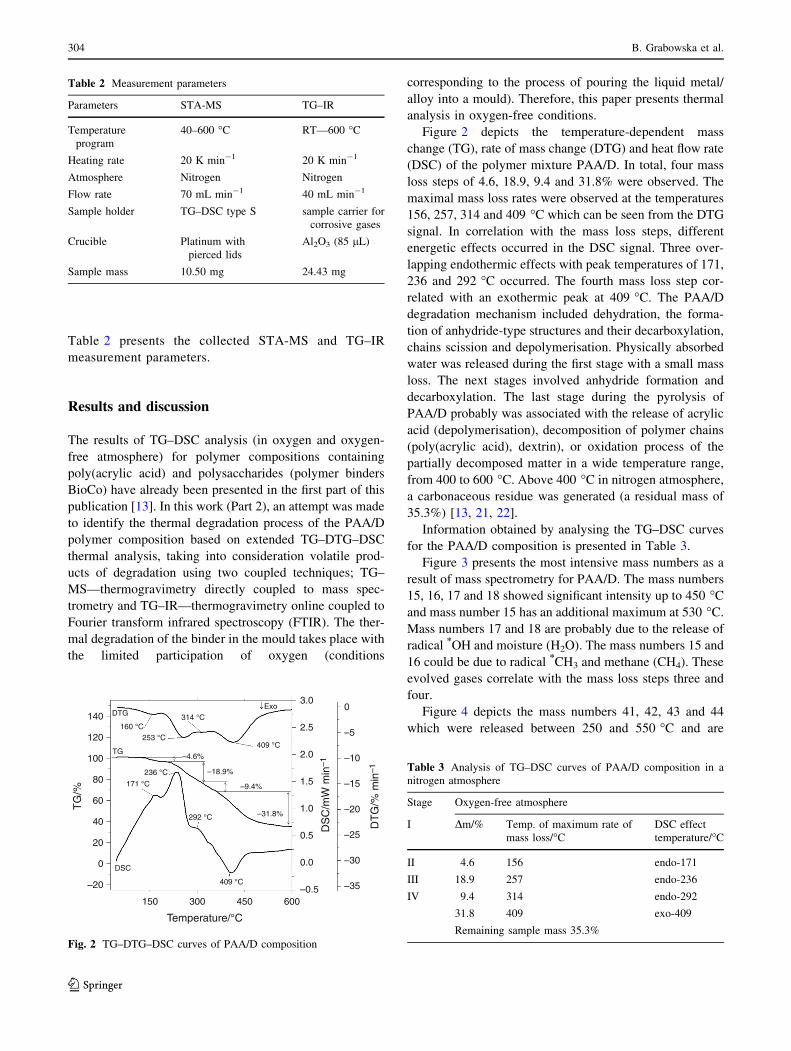
Table 2 presents the collected STA-MS and TG–IR
measurement parameters.
Results and discussion
The results of TG–DSC analysis (in oxygen and oxygen-
free atmosphere) for polymer compositions containing
poly(acrylic acid) and polysaccharides (polymer binders
BioCo) have already been presented in the first part of this
publication [13]. In this work (Part 2), an attempt was made
to identify the thermal degradation process of the PAA/D
polymer composition based on extended TG–DTG–DSC
thermal analysis, taking into consideration volatile prod-
ucts of degradation using two coupled techniques; TG–
MS—thermogravimetry directly coupled to mass spec-
trometry and TG–IR—thermogravimetry online coupled to
Fourier transform infrared spectroscopy (FTIR). The ther-
mal degradation of the binder in the mould takes place with
the limited participation of oxygen (conditions
corresponding to the process of pouring the liquid metal/
alloy into a mould). Therefore, this paper presents thermal
analysis in oxygen-free conditions.
Figure 2 depicts the temperature-dependent mass
change (TG), rate of mass change (DTG) and heat flow rate
(DSC) of the polymer mixture PAA/D. In total, four mass
loss steps of 4.6, 18.9, 9.4 and 31.8% were observed. The
maximal mass loss rates were observed at the temperatures
156, 257, 314 and 409 �C which can be seen from the DTG
signal. In correlation with the mass loss steps, different
energetic effects occurred in the DSC signal. Three over-
lapping endothermic effects with peak temperatures of 171,
236 and 292 �C occurred. The fourth mass loss step cor-
related with an exothermic peak at 409 �C. The PAA/D
degradation mechanism included dehydration, the forma-
tion of anhydride-type structures and their decarboxylation,
chains scission and depolymerisation. Physically absorbed
water was released during the first stage with a small mass
loss. The next stages involved anhydride formation and
decarboxylation. The last stage during the pyrolysis of
PAA/D probably was associated with the release of acrylic
acid (depolymerisation), decomposition of polymer chains
(poly(acrylic acid), dextrin), or oxidation process of the
partially decomposed matter in a wide temperature range,
from 400 to 600 �C. Above 400 �C in nitrogen atmosphere,
a carbonaceous residue was generated (a residual mass of
35.3%) [13, 21, 22].
Information obtained by analysing the TG–DSC curves
for the PAA/D composition is presented in Table 3.
Figure 3 presents the most intensive mass numbers as a
result of mass spectrometry for PAA/D. The mass numbers
15, 16, 17 and 18 showed significant intensity up to 450 �Cand mass number 15 has an additional maximum at 530 �C.
Mass numbers 17 and 18 are probably due to the release of
radical *OH and moisture (H2O). The mass numbers 15 and
16 could be due to radical *CH3 and methane (CH4). These
evolved gases correlate with the mass loss steps three and
four.
Figure 4 depicts the mass numbers 41, 42, 43 and 44
which were released between 250 and 550 �C and are
Table 2 Measurement parameters
Parameters STA-MS TG–IR
Temperature
program
40–600 �C RT—600 �C
Heating rate 20 K min-1 20 K min-1
Atmosphere Nitrogen Nitrogen
Flow rate 70 mL min-1 40 mL min-1
Sample holder TG–DSC type S sample carrier for
corrosive gases
Crucible Platinum with
pierced lids
Al2O3 (85 lL)
Sample mass 10.50 mg 24.43 mg
150 300 450 600
Temperature/°C
140
120
100
80
60
40
20
0
–20
TG
/%
3.0
2.5
2.0
1.5
1.0
0.5
0.0
–0.5 –35
–30
–25
–20
–15
–10
–5
0
DS
C/m
W m
in–1
DT
G/%
min
–1
DTG
DSC
160 °C253 °C
314 °C
409 °C
236 °C
292 °C
409 °C
171 °C
TG
Exo
–4.6%
–18.9%
–31.8%
–9.4%
Fig. 2 TG–DTG–DSC curves of PAA/D composition
Table 3 Analysis of TG–DSC curves of PAA/D composition in a
nitrogen atmosphere
Stage Oxygen-free atmosphere
I Dm/% Temp. of maximum rate of
mass loss/�CDSC effect
temperature/�C
II 4.6 156 endo-171
III 18.9 257 endo-236
IV 9.4 314 endo-292
31.8 409 exo-409
Remaining sample mass 35.3%
304 B. Grabowska et al.
123

associated with the mass loss steps three and four. Mass
number 44 may be identified as carbon dioxide (CO2) and
42—propene (C3H6). The comparison to the NIST Atomic
Spectra Database revealed that at 384 �C propene may be
released [23].
The release of the mass numbers 38 and 40 mainly
occurred between 350 and 550 �C and is related to the
fourth mass loss step, which can be seen from Fig. 5.
The release of the mass numbers 78, 92 and 106 mainly
occurred between 350 and 550 �C and is related to the
fourth mass loss step, which can be seen from Fig. 6.
In addition, the most probable decomposition products
with characteristic m/z values [22] are given in Table 4.
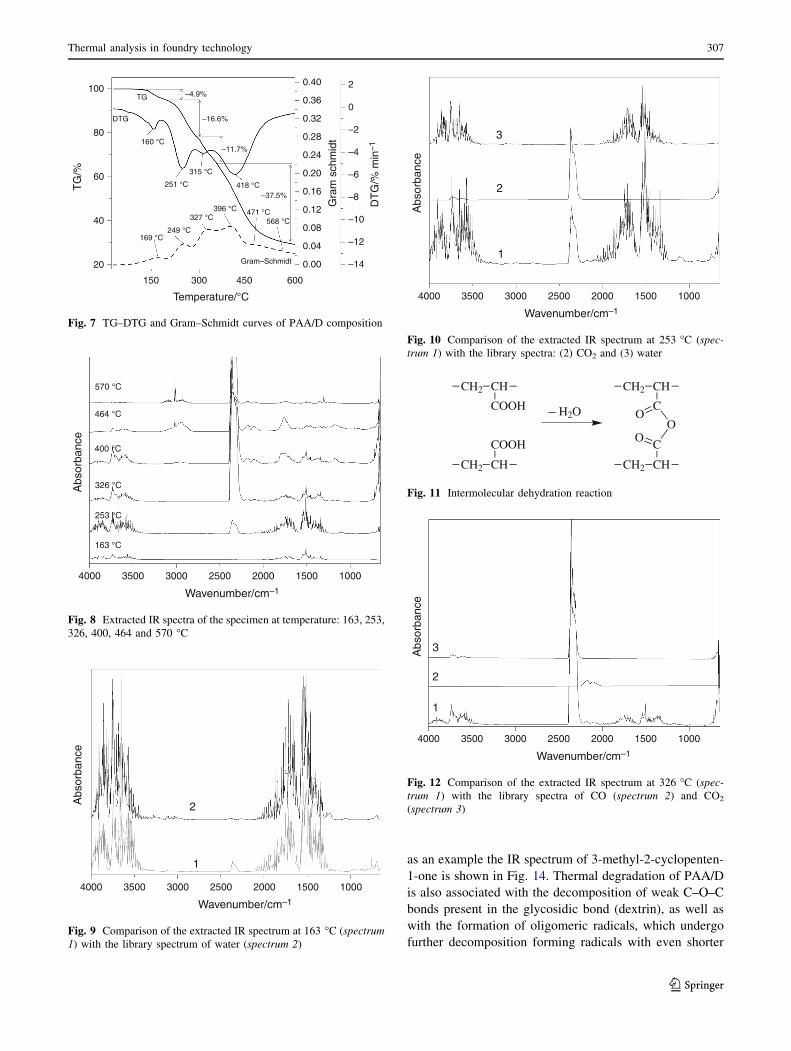
Figure 7 shows the TG results of the measurement of the
sample in a temperature range from room temperature to
600 �C in a nitrogen atmosphere with a heating rate of
20 K min-1.
TG depicts the relative mass change of the sample PAA/
D, the mass loss rate signal as the first derivative of TG–
DTG and the Gram–Schmidt trace as the overall IR
intensities. Corresponding to the DTG curve, the intensities
of the Gram–Schmidt trace increase as soon as a mass loss
is detected. It is more or less a mirror image of the DTG
curve, and this shows that the gases interact with the
infrared beam as soon as they are released and transferred
to the gas cell. The Gram–Schmidt signal in contrast is
collected based on the individual spectra. Therefore, it is
possible that the Gram–Schmidt curve contains a data point
which has no corresponding spectrum with the same
100
80
60
40
20
0
–20
–40
–60
–80
–100
TG
/%
150 300 450 600
Temperature/°C
10–10
10–11
10–12
Ion
curr
ent/A
TGm/z = 15m/z = 16m/z = 17m/z = 18
253 °C
160 °C
384 °C
–4.6%
–9.4%
–31.8%
–18.9%
Fig. 3 Temperature-dependent mass change (TG–MS) results of
mass spectrometry, ion current for mass numbers: 15 (line m/z = 15),
16 (line m/z = 16), 17 (line m/z = 17) and 18 (line m/z = 18) of
PAA/D composition
100
80
60
40
20
0
–20
–40
–60
–80
–100
TG
/%
150 300 450 600
Temperature/°C
10–10
10–11
10–12
10–13
Ion
curr
ent/A
TGm/z = 41m/z = 42m/z = 43m/z = 44
–4.6%
–9.4%
–31.8%
–18.9%
291 °C384 °C
Fig. 4 Temperature-dependent mass change (TG–MS) results of
mass spectrometry, ion current for mass numbers: 41 (line m/z = 41),
42 (line m/z = 42), 43 (line m/z = 43) and 44 (line m/z = 44) of
PAA/D composition
100
80
60
40
20
0
–20
–40
–60
–80
–100
TG
/%
100 200 300 400 500 600
Temperature/°C
10–13
10–12
Ion
curr
ent/A
TGm/z = 38m/z = 40
473 °C
–4.6%
–9.4%
–31.8%
–18.9%
Fig. 5 Temperature-dependent mass change (TG–MS) results of
mass spectrometry, ion current for mass numbers: 38 (line m/z = 38)
and 40 (line m/z = 40) of PAA/D composition
452 °C488 °C
–4.6%
–9.4%
–31.8%
–18.9%
TGm/z = 78m/z = 92m/z = 106
100
80
60
40
20
0
–20
–40
–60
–80
–100
TG
/%
150 300 450 600
Temperature/°C
10–12
2×10–12
3×10–12
Ion
curr
ent/A
Fig. 6 Temperature-dependent mass change (TG–MS) results of
mass spectrometry, ion current for mass numbers: 78 (line m/z = 78),
92 (line m/z = 92) and 106 (line m/z = 106) of PAA/D composition
Thermal analysis in foundry technology 305
123
temperature. Therefore, typically the nearest temperature
available spectrum is taken for evaluation of the FTIR data.
Four mass loss steps can be detected comparable to the
STA results, with DTG minima at 160, 251, 315 and 418 �C.
Additional peaks in the Gram–Schmidt curve are visible
which are evaluated with the help of two-dimensional
spectra. A residual mass of about 25% can be detected.
Accounting for the trajectories of TG–DTG and Gram–
Schmidt curves (Fig. 7), gas product IR spectra were
extracted for a given mass loss (Fig. 8).
In conjunction with an increase in temperature, physical
and chemical changes may occur associated with the multi-
stage decomposition of the PAA/D composition. The first
loss of mass is related to the evaporation of the water
fraction of the solvent, and the next loss is related to the
evaporation of the hydration water (100–230 �C) [24, 25].
The IR spectrum obtained at a temperature of 163 �C is
related to the release of water, which was confirmed by
comparing this spectrum with the model IR spectrum for
water (library spectrum) (Fig. 9).
During the second loss of mass at 253 �C, water is
released, along with CO2. The IR spectrum extracted at a
temperature of 253 �C (spectrum 1, Fig. 10) is presented
together with the model spectra for water and CO2 (spectra
2 and 3, Fig. 10). The presence of CO2 which was observed
is associated with the decomposition of side groups on the
polymer chains.
The water arises as a result of an intermolecular dehy-
dration reaction (Fig. 11). This dehydration process is
related to the formation intermolecular anhydride cross-
links between carboxyl groups of neighbouring polymer
chains (chemical cross-linking) [17, 21, 26].
The third and fourth losses of mass are primarily related
to the emission of CO2, CO and low molecular weight
organic compounds (Figs. 12, 14, 15). The IR spectrum
extracted at a temperature of 326 �C (spectrum 1, Fig. 12)
is presented together with model spectra for CO2 (spectra 2
and 3, Fig. 12).
Above a temperature of 300 �C, fragmentation of the
polyacrylic chains occurred. Additionally, side groups
experience breaking of bonds in the poly(acrylic acid)
chain in the carboxyl group (Fig. 13).
Within a temperature range of 400 and 464 �C, the
release of methane and organic components occurs. Here,
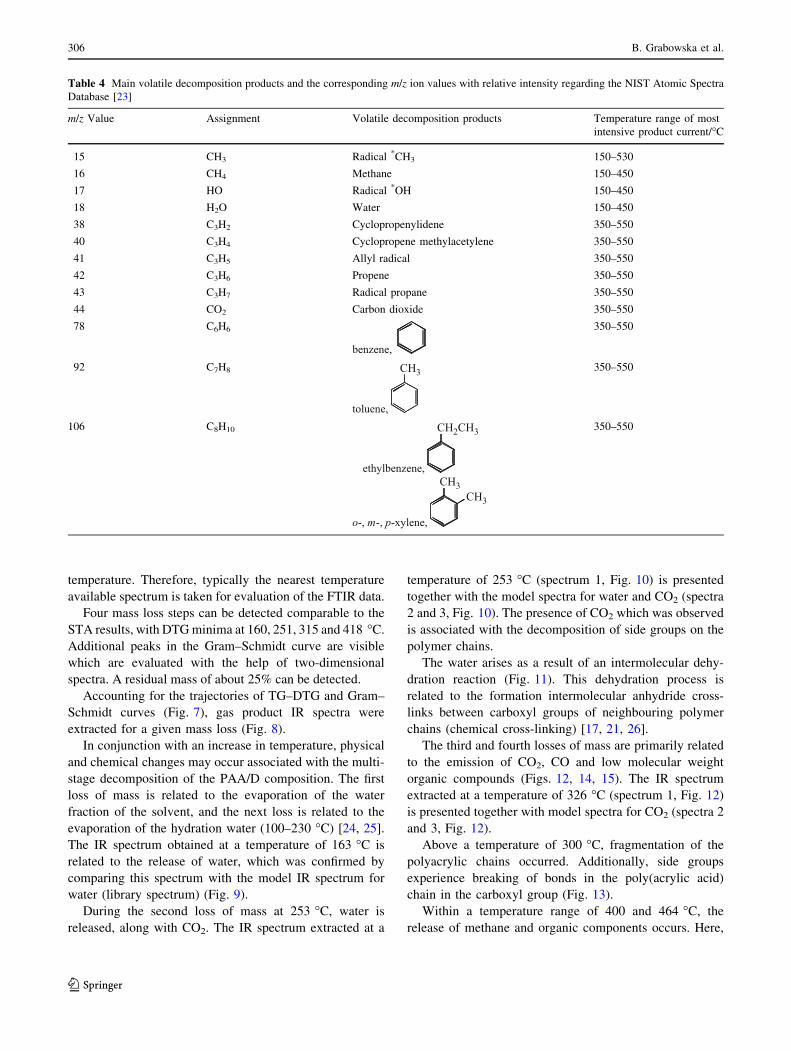
Table 4 Main volatile decomposition products and the corresponding m/z ion values with relative intensity regarding the NIST Atomic Spectra
Database [23]
m/z Value Assignment Volatile decomposition products Temperature range of most
intensive product current/�C
15 CH3 Radical *CH3 150–530
16 CH4 Methane 150–450
17 HO Radical *OH 150–450
18 H2O Water 150–450
38 C3H2 Cyclopropenylidene 350–550
40 C3H4 Cyclopropene methylacetylene 350–550
41 C3H5 Allyl radical 350–550
42 C3H6 Propene 350–550
43 C3H7 Radical propane 350–550
44 CO2 Carbon dioxide 350–550
78 C6H6
benzene,
350–550
92 C7H8
toluene,
CH3 350–550
106 C8H10
ethylbenzene,
o- -, m , p-xylene,
CH3CH3
CH2CH3 350–550
306 B. Grabowska et al.
123
as an example the IR spectrum of 3-methyl-2-cyclopenten-
1-one is shown in Fig. 14. Thermal degradation of PAA/D
is also associated with the decomposition of weak C–O–C
bonds present in the glycosidic bond (dextrin), as well as
with the formation of oligomeric radicals, which undergo
further decomposition forming radicals with even shorter
100
80
60
40
20
TG
/%
150 300 450 600
Temperature/°C
–14
–12
–10
–8
–6
–4
–2
0
2
DT
G/%
min
–1
0.40
0.36
0.32
0.28
0.24
0.20
0.16
0.12
0.08
0.04
0.00
Gra
m s
chm
idt
Gram–Schmidt
TG
DTG
160 °C
251 °C
315 °C
169 °C249 °C
327 °C396 °C
418 °C
471 °C568 °C
–37.5%
–11.7%
–16.6%
–4.9%
Fig. 7 TG–DTG and Gram–Schmidt curves of PAA/D composition
4000 3500 3000 2500 2000 1500 1000
Wavenumber/cm–1
Abs
orba
nce
570 °C
464 °C
400 °C
326 °C
253 °C
163 °C
Fig. 8 Extracted IR spectra of the specimen at temperature: 163, 253,
326, 400, 464 and 570 �C
4000 3500 3000 2500 2000 1500 1000
Wavenumber/cm–1
Abs
orba
nce
1
2
Fig. 9 Comparison of the extracted IR spectrum at 163 �C (spectrum
1) with the library spectrum of water (spectrum 2)
Abs
orba
nce
4000 3500 3000 2500 2000 1500 1000
Wavenumber/cm–1
1
2
3
Fig. 10 Comparison of the extracted IR spectrum at 253 �C (spec-
trum 1) with the library spectra: (2) CO2 and (3) water
CH2 CH
COOH
CH2 CH
COOH
H2O
CH2 CH
C
CH2 CH
C
OO
O
Fig. 11 Intermolecular dehydration reaction
4000 3500 3000 2500 2000 1500 1000
Wavenumber/cm–1
Abs
orba
nce
1
2
3
Fig. 12 Comparison of the extracted IR spectrum at 326 �C (spec-
trum 1) with the library spectra of CO (spectrum 2) and CO2
(spectrum 3)
Thermal analysis in foundry technology 307
123
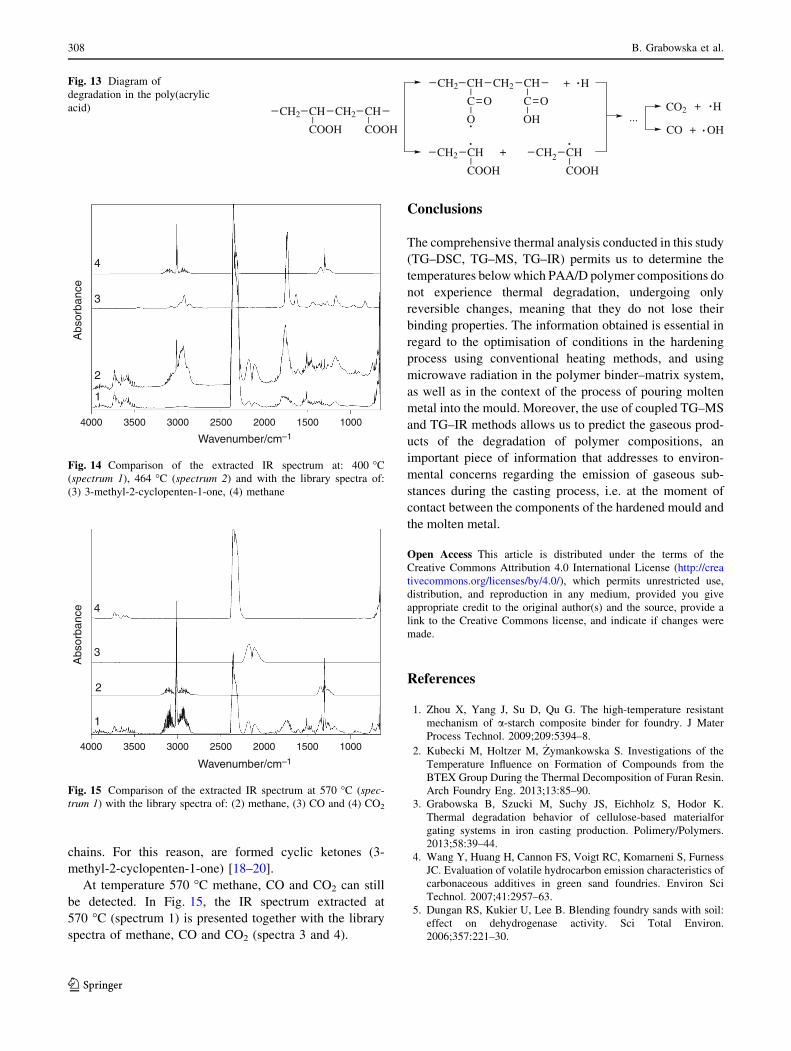
chains. For this reason, are formed cyclic ketones (3-
methyl-2-cyclopenten-1-one) [18–20].
At temperature 570 �C methane, CO and CO2 can still
be detected. In Fig. 15, the IR spectrum extracted at
570 �C (spectrum 1) is presented together with the library
spectra of methane, CO and CO2 (spectra 3 and 4).
Conclusions
The comprehensive thermal analysis conducted in this study
(TG–DSC, TG–MS, TG–IR) permits us to determine the
temperatures below which PAA/D polymer compositions do
not experience thermal degradation, undergoing only
reversible changes, meaning that they do not lose their
binding properties. The information obtained is essential in
regard to the optimisation of conditions in the hardening
process using conventional heating methods, and using
microwave radiation in the polymer binder–matrix system,
as well as in the context of the process of pouring molten
metal into the mould. Moreover, the use of coupled TG–MS
and TG–IR methods allows us to predict the gaseous prod-
ucts of the degradation of polymer compositions, an
important piece of information that addresses to environ-
mental concerns regarding the emission of gaseous sub-
stances during the casting process, i.e. at the moment of
contact between the components of the hardened mould and
the molten metal.
Open Access This article is distributed under the terms of the
Creative Commons Attribution 4.0 International License (http://crea
tivecommons.org/licenses/by/4.0/), which permits unrestricted use,
distribution, and reproduction in any medium, provided you give
appropriate credit to the original author(s) and the source, provide a
link to the Creative Commons license, and indicate if changes were
made.
References
1. Zhou X, Yang J, Su D, Qu G. The high-temperature resistant
mechanism of a-starch composite binder for foundry. J Mater
Process Technol. 2009;209:5394–8.
2. Kubecki M, Holtzer M, _Zymankowska S. Investigations of the
Temperature Influence on Formation of Compounds from the
BTEX Group During the Thermal Decomposition of Furan Resin.
Arch Foundry Eng. 2013;13:85–90.
3. Grabowska B, Szucki M, Suchy JS, Eichholz S, Hodor K.
Thermal degradation behavior of cellulose-based materialfor
gating systems in iron casting production. Polimery/Polymers.
2013;58:39–44.
4. Wang Y, Huang H, Cannon FS, Voigt RC, Komarneni S, Furness
JC. Evaluation of volatile hydrocarbon emission characteristics of
carbonaceous additives in green sand foundries. Environ Sci
Technol. 2007;41:2957–63.
5. Dungan RS, Kukier U, Lee B. Blending foundry sands with soil:
effect on dehydrogenase activity. Sci Total Environ.
2006;357:221–30.
...CH2 CH
COOH
CH2 CH
COOH
C C
O
O
OH
O
H+
COOH COOH
+
CO2 H+
CO OH+
CH2 CH CH2 CH
CH2 CH CH2 CH
Fig. 13 Diagram of
degradation in the poly(acrylic
acid)
4000 3500 3000 2500 2000 1500 1000
Wavenumber/cm–1
Abs
orba
nce
1
2
3
4
Fig. 14 Comparison of the extracted IR spectrum at: 400 �C(spectrum 1), 464 �C (spectrum 2) and with the library spectra of:
(3) 3-methyl-2-cyclopenten-1-one, (4) methane
4000 3500 3000 2500 2000 1500 1000
Wavenumber/cm–1
Abs
orba
nce
1
2
3
4
Fig. 15 Comparison of the extracted IR spectrum at 570 �C (spec-
trum 1) with the library spectra of: (2) methane, (3) CO and (4) CO2
308 B. Grabowska et al.
123
6. Ahamad T, Alshehri SM. Thermal degradation and evolved gas
analysis of thioureaformaldehyde resin (TFR) during pyrolysis
and combustion. J Therm Anal Calorim. 2012;109:1039–47.
7. Naro RL. Battling the elusive lustrous carbon defect. Mod Cast.
2003;5:32–5.
8. Chakherlou TN, Mahdinia YV, Akbari A. Influence of lustrous
carbon defects on the fatigue life of ductile iron castings using
lost foam process. Mater Des. 2011;32:162–9.
9. Grabowska B, Holtzer M, Danko R, Gorny M, Bobrowski A,
Olejnik E. New BioCo binders containing biopolymers for
foundry industry. Metalurgija. 2013;52:47–50.
10. Grabowska B, Sitarz M, Olejnik E, Kaczmarska K, Tyliszczak B.
FT-IR and FT-Raman studies of cross-linking processes with
Ca2? ions, glutaraldehyde and microwave radiation for polymer
composition of poly(acrylic acid)/sodium salt of carboxymethyl
starch—In moulding sands, Part II. Spectrochim Acta Part A Mol
Biomol Spectrosc. 2015;151:27–33.
11. Grabowska B, Sitarz M, Olejnik E, Kaczmarska K. FT-IR and
FT-Raman studies of cross-linking processes with Ca2 ? ions,
glutaraldehyde and microwave radiation for polymer composition
of poly(acrylic acid)/sodium salt of carboxymethyl starch—Part
I. Spectrochim Acta Part A Mol Biomol Spectrosc.
2015;135:529–35.
12. Fox JT, Cannon FS, Brown NR, Huang H, Furness JC. Com-
parison of a new, green foundry binder with conventional foundry
binders. Int J Adhes Adhes. 2012;34:38–45.
13. Grabowska B, Malinowski P, Szucki M, Byczynski Ł. Thermal
analysis in foundry technology. J Therm Anal Calorim.
2016;126:245–50.
14. Pielichowski J, Pielichowski K. Application of thermal analysis
for the investigation of polymer degradation processes. J Therm
Anal. 1995;43:505–8.
15. Jelınek P, Buchtele J, Fiala J. Forms of pyrolytic carbon ensuing
on thermal degradation of coal and carbonaceous additives. Acta
Metall Slovaca. 1999;5:112–8.
16. Zhang H, Zhao H, Zheng K, Li X, Liu G, Wang Y. Diminishing
hazardous air pollutant emissions from pyrolysis of furan no-bake
binders using methanesulfonic acid as the binder catalyst.
J Therm Anal Calorim. 2014;116:373–81.
17. Lattimer RP. Pyrolysis mass spectrometry of acrylic acid poly-
mers. J Anal Appl Pyrolysis. 2003;68–69:3–14.
18. Lluch AV, Felipe AM, Greus AR, Cadenato A, Ramis X, Salla
JM, et al. Thermal analysis characterization of the degradation of
biodegradable starch blends in soil. J Appl Polym Sci.
2005;96:358–71.
19. Lawal OS, Lechner MD, Kulicke WM. The synthesis conditions,
characterizations and thermal degradation studies of an etherified
starch from an unconventional source. Polym Degrad Stab.
2008;93:1520–8.
20. Tudorachi N, Lipsa R, Mustata FR. Thermal Degradation of
Carboxymethyl Starch -g-Poly (lactic acid) Copolymer by TG–
FTIR–MS Analysis. Ind Eng Chem Res. 2012;51:15537–45.
21. McNeill IC, Sadeghi SMT. Thermal stability and degradation
mechanisms of poly(acrylic acid) and its salts: part 1—Poly(-
acrylic acid). Polym Degrad Stab. 1990;29:233–46.
22. Dubinsky S, Grader GS, Shter GE, Silverstein MS. Thermal
degradation of poly(acrylic acid) containing copper nitrate.
Polym Degrad Stab. 2004;86:171–8.
23. NIST chemistry webbook standard reference database number 69.
2011. http://webbook.nist.gov/chemistry.
24. Bednarek P, Szafran M. Thermal decomposition of monosac-
charides derivatives applied in ceramic gelcasting process
investigated by the coupled DTA/TG/MS analysis. J Therm Anal
Calorim. 2012;109:773–82.
25. Simkovic I, Jakab E. Thermogravimetry/mass spectrometry study
of weakly basic starch-based ion exchanger. Carbohydr Polym.
2001;45:53–9.
26. Greenberg AR, Kamel I. Kinetics of anhydride formation in
poly(acrylic acid) and its effect on the properties of a PAA-alumina
composite. J Polym Sci Polym Chem Ed. 1977;15:2137–49.
Thermal analysis in foundry technology 309
123