theriseofasiaandcanada’s relationswithasia · motorvehicles,trailers,bicycles," motorcycles...
TRANSCRIPT

THE RISE OF ASIA AND CANADA’S RELATIONS WITH ASIA
1

The Rise of Asia
2

-‐2
0
2
4
6
8
10
Average GDP growth rate
Annual GDP Growth rates : Selected Countries, 2008-2012
Source: World Bank data base at h;p://data.worldbank.org/indicator/NY.GDP.MKTP.KD.ZG
3

Canada and Asia • Current trade relaMons with Asia is not dominant • As Canada, and Alberta, looks to reduce its dependence on the US market and to increase its linkages to the fastest growing markets in the world, Asia has become a prime focus of Canadian businesses and policy makers.
• Asia’s populaMon size and rising incomes have impacted on Canada’s primary sector directly and holds the promise of future market growth.
• Canada is an exporter of resources and primary products to Asia and a transit point for Asian imports into the North American market
• Canada’s Northern Gateway Policy is intended to facilitate integraMon with Asia and makes the West coast a logisMcs hub for the Asian Trade.
4

Source: Asia-‐Pacific FoundaMon, Canada’s Asia Challenge: Crea0ng Competence for the Next genera0on of Canadians, A Report of the Asian Competence Task Force, 2013, Box 1, p.11.
Asia’s Rising Influence in Canada
5

Source: Source: Asia-‐Pacific FoundaMon, Canada’s Asia Challenge: Crea0ng Competence for the Next genera0on of Canadians, A Report of the Asian Competence Task Force, 2013, Box 15, p.41
Canada’s Energy Outlook
6

Asia Pacific Economic CooperaJon (APEC) and
the Trans Pacific Partnership (TPP)
7

APEC APEC is a forum of 21 pacific rim countries established to promote growth and prosperity in the Asia Pacific region through economic cooperaMon. Its annual leaders summit is an important venue for heads of state to discuss mutual concerns and collaboraMon. Free trade associaMons are found among its members such as ASEAN, NAFTA and other bilateral agreements.
8

Source: www.apec.org
APEC Membership
9

The Trans-‐Pacific Partnership (TPP) Trade Talks
• Aside from bilateral free trade talks, TPP talks have become a key focus of Canada’s Asia trade policy.
• The TPP agreement was iniMated in 2005 by Brunei, Singapore, Chile, and New Zealand to create a trans-‐Pacific Free trade area. It has since expanded to include Australia, Canada, Japan, Malaysia, Peru, the United States, and Vietnam also.
• It is part of the trend to replace mulMlateral trade agreements with bilateral and regional agreements
• This is significant as it includes countries in the fastest growing economic region, save China.
10

Source: Ian Fergusson et.al., The Trans-‐Pacific Partnership NegoMaMons and Issues for Congress, CRS Report for Congress, August 21, 2013, Figure 2, p.6
Free Trade Area and Bilateral trade agreements among partnership countries
11

Source: Christy Chen Trans-‐Pacific Partnership: Canada’s Next Trade Agreement?, Focus, BMO Economic Research, May 17, 2013, Table 1, p.9 12

Source: Dawson, Laura and Stefania Bartucci, Canada and the Trans-‐Pacific Partnership: Entering a New Era of Strategic Trade Policy, Fraser InsMtute, September 2013, Fig. 6, p.6.
Canada’s Exports to Top Five Trading Partners, 2012 (billions $CAD)
13

Source: Dawson, Laura and Stefania Bartucci, Canada and the Trans-‐Pacific Partnership: Entering a New Era of Strategic Trade Policy , Fraser InsMtute, September 2013, Figure 7, p.7.
Canada’s Exports to Top TPP Countries, 2012 (billions of $CAD)
14

Source: Dawson, Laura and Stefania Bartucci, Canada and the Trans-‐Pacific Partnership: Entering a New Era of Strategic Trade Policy, Fraser InsMtute, September 2013, Fig. 1, p.2.
Per Capita GDP of TPP Countries, 2012 ($US)
15

Source: Dawson, Laura and Stefania Bartucci, Canada and the Trans-‐Pacific Partnership: Entering a New Era of Strategic Trade Policy, Fraser InsMtute, September 2013, Fig. 2, p.3
PopulaJon of TPP Countries, 2012 (millions)
16

Source: Dawson, Laura and Stefania Bartucci, Canada and the Trans-‐Pacific Partnership: Entering a New Era of Strategic Trade Policy, Fraser InsMtute, September 2013, Fig. 3, p.3
17

Source: Christy Chen Trans-‐Pacific Partnership: Canada’s Next Trade Agreement?, Focus, BMO Economic Research, May 17, 2013, Chart 2, p.8.
18

Source: Andrew Sleigh, et.al., “Asian Growth Journeys,” Accenture, 2013 p.3
Growth in Asian InternaJonal Investment, 2003 to 2011
19
Asia will be an important source of capital

Canada’s Trade RelaJons with Asia
20

Source: The Asia Factor, Asia Pacific FoundaMon of Canada, 2015
Canada’s Trade with Asia 2014
21

Source: The Asia Factor, Asia Pacific FoundaMon of Canada, 2015
22

Source: The Asia Factor, Asia Pacific FoundaMon of Canada, 2015
23

Source: The Asia Factor, Asia Pacific FoundaMon of Canada, 2015
24

Source: The Asia Factor, Asia Pacific FoundaMon of Canada, 2015
25

Source: The Asia Factor, Asia Pacific FoundaMon of Canada, 2015
26

Source: Asia-‐Pacific FoundaMon, Canada’s Asia Challenge: Crea0ng Competence for the Next genera0on of Canadians, A Report of the Asian Competence Task Force, 2013, Table 6, Table 2, p.33.
China’s Preferred InternaJonal Tourism DesJnaJon
27

Source: The Asia Factor, Asia Pacific FoundaMon of Canada, 2015
28

Source: Asia-‐Pacific FoundaMon, Canada’s Asia Challenge: Crea0ng Competence for the Next genera0on of Canadians, A Report of the Asian Competence Task Force, 2013, Graph 1, p.12
How Canadians see the Importance Of Selected countries
29
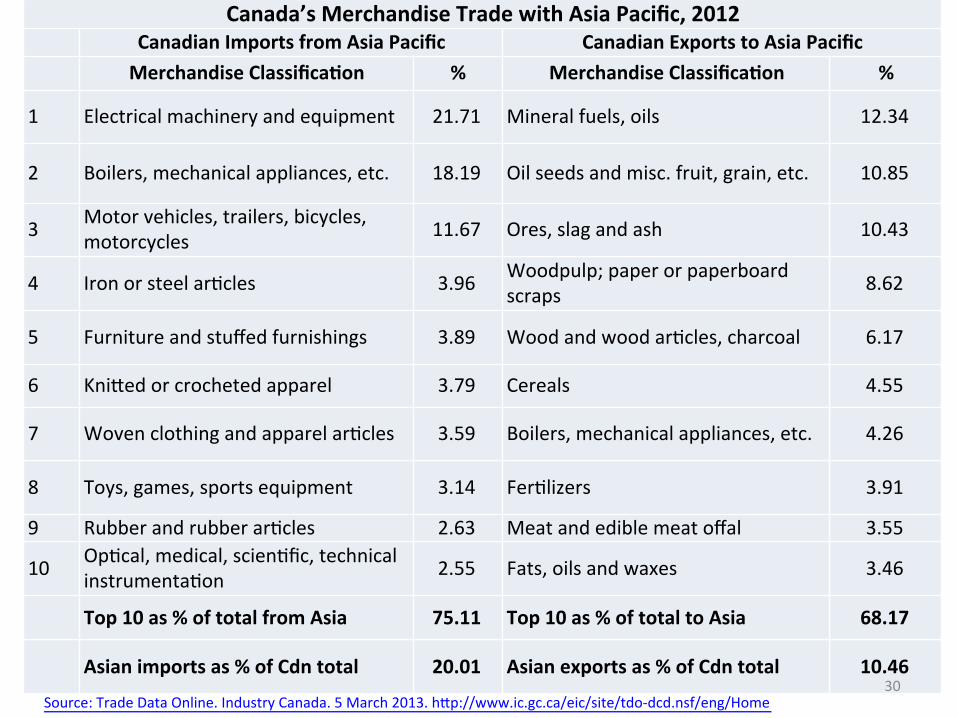
Canada’s Merchandise Trade with Asia Pacific, 2012 Canadian Imports from Asia Pacific Canadian Exports to Asia Pacific Merchandise ClassificaJon % Merchandise ClassificaJon %
1 Electrical machinery and equipment 21.71 Mineral fuels, oils 12.34
2 Boilers, mechanical appliances, etc. 18.19 Oil seeds and misc. fruit, grain, etc. 10.85
3 Motor vehicles, trailers, bicycles, motorcycles 11.67 Ores, slag and ash 10.43
4 Iron or steel arMcles 3.96 Woodpulp; paper or paperboard scraps 8.62
5 Furniture and stuffed furnishings 3.89 Wood and wood arMcles, charcoal 6.17
6 Kni;ed or crocheted apparel 3.79 Cereals 4.55
7 Woven clothing and apparel arMcles 3.59 Boilers, mechanical appliances, etc. 4.26
8 Toys, games, sports equipment 3.14 FerMlizers 3.91
9 Rubber and rubber arMcles 2.63 Meat and edible meat offal 3.55
10 OpMcal, medical, scienMfic, technical instrumentaMon 2.55 Fats, oils and waxes 3.46
Top 10 as % of total from Asia 75.11 Top 10 as % of total to Asia 68.17
Asian imports as % of Cdn total 20.01 Asian exports as % of Cdn total 10.46 Source: Trade Data Online. Industry Canada. 5 March 2013. h;p://www.ic.gc.ca/eic/site/tdo-‐dcd.nsf/eng/Home
30

Canada’s Market Share in Top 10 Asian Markets, 2012 (millions $Cdn)
Total Imports Imports from Canada
Proportions of Total Imports
(%) Rank
Australia 260,736 2,476 0.95 5 China 1,889,680 23,669 1.25 1
Hong Kong, SAR 524,939 1,801 0.34 7
India 510,030 2,924 0.57 4
Indonesia 199,359 1,883 0.94 6
Japan 921,454 13,206 1.43 2 Singapore 395,158 1,293 0.33 9 South Korea 540,367 5,457 1.01 3 Taiwan 281,292 1,689 0.60 8 Thailand 261,523 982 0.38 10
Asia Total 6,316,616 58,864 0.93 Source: Trade Data Online. Industry Canada., June 3, 2013.
31

2011
Canadian Imports
2012 Canadian Imports
2012 Proportions of
Total (%) Rank
Australia 1,767 2,080 0.45 8 China 48,184 50,713 10.98 1 India 2,534 2,856 0.62 5 Japan 13,058 15,022 3.25 2
Malaysia 2,139 2,226 0.48 7 Singapore 1,555 1,425 0.31 10
South Korea 6,616 6,374 1.38 3 Taiwan 4,931 4,583 0.99 4
Thailand 2,675 2,633 0.57 6 Vietnam 1,332 1,618 0.35 9
Total 89,489 94,242 20.4
Source: Trade Data Online. Industry Canada., June 3, 2013.
Market Share of Top 10 Asian Exporters to Canada, 2011-2012
32

Adapted from www.asiapacific.ca/staMsMcs/trade/market share
33

Canada-‐China Trade 34

Canada and China
• h;p://globalnews.ca/video/913818/canada-‐governor-‐general-‐engages-‐china-‐to-‐open-‐up-‐trade
• h;p://live.wsj.com/video/canada-‐growing-‐china-‐trade-‐connecMon/C5EC68E9-‐3404-‐4344-‐A5B7-‐D94C4888D0D3.html#!C5EC68E9-‐3404-‐4344-‐A5B7-‐D94C4888D0
• h;p://www.cigionline.org/videos/china-‐canada-‐relaMons-‐changing-‐global-‐contextD3
35

Source: World Trade Atlas
USA 62%
China 7%
United Kingdom 3%
Japan 3%
Brazil, Russia, India 2%
Others 23%
Canadian Bilateral Trade (2011)
36

Source: www.economonitor.com/analysts/files/2012/02/image003.png
Bilateral Trade Flow: Canada -‐ China
37
Source:www.parl.gc.ca/content/LOP/researchPublicaMons/2013-‐55-‐55-‐e.htm
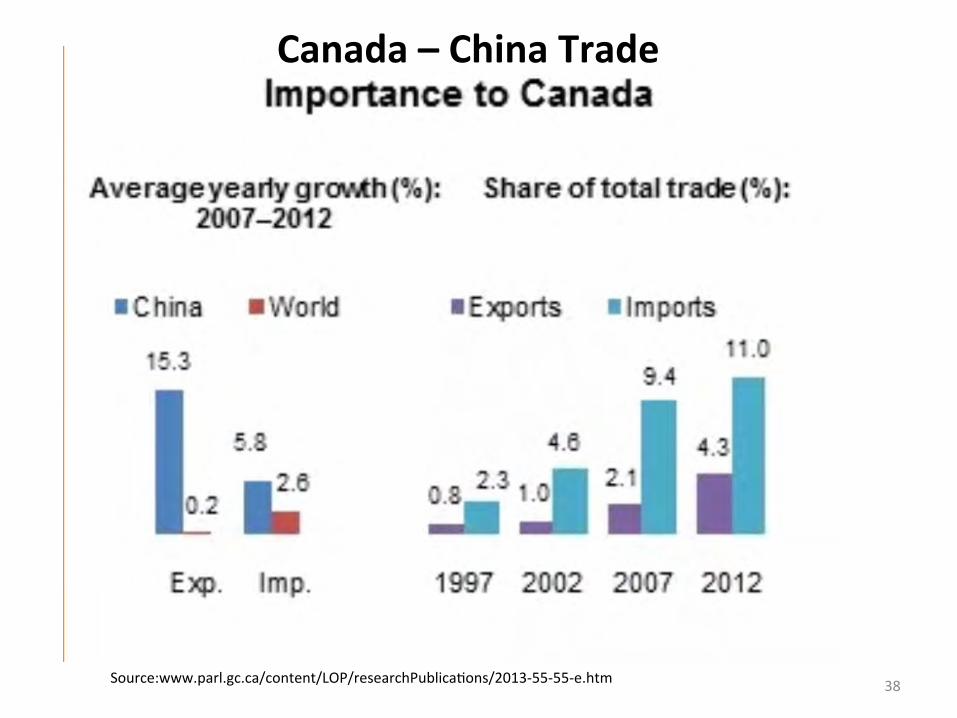
Canada – China Trade
38

Top Products in Sino Canadian Trade
China’s Top Exports to Canada • PlasMc • Kni;ed Clothing & Apparel • Woven Clothing • Toys, Games, sporMng goods • Computers & mechanical
appliances • Electrical or Electronic
equipment • Furniture, lamps & Illuminated
signs • Foot ware • Iron and Steel • OpMcal and medical equipment
Canada’s Top Exports to China
• Organic chemicals • Computers & mechanical
appliances • FerMlizers • Nickel & nickel products • Fats, Oils & Waxes • Ores, slag and ash • Electrical and electronic
equipment • Fish, Crustaceans, molluscs • Cereals • Wood pulp & wastes & scraps
39 Source: DFAIT Trade StaMsMcs

Source: World Trade Atlas
$9.5 $10.5 $11.2
$13.2
$16.8
0
2
4
6
8
10
12
14
16
18
2007 2008 2009 2010 2011
Bill
ions
of $
Canadian Exports to China (2007 – 2011)
40

Source: World Trade Atlas 41

Source: World Trade Atlas 42

Canada-‐ China Trade
Source:www.parl.gc.ca/content/LOP/researchPublicaMons/2013-‐55-‐55-‐e.htm 43

Source:www.parl.gc.ca/content/LOP/researchPublicaMons/2013-‐55-‐55-‐e.htm
Canada – China Trade
44
Source:www.parl.gc.ca/content/LOP/researchPublicaMons/2013-‐55-‐55-‐e.htm
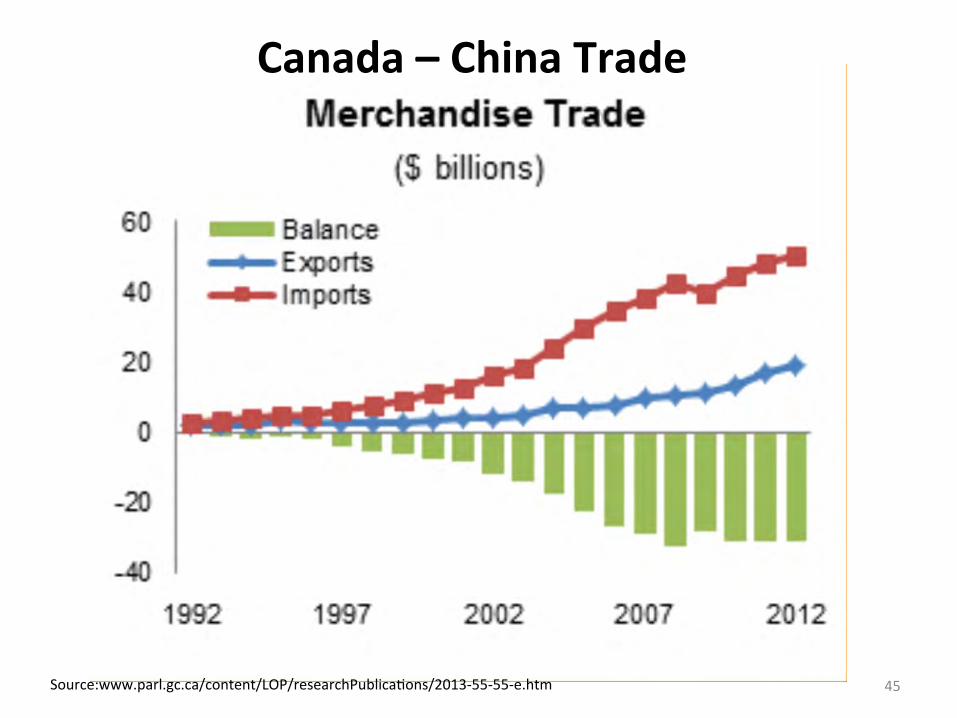
Canada – China Trade
45

Source:www.parl.gc.ca/content/LOP/researchPublicaMons/2013-‐55-‐55-‐e.htm
Canada – China Trade
46

Source:www.parl.gc.ca/content/LOP/researchPublicaMons/2013-‐55-‐55-‐e.htm
Canada – China Trade
47

Source:www.parl.gc.ca/content/LOP/researchPublicaMons/2013-‐55-‐55-‐e.htm
Canada – China Trade
48

Adapted from www.asiapacific.ca/staMsMcs/trade/bilateral trade 49

Adapted from www.asiapacific.ca/staMsMcs/trade/bilateral trade
50

Exports to China by Province (%) -‐ 2012
Source:www.parl.gc.ca/content/LOP/researchPublicaMons/2013-‐55-‐55-‐e.htm 51

Source:www.parl.gc.ca/content/LOP/researchPublicaMons/2013-‐55-‐55-‐e.htm
Bilateral FDI Flows
52

Source: Office of the Chief Economist of Canada Note: FDI China into Canada in 2006 and 2007 are esMmates
53

Source: www.conferenceboard.ca/economics/hot_eco_topics/default/12-‐11-‐12/as_Canada_s_trade_shiqs_the_world
Future Trade ProjecJons
54

Source: Asia-‐Pacific FoundaMon, Canada’s Asia Challenge: Crea0ng Competence for the Next genera0on of Canadians, A Report of the Asian Competence Task Force, 2013, Table 6, Table 2, p.33.
China’s Preferred InternaJonal Tourism DesJnaJon
55

Source: Office of the Chief Economist of Canada Note: FDI China into Canada in 2006 and 2007 are esMmates
56

China -‐ Canada Bilateral Direct Investment
57
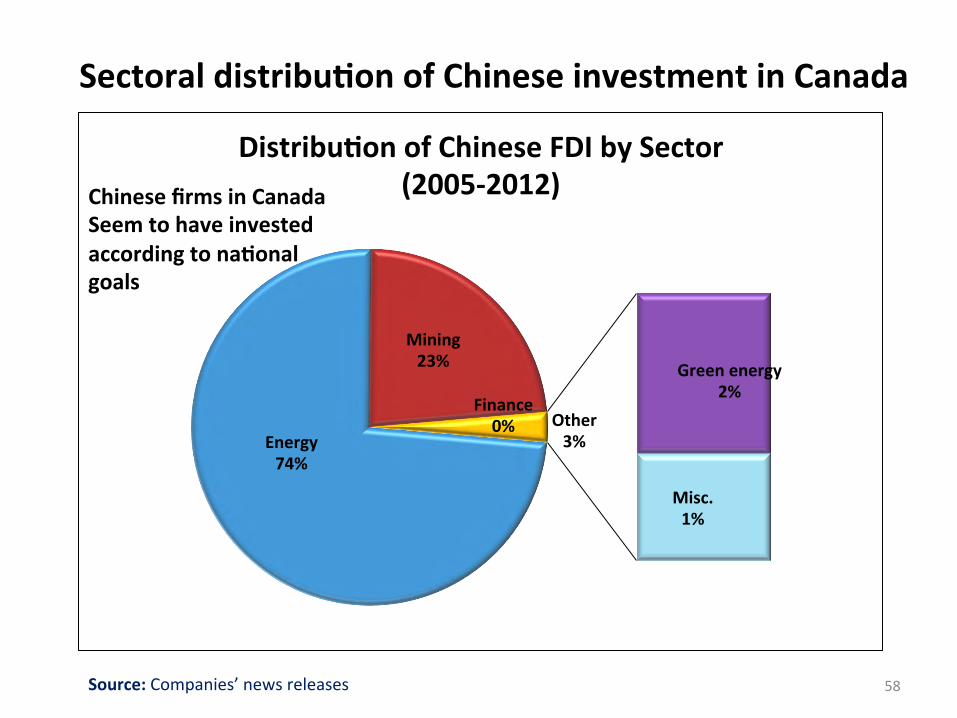
Energy 74%
Mining 23%
Finance 0%
Green energy 2%
Misc. 1%
Other 3%
DistribuJon of Chinese FDI by Sector (2005-‐2012)
Source: Companies’ news releases
Sectoral distribuJon of Chinese investment in Canada
58
Chinese firms in Canada Seem to have invested according to naJonal goals

What is Canada’s desJny in Asia? What is our role in the Asian Value Chain? Do we want to be part of this chain? Can we afford to ignore it?
Discussions
59

Canadian View of Asia 2010 Agree with Statement Canada I consider Canada to be part of the Asia Pacific region 29%
Asian economies are vital to the well-‐being of Canada 62%
The Government of Canada should aim to diversify its trade to be less dependent on the United States
76%
The growing importance of China as an economic power is more of an opportunity than a threat
48%
Looking 10 years into the future, the influence of China in the world will surpass that if the United States
60%
Source: Asia Pacific FoundaJon of Canada, “2010 NaJonal Opinion Poll: Canadian Views of Asia,” March 28, 2010. hhp://www.asiapacific.ca/sites/default/files/filefield/NaJonal_Opinion_Poll_2010.pdf
60
Canada’s PercepJon of Asia

61 Source: www.asiapacific.ca/pubicaMons#editorials

62 Source: www.asiapacific.ca/pubicaMons#editorials

63 Source: www.asiapacific.ca/pubicaMons#editorials
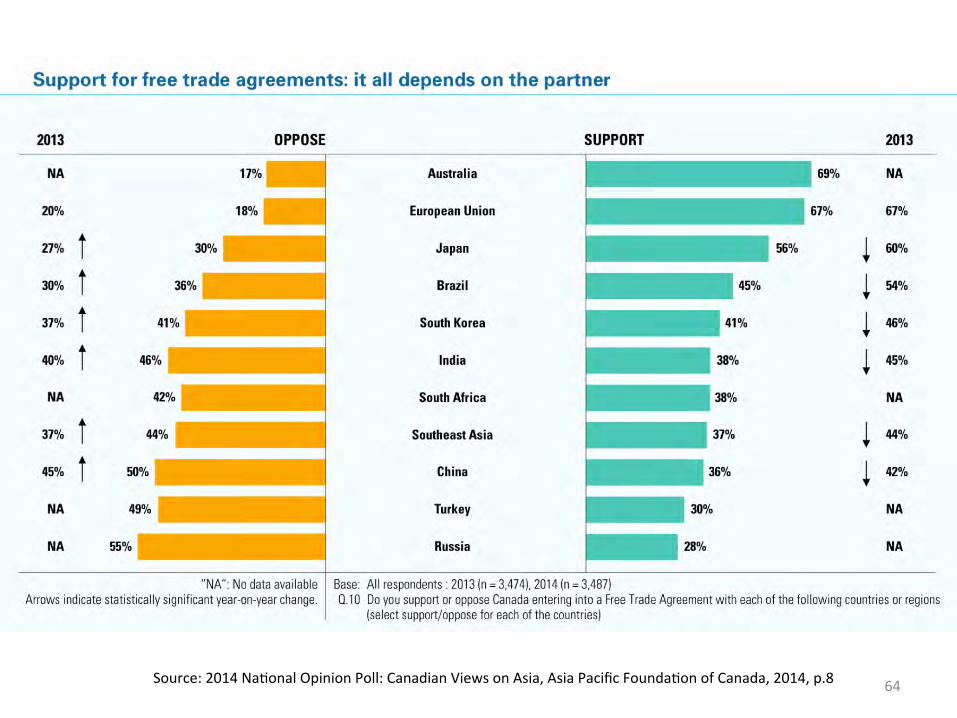
64 Source: 2014 NaMonal Opinion Poll: Canadian Views on Asia, Asia Pacific FoundaMon of Canada, 2014, p.8

65 Source: 2014 NaMonal Opinion Poll: Canadian Views on Asia, Asia Pacific FoundaMon of Canada, 2014, p.9

66
Source: 2014 NaMonal Opinion Poll: Canadian Views on Asia, Asia Pacific FoundaMon of Canada, 2014, p.42

67 Source: 2014 NaMonal Opinion Poll: Canadian Views on Asia, Asia Pacific FoundaMon of Canada, 2014, p.47

68 Source: 2014 NaMonal Opinion Poll: Canadian Views on Asia, Asia Pacific FoundaMon of Canada, 2014, p.38

69 Source: 2014 NaMonal Opinion Poll: Canadian Views on Asia, Asia Pacific FoundaMon of Canada, 2014, p.37
Hesitant to move away from the US on Energy Mahers

70 Source: 2014 NaMonal Opinion Poll: Canadian Views on Asia, Asia Pacific FoundaMon of Canada, 2014, p.40

Source: Asia-‐Pacific FoundaMon, Canada’s Asia Challenge: Crea0ng Competence for the Next genera0on of Canadians, A Report of the Asian Competence Task Force, 2013, Box 2, p.13
Views of Asian PracJJoners on Canada’s Asian Competence
71

Source: Asia-‐Pacific FoundaMon, Canada’s Asia Challenge: Crea0ng Competence for the Next genera0on of Canadians, A Report of the Asian Competence Task Force, 2013, Graph 2, p.16
Canadian Support for Placing more Emphasis on Teaching about Asian
72