there’s no free lunch conversation - · pdf filethere’s no free lunch...
TRANSCRIPT
1
There’s No Free Lunch Conversation:
The Effect of Brand Advertising on Word of Mouth
Mitchell J. Lovett
Simon Business School
University of Rochester
Renana Peres
School of Business Administration
Hebrew University of Jerusalem, Jerusalem, Israel 91905
Linli Xu
Carlson School of Management
University of Minnesota
October 2016
Acknowledgment: We thank the Keller Fay Group for the use of their data and their groundbreaking
efforts to collect, manage, and share the TalkTrack data. We gratefully acknowledge our research
assistants at the Hebrew University--Shira Aharoni, Linor Ashton, Aliza Busbib, Haneen Matar, and
Hillel Zehavi—and at the University of Rochester--Amanda Coffey, Ram Harish Gutta, and Catherine
Zeng. We thank Daria Dzyabura, Sarah Gelper, and Barak Libai for their helpful comments. We thank
participants of our Marketing Science 2015 and INFORMS Annual Meeting 2015 sessions.
This study was supported by the Marketing Science Institute, Kmart International Center for Marketing
and Retailing at the Hebrew University of Jerusalem, the Israel Science Foundation, and the Carlson
School of Management Dean’s Small Grant.
2
There’s No Free Lunch Conversation:
The Effect of Brand Advertising on Word of Mouth
Abstract
Practitioners have a widely-held belief that brand advertising strongly influences the volume of
word of mouth (WOM) the brand receives, yet academic research on the topic is scarce and
shows mixed results. We examine the relationship between monthly Internet and TV advertising
expenditures and the total (offline and online) WOM for 538 U.S national brands across 16
categories over 6.5 years. We find that the average implied advertising elasticity on WOM is
0.016 for TV, and 0.010 for Internet, both of which are small relative to the existing estimates.
Even the categories that have the strongest implied elasticities are only as large as 0.05.
Although ads are mentioned in brand conversations (e.g., an average of 10% of brand
conversations mention TV ads), these ads appear to trigger very few additional conversations.
Furthermore, individuals with many (10+) social ties generate approximately 50% more WOM
than individuals with few ties, but individuals with few ties exhibit a stronger relationship
between advertising and WOM. We discuss the implications of these findings for managing
advertising and WOM.
Keywords: word of mouth, advertising, brands, social hubs, weak ties, strong ties, dynamic
panel methods, paid media, earned media.
3
Introduction
Paid advertising is often purchased with the expectation to increase earned media exposures such
as social media posts and word of mouth (WOM, hereafter). The common wisdom in the
advertising industry is that paid advertising, in addition to directly increasing sales, also boosts
conversations about the brand, which eventually turn into brand equity and sales. Brand
conversations are reported to commonly reference advertisements with estimates ranging from
9% (Gelper, Peres and Eliashberg 2016) to 15% (Onishi and Manchanda 2012) of online buzz
about movie trailers and 20% for all WOM referencing TV ads (Keller and Fay 2009). Further,
industry reports claim that the impact of advertising on WOM is considerable (Graham and
Havlena, 2007) and that advertising-induced WOM “can generate more than twice the sales of
paid advertising in categories as diverse as skincare and mobile phones” (Bughin, Doogan, and
Vetvik 2010).
Considerable practitioner research aims to evaluate this belief: A recent study by WOMMA,
(the Word of Mouth Marketing Association) tracking longitudinal data for 6 major US brands
states that word of mouth (both offline and online) amplifies the effect of paid media by 15%
(WOMMA 2014). A recent Nielsen study titled “Stirring Up Buzz: How TV Ads are Driving
Earned Media for Brands” tested the Twitter activity of TV viewers who were exposed to TV
commercials about a personal care brand during sports games and found a significant large
increase of brand tweeting compared to the pre-exposure period (Nielsen 2016). Similarly, a
study on 26 brands advertised on Turner TV tested the Twitter and Facebook level of mentions
these brands received following TV ad campaigns and found that 1 out of 5 social engagements
4
for brands are directly driven by TV advertising. The study concludes that “Television
advertising is a key driver of social media engagement for brands” (Turner 2016).
Practitioners behave in accordance with a belief that advertising increases WOM and make
larger investments in advertising. Perhaps most prominently, the expectation to boost earned
mentions has become a key justification for spending on high priced ad spots in programs like
the Super Bowl (Siefert et al 2009; Spotts, Purvis, and Patnaik 2014). “Television is like rain and
we catch the rain in buckets and re-deploy it to the social channels to make our sales opportunity
and brand grow (George Haynes, an executive from Kia motors, on an interview to Forbes
magazine about Kia advertising on Super Bowl 2013, in Furrier 2013).”
While the industry behaves as if advertising has a strong influence on WOM, scholarly
research supporting this belief is relatively scarce. As illustrated in Figure 1, the current literature
either focuses on the influence of advertising on sales (Naik and Raman 2003; Sethuraman,
Tellis, and Briesch 2011; Danaher and Dagger 2013; Dinner, Van Heerde and Neslin 2014),
WOM on sales (Chevalier and Mayzlin 2006; Liu 2006; Duan, Gu, and Whinston 2008; Zhu and
Zhang 2010), or their joint influence (Hogan, Lemon and Libai 2004; Chen and Xie 2008; Moon
Bergey, and Iacobucci 2010; Stephen and Galak 2012; Onishi and Manchanda 2012; Gopinath,
Chintagunta, and Venkataraman 2013; Lovett and Staelin 2016). Research on how advertising
induces WOM is mostly conceptual (Gelb and Johnson 1995; Mangold, Miller and Brockway
1999), or theoretical (Smith and Swinyard 1982; Campbell, Mayzlin and Shin 2015). Existing
empirical studies that measure the effect of advertising on WOM, are sparse, and focus on case
studies for a single company (Park, Roth, and Jacques 1988) or specific product launches such as
Onishi and Manchanda (2012) and Bruce, Foutz and Kolsarici (2012) for movies, and Gopinath,
Thomas and Krishnamurthi (2015) for mobile handsets. The results from these studies are mixed,
5
with some positive effects (Onishi and Manchanda 2012; Gopinath, Thomas, and
Krishnamurthi), non-significant effects (Onishi and Manchanda 2012), and even negative effects
(Feng and Papatla 2011).
-------Insert Figure 1 about here ------
The main goal of this paper is to evaluate this widely-accepted practitioner wisdom that
advertising drives WOM. The current wisdom is based on either anecdotal evidence or a small
set of brands over relatively short time-spans. In contrast, we quantify this relationship for a
large number of brands from a diverse set of product categories over many years. We use
monthly data on the advertising expenditures and WOM mentions of 538 national US brands
across 16 broad categories over 6.5 years. Our data contain advertising expenditures on both TV
and Internet display advertising. The WOM mentions, taken from the Keller Fay TalkTrack
dataset, include both online and offline WOM (offline WOM is estimated to be 85% of WOM
conversations (Keller and Fay 2012)). Our analysis controls for seasonality, secular trends, past
WOM, and news mentions, and, to evaluate potential remaining endogeneity, we conduct an
analysis using instrumental variables.
We find that the relationship between advertising and WOM is significant, but small. The
average implied elasticity of WOM is 0.016 for TV advertising expenditures and 0.010 for
Internet display advertising expenditures. Our findings challenge the widely-held belief on the
impact of advertising on WOM. Comparing the direct and indirect effects of advertising, our
results imply that the average indirect elasticity of advertising on sales through WOM is 0.004,

6
which is only a small part of the estimated average elasticity on sales of 0.12 (Sethuraman,
Tellis, and Briesch 2011).
We find significant heterogeneity across brands and categories in the estimated relationship
between advertising and WOM. For instance, we find that the categories with the largest implied
elasticities to TV advertising are Sports and Hobbies, Media and Entertainment, and
Telecommunications. However, we find the average implied elasticity even for these categories
is relatively small (e.g., average elasticity between 0.02 and 0.05).
We further explore two moderators that could shape the size of the advertising-WOM
relationship. First, we evaluate whether WOM that references advertising is more strongly
related to advertising than total WOM. We find no evidence for a stronger relationship. Second,
we evaluate whether the relationship is stronger for social hubs, those individuals with many
social connections, than for individuals with fewer connections. We find just the opposite— the
relationship between advertising and WOM appears to be weaker for highly connected
individuals. This finding is inconsistent with the fundamental claim of a multi-step
communication model (e.g. Katz and Lazerfeld, 1955; Weimann 1982), that advertising impacts
a small elite group of opinion leaders who generate WOM and spread the message to the masses.
Instead, our results are consistent with the "masses" of less connected individuals being more
influenced by advertising to generate WOM. Even so, the implied advertising elasticities for
these less connected individuals are quite small (between 0.01 and 0.02).
Our findings portray a world in which “there is no free lunch.” Paid advertising developed
for TV and the Internet does not automatically lead to meaningful levels of WOM. If
advertisements are not designed for generating WOM (e.g., instead creative is chosen to generate
purchases or to build brand), advertisers should not expect a considerable lift in WOM without
7
further investments in content, social media campaigns, and other marketing communication
mechanisms. If a brand has the goal of increasing WOM, and uses advertising as the vehicle to
do so, then care must be taken both to design advertising for this goal (Van der Lans et al 2010)
and to monitor that the design is successful. Our results do not rule out that some campaigns for
some brands have much higher elasticities (e.g., particular Super Bowl advertisements, viral
marketing campaigns), however, the small average implied elasticity and low heterogeneity
across brands and categories suggest that these elasticities might not be obtained without a
considerable, focused investment of resources.
Existing Theory and Evidence on the Advertising-WOM Relationship
As mentioned above, the industry common wisdom is that advertising activities “…play an
important role in sparking WOM” (Campaign, July 5 2013). Marketing theory provides a
foundation for such a positive advertising-WOM relationship, but also some justification for a
negative effect. On the positive side, engaging in WOM is driven by the need to share and
receive information, have social interactions, or express emotions (Lovett, Peres, and Shachar
2013; Berger 2014). Advertising can trigger these needs and potentially stimulate a WOM
conversation about the brand. We identify four possible routes for this to happen:
Attention – Advertising can serve as a reminder, draw attention to the brand, and keep it in the
list of conversation topics. The role of advertising as a reminder for purchase is well established
in literature (Batra, Aaker and Myers 1995; Mitra and Lynch 1995), but the same reasoning
applies also for search and information sharing through WOM. By drawing attention to the brand

8
through advertising, the brand becomes more visible and more accessible in memory, and as a
result might be more likely used as a topic of conversation (Berger 2014).
Social desirability – Advertising can induce social desirability and legitimacy of the brand
(Aaker and Biel 2013), which can make the brand a more appropriate topic of conversation.
Relatedly, one of the goals of viral marketing (Van der Lans and van Bruggen 2010) is to make
people feel they are part of a buzz wave about the brand.
Information - The ad might contain information which can stimulate further information search
(Smith and Swinyard 1982). Bansal and Voyer (2000) demonstrate that people with medium
level of expertise are more actively engaged in WOM, and suggest informational advertising as a
possible way to bring consumers up the expertise ladder. Similarly, the ad itself and the
information contained in it can serve as a direct facilitator of conversation.
Emotional arousal – Ads raise emotions such as joy, sadness, guilt or pride, through creative use
of content elements such as drama, humor, sex appeal, and choice of characters (Holbrook and
Batra 1987; Olney, Holbrook and Batra 1991). High emotional arousal was shown to be one of
the triggers for people to share their emotions and engage in WOM (Lovett, Peres and Shachar
2013, Berger and Milkman 2012). While the WOM might not necessarily focus on the brand, the
brand name is mentioned and serves as a way to reference the ad.
However, advertising can also have a negative influence on WOM. Dichter (1966) argues
that advertising decreases involvement, and if involvement has a positive influence on WOM
(Sundaram, Mitra, and Webster 1998), advertising would cause a decrease in WOM. Feng and
Papatla (2011) claim that talking about an advertised brand may make an individual look less
unique and special, and may harm her self enhancement. Similarly, if advertising provides
sufficient information so that people have the information they need, they will tend to be less
9
receptive to WOM messages (Herr, Kardes and Kim 1991), which diminishes the scope for
WOM.
The overall balance between the positive and negative influences is not clear. Scholarly
empirical research on this issue is limited and the available results are mixed. Onishi and
Manchanda (2012) estimate the advertising elasticity of TV advertising exposures on blog
mentions for 12 movies in Japan, and find an elasticity of 0.12 for pre-release advertising, and a
non-significant effect for post-release advertising. Gopinath, Thomas and Krishnamurthi (2015)
studied the impact of the number of ads on online WOM for 5 models of mobile phones and
estimated elasticities of 0.19 for emotion advertising and 0.37 for "attribute" (i.e. informational)
advertising. Feng and Papatla (2011) use data on cars to show both positive and negative effects
of advertising on WOM. Using a model of goodwill for movies, Bruce, Foutz and Kolsarici
(2012) found that advertising has a positive impact on the effectiveness of WOM on demand, but
did not study the effect on WOM volume. Bollinger et al (2013) found positive interactions
between both TV and online advertising and Facebook mentions in influencing purchase for fast
moving consumer goods, but do not study how one affects the other.
Summarizing, despite the common wisdom found in the practitioner literature, both
marketing theory and scholarly empirical research offer mixed guidance about whether the
advertising-WOM relationship should be positive. Our focus is to quantify this relationship using
data that cuts across many industries and brands and spans a long time-period. We next describe
the dataset.

10
Data
Our dataset contains information on 538 U.S. national brands from 16 product categories (the list
is drawn from that of Lovett, Peres and Shachar 2013). We study the period from January 2007
to June 2013 with monthly data for these 6.5 years. For each month and brand, we have
information on advertising expenditures, word of mouth mentions, and brand mentions in the
news. We elaborate on each data source and provide some description of the data below.
Advertising expenditure data
We collect monthly advertising expenditures from the Ad$pender database of Kantar Media. For
each brand we have constructed three categories of advertising—TV advertising, Internet
advertising, and other advertising. For TV advertising, we have aggregated expenditures across
all available TV outlets (DMA-level as well as national and cable). For Internet advertising
expenditures we include display advertising (the only Internet advertising available in
Ad$pender). Display advertising is appropriate since it is more often used as a branding tool,
whereas search advertising is more closely connected with encouraging purchases directly.
Hence, display advertising is most closely aligned with the goal of obtaining WOM. We focus on
these two types of advertising for three reasons. First, for our brands, together they form the
majority of the expenses at around 70% of the total expenditures according to Ad$pender.
Second, TV advertising is the largest category of spending and has been suggested to be the most
engaging channel (Drèze and Hussher 2003). Third, Internet advertising is touted as the fastest
growing category of spending among those available in Kantar and reflects the prominence of
“new media.” That said, we also collect the total advertising expenditures on other media. These
expenditures cover the range of print media (e.g., newspapers, magazines), outdoor, and radio
advertisements.

11
Word of mouth data
Our word of mouth data is drawn from the TalkTrack dataset of the Keller-Fay Group. This is a
self-report panel, where each week a representative sample of respondents reports on all of their
word of mouth conversations (online and offline) for a 24-hour period. The inclusion of offline
data is important, since offline WOM is estimated to be 85% of WOM conversations (Keller and
Fay 2012).
The sample includes 700 individuals per week, spread approximately equally across the
days of the week. This weekly sample is constructed to be representative of the U.S. population.
The company uses a scaling factor of 2.3 million to translate from the average daily sample
mentions to the daily number of mentions in the population. Since we merge the WOM data with
the advertising and news media data, we aggregate the WOM data to the monthly level.
We also leverage additional data aspects of the Keller-Fay TalkTrack dataset to include
more detailed examinations of the advertising-WOM relationship. The first of these aspects
relates to WOM that specifically references advertising (ad-WOM). Out of all the brand
mentions of a respondent, 10 are randomly selected by the survey, on which the respondent is
asked to provide additional information about the brand mention and the conversation in which
the brand was mentioned. Specifically, they were asked to indicate whether the conversation
included a media or marketing reference to the brand. The question, “Did anyone in the
conversation refer to something about the brand from any of these sources?” used a multi-select
format allowing up to two answers. The response categories include TV advertisements and
Internet advertisements as options. We use this item to count the number of cases in which the
brand conversation referred to an ad in order to isolate these ad-WOM conversations. With these

12
data, we are able to shed light on whether the advertising-WOM relationship is larger for these
kinds of ad-WOM conversations than for total WOM.
Figure 2 presents the percentage of brand conversations that reference ads for each brand,
including WOM with references to TV (top panel) and Internet (bottom panel) ads. First, the
distribution suggests that a meaningful proportion of all brand conversations contain references
to advertising, which is consistent with the practitioner belief. Unsurprisingly, far more of the
conversations contain mentions of TV ads than Internet ads. For most brands, TV ads are
referenced between 6% and 14% of the time, whereas Internet ads are only referenced between
2% and 6% of all conversations. Both distributions are skewed right, so that there are some
brands for which advertising is referenced quite frequently during conversations. For TV this
level can get as high as 30%, whereas for Internet it can reach above 22%. These distributions
seem to be consistent with a large influence of advertising on brand WOM, but they do not speak
to whether the conversations would have happened without the advertising, which we aim to
address in our empirical analysis.
-------- Insert Figure 2 about here -------
The second additional aspect of the Keller-Fay data that we leverage relates to the social
ties. Independent of brand conversations, respondents provide information on the number and
type of social ties they communicate with “fairly often.” The three types of ties are family, close
friends, and acquaintances. Respondents indicate the number of such types of connections they
are in contact with. Figure 3 presents the distribution across respondents of the number of
connections for each of the three types of connections.
13
-------- Insert Figure 3 about here -------
As Figure 3 indicates, the distributions for family and close friends are similar, where
approximately 50%-60% of respondents indicated 4 ties or less. For acquaintances, since the
question was asked about the number of people with whom the respondent frequently
communicates, 26% of the respondents reported on zero such ties. For our analysis we will
distinguish, for each type of connection, between two groups: those with 0-9 connections, and
those with 10 connections or more. In our empirical analysis we examine whether those with
more connections talk more and are influenced more by advertising.
News and press mentions data
WOM may be triggered by news media. News media might also proxy for external events (e.g.,
the launch of a new product, a change of logo, product failure or recall) that both lead the firm to
advertise and consumers to speak about the brand, but where the WOM is caused by the event
not the advertising. To control for such unobserved events and news, we use the LexisNexis
news and press database to collect the monthly number of news and press mentions for each
brand.
Descriptive statistics
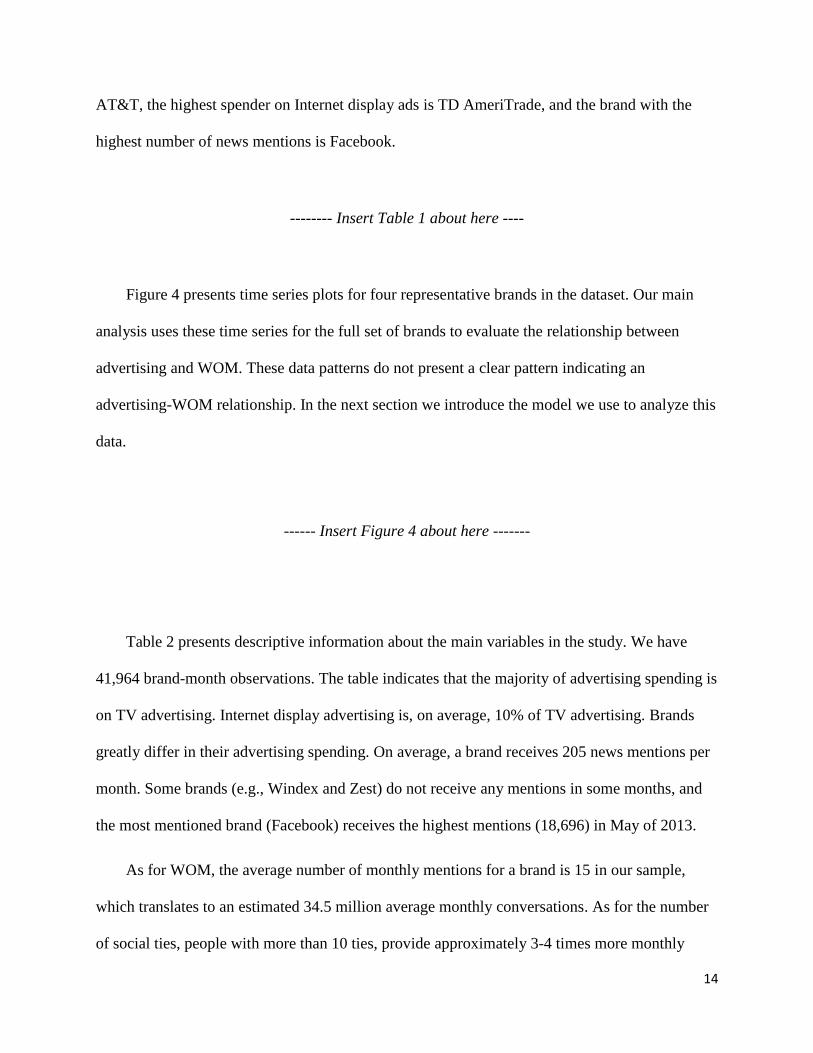
Table 1 presents category specific information about the advertising and media mentions data.
This table communicates the large variation across categories in the use of the different types of
advertising and in the number of media mentions. For example, the highest spender on TV ads is
14
AT&T, the highest spender on Internet display ads is TD AmeriTrade, and the brand with the
highest number of news mentions is Facebook.
-------- Insert Table 1 about here ----
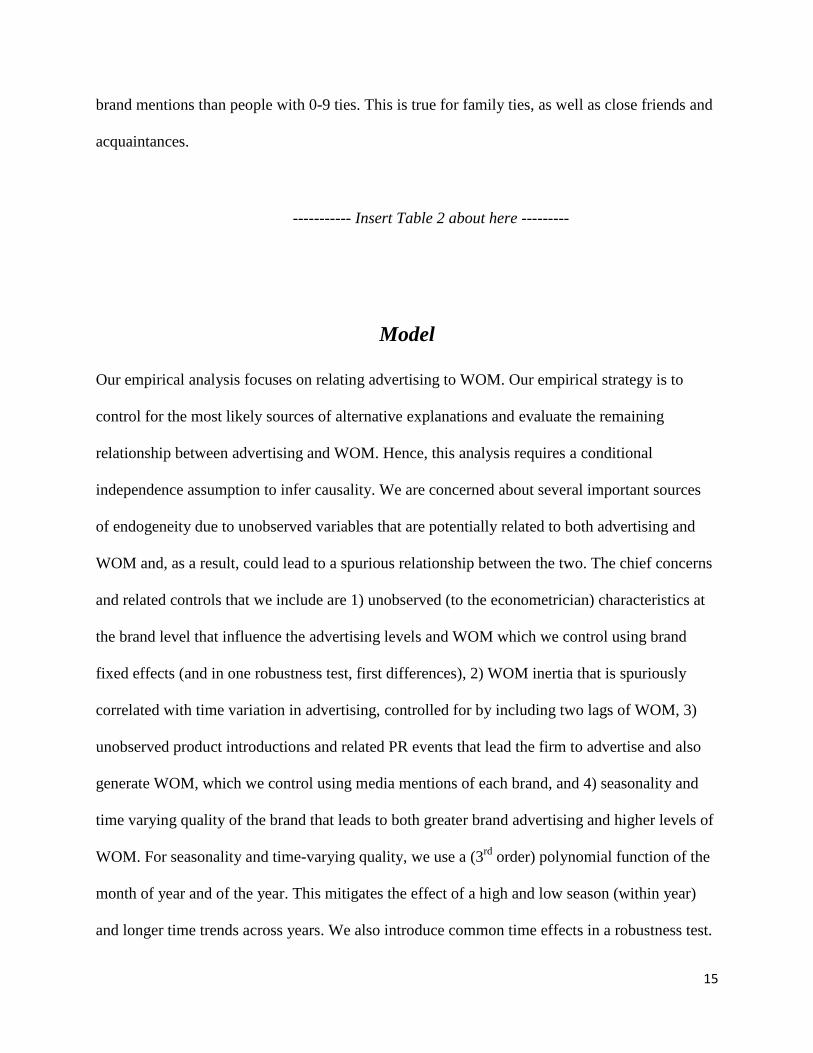
Figure 4 presents time series plots for four representative brands in the dataset. Our main
analysis uses these time series for the full set of brands to evaluate the relationship between
advertising and WOM. These data patterns do not present a clear pattern indicating an
advertising-WOM relationship. In the next section we introduce the model we use to analyze this
data.
------ Insert Figure 4 about here -------
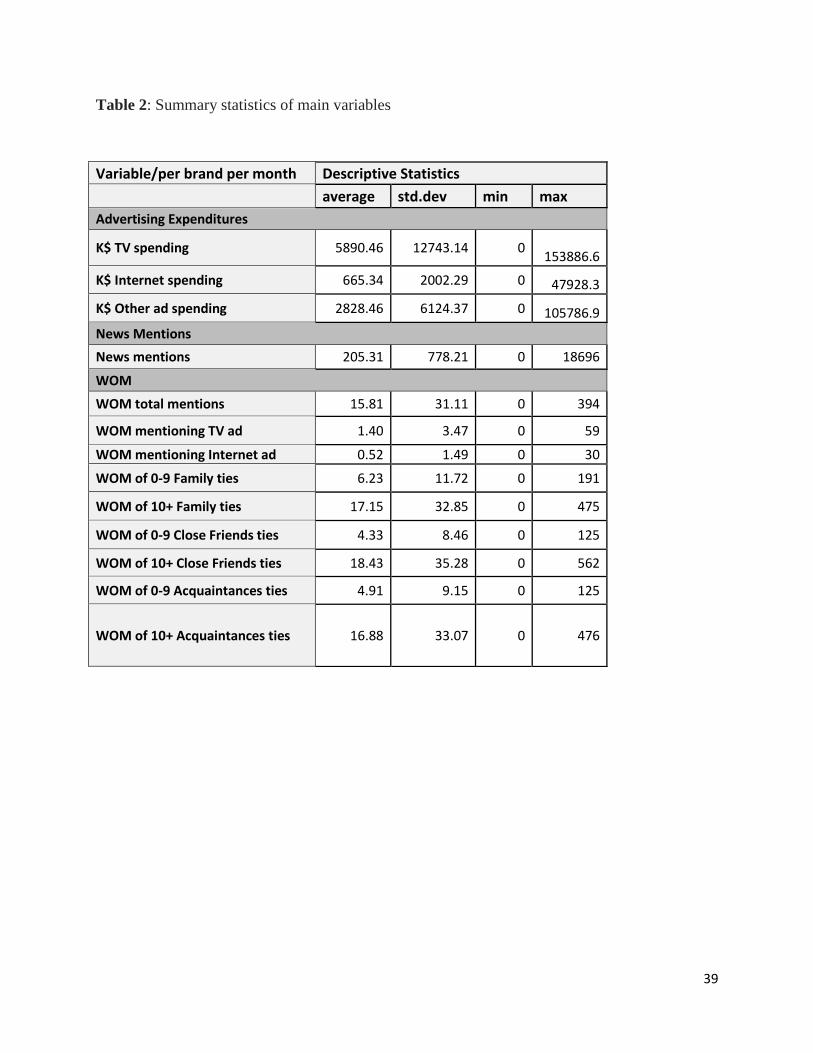
Table 2 presents descriptive information about the main variables in the study. We have
41,964 brand-month observations. The table indicates that the majority of advertising spending is
on TV advertising. Internet display advertising is, on average, 10% of TV advertising. Brands
greatly differ in their advertising spending. On average, a brand receives 205 news mentions per
month. Some brands (e.g., Windex and Zest) do not receive any mentions in some months, and
the most mentioned brand (Facebook) receives the highest mentions (18,696) in May of 2013.
As for WOM, the average number of monthly mentions for a brand is 15 in our sample,
which translates to an estimated 34.5 million average monthly conversations. As for the number
of social ties, people with more than 10 ties, provide approximately 3-4 times more monthly
15
brand mentions than people with 0-9 ties. This is true for family ties, as well as close friends and
acquaintances.
----------- Insert Table 2 about here ---------
Model
Our empirical analysis focuses on relating advertising to WOM. Our empirical strategy is to
control for the most likely sources of alternative explanations and evaluate the remaining
relationship between advertising and WOM. Hence, this analysis requires a conditional
independence assumption to infer causality. We are concerned about several important sources
of endogeneity due to unobserved variables that are potentially related to both advertising and
WOM and, as a result, could lead to a spurious relationship between the two. The chief concerns
and related controls that we include are 1) unobserved (to the econometrician) characteristics at
the brand level that influence the advertising levels and WOM which we control using brand
fixed effects (and in one robustness test, first differences), 2) WOM inertia that is spuriously
correlated with time variation in advertising, controlled for by including two lags of WOM, 3)
unobserved product introductions and related PR events that lead the firm to advertise and also
generate WOM, which we control using media mentions of each brand, and 4) seasonality and
time varying quality of the brand that leads to both greater brand advertising and higher levels of
WOM. For seasonality and time-varying quality, we use a (3rd
order) polynomial function of the
month of year and of the year. This mitigates the effect of a high and low season (within year)
and longer time trends across years. We also introduce common time effects in a robustness test.

16
With these controls in mind, our empirical analysis proceeds as a log-log specification
(where we add one to all variables before the log transformation). Under the conditional
independence assumption, this specification imposes a constant elasticity for the effect of
advertising expenditures on WOM and implies diminishing returns to levels of advertising
expenditures. For a given brand j in month t, the empirical model is defined as
(1) 𝑊𝑂𝑀𝑗𝑡 = 𝛼𝑗 + 𝛾1𝑗𝑊𝑂𝑀𝑗𝑡−1 + 𝛾2𝑗𝑊𝑂𝑀𝑗𝑡−2 + 𝑋𝑗𝑡𝛽0𝑗
+𝛽1𝑗𝑙𝑜𝑔(𝐴𝑑𝑇𝑉)𝑗𝑡 + 𝛽2𝑗log (𝐴𝑑𝐼𝑛𝑡𝑒𝑟𝑛𝑒𝑡)𝑗𝑡 + 𝜀𝑗𝑡
where 𝛼𝑗 are fixed effects, 𝑋𝑗𝑡 contains control variables related to logged dollar expenditure on
other advertising and the observed controls, log(AdTV) and log(AdInternet) relate to the focal
variables, logged dollar expenditures for TV and Internet display ads, and 𝛾1𝑗, 𝛾2𝑗, 𝛽0𝑗, 𝛽1𝑗, 𝛽2𝑗,
are random coefficients for the effect of lagged log word-of-mouth, 𝑋𝑗𝑡, and the focal advertising
variables, respectively. Depending on the model, the observed controls in 𝑋𝑗𝑡 include the logged
dollar expenditures for other advertising (print, outdoor, and radio), logged count of articles
mentioning the brand and either polynomials (cubic) of month of year and year or time fixed
effects.
In what follows, we focus on the average relationship between advertising and WOM across
brands. Despite this focus, we allow brands to have random coefficients on all variables that
enter the regressions (we note a few specific exceptions when reporting results). In one set of
results we also allow observable heterogeneity in brand coefficients in the form of category-level

17
differences.1 For the models that include both random coefficients and fixed effects we use proc
mixed in SAS with REML. For the models without random coefficients we use plm in R, which
estimates the model using a fixed effects panel estimator, noting that in both models our longer
time-series implies negligible `Nickell bias’ in the lagged dependent variables (Nickell 1981).2
Results
We organize our results into five sections. The first section presents our main results related to
the magnitude of the relationship between advertising and WOM and interpreting this magnitude
relative to the industry common wisdom and literature. The second section discusses
heterogeneity in the advertising-WOM relationship across brands and categories. The next two
sections examine two other types of heterogeneity that might suggest the relationship is stronger
than what we estimate. The third section examines the advertising-WOM relationship for word
of mouth that specifically references the ads, and the fourth tests whether the relationship is
stronger for highly connected individuals than those who are less connected. The final section
examines the robustness of our results to model specifications and potential remaining
endogeneity concerns via an analysis using instrumental variables.
The effect of advertising on WOM
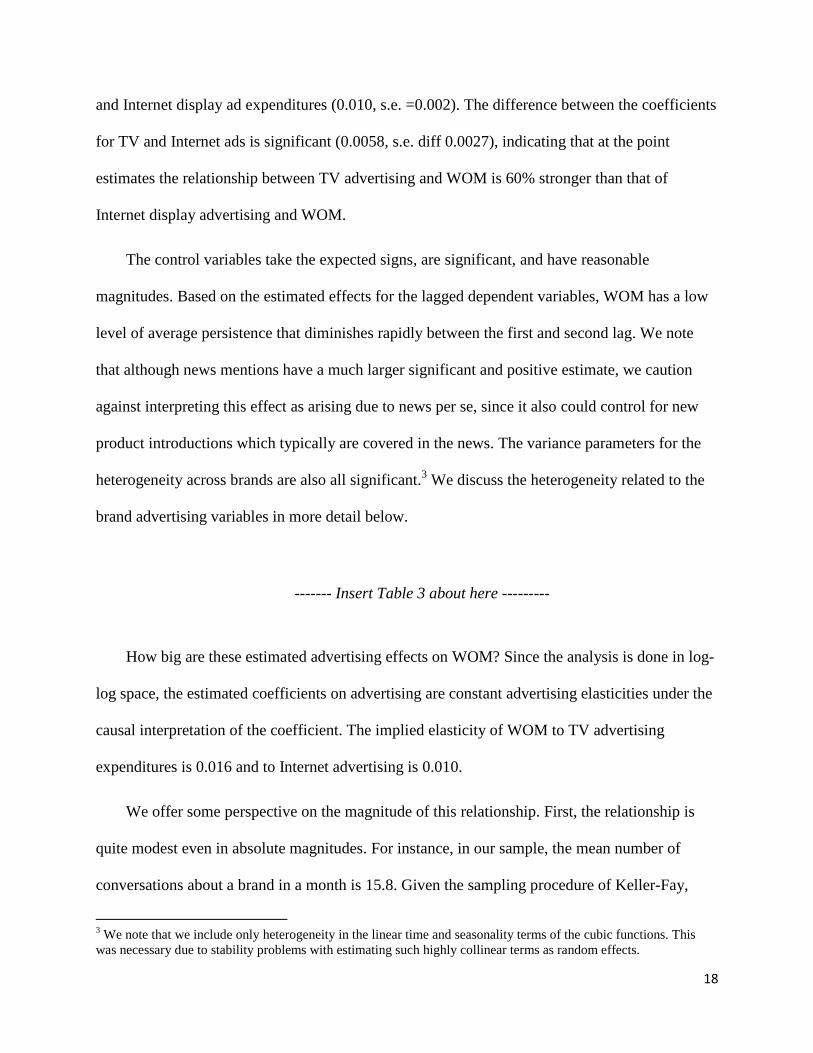
We focus our discussion on how advertising expenditures relate to WOM. Table 3 presents the
results from estimating Equation 1 on the (logged) total word of mouth. We find that the
advertising variables indicate significant positive coefficients for both TV (0.016, s.e. =0.002)
1 We note that we also examined whether the WOM effects varied by brand characteristics using the data provided
by Lovett, Peres, and Shachar (2013). The relationships we found suggested there were few significant relationships,
so few that the relationships could be arising due to random variation rather than actual significance. 2 In robustness checks, we also conduct several two-stage least squares analyses to evaluate the extent of remaining
endogeneity bias after our controls. These are also done in R using plm.
18
and Internet display ad expenditures (0.010, s.e. =0.002). The difference between the coefficients
for TV and Internet ads is significant (0.0058, s.e. diff 0.0027), indicating that at the point
estimates the relationship between TV advertising and WOM is 60% stronger than that of
Internet display advertising and WOM.
The control variables take the expected signs, are significant, and have reasonable
magnitudes. Based on the estimated effects for the lagged dependent variables, WOM has a low
level of average persistence that diminishes rapidly between the first and second lag. We note
that although news mentions have a much larger significant and positive estimate, we caution
against interpreting this effect as arising due to news per se, since it also could control for new
product introductions which typically are covered in the news. The variance parameters for the
heterogeneity across brands are also all significant.3 We discuss the heterogeneity related to the
brand advertising variables in more detail below.
------- Insert Table 3 about here ---------
How big are these estimated advertising effects on WOM? Since the analysis is done in log-
log space, the estimated coefficients on advertising are constant advertising elasticities under the
causal interpretation of the coefficient. The implied elasticity of WOM to TV advertising
expenditures is 0.016 and to Internet advertising is 0.010.
We offer some perspective on the magnitude of this relationship. First, the relationship is
quite modest even in absolute magnitudes. For instance, in our sample, the mean number of
conversations about a brand in a month is 15.8. Given the sampling procedure of Keller-Fay,
3 We note that we include only heterogeneity in the linear time and seasonality terms of the cubic functions. This
was necessary due to stability problems with estimating such highly collinear terms as random effects.
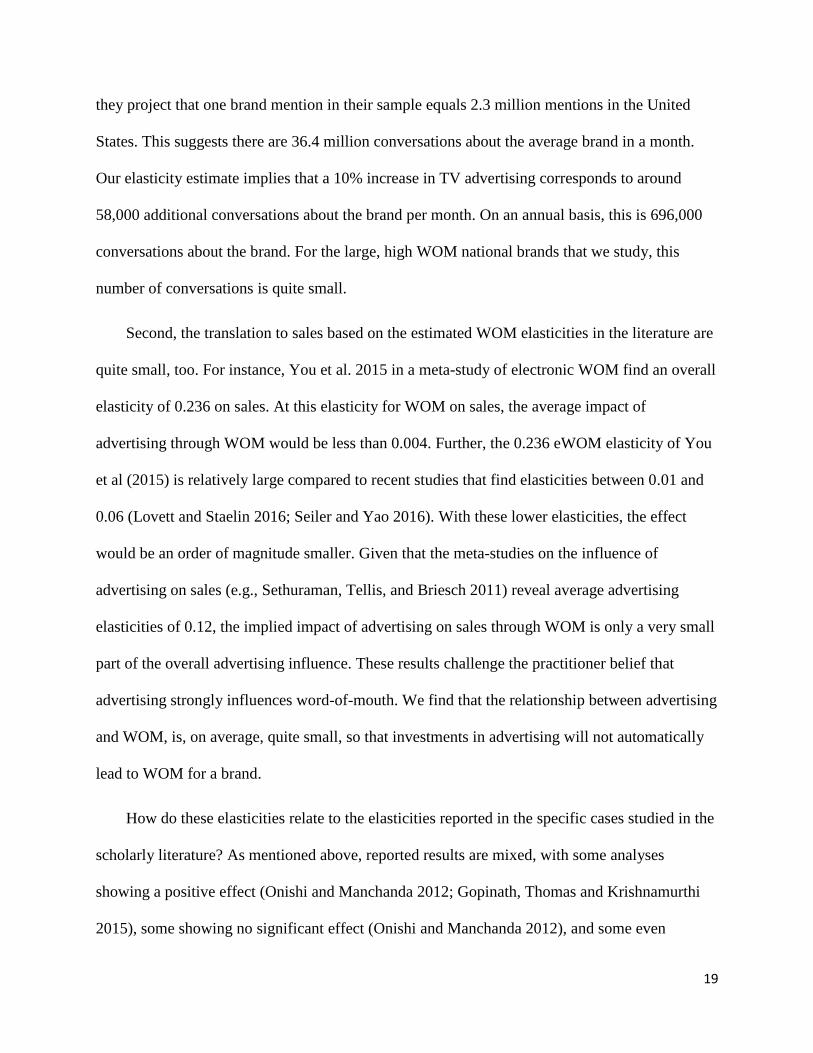
19
they project that one brand mention in their sample equals 2.3 million mentions in the United
States. This suggests there are 36.4 million conversations about the average brand in a month.
Our elasticity estimate implies that a 10% increase in TV advertising corresponds to around
58,000 additional conversations about the brand per month. On an annual basis, this is 696,000
conversations about the brand. For the large, high WOM national brands that we study, this
number of conversations is quite small.
Second, the translation to sales based on the estimated WOM elasticities in the literature are
quite small, too. For instance, You et al. 2015 in a meta-study of electronic WOM find an overall
elasticity of 0.236 on sales. At this elasticity for WOM on sales, the average impact of
advertising through WOM would be less than 0.004. Further, the 0.236 eWOM elasticity of You
et al (2015) is relatively large compared to recent studies that find elasticities between 0.01 and
0.06 (Lovett and Staelin 2016; Seiler and Yao 2016). With these lower elasticities, the effect
would be an order of magnitude smaller. Given that the meta-studies on the influence of
advertising on sales (e.g., Sethuraman, Tellis, and Briesch 2011) reveal average advertising
elasticities of 0.12, the implied impact of advertising on sales through WOM is only a very small
part of the overall advertising influence. These results challenge the practitioner belief that
advertising strongly influences word-of-mouth. We find that the relationship between advertising
and WOM, is, on average, quite small, so that investments in advertising will not automatically
lead to WOM for a brand.
How do these elasticities relate to the elasticities reported in the specific cases studied in the
scholarly literature? As mentioned above, reported results are mixed, with some analyses
showing a positive effect (Onishi and Manchanda 2012; Gopinath, Thomas and Krishnamurthi
2015), some showing no significant effect (Onishi and Manchanda 2012), and some even

20
showing negative effects (Feng and Papatla 2011). The comparison, even in the cases of positive
elasticities is not very direct. For example, Onishi and Manchanda (2012) provide an estimated
elasticity of 0.12 for daily advertising exposures on pre-release WOM, where the WOM is blogs
about 12 different movies in Japan. For five models of mobile phones Gopinath, Thomas, and
Krishnamurthi (2015) find elasticities between 0.19 and 0.37 for monthly online WOM to the
number of advertisements. We differ notably in two ways. First, our measure is the response of
total monthly WOM, which may smooth some of the daily variation captured in Onishi and
Manchanda (2012). Second, our data covers over 500 brands, spans 6.5 years, and covers all
types of WOM, not just online. With these broader definitions and sample, it appears the
estimated average relationship between advertising and WOM is much smaller than what is
currently reported in the literature.4
Hence, in absolute terms and relative to the findings in the literature, we find a weak
average advertising-WOM relationship. In the next section we examine whether some brands or
categories have a much stronger relationship.
Does the average effect mask larger effects for some brands or categories?
We now turn to the heterogeneity related to the advertising variables. Brand level heterogeneity
in the relationship between advertising and WOM could lead some brands to have strong
relationships and others to have weak relationships, resulting in the small average coefficients
described above. For instance, this variation could arise from different customer bases, different
brand characteristics or degrees of engagement with the brand, or different types or quality of
advertising campaigns between brands. Table 3 shows that the standard deviations for the
heterogeneity in advertising coefficients are roughly the same size as the coefficients themselves,
4 Our small result appears similar in some respects to Du and Wilbur’s (2016) small correlation between advertising
and brand image.
21
indicating that brands differ meaningfully in the relationship between WOM and advertising, but
that the cross-brand variation does not produce an order of magnitude shift in the point estimates.
Considering a two standard deviation shift, for TV, for example, the heterogeneity estimates
imply that a few brands have point estimates as high as 0.054. Although the max of these point
estimates are larger than the overall average, 0.054 is still less than half the size of the typical
sales elasticity to advertising. This suggests that even for the brands with the largest relationships
between advertising and WOM, the magnitudes are relatively modest.
To understand whether the relationships systematically differ between categories, we
incorporate category dummy variables and interact them with the regressors in equation (1).
Figure 5 presents the category level estimates with +/- one standard error bars for both TV and
Internet dollar spend. As apparent, the automobiles category has the smallest average TV
advertising-WOM relationship (-0.004, but not significantly different from zero), whereas the
highest estimate is 0.041 for Sports and Hobbies, significantly larger than zero and the
coefficient for automobiles. Also, on the high end are Telecommunications, which includes
mobile handset sellers, and Media and Entertainment, which includes movies. These latter two
categories are ones that past research has found to have significant, positive effects of advertising
on WOM (mobile handsets and movies). Hence, the category variation we find is directionally
consistent with the categories that have been studied in the past being exceptionally large, and
may partially explain why some past studies found higher effect sizes. For Internet display
advertising expenditures, we find that Sports and Hobbies have one of the weakest relationships,
whereas Media and Entertainment are the highest.
------- Insert Figure 5 about here ---------
22
Do ads have a stronger effect when the WOM is about advertising?
Our main results are for the relationship between advertising and all WOM. However,
advertising could be more effective at generating conversations about brands that mention the
advertising, which we refer to as ad-WOM. As we noted in the data section brand conversations
often do include references to advertising, with 6-14% of conversations referencing TV ads and
2-6% referencing Internet ads. In our previous analysis, we pooled all WOM together, which
could cover up a stronger relationship between advertising and the number of brand
conversations that reference ads. To test whether this is the case, we estimate the same model but
use as the dependent variable (and lagged dependent variables) the WOM that references either
TV ads or Internet ads (ad-WOM).
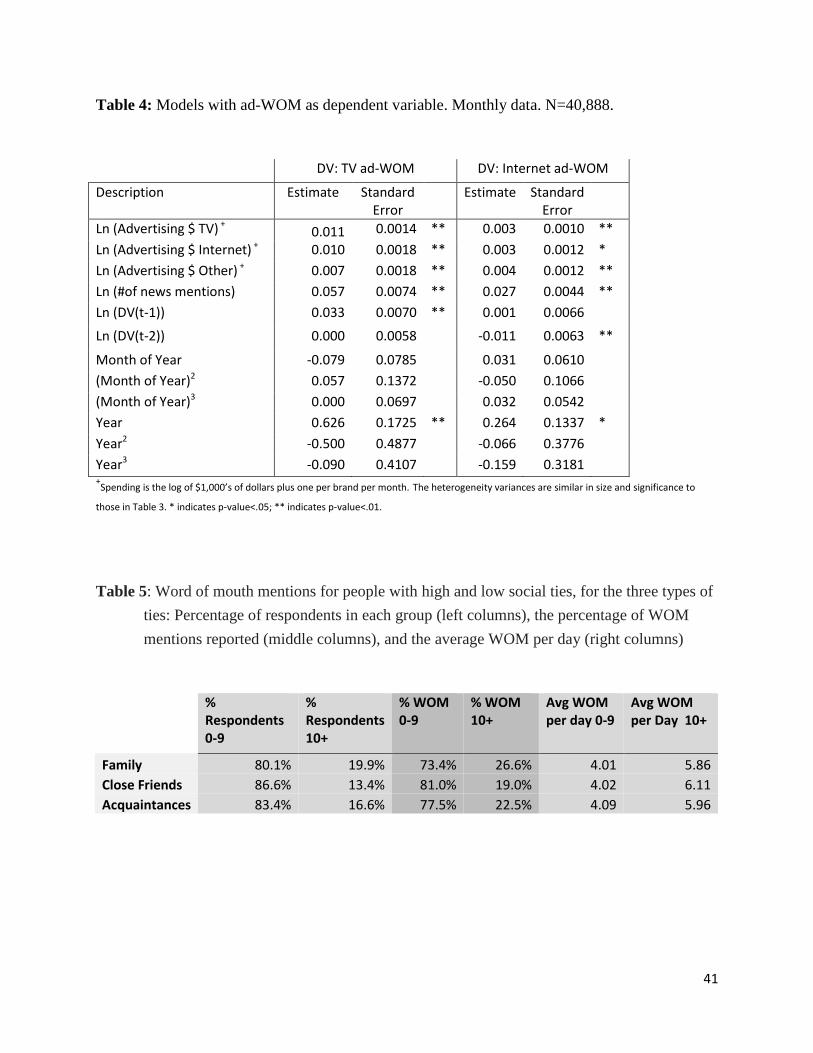
The results of the two analyses are presented in Table 4. The TV ad-WOM analysis reveals
that advertising coefficients have a similar magnitude and significance as those presented in the
main analysis in Table 3. The relationship between the advertising variables and the Internet ad-
WOM is estimated to be smaller than that found for the total WOM measures. Recall that the
construction of the ad-WOM measure differs from that of the total WOM so that a direct
comparison of the estimates is not possible. Yet we can conclude that these results provide no
evidence that the advertising-WOM relationship is meaningfully stronger when considering only
WOM that discusses advertising. Hence, although many brand conversations talk about the ads,
the advertising didn’t necessarily “cause” the conversation about the ads. Instead, the advertising
becomes part of the existing conversations that would have happened anyway.
------- Insert Table 4 about here --------
23
Dependence on the number and strength of social ties
Even if the average advertising effect is small, Katz and Lazerfeld (1955) predict that those with
more connections are influenced more by mass advertising to talk about brands. People with
more social ties, indeed, are more likely to engage in WOM. The last two columns of Table 5
indicates that whereas the average number of WOM mentions per day is approximately 4 for an
individual with 0-9 connections, an individual with 10+ connections has around 50% more brand
conversations on average per day, i.e., 5.9-6.1. This suggests that those with many connections
generate above normal amounts of conversation. However, the first two sets of columns indicate
that despite this higher rate of conversations per respondent day, the 0-9 group still dominates the
total conversation because there are so many more of these individuals. Neither of these facts,
however, speaks to how influenced these groups are by advertising expenditures.
----------- Insert Table 5 about here ---------
We now examine whether the advertising-WOM relationship differs based on the type and
number of connections the individual has. We consider strong and weak connections, where
weak is acquaintances and strong includes connections to either family or close friends. We
allow both strong and weak connections to have different coefficients for people with 0-9
connections and people with 10 or more connections. We allow all variables to interact with the
pairs of strong/weak connection types and few/many number of connections. Because we have
WOM observations for each connection type and number of connections, the number of

24
observations increases six-fold.5 On this data, we estimate the main model (i.e., with fixed brand
effects and brand random coefficients).
In Figure 6 we present the results from interacting the social connection type and the
number of social connections with the advertising expenditure variables. First, consider the
coefficients related to TV advertising expenditures. The largest coefficient is for 0-9 strong
connections. The coefficient for 0-9 weak connections are slightly smaller, but not significantly
so. The coefficients for 10+ weak and strong connections decrease roughly 35% (-0.004) from
the 0-9 strong connections value and these decreases are significant. Internet display advertising
expenditures have a similar pattern. As is clear in the figure, the only significant relationship is
due to the number of connections. Regardless of the advertising type and the connection type, the
advertising-WOM relationship is strongest for those with fewer connections.
This result is not consistent with the two-step communication flow models (Katz and
Lazerfeld 1955; Campbell, Mayzlin and Shin 2013). Highly connected individuals do not appear
to be influenced more by advertising to generate WOM. On the contrary, the 0-9 group has a
stronger advertising-WOM relationship. This result is more in line with the general literature on
advertising influence showing that it is the people with lower income and minorities who are
more responsive to advertising (Shavitt, Lowrey and Haefner 1998; Gopinath, Chintagunta and
Venkataraman 2013), as opposed to an elite group of opinion leaders.
Importantly, even though we find that those with 0-9 connections have a stronger
advertising-WOM relationship than those with 10 and more connections, the differences are not
very large when considering the total relationship to WOM. The largest coefficients are still
quite small, with implied elasticities in the order of 0.01 to 0.02. Hence, the data do not support 5 We also estimated a model where all variables are interacted with these connection type-number of connections
variables. The results were consistent, so we report the simpler set of results here.
25
that advertising has an outsized effect on individuals with a certain kind or number of
connections that is muted in the average coefficient we measure.
------- Insert Figure 6 about here ---------
Robustness checks
In this section, we provide evidence on the robustness of our results to different model
specifications and to potential remaining endogeneity concerns. To illustrate the robustness of
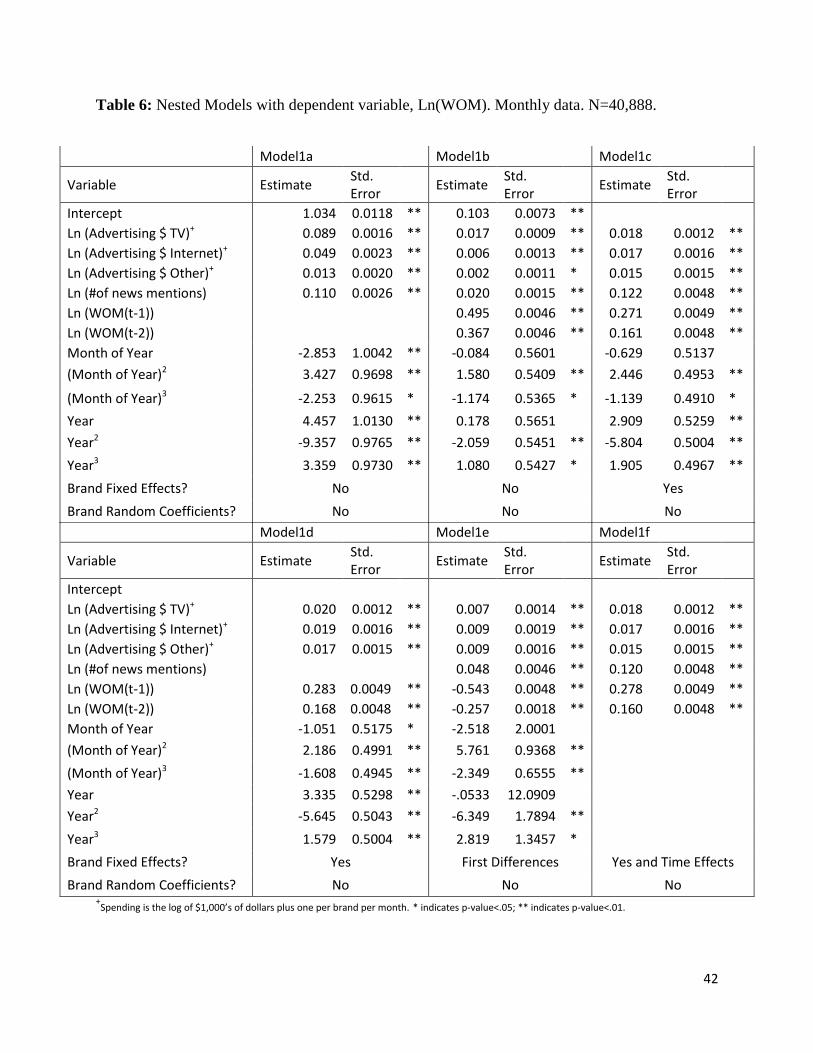
our results presented in Table 3, Table 6 presents six model specifications that delete or adjust
variables or model components from the model of Equation (1). In Model 1a, we only include
the advertising variables, the news mentions, and the time and seasonality controls (i.e., no
lagged dependent variable, no brand fixed effects, no brand random coefficients). This model
with very limited controls produces implied elasticities that are larger (0.09 for TV and 0.05 for
Internet). However, without the additional controls, these estimates are likely to be spurious.
Model 1b adds to Model 1a the two lags of Ln(WOM). In this model, the estimated elasticities
are already quite small (0.017 for TV and 0.006 for Internet). Model 1c adds brand fixed effects
to the model and we find that the implied elasticities actually grow slightly (0.018 for TV and
0.017 for Internet). Model 1d deletes News Mentions variable from the main model of Table 3.
Again we find the remaining coefficients are quite similar in size and significance. In Model 1e,
we replace the fixed effects with first differences. In model 1f, we include time effects for each
month in the data instead of cubic trends of month of year and year. Looking across these
specifications, the primary conclusion that is not consistent across robustness checks is that the
coefficient on Internet advertising expenditures is not statistically larger than TV advertising
expenditures. Thus, the implied advertising elasticities appear to be consistently small, whenever
26
reasonable controls are included. Further, the main controls that are important are brand fixed
effects (or first differences) and the lagged Ln(WOM).
---- Insert Table 6 about here ------
Although we control for the main endogeneity concerns, one might remain concerned that
brand managers anticipate some specific shocks to WOM and also plan in advance their
advertising around those anticipated shocks. To examine whether our results are biased due to
any such remaining endogeneity between, e.g., TV advertising and the unobserved term in the
regression, we applied a two-stage least squares analysis. This analysis is applied to the model
without random coefficients. As instruments, we use average national advertising costs per
advertising unit obtained from Kantar Media’s Ad$pender data. The argument for validity of the
instrument comes from a supply-side argument that advertisers respond to advertising costs, and
the exclusion here is that no single brand sets the price of advertising that prevails in the market.
We were able to obtain these per unit costs for TV, magazines, and newspapers. For Internet
display advertising we include total political Internet display advertising expenditures. Here, we
follow the argument made by Sinkinson and Starc (2015) that political advertising can crowd out
commercial advertisers. We interact these cost and political advertising variables with the brand
indicators, producing 2152=538*4 instruments.
We found that the Cragg-Donald statistic for this set of instruments (3.24 with 3 endogenous
variables) failed to achieve the minimum thresholds suggested by Stock and Yogo (2005),
suggesting these are weak instruments. Further, the first stage regression coefficients were
counterintuitive for the total political Internet advertising variables, for example, with many

27
brands having higher Internet display advertising expenditures when political advertising
expenditures were larger. These results suggest that we should interpret this analysis using the
instruments with caution since it could produce biased estimates due to weak instruments that are
not operating as theoretically predicted. In principle, the indication of weakness and biasing
could arise because we include many potentially weak instruments that may not be helpful
(Angrist and Pischke 2009). To examine this, we also estimated the model via two-stage least
squares where we use LASSO in the first stage to select the optimal instruments for each of the
three endogenous variables (Belloni et al. 2012). In principle, if a subset of all instruments are
strong, then this analysis would select the optimal set of instruments. The LASSO procedure,
however, “deselects” less than 20% of the instruments.6
Table 7 presents the results of the two different instrumental variables analyses. The
estimates for advertising expenditures still have effect sizes that are quite small with the largest
being 0.04 for Internet display advertising. Although this estimate is larger than our main
estimates, it is still much smaller than the existing elasticities of WOM to advertising. In
addition, unlike our correlational analysis that requires a conditional independence assumption
for causal inference, these results indicate that Internet advertising expenditures are significantly
more effective than TV advertising expenditures in generating WOM. However, when combined
with the inconsistent finding in the robustness checks for this difference and given the weakness
of the instruments, we interpret this contradiction to suggest that the relative effect size is
ambiguous. This is consistent with the results of Draganska, Hartmann, and Stanglein (2014),
6 Following Angrist and Pischke (2009), we also examined point estimates from a LIML estimator. The estimated
values are quite similar to the LASSO-IV estimates and are available upon request. We also examined the
instruments without the brand interactions and this similarly produced weak instrument results and unreasonable
first stage estimates.

28
who find that advertising on TV and the Internet do not have significantly different effects on
brand performance metrics.
--------- Insert Table 7 about here ----------
Discussion
In this paper, we conducted an empirical analysis to evaluate the widely-accepted practitioner
wisdom that advertising is an important driver of WOM. This practitioner wisdom shapes
advertisers’ measurements on the benefits of advertising and influences investments in
advertising. While practitioners appear to assume advertising increases WOM meaningfully,
scholarly empirical research on this influence is scarce, is based on specific product launches,
and shows mixed results. Our dataset contains information on 538 U.S national brands across 16
categories over a period of 6.5 years. Our analysis controls for news mentions, time lagged
WOM, seasonality, secular trends, and brand fixed effects and random coefficients, and checks
robustness against potential remaining endogeneity.
Our findings include:
1. The relationship between advertising and WOM is positive and significant, but small.
The average implied elasticity of TV advertising is 0.016, and that of Internet advertising
is 0.010. These elasticities challenge the widely-held practitioner belief that advertising
has a strong impact on WOM. Projecting from our sample to the entire US population,
for an average brand in our dataset this implies that a 10% increase in TV advertising
leads to 58,000 additional conversations about the brand per month. Comparing the direct
and indirect effects of advertising, our results imply that the average indirect elasticity of
29
advertising on sales through WOM is 0.004, which is only a small part of the estimated
average elasticity on sales of 0.12 (Sethuraman, Tellis, and Briesch 2011).
2. Cross-brand and cross-category heterogeneity in the advertising-WOM relationship is
significant. The categories with the largest implied elasticities to TV advertising are
Sports and Hobbies, Media and Entertainment, and Telecommunications. However, even
for these categories, the average implied elasticity is relatively small, with values
between 0.02 and 0.05. Similarly, the “best” brands are estimated to have average
elasticities of only around 0.05.
3. While brand conversations often mention TV ads (average of 10% for TV and 4% for
Internet), advertising expenditures do not appear to cause a large increase in WOM
conversations that reference the ads (ad-WOM). We estimate the advertising-WOM
relationship, on average, to be similarly small for this ad-WOM as compared to total
WOM.
4. Although individuals with many (10+) social ties generate around 50% more WOM per
person than individuals with few (0-9) ties (6 vs 4 conversations per day, respectively),
our estimates suggest that individuals with few ties are more influenced by advertising.
However, this larger influence is still quite small (between 0.01 and 0.02 elasticity).
What are the managerial implications of our findings? Our findings mean, as the title of this
paper implies, that “there is no free lunch.” Mass TV and Internet display advertising
expenditures do not automatically generate WOM. More precisely, across 538 brands and many
campaigns per brand over the 6.5-year observation window, high advertising expenditures on
30
average are not associated with a large increase in WOM. Similarly, based on our analysis, no
single brand appears to generate large average effects across the 6.5 years.
In view of our results, how might we make sense of the practitioner belief that advertising
has a strong influence on WOM? While it is hard to track the exact nature of the analyses done in
the practitioner research, we managed to talk to authors and sponsors of some of these studies. It
seems that these studies, much like the significant positive results in the few academic studies,
focus on a small number of brands and campaigns. Our analysis cannot rule out that specific
campaigns, especially those that are designed to trigger WOM, will have a larger impact on
WOM. For instance, campaigns for special events such as the Super Bowl or campaigns focused
on viral marketing on YouTube, Facebook, or Twitter might be more successful in generating
WOM about brands than the averages we measure.
Does the small average effect we find imply that investing in advertising to generate WOM is
foolish? Not necessarily. If marketers seek to enhance WOM through advertising, they will need
to go beyond the typical advertising campaigns contained in our dataset. Our analysis reveals
that managers are unlikely to generate meaningful increases in WOM unless they obtain deeper
knowledge of which expenditures and campaigns generate WOM on which channels. We
suggest that for managers to pursue the goal of generating WOM from advertising, they need to
be able to track WOM carefully and use methods that can assess the effectiveness of advertising
in generating WOM at a relatively fine-grained level (e.g., campaign or creative).
Further, our analysis of WOM by those with many social connections and those with few
connections suggests that pursuing a simple strategy of targeting highly connected individuals
may not generate the desired higher WOM returns to advertising. Because we find that those
with relatively few connections have a stronger advertising-WOM relationship than those with
31
many connections, this suggests investments need to be balanced carefully between the two
groups rather than loaded primarily on the highly connected individuals. Our analysis does not
exhaust the user traits that could moderate the advertising-WOM relationship (e.g.,
innovativeness, brand loyalty, or specific media consumption habits) and these traits could be the
focus of targeted buzz generation efforts through advertising. Again, to pursue a strategy of
increasing WOM through targeted advertising requires deeper knowledge of how specific types
of individuals respond to WOM.
The above discussion already points to limitations of this study and potential avenues for
future research. Most of our analyses use an empirical strategy that leverages control variables to
avoid potential endogeneity concerns related to seasonality, unobserved brand effects, secular
trends, and new product/service launches. For causal inferences we rely on a conditional
independence assumption. We also conduct an instrumental variables analysis to evaluate
remaining endogeneity concerns and this analysis produces results consistent with our main
conclusions, but the empirical analysis suggests the instruments we were able to identify are not
ideal.
Future research could complement the current study by leveraging individual level data, as
well as data that can capture heterogeneity in the advertising effect on WOM across campaigns
and WOM channels. In addition, because our measures of advertising focused on expenditures,
research could consider exposure measures which more closely reflect what consumers
experience. Similarly, our measures operate at the monthly level and WOM response, especially
online, may be much faster so that WOM response may be muted in our monthly data.
References

32
Aaker, David A. and Alexander Biel (2013), Brand equity & advertising: advertising's role in
building strong brands, Psychology Press.
Angrist, Joshua and Jörn Steffen Pischke (2008), Mostly Harmless Econometrics: An
Empiricist’s Companion, Princeton University Press.
Aral, Sinan, and Dylan Walker (2012), "Identifying influential and susceptible members of social
networks," Science, 337 (6092), 337-341.
Bansal, Harvir S. and Peter A. Voyer (2000), "Word-of-mouth processes within a services
purchase decision context," Journal of service research, 3 (2), 166-177.
Batra, Rajeev, David A. Aaker, and John G. Myers (1995), Advertising Management, 5th
Edition,
Prentice Hall.
Belloni, Alexandre, Daniel Chen, Victor Chernozhukov, and Christian Hansen (2012), "Sparse
models and methods for optimal instruments with an application to eminent domain,"
Econometrica, 80 (6), 2369-2429.
Berger, Jonah (2014), "Word of mouth and interpersonal communication: A review and
directions for future research," Journal of Consumer Psychology 24 (4) 586-607.
Berger, Jonah and Katherine L. Milkman (2012), "What makes online content viral?" Journal of
marketing research, 49 (2), 192-205.
Bollinger, Bryan, Michael Cohen, and Lai Jiang (2013), "Measuring Asymmetric Persistence and
Interaction Effects of Media Exposures Across Platforms," working paper.
Bruce, Norris I., Natasha Zhang Foutz, and Ceren Kolsarici (2012), "Dynamic effectiveness of
advertising and word of mouth in sequential distribution of new products," Journal of
Marketing Research, 49 (4), 469-486.
Bughin, Jacques, Jonathan Doogan, and Ole Jorgen Vetvik (2010), "A new way to measure
word-of –mouth marketing," McKinsey Quarterly, 2010 (2), 113-116.
Calisir, Fethi (2003),"Web advertising vs other media: young consumers’ view," Internet
Research, 13 (5), 356–363.
Campbell, Arthur, Dina Mayzlin, and Jiwoong Shin (2013), "Managing Buzz", working paper.
Chen, Yubo and Jinhong Xie (2008), "Online consumer review: Word-of-mouth as a new
element of marketing communication mix," Management Science, 54 (3), 477-491.
Chevalier, Judith A. and Dina Mayzlin (2006), "The effect of word of mouth on sales: Online
book reviews," Journal of marketing research, 43 (3), 345-354.
33
Chew, Jonathan (2016), "Here's What Spending Millions on a Super Bowl Ad Gets You",
Fortune, Feb-6-2016.
Danaher, Peter J., and Tracey S. Dagger (2013), "Comparing the relative effectiveness of
advertising channels: A case study of a multimedia blitz campaign," Journal of
Marketing Research, 50 (4), 517-534.
Dichter, Ernest (1966), "How Word-of-mouth Advertising Works," Harvard business Review, 16
(November-December), 147-166.
Dijkstra, Majorie, Heidi EJJM Buijtels, and W. Fred van Raaij (2005), "Separate and joint effects
of medium type on consumer responses: a comparison of television, print, and the
Internet," Journal of Business Research, 58 (3), 377-386.
Dinner, Isaac M., Harald J. Van Heerde, and Scott A. Neslin (2014), "Driving online and offline
sales: The cross-channel effects of traditional, online display, and paid search
advertising," Journal of Marketing Research, 51 (5), 527-545.
Draganska, Michaela, Wes Hartmann, and Gena Stanglein (2014), "Internet vs. Television
advertising: A brand-building comparison," Journal of Marketing Research, 51 (5), 578-
590.
Drèze, Xavier and François‐Xavier Hussherr (2003), "Internet advertising: Is anybody
watching?" Journal of interactive marketing, 17 (4), 8-23.
Du, Rex and Kenneth C. Wilbur, “Advertising and Brand Image: Evidence from 575 Brands
over 5 Years,” Working Paper.
Duan, Wenjing, Bin Gu, and Andrew B. Whinston (2008) "The dynamics of online word-of-
mouth and product sales: An empirical investigation of the movie industry," Journal of
retailing, 84 (2), 233-242.
Feng, Jie and Purushottam Papatla (2011), "Advertising: stimulant or suppressant of online word
of mouth?" Journal of Interactive Marketing, 25 (2), 75-84.
Furrier, John (2013) “Innovative Advertising Is About Integrating TV with Social - Kia Motors
Uses Social Media to Reach the New Audience,” Forbes, Feb-25-2013.
Gelb, Betsy and Madeline Johnson (1995), "Word-of-mouth communication: Causes and
consequences," Marketing Health Services, 15 (3), 54.
Gelper, Sarah, Renana Peres, and Jehoshua Eliashberg (2016), "Talk Bursts: The Role of Spikes
in Pre-release Word-of-Mouth Dynamics," working paper.
34
Gopinath, Shyam, Pradeep K. Chintagunta, and Sriram Venkataraman (2013), "Blogs,
advertising, and local-market movie box office performance," Management Science, 59
(12), 2635-2654.
Gopinath, Shyam, Jacquelyn S. Thomas, and Lakshman Krishnamurthi (2014), "Investigating the
relationship between the content of online word of mouth, advertising, and brand
performance," Marketing Science, 33 (2), 241-258.
Graham, Jeffrey, and William Havlena (2007), "Finding the “missing link”: Advertising's impact
on word of mouth, web searches, and site visits," Journal of Advertising Research, 47 (4),
427-435.
Herr, Paul M., Frank R. Kardes, and John Kim (1991), "Effects of word-of-mouth and product-
attribute information on persuasion: An accessibility-diagnosticity perspective," Journal
of consumer research, 17 (4), 454-462.
Hogan, John E., Katherine N. Lemon, and Barak Libai (2004), "Quantifying the ripple: Word-of-
mouth and advertising effectiveness," Journal of Advertising Research, 44 (3), 271-280.
Holbrook, Morris B. and Rajeev Batra (1987), "Assessing the role of emotions as mediators of
consumer responses to advertising," Journal of consumer research, 14 (3) 404-420.
Hu, Yansong and Christophe Van den Bulte (2014), "Nonmonotonic status effects in new
product adoption," Marketing Science, 33 (4), 509-533.
Katz, Elihu and Paul Felix Lazarsfeld (1955), Personal Influence, The part played by people in
the flow of mass communications, Transaction Publishers.
Keller, Edward and Jonathan Berry (2003), The Influentials: One American in Ten T ells the
Other Nine How to Vote, Where to Eat, and What to Buy. Simon and Schuster.
Keller, Ed and Brad Fay (2009), "The role of advertising in word of mouth," Journal of
Advertising Research, 49 (2), 154-158.
Keller, Ed and Brad Fay (2012), The Face-To-Face Book: Why Real Relationships Rule In a
Digital Marketplace, Simon and Schuster.
Iyengar, Raghuram, Christophe Van den Bulte, and Thomas W. Valente (2011), "Opinion
leadership and social contagion in new product diffusion," Marketing Science 30 (2),
195-212.
Liu, Yong (2006), "Word of mouth for movies: Its dynamics and impact on box office
revenue." Journal of marketing 70 (3) 74-89.

35
Lovett, Mitchell J. and Richard E. Staelin (2016), “The Role of Paid, Earned, and Owned Media
in Building Entertainment Brands: Reminding, Informing, and Enhancing Enjoyment,”
Marketing Science, 35(1), 142-157.
MacInnis, Deborah J., Christine Moorman, and Bernard J. Jaworski (1991), "Enhancing and
measuring consumers' motivation, opportunity, and ability to process brand information
from ads," The Journal of Marketing, 55 (4), 32-53.
Manchanda, Puneet, Jean-Pierre Dube, K.Y. Goh, and Pradeep Chintagunta (2006), "The effect
of banner advertising on internet purchasing," Journal of Marketing Research, 43 (1), 98-
108.
Mitra, Anusree and John G. Lynch Jr. (1995),"Toward a reconciliation of market power and
information theories of advertising effects on price elasticity," Journal of Consumer
Research, 21 (4), 644-659.
Moon, Sangkil, Paul K. Bergey, and Dawn Iacobucci (2010), "Dynamic effects among movie
ratings, movie revenues, and viewer satisfaction," Journal of Marketing, 74 (1), 108-121.
Naik, Prasad A. and Kalyan Raman (2003), "Understanding the impact of synergy in multimedia
communications," Journal of Marketing Research, 40 (4), 375-388.
Nickell, Stephen (1981), "Biases in dynamic models with fixed effects," Econometrica, 49 (6),
1417-1426.
Nielsen (2016), "Stirring up buzz: How TV ads are driving earned media for brands,"
http://www.nielsen.com/us/en/insights/news/2016/stirring-up-buzz-how-tv-ads-are-
driving-earned-media-for-brands.html
Olney, Thomas J., Morris B. Holbrook, and Rajeev Batra (1991), "Consumer responses to
advertising: The effects of ad content, emotions, and attitude toward the ad on viewing
time," Journal of consumer research 17 (4), 440-453.
Onishi, Hiroshi and Puneet Manchanda (2012), "Marketing activity, blogging and
sales," International Journal of Research in Marketing, 29 (3), 221-234.
Park, C. Whan, Martin S. Roth, and Philip F. Jacques (1988), "Evaluating the effects of
advertising and sales promotion campaigns," Industrial Marketing Management, 17 (2),
129-140.
Reichheld, Frederick F (2003), "The one number you need to grow," Harvard business
review, 81 (12), 46-55.

36
Seiler, Stephan, Song Yao, and Wenbo Wang (2016), “Does Online Word of Mouth Increase
Demand? (and How?) Evidence from a Natural Experiment,” Stanford Graduate School
of Business Research Paper No. 15-62.
Sethuraman, Raj, Gerard J. Tellis, and Richard A. Briesch (2011), "How well does advertising
work? Generalizations from meta-analysis of brand advertising elasticities," Journal of
Marketing Research, 48 (3), 457-471.
Shavitt, Sharon, Pamela Lowrey, and James Haefner (1998), "Public attitudes toward
advertising: More favorable than you might think," Journal of advertising research, 38
(4), 7-22.
Siefert, Caleb J., Ravi Kothuri, Devra B. Jacobs, Brian Levine, Joseph Plummer, and Carl D.
Marci (2009), "Winning the Super “Buzz” Bowl," Journal of Advertising Research, 49
(3), 293-303.
Sinkinson, Michael and Amanda Starc (2015), "Ask your doctor? Direct-to-consumer advertising
of pharmaceuticals," Working Paper.
Smith, Robert E., and William R. Swinyard (1982), "Information response models: An integrated
approach," The Journal of Marketing, 46 (1), 81-93.
Soh, Hyeonjin, Leonard N. Reid, and Karen Whitehill King (2007), "Trust in different
advertising media," Journalism & Mass Communication Quarterly, 84 (3), 455-476.
Spotts, Harlan E., Scott C. Purvis, and Sandeep Patnaik (2014),"How digital conversations
reinforce super bowl advertising," Journal of Advertising Research, 54 (4), 454-468.
Stephen, Andrew T. and Jeff Galak (2012), "The effects of traditional and social earned media
on sales: A study of a microlending marketplace," Journal of Marketing Research, 49 (5),
624-639.
Stock, James and Motohiro Yogo (2005), "Testing for weak instruments in linear IV regression,"
in chapter 5 in Identification and inference for econometric models: Essays in honor of
Thomas Rothenberg.
Sundaram, D.S. Kaushik Mitra, and Cynthia Webster (1998), "Word-Of-Mouth
Communications: A Motivational Analysis", in Advances in Consumer Research, Vol. 25,
Joseph W. Alba, and J. Wesley Hutchinson, eds. Provo, UT: Assoc. for Consumer Research,
527-531.
Turner (2016), "Television advertising is a key driver of social media engagement for brands,"
http://www.4cinsights.com/wp-
content/uploads/2016/03/4C_Turner_Research_TV_Drives_Social_Brand_Engagement.pdf
37
Van der Lans, Ralf and Gerrit van Bruggen (2010), "Viral marketing: What is it, and what are
the components of viral success," in The Connected Customer: The Changing Nature of
Consumer and Business Markets, New York, 257-281. Eds: Stefan Wuyts, Marnik G.
Dekimpe, Els Gijsbrechts, Rik Pieters.
Van der Lans, Ralf, Gerrit van Bruggen, Jehoshua Eliashberg, and Berend Wierenga (2010), "A
viral branching model for predicting the spread of electronic word of mouth," Marketing
Science, 29 (2), 348-365.
Watts, Duncan J., Jonah Peretti, and Michael Frumin (2007), Viral marketing for the real world.
Harvard Business School Pub.
Weimann, Gabriel (1982), "On the importance of marginality: One more step into the two-step
flow of communication," American Sociological Review, 47 (6), 764-773.
Weimann, Gabriel (1991), "The Influentials: back to the concept of opinion leaders?" Public
Opinion Quarterly, 55 (2), 267-279.
WOMMA (2014), Return on Word of Mouth. https://womma.org/wp-
content/uploads/2015/09/STUDY-WOMMA-Return-on-WOM-Executive-Summary.pdf
You, Ya, Gautham G. Vadakkepatt, and Amit M. Joshi (2015), "A meta-analysis of electronic
word-of-mouth elasticity," Journal of Marketing, 79 (2), 19-39.
Zhu, Feng and Xiaoquan Zhang (2010), "Impact of online consumer reviews on sales: The
moderating role of product and consumer characteristics," Journal of marketing, 74 (2),
133-148.

38
Table 1: Monthly spending on advertising (in thousand dollars) on TV and Internet, and number
of news and press mentions (in thousands) per category.
*NFL=National Football League, MLB= Major Baseball League, NHL = National Hockey League
Category Avg TV $K/mo
Max TV $K/mo
Brand with max spending TV
Avg Internet $K/mo
Max Internet $K/mo
Brand with max spending Internet
Avg news K/mo
Max news K/mo
Brand with max news
Beauty products
355.0 3601.9 L’oreal 17.5 87.0 L’oreal 0.9 7.0 Chanel
Beverages 358.4 3496.2 Pepsi 12.4 168.6 Pepsi 1.3 14.1 Coca-Cola
Cars 1168.3 5961.2 Ford 109.7 701.7 Chevrolet 16.1 171.3 GM
Children's products
166.5 994.7 Mattel 10.0 48.7 Lego 0.7 4.4 Mattel
Clothing products
174.1 1218.6 GAP 10.1 70.0 Kohls 3.9 24.1 GAP
Department stores
640.4 3122.7 Walmart 58.0 380.2 Target 6.0 26.3 Walmart
Financial services
557.2 3108.7 Geico 204.4 1219.7 TD Ameritrade
24.6 154.2 Bank of America
Food and dining
497.8 4601.9 General Mills
21.5 254.0 General Mills
2.3 15.4 Banquet
Health 852.8 4953.0 Johnson & Johnson
45.8 261.6 Johnson & Johnson
4.7 19.5 Pfizer
Home design 453.7 1858.1 Home Depot
34.0 148.1 Home Depot
2.9 14.2 Home Depot
Household Products
355.2 1543.0 Clorox 13.3 94.9 Clorox 0.8 14.2 P&G
Media and entertainment
219.8 4710.6 Time Warner
55.8 652.2 Netflix 30.7 531.3 Facebook
Sports and hobbies
36.6 195.3 NFL * 14.4 63.8 MLB * 188. 451.6 NHL*
Technology 258.0 2193.0 Apple 43.1 465.6 Microsoft 6.4 72.3 Apple
Telecom 1305.1 8700.1 AT&T 84.8 781.9 AT&T 26.0 140.8 iPhone
Travel services 158.0 978.2 Southwest Airlines
43.5 244.6 Expedia 4.6 15.5 Holiday inn
39
Table 2: Summary statistics of main variables
Variable/per brand per month Descriptive Statistics
average std.dev min max
Advertising Expenditures
K$ TV spending 5890.46 12743.14 0 153886.6
K$ Internet spending 665.34 2002.29 0 47928.3
K$ Other ad spending 2828.46 6124.37 0 105786.9
News Mentions
News mentions 205.31 778.21 0 18696
WOM
WOM total mentions 15.81 31.11 0 394
WOM mentioning TV ad 1.40 3.47 0 59
WOM mentioning Internet ad 0.52 1.49 0 30
WOM of 0-9 Family ties 6.23 11.72 0 191
WOM of 10+ Family ties 17.15 32.85 0 475
WOM of 0-9 Close Friends ties 4.33 8.46 0 125
WOM of 10+ Close Friends ties 18.43 35.28 0 562
WOM of 0-9 Acquaintances ties 4.91 9.15 0 125
WOM of 10+ Acquaintances ties 16.88 33.07 0 476

40
Table 3: Main Model with Dependent Variable Ln(WOM). N=40,888.
Population Means Heterogeneity Variances
Variables Estimate Standard Error
Estimate Standard Error
Ln (Advertising $ TV)+ 0.016 0.002 ** 0.0004 0.0001 **
Ln (Advertising $ Internet) + 0.010 0.002 ** 0.0005 0.0001 **
Ln (Advertising $ Other) + 0.013 0.002 ** 0.0006 0.0001 **
Ln (# of news mentions) 0.101 0.009 ** 0.0293 0.0028 **
Ln (WOM(t-1)) 0.129 0.009 ** 0.0279 0.0024 **
Ln (WOM(t-2)) 0.045 0.006 ** 0.0082 0.0011 **
Month of Year -0.317 0.081 ** 0.0115 0.0023 **
(Month of Year)2 0.468 0.142 **
(Month of Year)3 -0.201 0.072 **
Year 0.865 0.181 ** 0.3422 0.0295 **
Year2 -1.257 0.506 * Year3 0.412 0.426
+Spending is the log of $1,000’s of dollars plus one per brand per month. * indicates p-value<.05; ** indicates p-value<.01.
41
Table 4: Models with ad-WOM as dependent variable. Monthly data. N=40,888.
DV: TV ad-WOM DV: Internet ad-WOM
Description Estimate Standard Error
Estimate Standard Error
Ln (Advertising $ TV) + 0.011 0.0014 ** 0.003 0.0010 **
Ln (Advertising $ Internet) + 0.010 0.0018 ** 0.003 0.0012 *
Ln (Advertising $ Other) + 0.007 0.0018 ** 0.004 0.0012 **
Ln (#of news mentions) 0.057 0.0074 ** 0.027 0.0044 **
Ln (DV(t-1)) 0.033 0.0070 ** 0.001 0.0066
Ln (DV(t-2)) 0.000 0.0058 -0.011 0.0063 **
Month of Year -0.079 0.0785 0.031 0.0610
(Month of Year)2 0.057 0.1372 -0.050 0.1066
(Month of Year)3 0.000 0.0697 0.032 0.0542
Year 0.626 0.1725 ** 0.264 0.1337 *
Year2 -0.500 0.4877
-0.066 0.3776 Year3 -0.090 0.4107 -0.159 0.3181 +Spending is the log of $1,000’s of dollars plus one per brand per month. The heterogeneity variances are similar in size and significance to
those in Table 3. * indicates p-value<.05; ** indicates p-value<.01.
Table 5: Word of mouth mentions for people with high and low social ties, for the three types of
ties: Percentage of respondents in each group (left columns), the percentage of WOM
mentions reported (middle columns), and the average WOM per day (right columns)
% Respondents 0-9
% Respondents 10+
% WOM 0-9
% WOM 10+
Avg WOM per day 0-9
Avg WOM per Day 10+
Family 80.1% 19.9% 73.4% 26.6% 4.01 5.86
Close Friends 86.6% 13.4% 81.0% 19.0% 4.02 6.11
Acquaintances 83.4% 16.6% 77.5% 22.5% 4.09 5.96
42
Table 6: Nested Models with dependent variable, Ln(WOM). Monthly data. N=40,888.
+Spending is the log of $1,000’s of dollars plus one per brand per month. * indicates p-value<.05; ** indicates p-value<.01.
Model1a Model1b Model1c
Variable Estimate Std. Error
Estimate Std. Error
Estimate Std. Error
Intercept 1.034 0.0118 ** 0.103 0.0073 **
Ln (Advertising $ TV)+ 0.089 0.0016 ** 0.017 0.0009 ** 0.018 0.0012 **
Ln (Advertising $ Internet)+ 0.049 0.0023 ** 0.006 0.0013 ** 0.017 0.0016 **
Ln (Advertising $ Other)+ 0.013 0.0020 ** 0.002 0.0011 * 0.015 0.0015 **
Ln (#of news mentions) 0.110 0.0026 ** 0.020 0.0015 ** 0.122 0.0048 **
Ln (WOM(t-1))
0.495 0.0046 ** 0.271 0.0049 **
Ln (WOM(t-2))
0.367 0.0046 ** 0.161 0.0048 **
Month of Year -2.853 1.0042 ** -0.084 0.5601
-0.629 0.5137
(Month of Year)2 3.427 0.9698 ** 1.580 0.5409 ** 2.446 0.4953 **
(Month of Year)3 -2.253 0.9615 * -1.174 0.5365 * -1.139 0.4910 *
Year 4.457 1.0130 ** 0.178 0.5651
2.909 0.5259 **
Year2 -9.357 0.9765 ** -2.059 0.5451 ** -5.804 0.5004 **
Year3 3.359 0.9730 ** 1.080 0.5427 * 1.905 0.4967 **
Brand Fixed Effects? No No Yes
Brand Random Coefficients? No No No
Model1d Model1e Model1f
Variable Estimate Std. Error
Estimate Std. Error
Estimate Std. Error
Intercept
Ln (Advertising $ TV)+ 0.020 0.0012 ** 0.007 0.0014 ** 0.018 0.0012 **
Ln (Advertising $ Internet)+ 0.019 0.0016 ** 0.009 0.0019 ** 0.017 0.0016 **
Ln (Advertising $ Other)+ 0.017 0.0015 ** 0.009 0.0016 ** 0.015 0.0015 **
Ln (#of news mentions) 0.048 0.0046 ** 0.120 0.0048 **
Ln (WOM(t-1)) 0.283 0.0049 ** -0.543 0.0048 ** 0.278 0.0049 **
Ln (WOM(t-2)) 0.168 0.0048 ** -0.257 0.0018 ** 0.160 0.0048 **
Month of Year -1.051 0.5175 * -2.518 2.0001
(Month of Year)2 2.186 0.4991 ** 5.761 0.9368 **
(Month of Year)3 -1.608 0.4945 ** -2.349 0.6555 **
Year 3.335 0.5298 ** -.0533 12.0909
Year2 -5.645 0.5043 ** -6.349 1.7894 **
Year3 1.579 0.5004 ** 2.819 1.3457 *
Brand Fixed Effects? Yes First Differences Yes and Time Effects
Brand Random Coefficients? No No No
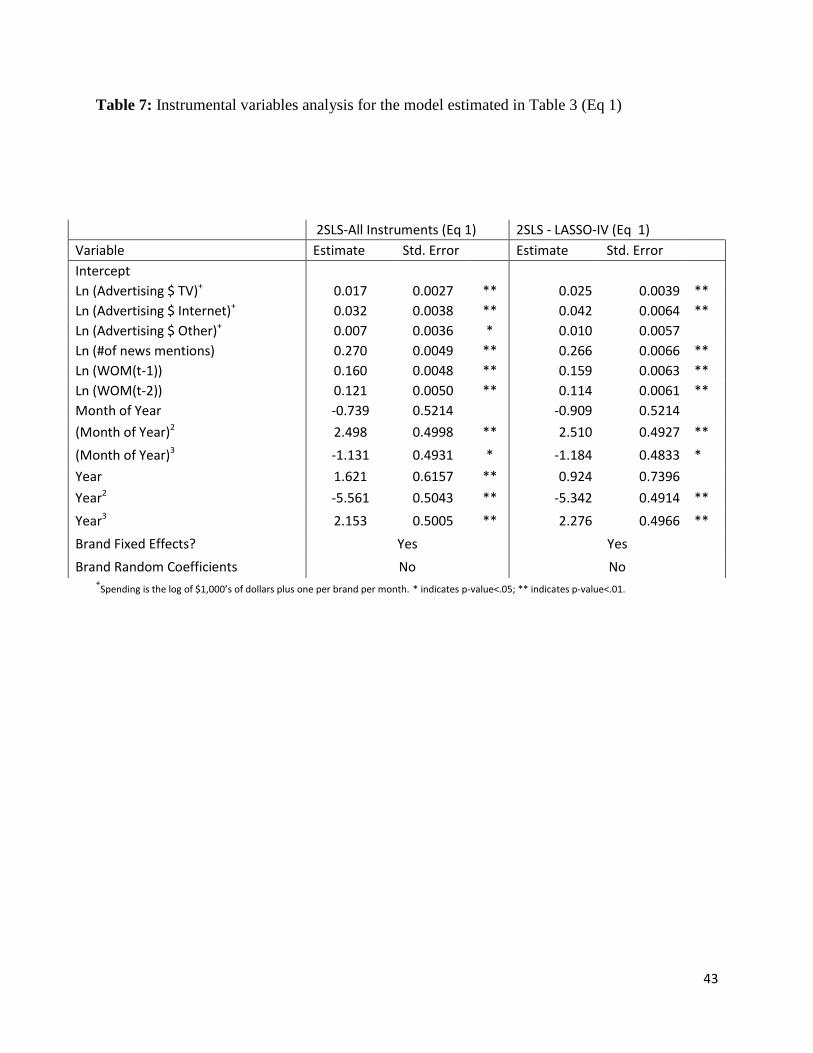
43
Table 7: Instrumental variables analysis for the model estimated in Table 3 (Eq 1)
+Spending is the log of $1,000’s of dollars plus one per brand per month. * indicates p-value<.05; ** indicates p-value<.01.
2SLS-All Instruments (Eq 1) 2SLS - LASSO-IV (Eq 1)
Variable Estimate Std. Error Estimate Std. Error
Intercept
Ln (Advertising $ TV)+ 0.017 0.0027 ** 0.025 0.0039 **
Ln (Advertising $ Internet)+ 0.032 0.0038 ** 0.042 0.0064 **
Ln (Advertising $ Other)+ 0.007 0.0036 * 0.010 0.0057
Ln (#of news mentions) 0.270 0.0049 ** 0.266 0.0066 **
Ln (WOM(t-1)) 0.160 0.0048 ** 0.159 0.0063 **
Ln (WOM(t-2)) 0.121 0.0050 ** 0.114 0.0061 **
Month of Year -0.739 0.5214 -0.909 0.5214
(Month of Year)2 2.498 0.4998 ** 2.510 0.4927 **
(Month of Year)3 -1.131 0.4931 * -1.184 0.4833 *
Year 1.621 0.6157 ** 0.924 0.7396
Year2 -5.561 0.5043 ** -5.342 0.4914 **
Year3 2.153 0.5005 ** 2.276 0.4966 **
Brand Fixed Effects? Yes Yes
Brand Random Coefficients No No
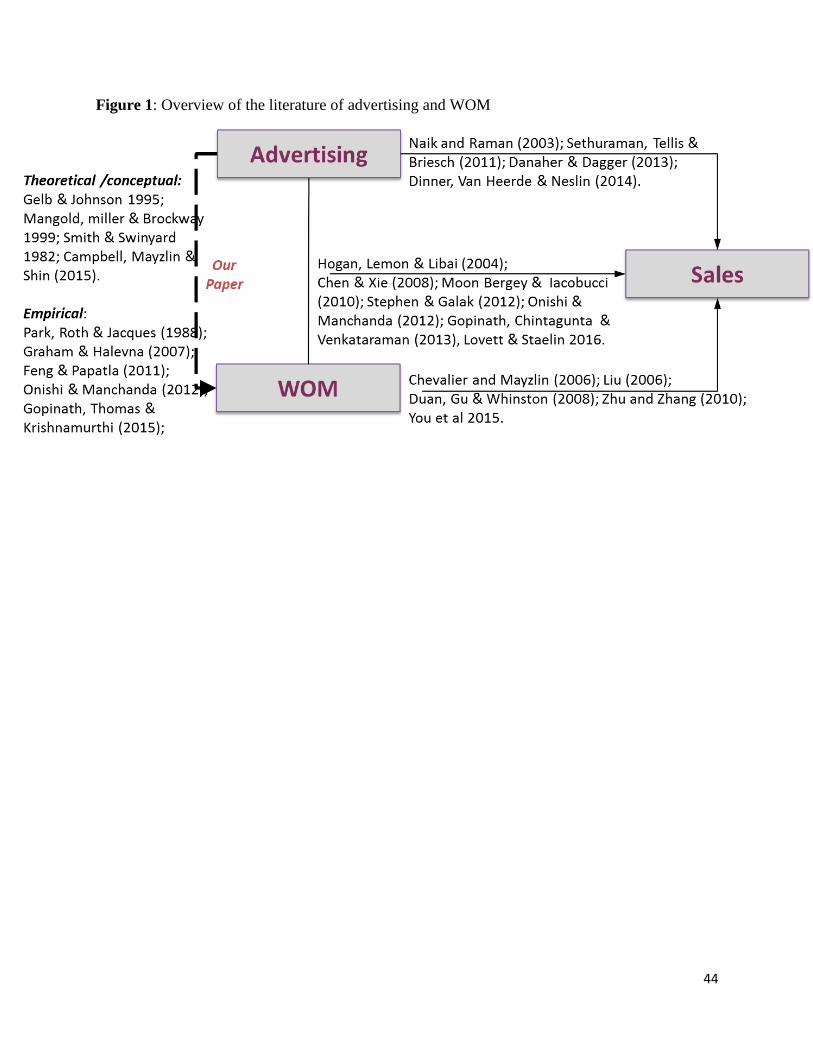
44
Figure 1: Overview of the literature of advertising and WOM

45
Figure 2: Percentage of WOM conversations mentioning TV advertising (top panel) or Internet
advertising (bottom panel).
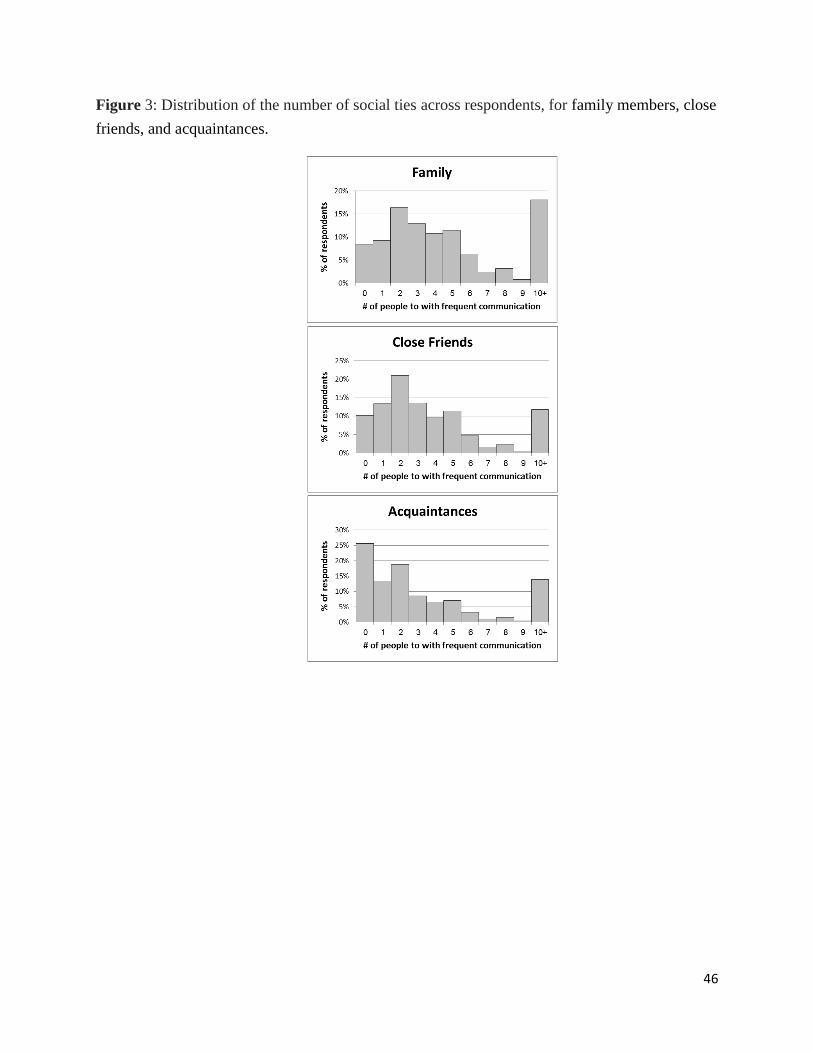
46
Figure 3: Distribution of the number of social ties across respondents, for family members, close
friends, and acquaintances.

47
Figure 4: Illustration of the time series data - monthly advertising expenditure on TV and
Internet, number of news mentions, and WOM, for four brands.

48
Figure 5: Effect of advertising on WOM per product category
Figure 6: Effect of advertising on WOM for highly connected vs. less connected people, and for
strong (family and close friends) vs. weak ties (acquaintances).
*In both panels, the differences between strong and weak ties are insignificant, but the decrease between the effect of
individuals with 0-9 and 10+, are significant.

49
Appendix A: Summary statistics and correlations of main variables
Variable/per brand per month Descriptive Statistics Correlations
average std.dev min max 1 2 3 4 5 6 7 8 9 10 11 12 13
Advertising Expenditures
1 Ln (K$ TV spending) 5.407 3.825 0 11.94 1 0.56 0.56 0.06 0.42 0.37 0.23 0.37 0.40 0.32 0.40 0.35 0.40
2 Ln (K$ Internet spending) 3.777 2.781 0 10.78 0.56 1 0.60 0.31 0.39 0.31 0.31 0.34 0.39 0.32 0.39 0.34 0.38
3 Ln (K$ Other ad spending) 5.532 3.171 0 11.57 0.56 0.60 1 0.23 0.33 0.24 0.23 0.30 0.32 0.28 0.32 0.30 0.31
News Mentions
4 Ln (News mentions) 3.322 1.909 0 9.84 0.06 0.31 0.23 1 0.26 0.21 0.25 0.23 0.27 0.26 0.25 0.26 0.25
WOM
5 Ln (WOM total mentions) 2.142 1.088 0 5.98 0.42 0.39 0.33 0.26 1 0.70 0.57 0.84 0.92 0.79 0.93 0.81 0.92
6
Ln (WOM mentioning TV ad) 0.502 0.720 0 4.09 0.37 0.31 0.24 0.21 0.70 1 0.52 0.65 0.69 0.64 0.70 0.63 0.70
7
Ln (WOM mentioning Internet ad) 0.239 0.492 0 3.43 0.23 0.31 0.23 0.25 0.57 0.52 1 0.53 0.56 0.53 0.56 0.53 0.56
8
Ln (WOM of 0-9 Family ties) 1.404 0.992 0 5.26 0.37 0.34 0.30 0.23 0.84 0.65 0.53 1 0.78 0.82 0.85 0.83 0.84
9
Ln (WOM of 10+ Family ties) 2.228 1.083 0 6.17 0.40 0.39 0.32 0.27 0.92 0.69 0.56 0.78 1 0.79 0.96 0.81 0.95
10
Ln (WOM of 0-9 Close Friends ties) 1.130 0.944 0 4.84 0.32 0.32 0.28 0.26 0.79 0.64 0.53 0.82 0.79 1 0.74 0.82 0.78
11
Ln (WOM of 10+ Close Friends ties) 2.291 1.094 0 6.33 0.40 0.39 0.32 0.25 0.93 0.70 0.56 0.85 0.96 0.74 1 0.81 0.97
12
Ln (WOM of 0-9 Acquaintances ties) 1.243 0.949 0 4.84 0.35 0.34 0.30 0.26 0.81 0.63 0.53 0.83 0.81 0.82 0.81 1 0.75
13
Ln (WOM of 10+ Acquaintances ties) 2.196 1.100 0 6.17 0.40 0.38 0.31 0.25 0.92 0.70 0.56 0.84 0.95 0.78 0.97 0.75 1