there is no evidence - science speaksciencespeak.com/noevidence.pdf · there is no evidence ......
TRANSCRIPT

1
There Is No Evidence Dr David Evans ([email protected])
16 June 2009
Last minor revision 20 October 2009
Web address: http://sciencespeak.com/NoEvidence.pdf
Introduction
Let’s break down the case for human-caused global warming:
1) There is plenty of evidence that global warming has been occurring recently.
2) There is ample evidence that carbon dioxide causes warming and that the level
of atmospheric carbon dioxide is increasing.
3) But there is no evidence that carbon dioxide emissions are the main cause of
the recent global warming.
The alarmists focus you entirely on the first two points, to distract you from the third.
Yes, every emitted molecule of carbon dioxide (CO2) causes some warming—but the
crucial question is how much warming do the CO2 emissions cause? If atmospheric
CO2 levels doubled, would the temperature rise by 0.1°, 1.0°, or by 10.0° C?
We go through the usual ―evidence‖ offered by alarmists, and show that in each case
either it:
Is not evidence about what causes global warming. Proof that global warming
occurred is not proof that CO2 was mainly responsible.
Is not empirical evidence; that is, it is not independent of theory. In particular,
models are theory, not evidence.
Says nothing about how much the temperature would rise for a given rise in
CO2 levels.
Despite spending $50bn over the last 20 years looking for evidence of point (3) above,
the alarmists have found none. In two instances they expected to find it, but in both
cases they found only evidence of the opposite—and they have kept awfully quiet
about those cases. If they had some evidence they could just tell us what it was—and
end the debate. But the obvious explanation for the lack of evidence is simply that it is
not true that CO2 emissions are the main cause of the recent global warming.
There used to be some supporting evidence, but better data later reversed it. Instead,
there are now at least three independent pieces of evidence that the temperature rises
predicted by the IPCC due to CO2 emissions are exaggerated by a factor of between 2
and 10, because the water vapor feedback is in fact not nearly as strong as assumed by
the climate models. Finally, we will discuss some examples of what would constitute
evidence.

2
What is Evidence?
―Evidence‖ in this document means observations that prove or suggest that human
emissions of CO2 are the main cause of the recent global warming. Evidence includes
the following information:
Who made the observations?
When were they made?
What did they observe? (In general terms, we don’t have to see the raw data.)
How do the observations support the idea that rising CO2 levels are the main
cause of the recent global warming?
The evidence must of course be empirical, meaning that it is independent of theory.
Typical Alarmist Offerings of “Evidence”
Polar Bears, Glaciers, Arctic Melt, Antarctic Ice Shelves, Storms, Droughts, Fires, Malaria, Snow Melt on Mt Kilimanjaro, Rising Sea Levels, Ocean Warming, Urban Heat Island Effect
Although each of these issues may say something about whether or not global
warming is or was occurring, none of them say anything about the causes of global
warming. It would make no difference to these issues if the recent global warming was
caused by CO2 or by aliens heating the planet with ray guns.
The IPCC Said So
So what is their evidence? Chapter 9 of their latest Assessment Report 4 (2007),
―Understanding and Attributing Climate Change‖, contains no evidence. That CO2 is
the main cause of the recent global warming is an assumption in much of what they
say, and they find many ingenious ways of saying it and implying it using complex
language. But repetition is not proof, and nowhere do they present any actual evidence.
If you doubt me, read it yourself then say what the evidence is in your own words:
ipcc-wg1.ucar.edu/wg1/Report/AR4WG1_Print_Ch09.pdf
Often the assumption takes the form that nearly all the temperature rises since the start
of industrialization are due to CO2 rises, or that there are no other possible significant
causes of global warming. See It Cannot Be Anything Else, below.
Computer Models are Evidence
Computer models consist solely of a large number of calculations that, individually,
you could do on a hand-held calculator. So models are theoretical, and cannot form
part of any evidence.
Computer Models Incorporate a Lot of Sound Empirical Science
Yes they do. The climate models contain some well-established science that has been
verified by empirical observations. But they also contain a myriad of:
implicit and explicit assumptions

3
omissions
guesses
gross approximations.
A single mistake in any one of these can invalidate the climate models.
Typical engineering models that mimic reality closely contain no untested
assumptions, material omissions, guesses, or gross approximations. They are the result
of mature understanding of the reality being modelled, and have been tested ad
nauseum in a wide range of circumstances. On the other hand, climate science is in its
infancy, individual models routinely fail most tests, the climate models are riddled
with untested assumptions and guesses, they approximate the atmosphere with cells a
hundred kilometres square and hundreds of meters high, and they do not even attempt
to model individual cloud formations or any feature smaller than the cell size. Don’t let
the word ―model‖ fool you into thinking climate models are better than they are.
Computer Model Projections Agree with Something that Actually Happened
This only shows that a particular model predicted a particular outcome.
It might be because the model accurately mimics reality, or it might be an accident.
Given that all climate models contain a myriad of implicit and explicit assumptions,
omissions, guesses, and gross approximations (see the last section), it’s probably a fair
bit of the latter. Even a broken clock is right twice a day.
None of the climate models in 2001 predicted that temperatures would not rise from
2001 to 2009—they were all wrong. All of the models wrongly predict a huge
dominating tropical hotspot in the atmospheric warming pattern—no such hotspot has
been observed, and if it was there we would easily have detected it.
While it may give us more confidence that that model might make further successful
predictions, the current climate models are so uncertain and leave out so many natural
factors that even the IPCC does not call their outputs ―predictions‖.
CO2 is a Greenhouse Gas
Yes, CO2 was proven to be a greenhouse gas in laboratories over a century ago.
Furthermore, we know what the absorption frequencies of CO2 are, and we can
calculate how much outgoing radiation the CO2 in the atmosphere reflects back to the
earth. (CO2 molecules absorb radiation at their absorption frequencies, which are all in
the infra-red range, and later re-emit radiation with the same energy at those same
frequencies but in random directions. So a cloud of CO2 acts like a blanket at those
frequencies, ultimately reflecting most of the radiation at those frequencies back to
earth.)
The CO2 absorption frequencies are already saturated, meaning that they are already
reflecting close to 100% of the radiation at those frequencies. As the level of CO2 in
the atmosphere increases, the band of frequencies at which they reflect radiation
widens. This band widening is logarithmic—the amount of radiation reflected by the

4
CO2 is the logarithm of the level of atmospheric CO2—so the warming effect of each
extra quantum of atmospheric CO2 is much less than the effect of the previous
quantum. (Each doubling of CO2 has the same effect once beyond about 100 ppmv, at
which concentration the CO2 band is already saturated.)
These calculations are validated by laboratory experiments, and are not in dispute.
The IPCC climate models use these calculations to predict how much warming will
occur as the CO2 level increases. This is called the no-feedbacks warming, a
―baseline‖ warming. The no-feedbacks warming causes changes, which in turn cause
further warming or cooling. This extra warming or cooling is called the temperature
change due to feedbacks, and it amplifies or dampens the baseline warming:
If the feedback is ―positive‖ then the temperature change due to feedbacks is a
warming: the feedbacks amplify the original no-feedbacks warming and the net
effect is a larger warming than the no-feedbacks warming.
If the feedback is ―negative‖ then the temperature change due to feedbacks is a
cooling: the feedbacks dampen the original no-feedbacks warming and the net
effect is a smaller warming than the no-feedbacks warming.
This method for analysing the effects of rising CO2 levels is not in dispute.
But here’s why these calculations of the warming effect of extra CO2 are not evidence.
The calculated warming effect of the extra CO2 is the no-feedbacks warming, but the
actual warming that occurs is the combination of this no-feedbacks warming and the
consequent temperature change due to feedbacks. We cannot observe just the no-
feedbacks warming; we can only observe the combination of the no-feedbacks
warming and the temperature change due to feedbacks.
Unless we also know the temperature change due to feedbacks, knowing the no-
feedbacks warming due to increased CO2 only tells us whether the net effect is
warming or cooling, because we do not know how much the feedbacks will amplify or
dampen the no-feedbacks warming. The temperature change due to feedbacks makes
all the difference: is the no-feedbacks warming due to extra CO2 amplified or
dampened by the climate feedbacks, and by how much?
As it happens, the temperature change due to feedbacks in our climate is immensely
complicated and no one even claims to have a complete understanding of it. Certainly
there are no calculations of it that are generally accepted or empirically verified; it is
unproven and unknown. So all we really know for sure from the calculations of how
much warming the extra CO2 causes by reflecting radiation, is that the net effect of the
extra CO2 is warming! (Well who would have guessed?) Which is why those
calculations are not evidence.
So yes, CO2 is a greenhouse gas and extra CO2 causes global warming. But even
though we can calculate how much warming the radiation reflected by the extra CO2
would cause in the absence of climate feedbacks, this does not tell us how much global
warming is caused by the extra CO2—because we do not know how much the climate
system amplifies or dampens that no-feedbacks warming due to the extra CO2.

5
More on Climate Feedbacks
The last topic is the nub of the real scientific climate debate. In this section we will go
into more detail about the effect of climate feedbacks on the no-feedback warming
effect of extra CO2.
The IPCC climate models have assumed certain feedbacks, but these assumptions
amount to little more than intuitive guesses. These guesses were made around 1980
when the CO2 theory of global warming was first seriously proposed, and people
simply did not know what the effects of feedbacks were. The assumptions seemed
reasonable at the time. Scientists have since made more observations on feedbacks,
and we now have a better (though still imperfect) idea of the effect of feedbacks.
The IPCC climate models assume strongly amplifying positive feedback. But the
evidence now points fairly strongly to the feedbacks being weakly negative,
dampening the no-feedback warming due to the extra CO2. This is the heart of the
scientific debate over how much warming is caused by rising CO2 levels. Obviously
the new evidence clashes badly with the current theory as espoused by the IPCC. This
argument could go on for years, especially as the stakes are so high for those with
vested interests in the current IPCC theory of strong positive feedbacks.
This dispute will eventually be resolved by more evidence. But if you have to choose
now between assumptions made thirty years ago and imperfect observational
evidence gathered in the last decade, then I don’t think you should bet the farm on
the assumptions of thirty years ago.
By the way, the stability of the earth’s climate also depends on the climate feedbacks.
If the climate feedbacks are as strongly positive as the ones programmed into the IPCC
climate models, then the earth’s climate is fairly unstable and it won’t take much more
pushing from higher CO2 levels to push the earth past its tipping point and to
experience a sudden and huge warming as runaway greenhouse warming takes hold.
On the other hand, if the climate feedbacks are negative then the climate is stable and
we are not near a tipping point. Geological history tells us that the earth has never gone
into runaway greenhouse warming (unlike Venus), that CO2 levels have been twenty
times current levels while experiencing similar temperatures, and that CO2 levels have
been five times higher than today during some past ice ages. So geological history is
strongly hinting that the feedbacks are negative.
To put some numbers on the situation, consider what happens when the level of
atmospheric CO2 doubles (on current trends, CO2 will have doubled from its
preindustrial level of 280 ppmv to around 540 ppmv by about 2070):
The no-feedback warming due to a doubling of CO2 is generally calculated to
be about 1.2°C. That is, doubling the level of atmospheric CO2 would, in the
absence of climate feedbacks, heat the world by about 1.2°C.
The global warming for a doubling of CO2 is called the climate sensitivity, and
is the standard benchmark. The IPCC’s current view is that the climate
sensitivity is probably about 3.3°C, but definitely between 2.0°C and 4.5°C.
The IPCC climate models assume total feedbacks such that they amplify the
no-feedback warming due to CO2 to about 3.3°C. The rise from 1.2°C to 3.3°C

6
is 275%, so the IPCC climate models are using positive feedback that amplifies
any no-feedbacks warming by about 2.75.
Observational evidence from satellite measurements of outgoing radiation from
the earth suggests a climate sensitivity of 0.5°C (Lindzen and Choi, in press),
while recent close observations of clouds (which both reflect outgoing radiation
back to earth and reflect incoming radiation away from earth) suggest a climate
sensitivity of about 0.6°C (Spencer, 2009). These are both recent cases of
observed data, and both suggest that the climate has negative feedback that
dampens any no-feedbacks warming by about a half.
The predominant feedback is the water vapor feedback. Water vapor is water in
gaseous form in the air, from where it may precipitate into raindrops and form clouds,
whence the water might get rained back to earth. Water vapor is a greenhouse gas,
trapping outgoing radiation at different frequencies from CO2 (though there is also
some overlap). Water vapor is the main greenhouse gas, trapping far more heat than
the rest of the greenhouse gases (CO2, methane, etc) put together. The water vapor
absorption bands are often not saturated, so small changes in water vapor can have a
relatively large effect on climate. Understanding water vapor is the key to
understanding climate feedbacks and thus the key to understanding climate, and it is
also the area where our understanding is most immature.
IPCC climate theory assumes that any no-feedback warming heats the ocean, which
causes more evaporation, which puts more water vapor in the air. Water vapor being a
greenhouse gas, this causes extra warming. There being no data to the contrary in
1980, this seemed like a good assumption at the time.
A necessary consequence of the extra water vapor is that it adds water vapor to the top
of the lower troposphere (the part of the atmosphere under the water vapor greenhouse
blanket), thus pushing the top of the lower troposphere higher, particularly in the
tropics. This means that a volume of atmosphere that was previously above the lower
troposphere (above the blanket) is now inside the lower troposphere (beneath the
blanket)—so this volume warms up. In graphs of the atmospheric warming pattern
expected by the IPCC, this volume shows up as a very prominent hotspot. Thus, if
water vapor feedback is positive, warming due to increased CO2 (or indeed any other
cause) should cause a hotspot about 10 km up over the tropics.

7
Figure 1: Climate models assume that a warming world will lead to extra water vapor
(due to more evaporation from the oceans), and that this extra water vapor will warm
the world further (water vapor is the main greenhouse gas). That extra vapor would
extend the lower troposphere upward and create a hotspot. Observations show there is
no hotspot. Therefore there is no extra water vapor and no amplification of the
warming due to extra CO2. Diagram from joannenova.com.au.
Figure 2: Observed atmospheric warming pattern (left) versus IPCC theory (right).
Note the dominant hotspot at 11 km over the tropics predicted by the models on the
right, but its complete absence in the observed data on the left. The left diagram shows
radiosonde observations for 1979 – 1999, as per the US CCSP of 2006, part E of
Figure 5.7 in section 5.5 on page 116. The right diagram shows what the IPCC climate
models say happened for 1958 – 1999, as per the US CCSP of 2006, Figure 1.3 in
section 1.5 on page 25. The period 1958 – 1999 is comparable to 1979 – 1999 because
there was little net temperature change in 1958 – 1978, and this is the public data of
model outputs that best matches the observed data on the left (which is only available
for 1979 – 1999).
However radiosonde observations for 1979 – 1999, which covers the bulk of the last
period of global warming, show no hotspot whatsoever. Not even a small one. This
shows pretty conclusively that the water vapor feedback assumed in the IPCC climate

8
models does not exist. Turning the water vapor feedback in the IPC models down to
zero reduces the temperature increases predicted by those various models due to
increased CO2 by a factor of 2 to 3: the assumed water vapor feedback was responsible
for most of the warming in the models. This is discussed in more detail in
sciencespeak.com/MissingSignature.pdf
(The alarmists were expecting the radiosonde data to reveal the hotspot. If it had, this
would have been excellent confirmation of a strong positive feedback and thus support
of the climate model predictions—that is, evidence! But by 1995 it was becoming
obvious that the hotspot wasn’t present. The alarmists went awfully quiet on the issue,
and as far as I know the first public outing of the radiosonde data that showed the
hotspot was missing was buried among a set of theoretical warming patterns deep in a
US CCSP report in 2006. The alarmists never raise the topic of the missing hotspot,
except when they have a new method for claiming that we cannot entirely rule out its
presence.)
Satellites show increased absorption of upwelling infrared radiation in the CO2 bands
Of course. CO2 is a greenhouse gas and its levels have been increasing, so it absorbs
and reflects more infrared radiation coming from the earth. These satellite observations
tells us no more than what we already knew, except that the satellite is working
correctly.
This is not evidence because it does not tell us how much warming the extra CO2
causes, as per the section CO2 is a Greenhouse Gas above.
The atmospheric warming pattern over the last warming period shows stratospheric cooling and tropospheric warming
A pattern of broad stratospheric cooling and broad tropospheric warming is caused by
either:
More greenhouse gases (because more outgoing infrared radiation is absorbed
and reflected in the troposphere).
Less ozone (because less incoming UV-radiation is absorbed by the ozone in
the stratosphere).
We already know that ozone depletion and rising levels of CO2 both occurred during
the last warming period (1977 – 2001), so both are responsible, in some unknown
proportions, for the observed pattern. So these satellite observations tells us no more
than what we already knew, except that the satellite is working correctly.
This is not evidence because it does not tell us how much warming the extra CO2
causes, as per the section CO2 is a Greenhouse Gas above.
CO2 is Correlated with Temperature
This ―evidence‖ is often stated something like this: ―There is no smoking gun that
proves CO2 is the culprit, but, as with germ theory, evolution, and the ill-effects of
smoking, it is correlations that is the evidence.‖

9
Alarmists assert that there is a generally linear relationship between CO2 levels and
temperature: as Al Gore said in his movie, the higher the CO2 level the hotter the
temperature. Obviously they don’t say the correlation is perfect, because there are also
other factors that influence temperature. But the central alarmist assertion is that CO2
levels are highly correlated with temperatures. In Gore’s movie it is the only reason
offered for blaming global warming on carbon emissions.
Correlation is not causation. If two things are correlated we don’t know which thing
caused the other, or even that neither caused the other but both are due to a third factor.
However a lack of correlation between CO2 and temperature would demonstrate that
there is no linear relationship between CO2 and temperature. A greater clue to a causal
connection is that both change trend direction at the same time or after a fixed delay.
Let’s consider three relevant time scales.
Firstly, on a time scale of tens of years, the correlation between CO2 and temperature
is middling. Temperatures and CO2 levels have been rising since before 1880; but
human emissions were not significant before 1940. The yearly rises in CO2 have been
steady, with no drops. During that time temperature trended up but moved in cycles of
about 30 years:
1882 – 1910 Cooling
1910 – 1944 Warming
1944 – 1975 Cooling (despite significant human emissions of CO2)
1975 – 2001 Warming
2001 – Cooling (despite increased human emissions of CO2)

10
Figure 3: Timescale: Tens of years. CO2 in blue and temperature in purple.
www.junkscience.com/MSU_Temps/NCDCanom1880.html
The temperature trends down and CO2 moves steadily up; the temperature trends up
and CO2 moves steadily up. No strong causal relationship here.
The correlation coefficient is middling, but that is simply because both CO2 and
temperature are generally increasing. Temperature correlates well with almost
anything that generally goes up in the twentieth century—for example, global
temperature correlates better with US postal charges than with atmospheric CO2 levels:
joannenova.com.au/2009/05/03/shock-global-temperatures-driven-by-us-postal-
charges/
Secondly, on a time scale of thousands of years the correlation between temperature
and CO2 is excellent, as illustrated by Gore in his movie with the old ice core data:
11
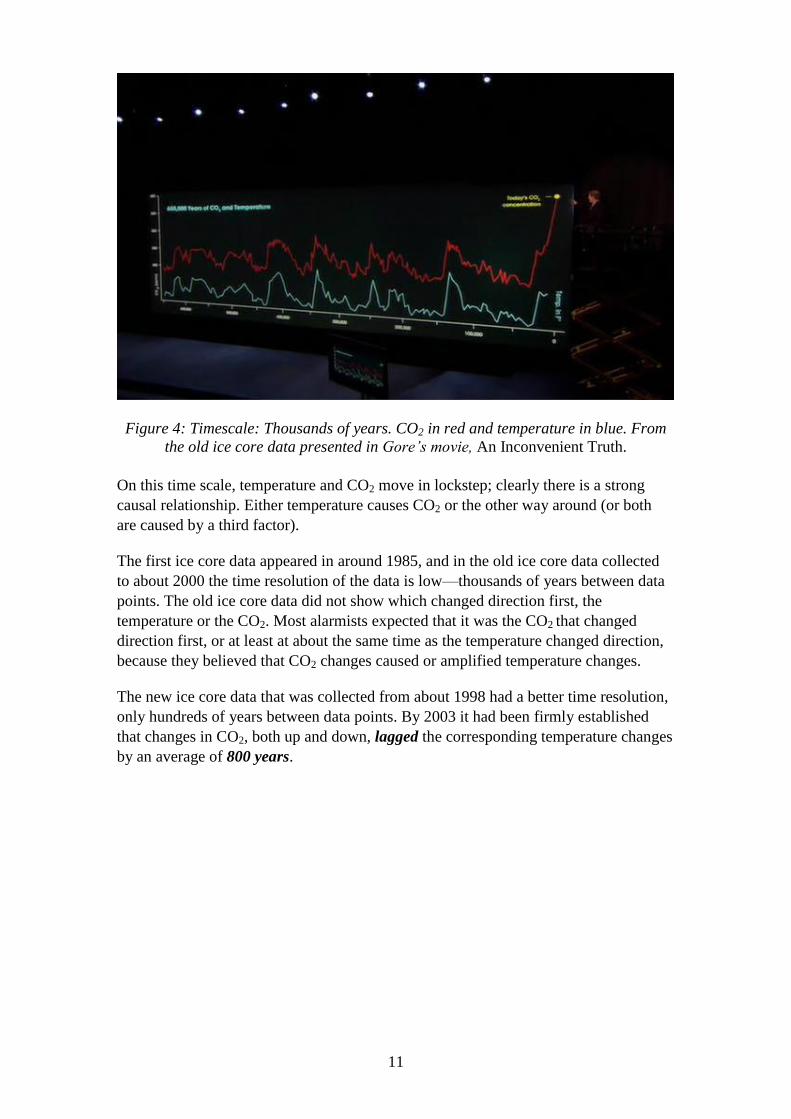
Figure 4: Timescale: Thousands of years. CO2 in red and temperature in blue. From
the old ice core data presented in Gore’s movie, An Inconvenient Truth.
On this time scale, temperature and CO2 move in lockstep; clearly there is a strong
causal relationship. Either temperature causes CO2 or the other way around (or both
are caused by a third factor).
The first ice core data appeared in around 1985, and in the old ice core data collected
to about 2000 the time resolution of the data is low—thousands of years between data
points. The old ice core data did not show which changed direction first, the
temperature or the CO2. Most alarmists expected that it was the CO2 that changed
direction first, or at least at about the same time as the temperature changed direction,
because they believed that CO2 changes caused or amplified temperature changes.
The new ice core data that was collected from about 1998 had a better time resolution,
only hundreds of years between data points. By 2003 it had been firmly established
that changes in CO2, both up and down, lagged the corresponding temperature changes
by an average of 800 years.

12
Figure 5. A close up of some new ice core data. Turns out that the changes in CO2 lag
the temperature changes by an average of 800 years, so the CO2 changes could not
have caused the corresponding temperature changes.
This was not what the alarmists expected (for example, New Scientist magazine in
1989 entitled a graph of ice core data ―Where carbon dioxide leads temperature
follows‖). They have basically kept quiet about the ice core data ever since. If the new
ice core had showed that CO2 changes preceded the corresponding temperature
changes then that would have been compelling evidence for the idea that rising CO2
levels were the main cause of global warming.
Because they follow the corresponding temperature changes by an average of 800
years, the CO2 changes cannot have caused the temperature changes. The correlation is
very strong, but the direction of causality is the wrong way around for the theory that
CO2 changes causes temperature changes. Obviously it is the other way around.
Temperature changes cause changes in CO2 levels, on a time scale of hundreds of
years or more. This is high school chemistry: the ocean contains huge amounts of
dissolved CO2, so the ocean supports a certain vapor pressure of CO2 in the air above
it. The higher the temperature of the liquid, the higher the vapor pressure (or ―partial
pressure‖) of the gas in the enclosed air above the liquid. So the higher the
temperature, and thus the warmer the ocean, the higher the level of atmospheric CO2.
The alarmists claim ―amplification‖, that rising temperatures caused rising CO2, but
then that rising CO2 in turn caused even higher temperatures. Since higher CO2 levels
cause some extra warming this is obviously true to some extent, but is the effect
significant or too small to matter? Obviously some force other than CO2 levels started
each warming episode in the past, and some force stronger than any amplified CO2
ended each warming episode. The alarmists claim evidence of amplification in some
cross correlations of CO2 to temperature, but closer examination shows they have just
found an aliasing artefact in the particular way they processed their data. Process the
data in any of many other ways and the artefact, and their ―evidence‖ for amplification,
disappears:
www.palisad.com/co2/slides/siframes.html

13
So any amplification is indeed too small to matter.
By the way, Gore’s movie was made in 2005, two years after it had been definitely
established that the CO2 changes occurred 800 years on average after the
corresponding temperature changes. Gore had scientific advisors and must have known
of that fact, but he did not mention it in his movie. Instead, his movie presented the old
ice core data as the only reason for believing that rising CO2 caused global warming:
―the higher the CO2 level the hotter the temperature‖. Imagine if he had told the whole
truth: that the temperature changes occurred 800 years before the cause he was
alleging. His movie would have been laughed at, and the public would not now be so
convinced of his explanation.
Thirdly, on a time scale of millions of years, the correlation is hardly compelling and
the turning points do not match up. Clearly larger forces are at play here.
Figure 6. Timescale: Millions of years. CO2 in black and temperature in blue.
www.geocraft.com/WVFossils/PageMill_Images/image277.gif
If the alarmists were correct in their assertion that CO2 levels governs temperature,
then there should be good correlations on all time scales between CO2 and temperature
and the turning points should match up. But the correlations are not strong, the turning
points don’t match, and the strong correlation in the ice cores is due to temperature
causing CO2, not the other way around.
So, correlations between temperature and CO2 are not evidence, even of a
circumstantial or indirect kind such as in the case of establishing the link between
smoking and lung cancer.

14
Finally, the correlations with temperature are much stronger for ocean oscillations and
cosmic rays than they are for CO2. Not that correlations demonstrate causation...
CO2 and Temperature Both Increased Over the Last Century
This ―evidence‖ is just a poor man’s correlation (see CO2 is Correlated with
Temperature, above). Here’s another explanation of why it is not evidence.
Figure 7: The big temperature picture, using the entire measured world temperature
record (which goes back to 1880). In 2009 we are at the red dot, where the green
arrow is pointing. Graph and insight from Dr Syun Akasofu (2009).
The global temperature has been rising at a steady trend rate of 0.5°C per century since
the end of the little ice age in the 1700s (when the Thames River would freeze over
every winter; the last time it froze over was 1804). On top of the trend are oscillations
that last about thirty years in each direction:
1882 – 1910 Cooling
1910 – 1944 Warming
1944 – 1975 Cooling
1975 – 2001 Warming
In 2009 the temperatures have leveled off for eight years. The pattern suggests that the
world has entered a period of slight cooling until about 2030.
There was a cooling scare in the early 1970s at the end of the last cooling phase. The
current global warming alarm is based on the last warming oscillation, from 1975 to
2001. The IPCC predictions simply extrapolate the last warming as if it would last
forever, a textbook case of alarmism. However the last warming period ended after the
usual thirty years or so, and the global temperature is now definitely tracking below
the IPCC predictions.

15
The alarmists blame human emissions of carbon dioxide for the last warming. But by
general consensus human emissions of carbon dioxide have only been large enough to
be significant since 1940—yet the warming trend was in place for well over a century
before that. And there was a cooling period from 1940 to 1975, despite human
emissions of carbon dioxide. And there has been no warming since 2001, despite
record human emissions of carbon dioxide.
No one knows for sure what caused the little ice age or for how many more centuries
the slow warming trend will continue. It has been warmer than the present for much of
the ten thousand years since the last big ice age: it was a little warmer for a few
centuries in the medieval warm period around 1100 (when Greenland was settled for
grazing) and also during the Roman-Climate Optimum at the time of the Roman
Empire (when grapes grew almost as far north as Scotland), and at least 1°C warmer
for much of the Holocene Climate Optimum (four to eight thousand years ago).
It Cannot Be Anything Else
Implicitly, and sometimes explicitly, the notion that CO2 caused global warming often
rested partly on the ―evidence‖ that ―it couldn’t be anything else‖.
This is illogical, because there could be forces at work that we aren’t aware of yet.
Obviously people have been unaware of phenomena before—for example, before 1800
there was little awareness of electricity, magnetism, nuclear forces, or germs.
But ridiculous as it may seem, this reason is actually a very important part of the
IPCC’s case. IPCC theory assumes that rising CO2 levels caused:
Nearly all the warming from the beginning of the industrial age (around 1750)
to the present.
Much of the warming in the warming episodes in the ice cores.
They justify this assumption on the grounds that they cannot think of any other causes!
This assumption has huge ramifications for the IPCC theory: their climate models are
calibrated so that the rise in CO2 from 1750 to the present causes all the warming from
1750 to the present in their models. (They also calibrated them on other episodes, such
as the ice core warmings, but this is the main one.) Thus if there were any other
warming forces between 1750 and the present, then the climate models are too
sensitive to CO2 rises.
This is why the alarmists so savagely dismiss any other possible causes for global
warming: if they admit there are other warming forces then they admit that their
models are invalid and too sensitive to CO2, and they admit that their predictions of
future temperature rises due to rising CO2 are too high.
But as shown in Figure 7 above, the temperature has been rising since the mid 1700s
as the earth came of the little ice age of the 1600s and 1700s.
It wasn’t any human activity that plunged the earth from the medieval warm
period into the little ice age, so the move out of the little ice age probably isn’t
due to humans either.

16
Human emissions of CO2 were virtually non-existent before 1850, and not
significant compared to current levels until after 1945 (see for example Figures
2 and 3 in www.oism.org/pproject/s33p36.htm). This begs the question: was
the rise in CO2 prior to 1945 mainly due to rising temperatures or to the tiny
human emissions? The level of CO2 in the atmosphere depends on ocean
temperature, because the atmospheric CO2 is in equilibrium with the dissolved
CO2 in the water: the vapor pressure of a gas in the air above a liquid with
dissolved gas increases with the temperature of the liquid. So the rises in CO2
level prior to 1945 might be mainly due to rising temperatures, just as they
were in the ice-core warming episodes.
As it happens, the little ice age coincides with a dearth of sunspots, and solar
activity rose from 1720 to a maximum in the late 1900s (see for example
en.wikipedia.org/wiki/File:Sunspot_Numbers.png). While the amount of light
from the sun (irradiance) has not changed enough to cause much of the
warming, perhaps some other feature associated with sunspots (such as the
sun’s magnetic field) affects the earth’s temperature. After all, the correlation
of sunspots with wheat prices was noticed centuries ago (sunspots affect wheat
growth and thus crop yield).
So the assumption that nearly all the warming from 1750 to the present is due to rising
CO2 levels is a brave one, and attributing it to human emissions of CO2 is especially
foolish.
So if the assumption that only CO2 could have caused the warming from 1750 has lead
to climate models that are too sensitive to CO2 rises, how does that exhibit itself in the
IPCC climate theory? Why, our old friend water vapor feedback again.
The forcings and no-feedbacks parts of the CO2 warming calculations are based on
empirical physics and are reasonably accurate (see CO2 is a Greenhouse Gas above).
So that only leaves the feedbacks part of the calculations. In order for their models to
show that the warming from 1750 is mainly due to the CO2 rises from 1750, the IPCC
climate theorists were required to assume that the climate system had a high positive
feedback. Some feedbacks were known, but they are all modest and could not account
for a high overall feedback. But the water vapor feedback was unknown, and it is hard
to even measure where water is in the atmosphere—it can be a gas (water vapor) or
liquid (clouds, rain), it moves around and between forms quickly.
So the water vapor feedback became the fudge factor that embodies the assumption
that the nearly all the temperature rise since 1750 is due to rising CO2 levels. From the
viewpoint of the alarmists, the water vapor feedback has to be a large positive
feedback, because it is the only possible mechanism to make the assumption possible.
Without a large positive water vapor feedback, the models cannot be made to
produce the observed temperature rises since 1750 mainly from the CO2 rises since
1750.
This is why the missing hotspot (sciencespeak.com/MissingSignature.pdf) is so
devastating to the alarmist case. Over the period 1995 – 2000 it became apparent from
observations that the predicted hotspot due to extra water vapor in the atmosphere did
not exist. So there was no water vapor feedback—the alarmist theory, the climate

17
models, and the assumption that rising CO2 caused nearly all the warming since 1750
are all invalid.
There are now several credible alternatives as possible causes of global warming. As
examples we mention just two here (they are not mutually exclusive, because they may
both be influenced by a third factor).
The Pacific Decadal Oscillation (PDO) is an ocean oscillation that seems to govern
much of the world’s climate, and seems to change direction every thirty years or so,
broadly in synch with the cycles of global warming and cooling. The correlation of the
PDO with global temperature is much higher than the correlation between CO2 and
temperature.
Cosmic rays probably assist in the formation of low clouds: if more cosmic rays hit the
earth then there are more low clouds. Low clouds cool the planet, because they reflect
more incoming energy as light than they trap as outgoing infrared. The sun shields us
from cosmic rays with its magnetic field, and sunspots are associated with a stronger
magnetic field from the sun (the earth’s magnetic field is too weak to have much effect
on cosmic rays). Cosmic ray theory says that the following are associated:
More sunspots
Stronger sun’s magnetic field
Fewer cosmic rays hitting the earth
Less formation of low clouds
Fewer low clouds
Higher global temperatures.
The correlation of the sun’s magnetic activity with our global temperature is
encouraging, and the trend turning points match well.
What Would Constitute Evidence?
There is good evidence to support the calculations of the warming caused by an
increase in atmospheric CO2, without the effect of the climate feedbacks. We are much
less certain about the total warming due to increasing CO2, which include the climate
feedbacks that amplify or dampen this no-feedbacks warming due to CO2. IPCC
climate theory assumes a strong positive, amplifying climate feedback, principally due
to water vapor. Therefore what would constitute evidence (that CO2 is the main cause
of the recent global warming) is either:
Evidence of overall strong positive feedback in the climate
Evidence of a strongly positive water vapor feedback.
For example, if the radiosondes had detected the strong hotspot predicted by the IPCC
climate models then that would have been strong evidence—but instead the observed
lack of hotspot demonstrates that the water vapor feedback is weak or negative.

18
Strong correlations and synchronized changes in trend directions between CO2 and
temperature on all time scales would constitute evidence, but we know that it is not the
case.
Otherwise we are looking for some new evidence from somewhere else.
Especially difficult for the CO2 theory is how to explain the counter evidence that is
accumulating, which shows that the feedbacks are dampening not amplifying and that
the climate sensitivity is a fraction of that assumed by the IPCC. It appears at this point
that the CO2 theory is doomed, and it is only a matter of time before its bubble bursts.