therapy-induced brain reorganization patterns in aphasia
TRANSCRIPT
Therapy-induced brain reorganization patternsin aphasia
Stefanie Abel,1,2,3,4 Cornelius Weiller,5 Walter Huber,4 Klaus Willmes1,4,6 andKarsten Specht7
Both hemispheres are engaged in recovery from word production deficits in aphasia. Lexical therapy has been shown to induce
brain reorganization even in patients with chronic aphasia. However, the interplay of factors influencing reorganization patterns
still remains unresolved. We were especially interested in the relation between lesion site, therapy-induced recovery, and beneficial
reorganization patterns. Thus, we applied intensive lexical therapy, which was evaluated with functional magnetic resonance
imaging, to 14 chronic patients with aphasic word retrieval deficits. In a group study, we aimed to illuminate brain reorganization
of the naming network in comparison with healthy controls. Moreover, we intended to analyse the data with joint independent
component analysis to relate lesion sites to therapy-induced brain reorganization, and to correlate resulting components with
therapy gain. As a result, we found peri-lesional and contralateral activations basically overlapping with premorbid naming
networks observed in healthy subjects. Reduced activation patterns for patients compared to controls before training comprised
damaged left hemisphere language areas, right precentral and superior temporal gyrus, as well as left caudate and anterior
cingulate cortex. There were decreasing activations of bilateral visuo-cognitive, articulatory, attention, and language areas due
to therapy, with stronger decreases for patients in right middle temporal gyrus/superior temporal sulcus, bilateral precuneus as well
as left anterior cingulate cortex and caudate. The joint independent component analysis revealed three components indexing lesion
subtypes that were associated with patient-specific recovery patterns. Activation decreases (i) of an extended frontal lesion discon-
necting language pathways occurred in left inferior frontal gyrus; (ii) of a small frontal lesion were found in bilateral inferior
frontal gyrus; and (iii) of a large temporo-parietal lesion occurred in bilateral inferior frontal gyrus and contralateral superior
temporal gyrus. All components revealed increases in prefrontal areas. One component was negatively correlated with therapy
gain. Therapy was associated exclusively with activation decreases, which could mainly be attributed to higher processing efficiency
within the naming network. In our joint independent component analysis, all three lesion patterns disclosed involved deactivation
of left inferior frontal gyrus. Moreover, we found evidence for increased demands on control processes. As expected, we saw partly
differential reorganization profiles depending on lesion patterns. There was no compensatory deactivation for the large left inferior
frontal lesion, with its less advantageous outcome probably being related to its disconnection from crucial language processing
pathways.
1 Department of Neurology, Section Neuropsychology, RWTH Aachen, Germany2 School of Psychological Sciences, Faculty of Medical and Human Sciences, University of Manchester, UK3 SRH University of Applied Sciences, Gera, Germany4 JARA-BRAIN, Aachen Juelich Research Alliance, Translational Brain Medicine, Germany5 Department of Neurology, University Medical Centre Freiburg, Germany6 Interdisciplinary Centre for Clinical Research, RWTH Aachen, Germany7 Department of Biological and Medical Psychology, University of Bergen, and Department of Clinical Engineering, Haukeland
University Hospital Bergen, Norway
Correspondence to: PD Dr. Stefanie Abel,
Neuroscience and Aphasia Research Unit (NARU),
School of Psychological Sciences,
doi:10.1093/brain/awv022 BRAIN 2015: Page 1 of 16 | 1
Received September 16, 2013. Revised December 10, 2014. Accepted December 11, 2014.
� The Author (2015). Published by Oxford University Press on behalf of the Guarantors of Brain. All rights reserved.
For Permissions, please email: [email protected]
Brain Advance Access published February 15, 2015by guest on F
ebruary 23, 2015D
ownloaded from

University of Manchester,
Brunswick Street, Manchester, M13 9PL, UK
E-mail: [email protected]
Keywords: aphasia; treatment; naming; functional MRI; joint Independent Component Analysis
Abbreviation: ICA = independent component analysis
IntroductionRecently, neural underpinnings of aphasia recovery in the
domain of word processing, with or without lexical ther-
apy, were investigated using functional brain imaging tech-
niques (for overviews, see Zahn et al., 2006; Crinion and
Leff, 2007; Crosson et al., 2007; Thompson and den
Ouden, 2008; Meinzer et al., 2011). Results did not
reveal homogeneous recovery patterns across all patients,
but several mechanisms underlying brain reorganization in
aphasia have been proposed. Thus, the two brain hemi-
spheres were shown to be engaged not only in word pro-
duction of healthy participants (Abel et al., 2011; Vigneau
et al., 2011) but also in the recovery of word production
deficits in aphasia (Crosson et al., 2007). The extent of
brain damage influences the recovery pattern: if left-
hemisphere damage is relatively restricted, reactivation
and compensation seem to occur mainly in peri-lesional
areas, resulting in relatively good recovery. The right hemi-
sphere appears to take over, if left hemisphere language
capacities have become insufficient, even though compensa-
tory capabilities of the former have been reported to be
restricted (Heiss and Thiel, 2006; Crosson et al., 2007).
Moreover, results indicate that brain areas involved in re-
covery (i) comprise right hemisphere areas homologue to
damaged language areas and/or peri-lesional left-sided
areas (Weiller et al., 1995; Musso et al., 1999;
Thompson and den Ouden, 2008); (ii) already had the po-
tential to subserve the language task before the stroke
occurred (normal or ‘redundant’ activation)—instead of a
takeover by unrelated brain areas (deviating or ‘vicarious’
activation) (Zahn et al., 2006); and (iii) be affected by dis-
tant brain damage (‘dynamic diaschisis’) (Price et al., 2001)
as well as by inhibitory influences due to ipsilateral and
contralateral connectivities (Heiss and Thiel, 2006).
However, the interplay of factors influencing aphasia re-
covery and associated patterns of brain reorganization still
remains largely unresolved. Especially the high variability
of extent and locus of brain lesions poses a major challenge
(Cappa, 2000; Crinion and Leff, 2007). Thus, studies on
therapy-induced recovery yielded equivocal findings on the
involvement and contribution of brain areas, so that fa-
vourable activation patterns for patient subgroups could
not be revealed, yet. In order to illuminate this issue,
larger patient groups and a detailed characterization of
brain damage and language performance are crucial
(Crinion and Leff, 2007). An approach that relates lesion
information from structural MRI with functional activation
data, namely joint independent component analysis (ICA)
(Calhoun et al., 2006; Specht et al., 2009), seems to be well
suited to shed light on the variability of patient lesions.
Specht et al. (2009) applied the joint ICA approach to
data from a PET study in aphasic patients that included a
lexical decision task. Results revealed patient-specific signal
changes in bilateral language areas that were not detectable
by standard group analyses. Compared with PET, the ac-
quisition of functional data using functional MRI has the
advantage of its non-invasive nature, its good availability in
clinical settings, and its inclusion of random and thereby
unpredictable events (event-related design) (Scott and Wise,
2003; Price, 2012).
Thus, we aimed to apply lexical therapy, which was
shown to be effective in a previous study (Abel et al.,
2007), to a group of 14 patients with aphasic word re-
trieval deficits after left-hemisphere stroke. We intended
to illuminate brain reorganization considering functional
MRI time-series of (I-a) recovered word production
before therapy in a picture naming task; (I-b) recovery
induced by therapy, as well as aphasic brain activations
in comparison to initial (II-a); and (II-b) repeated naming
in healthy controls. Moreover, (III) we analysed the entire
data set using joint ICA to reveal correlations between
brain lesions and pre-post functional MRI activations that
differed between patients and controls. We also examined
correlations between resulting joint ICA parameter esti-
mates and behavioural therapy gain.
We predicted peri-lesional activations and right hemi-
sphere activations homologue to pooled lesion sites before
therapy, signal changes in these bilateral naming networks
due to therapy, and patterns of brain reorganization de-
pendent on lesion localization. For the latter, we expected
to find patient subgroups and their favourable recovery
patterns.
Patients and methods
Patients
Inpatients of the aphasia ward at the University Clinic Aachenwere included if they presented naming disorders in thechronic phase (44 months) after a first-ever left-hemispherestroke. Severity of the naming disorder had to be at least mod-erate, unless there appeared to be urgent demand for treatmentof their milder naming disorder.
Exclusion criteria included presence of severe apraxia ofspeech or dysarthria, contraindications for functional MRI
2 | BRAIN 2015: Page 2 of 16 S. Abel et al.
by guest on February 23, 2015
Dow
nloaded from
examinations, or naming performance at a mastery levelduring pretesting (Supplementary material). The study wasapproved by the local ethics committee at the medical faculty(EK 124/05).
Overall study design
Pretesting for confrontation naming with depicted everydayobjects was first performed on a laptop (Test T1) and atleast 1 day later in the MRI-scanner (Test T2), leaving �1week to select a subset of items with low baseline performancein both pretests for the 4-week lexical therapy. Naming per-formance was assessed again in a post-test (Test T3) the weekafter therapy.
Behavioural tests and therapy
The material consisted of 132 black-and-white drawings fromthe Snodgrass and Vanderwart (1980) corpus. The completelist of items was presented for oral naming once per assess-ment inside as well as outside the scanner, and the subset of 60items was used for training during therapy. In the naming teston a laptop, participants had 10 s to overtly name each picturesuccessively presented via audio-visual presentation software(AVMP, 1997), which also does sound recordings of re-sponses. During therapy, patients were asked to name picturesfrom the training subset, which were consecutively presentedin a paper-pencil version. If the patient failed to produce thecorrect response, they were given increasing assistance accord-ing to a semantic or a phonological cueing- hierarchy(Supplementary material). A detailed description of diagnosisof the lexical impairment and the training procedures was pre-sented elsewhere (Abel et al., 2014).
Behavioural data analysis
Verbal responses to test items were rated according to a4-point scale ‘naming score’, with the score 3 representing aspontaneously correct response and the score 0 indicating in-appropriate wrong responses. Statistical analyses comprisedtests for dependent samples (within-item comparisons) to testthe null hypothesis that the difference in item scores is zero(Supplementary material). Therapy gain for each individualpatient was evaluated, subtracting the naming score for eachitem before training (Test T2) from the score after training(Test T3). Moreover, we manually assessed response times(latencies) for the first complete naming response of each item.
Event-related functional MRI design
Control subjects
Fourteen healthy volunteers, matched to the 14 patients forgender (four female, 10 male), age (median age 48 years,range 34–73 years), and handedness were recruited as controlsubjects. They performed the functional MRI experimenttwice, comparable to patient test times T2 and T3 (mean inter-vals: patients 5.3 weeks; controls 6.5 weeks). They did notundergo any study-related training during the interval. All 28participants gave their informed written consent to the study.
Stimuli and experimental design
Stimuli and task of the functional MRI paradigm were identi-cal to those of pretest T1, so that the first scan completed pre-testing and the second constituted the post-test. In the event-related experiment, each picture to be named was followed bya fixation cross after 1.2 s and a blank screen after another4.8 s, plus a random jitter (mean duration 2 s, range 1–3 s),allowing �8 s time for each naming attempt. Participantssaw the pictures via video goggles and their responses wereregistered and recorded (Supplementary material).
Data acquisition
A gradient echo planar T2* sequence for functional data and ahigh-resolution T1-weighted anatomical scan were acquired ona 3 T MRI-scanner (Philips Achieva) (Supplementary material).
Data analysis
The anatomical image was segmented into compartments ofgrey matter, white matter, and CSF, using the unified segmen-tation procedure (Ashburner and Friston, 2005; Crinion et al.,2007; Seghier et al., 2008). Normalization parameters wereestimated to be applied to the functional images later on.Functional images were further preprocessed using standardSPM8 analyses (Supplementary material).
At the second level, we performed (I-a) one-sample t-tests toinvestigate brain activations for picture naming (against impli-cit control) at pretest T2, as well as paired t-tests to compareactivations (against implicit control) (I-b) between pre- andpost-test (T2, T3) and between patients and their matchedcontrol subjects (II-a) at T2. We also (II-b) tested for an inter-action of group and activation change over time from Tests T2to T3.
The functional MRI-analyses were performed at a voxel-wiseintensity threshold of P50.01 uncorrected with an extentthreshold of k = 11 voxels. A Monte Carlo simulation with10 000 simulations revealed that this cluster extent cut-off pro-vided an experiment-wise threshold of P5 0.05 corrected formultiple comparisons (Slotnick et al., 2003). As Slotnick’ssimulations lead to relatively liberal thresholds, we also pro-vide critical cluster sizes from another program (AFNI3dClustSim, http://afni.nimh.nih.gov/afni/) in the Table le-gends. For each activation peak of the study, activationtables also provide information about the presumed cognitiveor language function subserved in healthy speakers, as takenfrom the literature. The behavioural analysis comprised theapplication of a noise cancellation tool (Cusack et al., 2005)to sound recordings of vocal responses, as well as the tran-scription and classification of naming responses (see‘Behavioural data analysis’ section).
Joint independent componentanalysis
Finally, we (III) performed analyses on the association betweenbrain lesions and patient-specific activation patterns pre-posttherapy, and we considered correlations of activations withtherapy gain.
Following the procedure described by Specht et al. (2009),the automatically segmented anatomical image (see data ana-lysis) was used as a starting point for lesion localization. Theresulting CSF maps are parameter maps, where voxel
Brain reorganization in aphasia BRAIN 2015: Page 3 of 16 | 3
by guest on February 23, 2015
Dow
nloaded from
intensities indicate the probability of CSF within the respectivevoxel. Therefore, these maps highlight the localization and ex-tension of a lesion more efficiently than the corresponding greyand white matter maps. Therefore, only the CSF maps werespatially normaliszed and finally smoothed with a Gaussiansmoothing kernel of 8 mm full-width at half-maximum.
In contrast to ICAs, which are used for analysing time seriesin functional MRI and electroencephalography data, a jointICA is a second-level analysis, resting on already processedparameter maps from different modalities, like segmentedMRI data and contrast maps from an functional MRI first-level analysis of time series. The underlying assumption in ajoint ICA is that these spatially independent sources are lin-early mixed (Calhoun et al., 2006; Specht et al., 2009). In ourstudy, for each subject a CSF map, taken as indicator for alesion, as well as an activation contrast map from the individ-ual functional MRI first-level analysis were entered into thejoint ICA. As it was the aim to detect associations betweenlesion localization and recovery patterns, only the differentialcontrast between Tests T2 and T3 was entered into the ana-lysis. Therefore, each individual subject contributed to the jointICA with two images, the CSF map and the contrast image.
The analysis was performed using the Fusion ICA Toolbox(http://mialab.mrn.org/software/fit/, version 1.2c). For the jointICA, the voxel intensities of the two modalities were normal-ized across all subjects and for each modality separately, suchthat both modalities had the same sum-of-squares. Using theminimum description length algorithm as implemented in theFusion ICA Toolbox, the number of independent componentsto be derived was set to seven, and the infomax algorithm wasused to decompose the data into independent componentimages and subject-specific mixing parameters(Supplementary material).
To identify relevant components, the resulting componentswere sorted with respect to their difference in the subject-spe-cific mixing parameter between control and patient group.Only those components showing a significant group differencein the mixing parameter (component loadings) at P50.05were considered. The corresponding joint component mapsfor CSF and for the functional activation contrasts were recon-structed into 3D images, z-scaled, and restrained by a brainmask. The reconstructed components were displayed with athreshold of z43.09. For cross validation, the mixing param-eters were entered as predictors in a linear regression analysis(Supplementary material).
We also performed joint ICAs for the subset of trainedcompared to untrained items over time (for details, seeSupplementary material), as previously presented for thegeneral linear model analysis (Abel et al., 2014).
Results
Patients
Twenty-three patients were considered for inclusion into
the functional MRI therapy study. However, nine patients
were excluded after pretesting either because of naming
performance close to ceiling (n = 4), scanner artefacts
(n = 2), or technical problems (n = 3). Fourteen right--
handed patients with chronic aphasia (median time post-
onset: 41 months) completed the therapy study
(Supplementary Table 1).
Behavioural analysis: therapy gainand response times
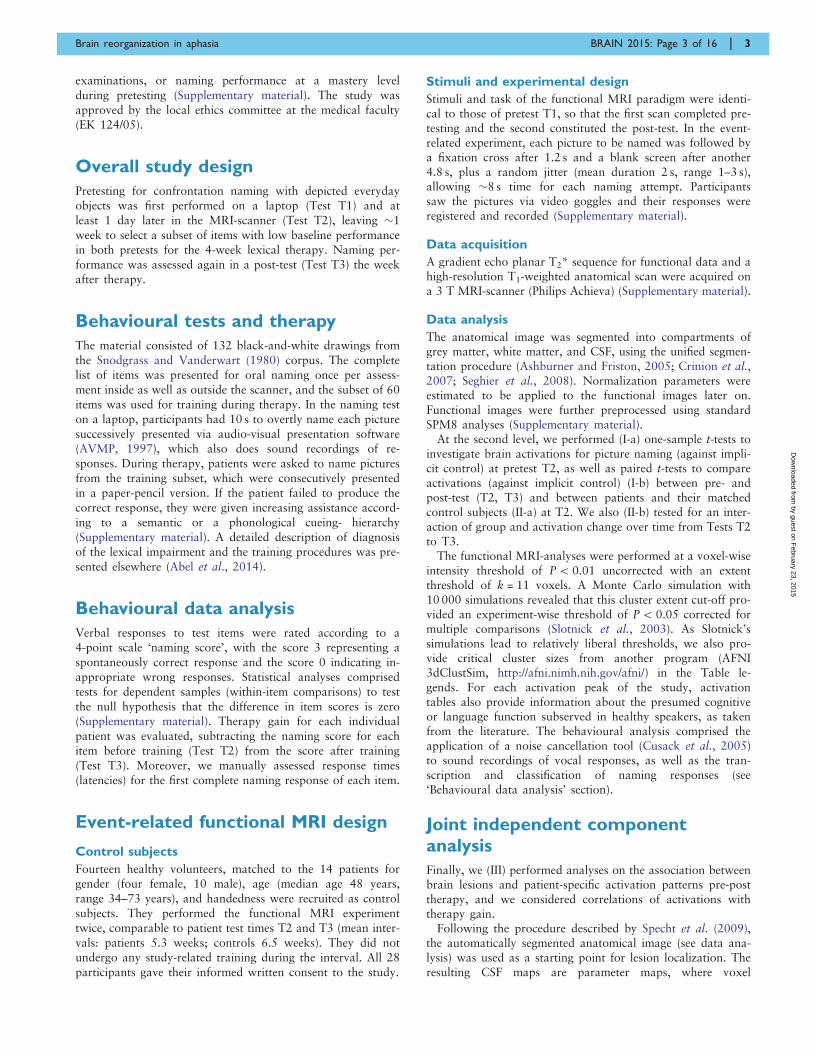
Nine of the 14 patients revealed significantly improved
naming in the MRI scanner (Fig. 1). For the patient
group, therapy gain in the total naming score was highly
significant (group analysis, Wilcoxon signed-ranks test and
t-test, Tests T3–T2, one-tailed, P5 0.001). Contrarily, the
group of healthy controls already performed at ceiling
during first testing and their naming performance remained
perfectly stable at second testing (all statistical tests at one-
tailed P4 0.10) (Supplementary material).
Considering naming response times for the group of
patients (Table 1), mean response times at Test T2 were
significantly longer than those of Test T3 (paired t-test,
one-tailed, P5 0.008).
General linear model analysis
Lesions and recovered naming network
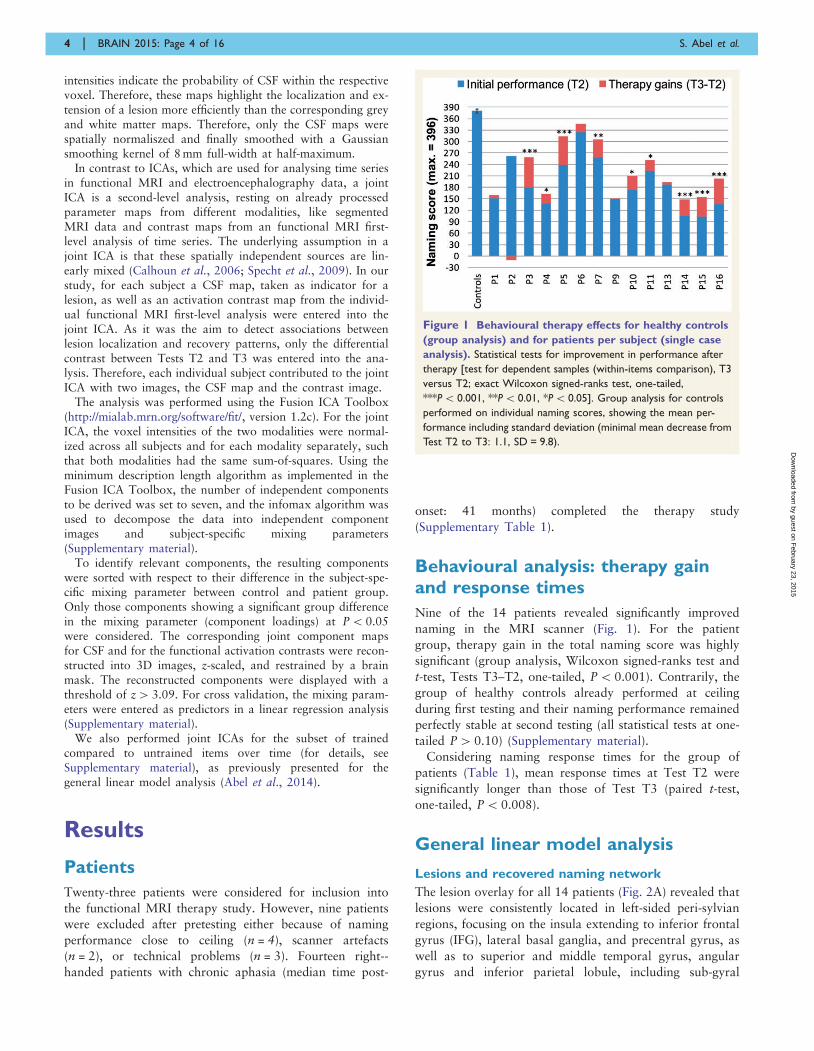
The lesion overlay for all 14 patients (Fig. 2A) revealed that
lesions were consistently located in left-sided peri-sylvian
regions, focusing on the insula extending to inferior frontal
gyrus (IFG), lateral basal ganglia, and precentral gyrus, as
well as to superior and middle temporal gyrus, angular
gyrus and inferior parietal lobule, including sub-gyral
Figure 1 Behavioural therapy effects for healthy controls
(group analysis) and for patients per subject (single case
analysis). Statistical tests for improvement in performance after
therapy [test for dependent samples (within-items comparison), T3
versus T2; exact Wilcoxon signed-ranks test, one-tailed,
***P5 0.001, **P5 0.01, *P5 0.05]. Group analysis for controls
performed on individual naming scores, showing the mean per-
formance including standard deviation (minimal mean decrease from
Test T2 to T3: 1.1, SD = 9.8).
4 | BRAIN 2015: Page 4 of 16 S. Abel et al.
by guest on February 23, 2015
Dow
nloaded from

white matter, and rarely extending to adjacent areas com-
prising supplementary motor area and precuneus. Medial
areas like anterior cingulate gyrus (ACC), caudate, thal-
amus, and the hippocampal area were spared.
Figure 2B presents previously recovered naming networks
of aphasic patients, i.e. brain activations for picture naming
before the training had started. Activations were absent in
lesioned peri-sylvian regions (as shown in Fig. 1A). But
there were also left peri-lesional activations, i.e. activation
increases around the pooled lesion sites for the group. The
highest activation peak was found in left fusiform gyrus.
Some activation extended to left cuneus and precuneus,
posterior cingulate, a sub-gyral area medial to IFG pars
triangularis [Brodmann area (BA) 45], and supplementary
motor area proper; however, activations widely and pre-
dominantly extended to the right, including cuneus and
further visual areas, fusiform gyrus, lingual/parahippocam-
pal gyrus, superior parietal lobule, pre-supplementary
motor area, precentral gyrus/rolandic operculum, and
insula/IFG (Table 2).
Therapy-induced recovery
Comparing pre- to post-training naming activation (con-
trast I-b), we found activation decreases due to training—
but no increase—involving right middle temporal gyrus/su-
perior temporal sulcus, thalamus, hippocampus, paracen-
tral lobule, and posterior cingulate, bilateral cerebellum,
precuneus, mid-cingulate, and supplementary motor area,
as well as left IFG pars triangularis (BA 44/45), middle/
medial frontal gyrus, pre- and postcentral gyrus, and infer-
ior parietal lobule (BA 40) (Fig. 2C and Table 2).
Comparison between patients and controls
The comparison between patients and healthy speakers re-
vealed (II-a1) that there was more activation before training
at Test T2 for controls in the left-sided naming network
damaged in patients (peak: left superior temporal gyrus)
and in further areas involving right superior temporal
gyrus, precentral gyrus, and insula (Fig. 2D). Left postcentral
gyrus, rolandic operculum, posterior ACC and mid-cingulate
gyrus, thalamus, and caudate were less activated for patients
as well. Visual inspection in comparison with the lesion map
revealed some left hemisphere areas with less activation in
patients despite preservation of respective brain tissue, espe-
cially in left cingulate areas and caudate. Conversely, (II-a2)
there was a small activation spot for patients in right pre-
cuneus (BA 7) (k = 18) (Table 3).
Moreover, (II-b) the interaction between subject group
and time (patients versus healthy speakers at T2 versus
T3) revealed that due to therapy, there was a significant
decrease specific to patients in left posterior ACC and caud-
ate, in right middle temporal gyrus/superior temporal
sulcus, thalamus, hippocampus, and posterior cingulate
cortex, as well as in bilateral precuneus (Table 3 and
Fig. 3A). The plot of significant activation contrast esti-
mates (Fig. 3B) illustrates that for healthy participants,
there was even an increase in left ACC, but there was no
pre-post decrease for control subjects and an increase in a
cluster of 77 voxels comprising left ACC and caudate in-
stead (Supplementary Table 2 and Supplementary Fig. 1).
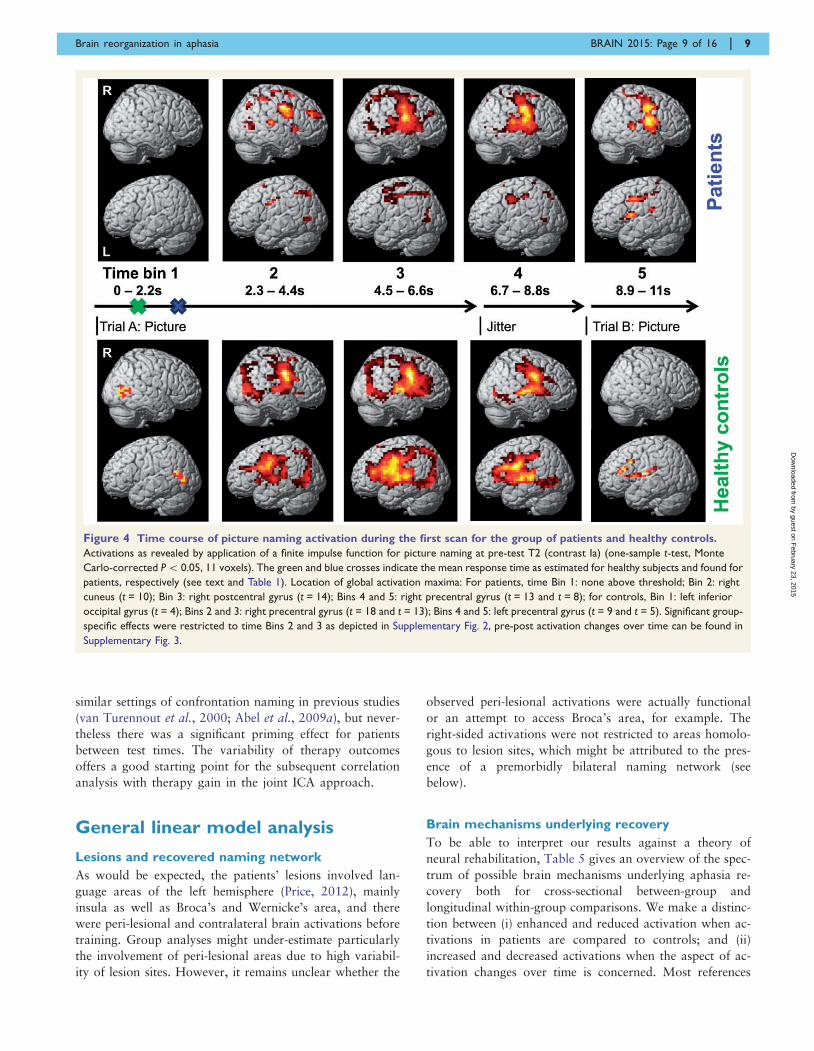
We additionally applied the finite impulse response basis
set to estimate the responses at five time points following
the picture stimulus for patients and controls to detect pos-
sible deviations from the haemodynamic response function
for the former group (Bonakdarpour et al., 2007). The time
course of naming (Fig. 4) reveals that were is no systematic
difference in extent or strength of brain activations between
both groups (see Supplementary material for details and
further analyses).
Specific therapy-induced recovery injoint ICA
Using joint ICA, three (out of seven retained) components
were identified (Fig. 5), which showed a significant group
difference in the subject-specific mixing parameter, of
which two components were also significant after correc-
tion for multiple comparisons. The first component (C4,
group difference P50.001) demonstrated an association
between a large lesion in left IFG and adjacent subcortical
areas, including basal ganglia, and functional recovery, as
reflected by decreased peri-lesional activation within IFG
pars triangularis (BA 45), as well as bilaterally decreased
activation within superior frontal (BA 9) and calcarine gyri.
At the same time, increased activation was found within
right orbito-medial prefrontal cortex (BA 11) and left thal-
amus. In addition, the individual component loadings cor-
related negatively with therapy gain (r = �0.560;
P5 0.037) (Table 4).
The second component (C7, group difference P50.004)
demonstrated that patients with lesions covering the pos-
terior and middle part of the temporal lobe and sparing the
inferior temporal gyrus showed decreased activations
within bilateral IFG pars orbitalis and middle occipital
gyrus, right superior temporal gyrus, and left superior fron-
tal gyrus. Corresponding increased activation was found in
Table 1 Naming latencies for the group of 14 patients
n Mean
(SD)
at T2
Mean
(SD)
at T3
Responses both at T2 and T3 1118 1896 (1363) 1781 (1193)**
Mean naming response times and standard deviations (SD) (in ms) of first naming
responses, taken from items rateable both at T2 and T3. A paired t-test was performed
(**P5 0.01, one-tailed), in order to detect significant reductions in response times (i.e.
priming). For comparison, latencies for picture naming in healthy speakers as taken
from previous study are 751 (18) ms (Abel et al., 2009), 789 (111) ms in the literature
(van Turennout et al., 2000), with the typical naming latency estimated at 600 ms in the
review by Indefrey and Levelt (2004). If paired t-test and SD measures are performed
on the basis of individual response times of each subject, the difference is not significant
any more [mean response time in ms, 2077 (SD 790) at T2 versus 1920 (SD 450) at T3,
P = 0.923].
Brain reorganization in aphasia BRAIN 2015: Page 5 of 16 | 5
by guest on February 23, 2015
Dow
nloaded from
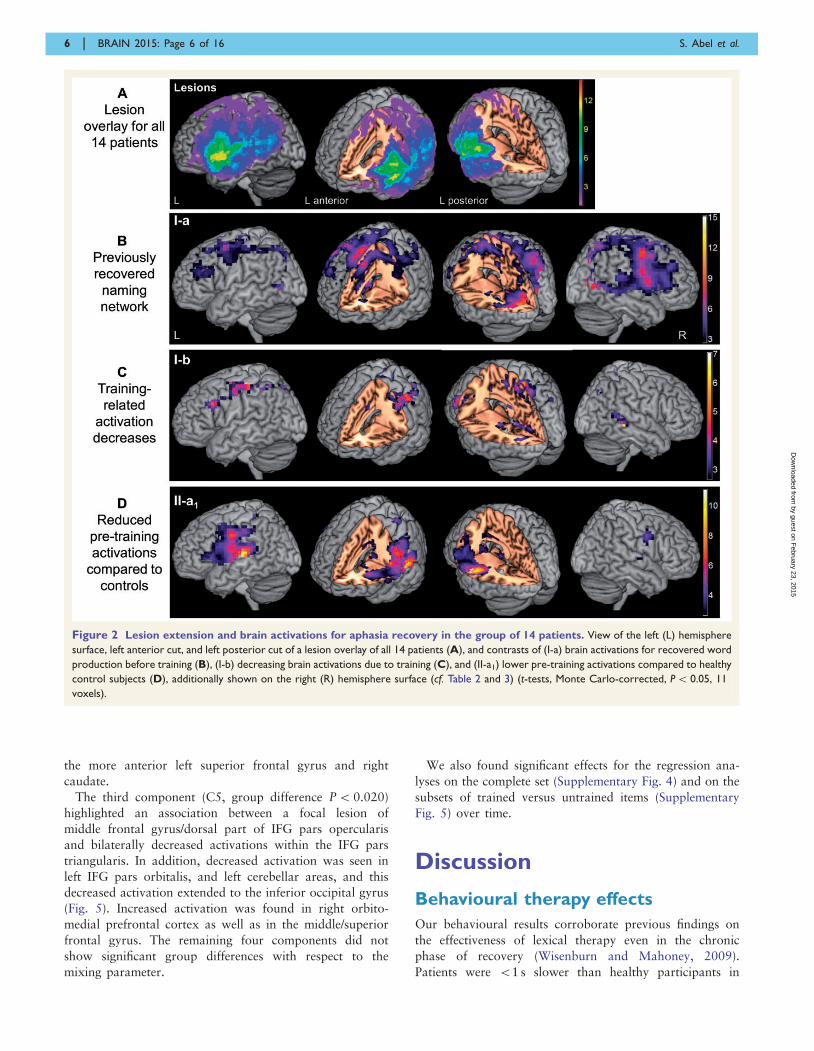
the more anterior left superior frontal gyrus and right
caudate.
The third component (C5, group difference P5 0.020)
highlighted an association between a focal lesion of
middle frontal gyrus/dorsal part of IFG pars opercularis
and bilaterally decreased activations within the IFG pars
triangularis. In addition, decreased activation was seen in
left IFG pars orbitalis, and left cerebellar areas, and this
decreased activation extended to the inferior occipital gyrus
(Fig. 5). Increased activation was found in right orbito-
medial prefrontal cortex as well as in the middle/superior
frontal gyrus. The remaining four components did not
show significant group differences with respect to the
mixing parameter.
We also found significant effects for the regression ana-
lyses on the complete set (Supplementary Fig. 4) and on the
subsets of trained versus untrained items (Supplementary
Fig. 5) over time.
Discussion
Behavioural therapy effects
Our behavioural results corroborate previous findings on
the effectiveness of lexical therapy even in the chronic
phase of recovery (Wisenburn and Mahoney, 2009).
Patients were 51 s slower than healthy participants in
Figure 2 Lesion extension and brain activations for aphasia recovery in the group of 14 patients. View of the left (L) hemisphere
surface, left anterior cut, and left posterior cut of a lesion overlay of all 14 patients (A), and contrasts of (I-a) brain activations for recovered word
production before training (B), (I-b) decreasing brain activations due to training (C), and (II-a1) lower pre-training activations compared to healthy
control subjects (D), additionally shown on the right (R) hemisphere surface (cf. Table 2 and 3) (t-tests, Monte Carlo-corrected, P5 0.05, 11
voxels).
6 | BRAIN 2015: Page 6 of 16 S. Abel et al.
by guest on February 23, 2015
Dow
nloaded from
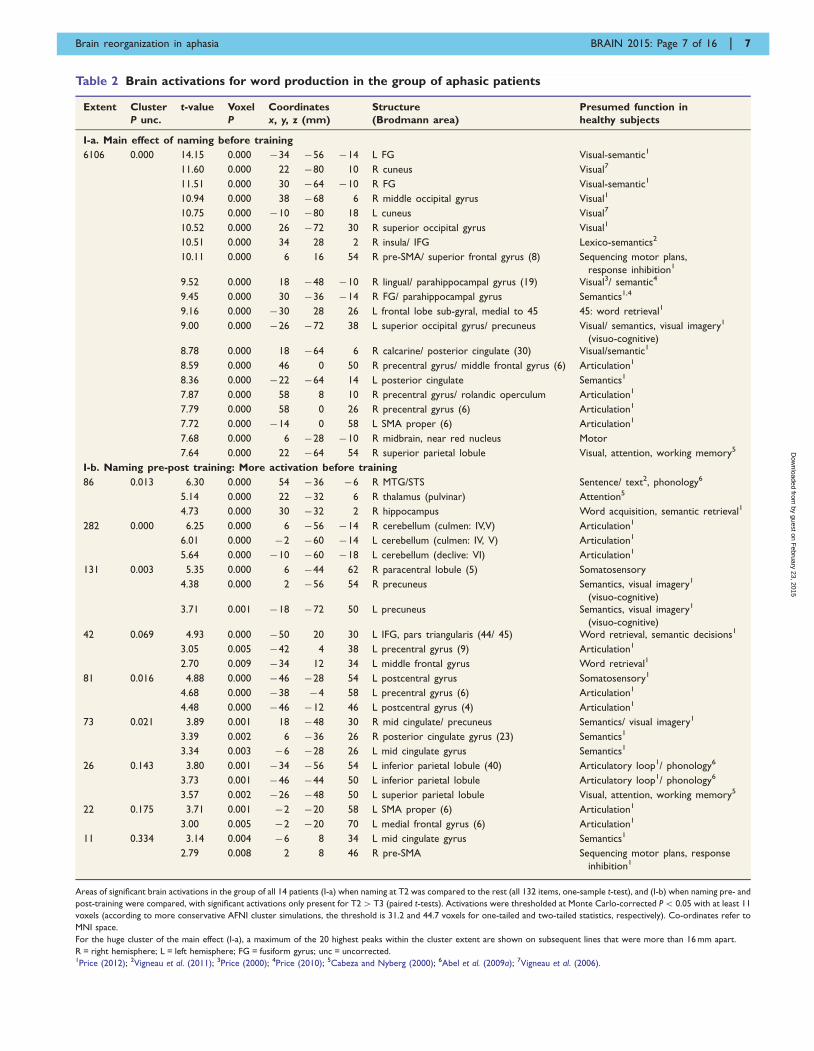
Table 2 Brain activations for word production in the group of aphasic patients
Extent Cluster
P unc.
t-value Voxel
P
Coordinates
x, y, z (mm)
Structure
(Brodmann area)
Presumed function in
healthy subjects
I-a. Main effect of naming before training
6106 0.000 14.15 0.000 �34 �56 �14 L FG Visual-semantic1
11.60 0.000 22 �80 10 R cuneus Visual7
11.51 0.000 30 �64 �10 R FG Visual-semantic1
10.94 0.000 38 �68 6 R middle occipital gyrus Visual1
10.75 0.000 �10 �80 18 L cuneus Visual7
10.52 0.000 26 �72 30 R superior occipital gyrus Visual1
10.51 0.000 34 28 2 R insula/ IFG Lexico-semantics2
10.11 0.000 6 16 54 R pre-SMA/ superior frontal gyrus (8) Sequencing motor plans,
response inhibition1
9.52 0.000 18 �48 �10 R lingual/ parahippocampal gyrus (19) Visual3/ semantic4
9.45 0.000 30 �36 �14 R FG/ parahippocampal gyrus Semantics1,4
9.16 0.000 �30 28 26 L frontal lobe sub-gyral, medial to 45 45: word retrieval1
9.00 0.000 �26 �72 38 L superior occipital gyrus/ precuneus Visual/ semantics, visual imagery1
(visuo-cognitive)8.78 0.000 18 �64 6 R calcarine/ posterior cingulate (30) Visual/semantic1
8.59 0.000 46 0 50 R precentral gyrus/ middle frontal gyrus (6) Articulation1
8.36 0.000 �22 �64 14 L posterior cingulate Semantics1
7.87 0.000 58 8 10 R precentral gyrus/ rolandic operculum Articulation1
7.79 0.000 58 0 26 R precentral gyrus (6) Articulation1
7.72 0.000 �14 0 58 L SMA proper (6) Articulation1
7.68 0.000 6 �28 �10 R midbrain, near red nucleus Motor
7.64 0.000 22 �64 54 R superior parietal lobule Visual, attention, working memory5
I-b. Naming pre-post training: More activation before training
86 0.013 6.30 0.000 54 �36 �6 R MTG/STS Sentence/ text2, phonology6
5.14 0.000 22 �32 6 R thalamus (pulvinar) Attention5
4.73 0.000 30 �32 2 R hippocampus Word acquisition, semantic retrieval1
282 0.000 6.25 0.000 6 �56 �14 R cerebellum (culmen: IV,V) Articulation1
6.01 0.000 �2 �60 �14 L cerebellum (culmen: IV, V) Articulation1
5.64 0.000 �10 �60 �18 L cerebellum (declive: VI) Articulation1
131 0.003 5.35 0.000 6 �44 62 R paracentral lobule (5) Somatosensory
4.38 0.000 2 �56 54 R precuneus Semantics, visual imagery1
(visuo-cognitive)3.71 0.001 �18 �72 50 L precuneus Semantics, visual imagery1
(visuo-cognitive)42 0.069 4.93 0.000 �50 20 30 L IFG, pars triangularis (44/ 45) Word retrieval, semantic decisions1
3.05 0.005 �42 4 38 L precentral gyrus (9) Articulation1
2.70 0.009 �34 12 34 L middle frontal gyrus Word retrieval1
81 0.016 4.88 0.000 �46 �28 54 L postcentral gyrus Somatosensory1
4.68 0.000 �38 �4 58 L precentral gyrus (6) Articulation1
4.48 0.000 �46 �12 46 L postcentral gyrus (4) Articulation1
73 0.021 3.89 0.001 18 �48 30 R mid cingulate/ precuneus Semantics/ visual imagery1
3.39 0.002 6 �36 26 R posterior cingulate gyrus (23) Semantics1
3.34 0.003 �6 �28 26 L mid cingulate gyrus Semantics1
26 0.143 3.80 0.001 �34 �56 54 L inferior parietal lobule (40) Articulatory loop1/ phonology6
3.73 0.001 �46 �44 50 L inferior parietal lobule Articulatory loop1/ phonology6
3.57 0.002 �26 �48 50 L superior parietal lobule Visual, attention, working memory5
22 0.175 3.71 0.001 �2 �20 58 L SMA proper (6) Articulation1
3.00 0.005 �2 �20 70 L medial frontal gyrus (6) Articulation1
11 0.334 3.14 0.004 �6 8 34 L mid cingulate gyrus Semantics1
2.79 0.008 2 8 46 R pre-SMA Sequencing motor plans, response
inhibition1
Areas of significant brain activations in the group of all 14 patients (I-a) when naming at T2 was compared to the rest (all 132 items, one-sample t-test), and (I-b) when naming pre- and
post-training were compared, with significant activations only present for T24T3 (paired t-tests). Activations were thresholded at Monte Carlo-corrected P5 0.05 with at least 11
voxels (according to more conservative AFNI cluster simulations, the threshold is 31.2 and 44.7 voxels for one-tailed and two-tailed statistics, respectively). Co-ordinates refer to
MNI space.
For the huge cluster of the main effect (I-a), a maximum of the 20 highest peaks within the cluster extent are shown on subsequent lines that were more than 16 mm apart.
R = right hemisphere; L = left hemisphere; FG = fusiform gyrus; unc = uncorrected.1Price (2012); 2Vigneau et al. (2011); 3Price (2000); 4Price (2010); 5Cabeza and Nyberg (2000); 6Abel et al. (2009a); 7Vigneau et al. (2006).
Brain reorganization in aphasia BRAIN 2015: Page 7 of 16 | 7
by guest on February 23, 2015
Dow
nloaded from
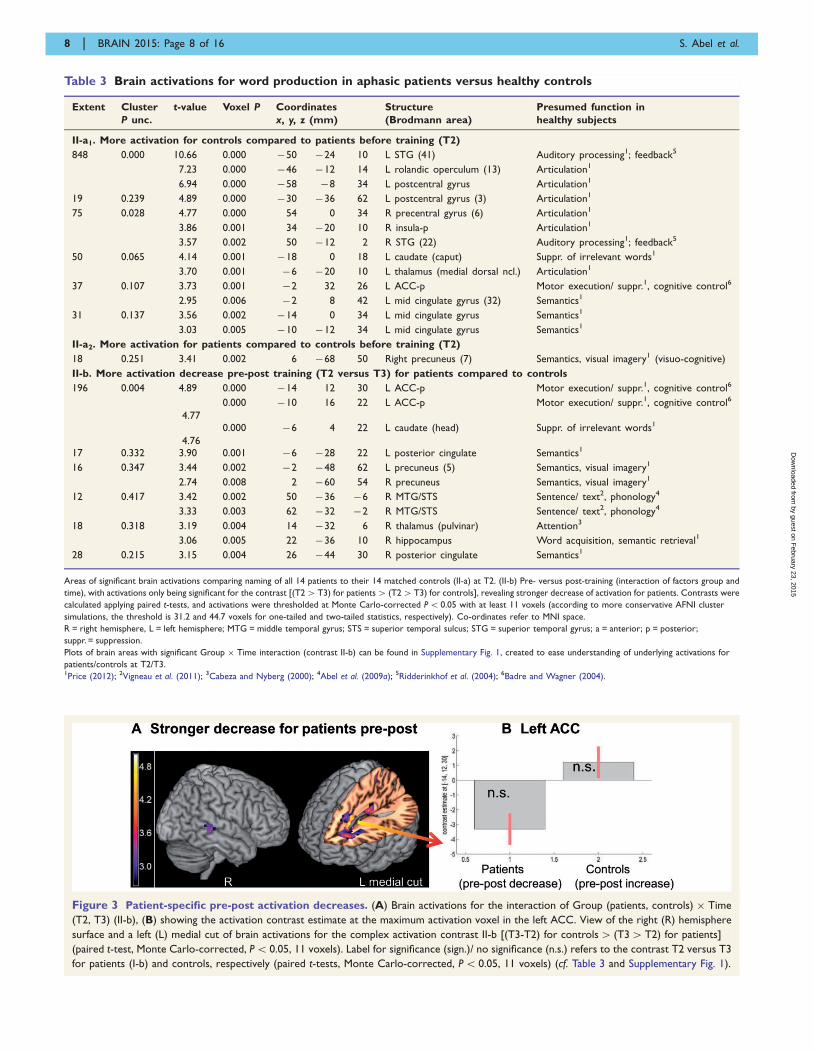
Table 3 Brain activations for word production in aphasic patients versus healthy controls
Extent Cluster
P unc.
t-value Voxel P Coordinates
x, y, z (mm)
Structure
(Brodmann area)
Presumed function in
healthy subjects
II-a1. More activation for controls compared to patients before training (T2)
848 0.000 10.66 0.000 �50 �24 10 L STG (41) Auditory processing1; feedback5
7.23 0.000 �46 �12 14 L rolandic operculum (13) Articulation1
6.94 0.000 �58 �8 34 L postcentral gyrus Articulation1
19 0.239 4.89 0.000 �30 �36 62 L postcentral gyrus (3) Articulation1
75 0.028 4.77 0.000 54 0 34 R precentral gyrus (6) Articulation1
3.86 0.001 34 �20 10 R insula-p Articulation1
3.57 0.002 50 �12 2 R STG (22) Auditory processing1; feedback5
50 0.065 4.14 0.001 �18 0 18 L caudate (caput) Suppr. of irrelevant words1
3.70 0.001 �6 �20 10 L thalamus (medial dorsal ncl.) Articulation1
37 0.107 3.73 0.001 �2 32 26 L ACC-p Motor execution/ suppr.1, cognitive control6
2.95 0.006 �2 8 42 L mid cingulate gyrus (32) Semantics1
31 0.137 3.56 0.002 �14 0 34 L mid cingulate gyrus Semantics1
3.03 0.005 �10 �12 34 L mid cingulate gyrus Semantics1
II-a2. More activation for patients compared to controls before training (T2)
18 0.251 3.41 0.002 6 �68 50 Right precuneus (7) Semantics, visual imagery1 (visuo-cognitive)
II-b. More activation decrease pre-post training (T2 versus T3) for patients compared to controls
196 0.004 4.89 0.000 �14 12 30 L ACC-p Motor execution/ suppr.1, cognitive control6
4.77
0.000 �10 16 22 L ACC-p Motor execution/ suppr.1, cognitive control6
4.76
0.000 �6 4 22 L caudate (head) Suppr. of irrelevant words1
17 0.332 3.90 0.001 �6 �28 22 L posterior cingulate Semantics1
16 0.347 3.44 0.002 �2 �48 62 L precuneus (5) Semantics, visual imagery1
2.74 0.008 2 �60 54 R precuneus Semantics, visual imagery1
12 0.417 3.42 0.002 50 �36 �6 R MTG/STS Sentence/ text2, phonology4
3.33 0.003 62 �32 �2 R MTG/STS Sentence/ text2, phonology4
18 0.318 3.19 0.004 14 �32 6 R thalamus (pulvinar) Attention3
3.06 0.005 22 �36 10 R hippocampus Word acquisition, semantic retrieval1
28 0.215 3.15 0.004 26 �44 30 R posterior cingulate Semantics1
Areas of significant brain activations comparing naming of all 14 patients to their 14 matched controls (II-a) at T2. (II-b) Pre- versus post-training (interaction of factors group and
time), with activations only being significant for the contrast [(T24T3) for patients4 (T24T3) for controls], revealing stronger decrease of activation for patients. Contrasts were
calculated applying paired t-tests, and activations were thresholded at Monte Carlo-corrected P5 0.05 with at least 11 voxels (according to more conservative AFNI cluster
simulations, the threshold is 31.2 and 44.7 voxels for one-tailed and two-tailed statistics, respectively). Co-ordinates refer to MNI space.
R = right hemisphere, L = left hemisphere; MTG = middle temporal gyrus; STS = superior temporal sulcus; STG = superior temporal gyrus; a = anterior; p = posterior;
suppr. = suppression.
Plots of brain areas with significant Group � Time interaction (contrast II-b) can be found in Supplementary Fig. 1, created to ease understanding of underlying activations for
patients/controls at T2/T3.1Price (2012); 2Vigneau et al. (2011); 3Cabeza and Nyberg (2000); 4Abel et al. (2009a); 5Ridderinkhof et al. (2004); 6Badre and Wagner (2004).
Figure 3 Patient-specific pre-post activation decreases. (A) Brain activations for the interaction of Group (patients, controls) � Time
(T2, T3) (II-b), (B) showing the activation contrast estimate at the maximum activation voxel in the left ACC. View of the right (R) hemisphere
surface and a left (L) medial cut of brain activations for the complex activation contrast II-b [(T3-T2) for controls4 (T34T2) for patients]
(paired t-test, Monte Carlo-corrected, P5 0.05, 11 voxels). Label for significance (sign.)/ no significance (n.s.) refers to the contrast T2 versus T3
for patients (I-b) and controls, respectively (paired t-tests, Monte Carlo-corrected, P5 0.05, 11 voxels) (cf. Table 3 and Supplementary Fig. 1).
8 | BRAIN 2015: Page 8 of 16 S. Abel et al.
by guest on February 23, 2015
Dow
nloaded from
similar settings of confrontation naming in previous studies
(van Turennout et al., 2000; Abel et al., 2009a), but never-
theless there was a significant priming effect for patients
between test times. The variability of therapy outcomes
offers a good starting point for the subsequent correlation
analysis with therapy gain in the joint ICA approach.
General linear model analysis
Lesions and recovered naming network
As would be expected, the patients’ lesions involved lan-
guage areas of the left hemisphere (Price, 2012), mainly
insula as well as Broca’s and Wernicke’s area, and there
were peri-lesional and contralateral brain activations before
training. Group analyses might under-estimate particularly
the involvement of peri-lesional areas due to high variabil-
ity of lesion sites. However, it remains unclear whether the
observed peri-lesional activations were actually functional
or an attempt to access Broca’s area, for example. The
right-sided activations were not restricted to areas homolo-
gous to lesion sites, which might be attributed to the pres-
ence of a premorbidly bilateral naming network (see
below).
Brain mechanisms underlying recovery
To be able to interpret our results against a theory of
neural rehabilitation, Table 5 gives an overview of the spec-
trum of possible brain mechanisms underlying aphasia re-
covery both for cross-sectional between-group and
longitudinal within-group comparisons. We make a distinc-
tion between (i) enhanced and reduced activation when ac-
tivations in patients are compared to controls; and (ii)
increased and decreased activations when the aspect of ac-
tivation changes over time is concerned. Most references
Figure 4 Time course of picture naming activation during the first scan for the group of patients and healthy controls.
Activations as revealed by application of a finite impulse function for picture naming at pre-test T2 (contrast Ia) (one-sample t-test, Monte
Carlo-corrected P5 0.05, 11 voxels). The green and blue crosses indicate the mean response time as estimated for healthy subjects and found for
patients, respectively (see text and Table 1). Location of global activation maxima: For patients, time Bin 1: none above threshold; Bin 2: right
cuneus (t = 10); Bin 3: right postcentral gyrus (t = 14); Bins 4 and 5: right precentral gyrus (t = 13 and t = 8); for controls, Bin 1: left inferior
occipital gyrus (t = 4); Bins 2 and 3: right precentral gyrus (t = 18 and t = 13); Bins 4 and 5: left precentral gyrus (t = 9 and t = 5). Significant group-
specific effects were restricted to time Bins 2 and 3 as depicted in Supplementary Fig. 2, pre-post activation changes over time can be found in
Supplementary Fig. 3.
Brain reorganization in aphasia BRAIN 2015: Page 9 of 16 | 9
by guest on February 23, 2015
Dow
nloaded from

are given alongside the discussion of our data in the re-
mainder of the article.
Strong activation in patients might be associated with
enhanced/increased demands in the short run, as well as
rewiring in the long run, i.e. growth and strengthening of
connectivities and re-routing. The application and build-up
of new strategies in non-language areas as well as the
impact of recognition and familiarity can be assigned to
these mechanisms. Moreover, the task may require more
effort in areas subserving executive control processes.
Maladaption, on the other hand, has been reported to
occur in right IFG pars triangularis (Naeser et al., 2011);
however, right hemisphere involvement including IFG pars
opercularis after therapy has been shown to be favourable
(Crosson et al., 2007).
On the contrary, activation decrease due to therapy has
been linked to more efficient processing of tasks involving
priming and learning in healthy participants (Henson,
2003; Horner and Henson, 2008; Abel et al., 2012a). In
aphasic patients, activation decrease has been associated
with higher efficiency due to therapy (Breier et al., 2007;
Richter et al., 2008). However, reduced and decreased ac-
tivation might also be related to (persistent) malfunctioning
due to the left-hemisphere brain damage itself, disconnec-
tion, or missing inputs. In addition, any abnormal reduc-
tion might be related to differences in task performance,
e.g. fewer (successful) attempts to produce a response.
This might be especially the case for reductions in the
unimpaired right hemisphere. Altogether, increases and
decreases of activation might be intertwined, such that a
lower degree of pre-post decrease was shown to be specific
to trained items and a higher degree of decrease was
associated with low gain in performance (for details see
Abel et al., 2014).
Therapy-induced recovery
Even though activation increases have regularly been found
in functional MRI aphasia therapy studies—most of which
constitute a series of a few single cases—while decreases are
reported much more rarely, we only found activation de-
creases when comparing activations before versus after
therapy. We attribute this finding to more ease in process-
ing, i.e. higher efficiency (Table 5). Our complementary
analyses on specific therapy effects for the same patient
group (Abel et al., 2014) revealed that left IFG was a posi-
tive predictor of therapy outcome and that less activation
decrease due to therapy in left-hemisphere temporo-parietal
language areas was positively correlated with therapy gain.
An increase in right middle temporal gyrus/superior tem-
poral sulcus was previously associated with low perform-
ance in verbal fluency (Szaflarski et al., 2013). Conversely,
decreased activation in the same area due to therapy, as
revealed by our study, might be favourable for therapy
outcome.
Comparison between patients and controls
There were only minor differences between the naming net-
work for patients before therapy and for healthy controls
when the left-sided brain regions in patients found inactive
due to damage are taken into account. Compensatory brain
activations in patients mainly encompassed the strongly bi-
lateral naming network of healthy speakers (see also Abel
et al., 2009b), which corresponds to the notion of
Figure 5 The three components of the joint ICA. Render of the right (R) and left (L) hemisphere and axial slices, revealing lesion
localization/extension and associated brain activations for naming pre-post in the 3 out of 7 components (C4, C7, and C5) that revealed
differences in brain activation between patients and healthy subjects, with C4 at P5 0.001, C7 at P5 0.004, and C5 at P5 0.020, the latter
component not surviving the Bonferroni correction at 5% (see also Table 4). Colour coding: ‘Positive’ direction = decreasing activation pre-post in
red; ‘negative’ direction = increasing activation pre-post in blue. GAIN–: for component C4, there was a negative correlation with therapy gain
(see also Fig. 1).
10 | BRAIN 2015: Page 10 of 16 S. Abel et al.
by guest on February 23, 2015
Dow
nloaded from
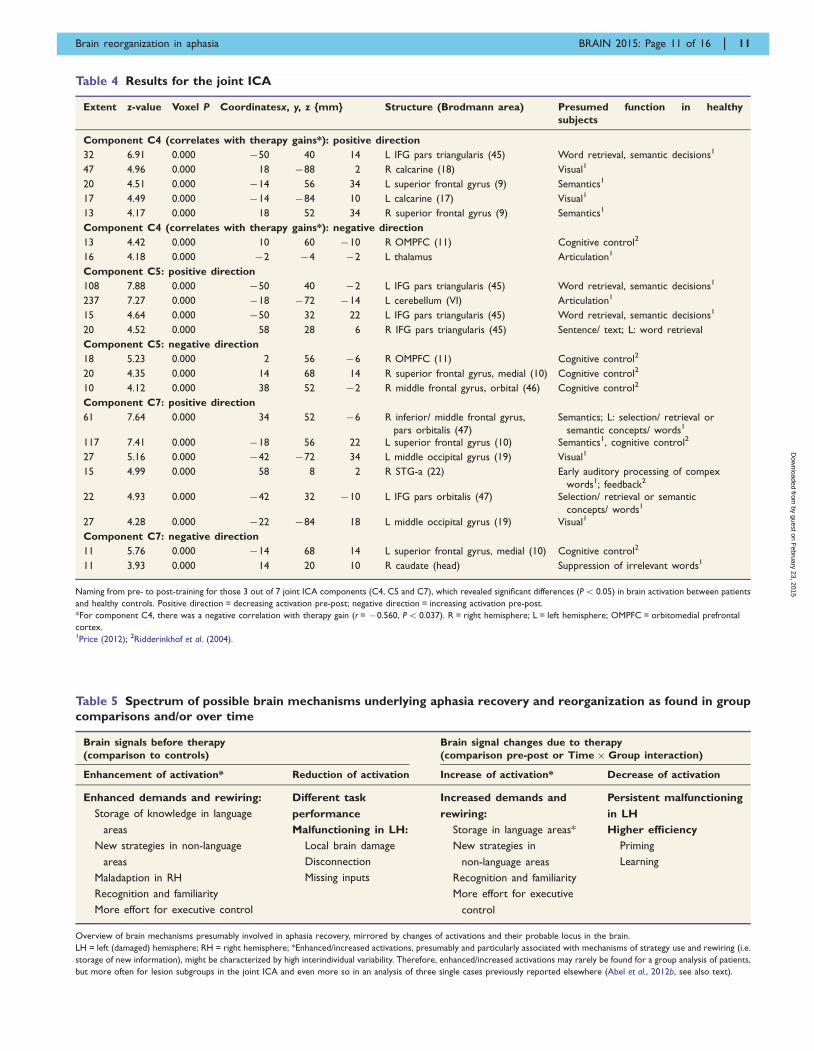
Table 4 Results for the joint ICA
Extent z-value Voxel P Coordinatesx, y, z {mm} Structure (Brodmann area) Presumed function in healthy
subjects
Component C4 (correlates with therapy gains*): positive direction
32 6.91 0.000 �50 40 14 L IFG pars triangularis (45) Word retrieval, semantic decisions1
47 4.96 0.000 18 �88 2 R calcarine (18) Visual1
20 4.51 0.000 �14 56 34 L superior frontal gyrus (9) Semantics1
17 4.49 0.000 �14 �84 10 L calcarine (17) Visual1
13 4.17 0.000 18 52 34 R superior frontal gyrus (9) Semantics1
Component C4 (correlates with therapy gains*): negative direction
13 4.42 0.000 10 60 �10 R OMPFC (11) Cognitive control2
16 4.18 0.000 �2 �4 �2 L thalamus Articulation1
Component C5: positive direction
108 7.88 0.000 �50 40 �2 L IFG pars triangularis (45) Word retrieval, semantic decisions1
237 7.27 0.000 �18 �72 �14 L cerebellum (VI) Articulation1
15 4.64 0.000 �50 32 22 L IFG pars triangularis (45) Word retrieval, semantic decisions1
20 4.52 0.000 58 28 6 R IFG pars triangularis (45) Sentence/ text; L: word retrieval
Component C5: negative direction
18 5.23 0.000 2 56 �6 R OMPFC (11) Cognitive control2
20 4.35 0.000 14 68 14 R superior frontal gyrus, medial (10) Cognitive control2
10 4.12 0.000 38 52 �2 R middle frontal gyrus, orbital (46) Cognitive control2
Component C7: positive direction
61 7.64 0.000 34 52 �6 R inferior/ middle frontal gyrus,
pars orbitalis (47)
Semantics; L: selection/ retrieval or
semantic concepts/ words1
117 7.41 0.000 �18 56 22 L superior frontal gyrus (10) Semantics1, cognitive control2
27 5.16 0.000 �42 �72 34 L middle occipital gyrus (19) Visual1
15 4.99 0.000 58 8 2 R STG-a (22) Early auditory processing of compex
words1; feedback2
22 4.93 0.000 �42 32 �10 L IFG pars orbitalis (47) Selection/ retrieval or semantic
concepts/ words1
27 4.28 0.000 �22 �84 18 L middle occipital gyrus (19) Visual1
Component C7: negative direction
11 5.76 0.000 �14 68 14 L superior frontal gyrus, medial (10) Cognitive control2
11 3.93 0.000 14 20 10 R caudate (head) Suppression of irrelevant words1
Naming from pre- to post-training for those 3 out of 7 joint ICA components (C4, C5 and C7), which revealed significant differences (P5 0.05) in brain activation between patients
and healthy controls. Positive direction = decreasing activation pre-post; negative direction = increasing activation pre-post.
*For component C4, there was a negative correlation with therapy gain (r = �0.560, P5 0.037). R = right hemisphere; L = left hemisphere; OMPFC = orbitomedial prefrontal
cortex.1Price (2012); 2Ridderinkhof et al. (2004).
Table 5 Spectrum of possible brain mechanisms underlying aphasia recovery and reorganization as found in group
comparisons and/or over time
Brain signals before therapy
(comparison to controls)
Brain signal changes due to therapy
(comparison pre-post or Time � Group interaction)
Enhancement of activation* Reduction of activation Increase of activation* Decrease of activation
Enhanced demands and rewiring:
Storage of knowledge in language
areas
New strategies in non-language
areas
Maladaption in RH
Recognition and familiarity
More effort for executive control
Different task
performance
Malfunctioning in LH:
Local brain damage
Disconnection
Missing inputs
Increased demands and
rewiring:
Storage in language areas*
New strategies in
non-language areas
Recognition and familiarity
More effort for executive
control
Persistent malfunctioning
in LH
Higher efficiency
Priming
Learning
Overview of brain mechanisms presumably involved in aphasia recovery, mirrored by changes of activations and their probable locus in the brain.
LH = left (damaged) hemisphere; RH = right hemisphere; *Enhanced/increased activations, presumably and particularly associated with mechanisms of strategy use and rewiring (i.e.
storage of new information), might be characterized by high interindividual variability. Therefore, enhanced/increased activations may rarely be found for a group analysis of patients,
but more often for lesion subgroups in the joint ICA and even more so in an analysis of three single cases previously reported elsewhere (Abel et al., 2012b, see also text).
Brain reorganization in aphasia BRAIN 2015: Page 11 of 16 | 11
by guest on February 23, 2015
Dow
nloaded from
‘redundancy recovery’ (Zahn et al., 2006) at least at the
group level.
The present observation of left hemisphere regions that
were unaffected by damage but revealed deviating activa-
tions may be attributed to a disconnection from crucial
areas of the naming network. Along the same lines,
Cao et al. (1999) found less activation in undamaged left-
hemisphere areas for silent naming and verb generation
among their seven patients included, especially in left
SMG, angular gyrus, and inferior parietal sulcus. The au-
thors attributed the reduction to a disconnection of left-
sided areas from the rest of the language network, which
instead were connected with homologue areas for compen-
sation of the functional loss. Task-dependent activity reduc-
tions have been attributed to dynamic changes in effective
connectivity to anatomically remote brain lesions (dynamic
diaschisis; Price et al., 2001). Anatomical connections be-
tween frontal and temporo-parietal language areas appear
to exist via dorsal and ventral language pathways (Saur
et al., 2008; Axer et al., 2012). Their disconnection has
been associated with impaired repetition and comprehen-
sion performance in acute aphasia (Kuemmerer et al.,
2013). In chronic patients, preserved inter-temporal con-
nectivities have been associated with better receptive lan-
guage performance (Warren et al., 2009). Thus, the
preservation of effective and anatomical connectivities ap-
pears to play a major role in aphasia recovery. Contrary,
the right-sided cluster in our study, which showed reduced
activation as well, may instead be explained by the fewer
overt naming attempts in patients, requiring less articula-
tory and auditory processing.
Moreover, our patients might rely strongly on pre-lin-
guistic features in right precuneus as a strategy for lexical
access. This area is part of the default network, which is
usually deactivated during task performance (Raichle and
Snyder, 2007); however, our control group revealed a posi-
tive brain signal here as well, even though it was signifi-
cantly lower than in patients. Increased left (Musso et al.,
1999; Calvert et al., 2000) and bilateral (Fridriksson et al.,
2007) precuneus activation have previously been found to
be present in aphasia recovery. Calvert et al. (2000) de-
tected more left precuneus activation compared to controls
in a semantic task and attributed this activation to a cog-
nitive strategy in order to solve the task by stronger reli-
ance on visual processing. The area has also been linked to
visual imagery and semantics (Price, 2010).
Following our argument of higher efficiency in areas with
decreased activation from pre- to post-training, right hippo-
campus (related to learning and memory) and thalamus
(related to attention) became less involved after therapy.
Decreases of precuneus and also of posterior cingulate ac-
tivation speak for decreased involvement of previously
required cognitive strategies. Likewise, Raboyeau et al.
(2008) reported a decrease in these two areas, which was
correlated with training-related improvement of word re-
trieval in aphasia.
Unexpectedly, we did not observe neural priming effects
in healthy controls, even though activation reductions due
to repeated task performance appear to be the rule
(Henson, 2003). Nevertheless, this fits well with the find-
ings of van Turennout et al. (2003), who reported activa-
tion decrease in occipito-temporal and left inferior frontal
regions for repeated naming that diminished over a 3-day
interval. Similar to our control group, activation increase
was found in left insula and basal ganglia, especially for
long lags. Turennout and coworkers (2003) argue that
early changes of representations in occipito-temporal and
inferior frontal areas were replaced by automated and effi-
cient name retrieval in insula and basal ganglia later on; the
latter could still be found weeks later in our healthy sub-
jects, accompanied by increased posterior ACC activation.
Since activation of ACC previously was found for the pro-
cessing of personally familiar faces (Donix et al., 2010),
involvement of this control area might also be indicative
of recognition processes and familiarity effects per se.
Given that this reorganization of brain circuitry related to
priming and learning usually does occur, it may still not
work properly in patients due to malfunctioning. Left ACC
and caudate had already been abnormally reduced before
training, and there was no amelioration but even further
decrease due to training. Both areas have also been asso-
ciated with language control (including error-related pro-
cessing) and the suppression of irrelevant words (Price,
2010). We conclude that this decrease may represent the
continuing functional deficit in higher-order priming/learn-
ing processes. This functional deficit might indeed be sec-
ondary, i.e. both areas might be inactive due to missing
input from language-related areas. In accordance with this
view, increased right ACC activation has been implicated in
training-induced improvements by Raboyeau et al. (2008).
Thus, decreased activation over time might not generally be
indicative of higher efficiency, especially when activation
had already been reduced compared to healthy controls
before training started.
Joint ICA: specific therapy-inducedrecovery
The large IGF lesion (component C4) probably discon-
nected anterior from posterior brain regions both via
dorsal and ventral language pathways (Saur et al., 2008;
Axer et al., 2012). The negative correlation with therapy
gain reveals that this recovery pattern was not successful
for this subgroup of patients. Furthermore, the regression
analysis on therapy effects showed that the lesion maps in
particular contributed to this component. Naeser et al.
(1989) showed that the extent of white matter damage in
a region deep to Broca’s region was an important indicator
of severity of speech impairment in non-fluent aphasic pa-
tients. A lesion in left IFG pars triangularis (BA 45) was
also correlated negatively with outcome after semantic ther-
apy (Marcotte et al., 2012). In both studies, a
12 | BRAIN 2015: Page 12 of 16 S. Abel et al.
by guest on February 23, 2015
Dow
nloaded from

disconnection might have contributed to the behavioural
effects, just as in our patient subgroup. Thus, Broca’s
area and superior frontal gyri (BA 9) associated with
word retrieval and semantics (Price, 2012) may be able to
work more efficiently, but since they work relatively inde-
pendent of more posterior left-sided regions, the informa-
tion cannot be transmitted to the language area including
Wernicke’s area. Maybe even more crucial, the disconnec-
tion to the hippocampal formation may impair explicit
learning of linguistic knowledge and optimal cognitive stra-
tegies (see also Goldenberg and Spatt, 1994), preventing
further improvements. Moreover, the impairment of vari-
ous pathways may render re-routing by means of therapy
impossible; this may be the reason why there was no
change of activation in the right Broca homologue. Thus,
preserved ventral and dorsal connectivities via the frontal
lobe appear to be crucial for therapy-induced improve-
ments of aphasic word retrieval.
The other two components probably indicated spared long-
range connectivities, since neither the large lesion associated
to component C7 nor the more focal lesion associated with
the component C5 extend into subcortical structures. The
regression analysis on therapy effects indicated that lesion
and activation maps equally contributed to the former com-
ponent. The brain areas with significant signal change resem-
ble those previously found for patient groups with good
language recovery: compensatory activation for damage of
posterior language zones in recovered aphasia was shown
to include bilateral IFG and homologous right temporal
areas (Weiller et al., 1995). Moreover, compensatory activa-
tion for lesions in anterior language zones was shown to in-
volve peri-lesional left IFG (Calvert et al., 2000a, b) or right
homologous IFG (Miura et al., 1999) activation. We found
the very same areas to show decreased activation after inter-
vention for the two lesion subgroups.
A consideration of differential effects of trained versus
untrained items over time (see Abel et al., 2014) again re-
vealed a frontal and a posterior component with specific
activation patterns, corroborating the importance of bilat-
eral thalamus (for the former), as well as the engagement of
areas related to error suppression (left caudate) next to the
disengagement of homologous right-hemisphere areas
(middle temporal gyrus, superior occipital gyrus and angu-
lar gyrus) associated with compensation of language func-
tions (for the latter).
Previous single case (Vitali et al., 2007) and group studies
(Blasi et al., 2002; Musso et al., 1999) on training-induced
reorganization in aphasia after frontal or temporal damage
revealed activation changes in right-sided language areas
homologous to the respective lesion site. A correlation
with improved language performance due to therapy was
rarely found for right hemisphere activations (Crosson
et al., 2005; Raboyeau et al., 2008), but more frequently
for bilateral (Fridriksson et al., 2006, 2007; Meinzer et al.,
2007; Menke et al., 2009) and left-sided (peri-lesional) ac-
tivations (Leger et al., 2002; Cornelissen et al., 2003; Vitali
et al., 2007; Meinzer et al., 2008). High interindividual
variability of the right hemisphere as ‘backup’ resource
was emphasized by Cappa (2000) (see also Gainotti,
1993). Our joint ICA reveals that the IFG might have the
highest compensatory potential at least for our patient sub-
groups and therapy method.
(Series) of single cases usually also report increases, while
the rare group studies also report decreases in activations
measured by functional MRI (Blasi et al., 2002; Richter
et al., 2008; Menke et al., 2009). We presume that in-
creases might be attributed to rewiring of connectivities in
the language system due to new associations, decreases
might be related to enhanced efficiency due to priming
and learning. It is likely that the re-wiring of connectivities
strongly varies between patients, especially in the previ-
ously non-dominant right hemisphere, where new connec-
tivities have to be established. Recent findings revealed that
the extent of right-sided anatomical connectivities, which
are heterogeneous in the healthy population, might play a
role in the variable reorganization patterns and behavioural
improvements in aphasia. Functional MRI case series also
might be helpful to shed light on the interplay between the
two presumed mechanisms of recovery. A previous analysis
of three single cases including Patients P11 and P15 from
the current study (Abel et al., 2012b) revealed increases
over and above decreases from pre- to post-training (con-
trast I-b) [see also pre-post comparisons for naming with
distractors in three single cases from Dressel et al. (2011)].
An influence of the applied cueing-therapy method,
which is known to feature word priming (Abel et al.,
2007) instead of (re-)learning of linguistic rules or compen-
satory strategies, remains to be investigated. Moreover, we
cannot reveal the impact of treatment-induced changes over
and above repeated exposure to the stimuli, as our control
group did not receive multiple stimulus exposure or train-
ing in-between the two scans. However, it remains unclear
whether repetition suppression related to priming and
greater efficiency induced by therapy methods featuring
priming differ at all.
Perani et al. (2003) examined functional MRI activations
for a semantic fluency task in aphasic patients and attrib-
uted extensive prefrontal activations to mental effort to
achieve lexical retrieval. Along the same lines, the increase
of activation in prefrontal areas, which was found for all
three components in our study, can be attributed to higher
demands on control processes (Ridderinkhof et al., 2004),
which might be implemented in language performance and
learning. Moreover, the joint ICA illustrates that various
mechanisms of recovery and reorganization might be
involved together, including activation decreases due to
higher efficiency and increases due to higher demands on
control processes.
ConclusionThe present study investigated therapy-induced changes of
brain activation patterns in a group of 14 patients with
Brain reorganization in aphasia BRAIN 2015: Page 13 of 16 | 13
by guest on February 23, 2015
Dow
nloaded from
chronic aphasia and word-finding difficulties using func-
tional MRI. Moreover, we combined functional MRI
with joint ICA for the first time to investigate the relation-
ship between brain reorganization patterns due to therapy
and lesion sites. Behaviourally, the majority of cases and
the patient group improved significantly during the 4 weeks
of lexical therapy.
We assessed brain activations before therapy to deter-
mine already recovered naming networks and compared
pre–post therapy activations to reveal neural changes due
to therapy. We found bilateral compensation in a premor-
bidly existing language network (redundancy recovery), re-
cruitment of non-language areas to subserve other
strategies for naming attempts (visuo-cognitive strategy in
precuneus), and persisting deficits affecting higher-order
cognitive functions (ACC and caudate). The exclusive pres-
ence of therapy-related activation decreases—which have
been related to higher processing efficiency—without
any sign of increases in the group analysis may be caused
by the high variability of individual rewiring of
connectivities.
To account for high lesion variability, we related lesion
information from structural MRI with functional data of
therapy-induced brain reorganization, using joint ICA. As a
result, significant differences in brain activation between
patients and healthy controls were found for three of
seven joint ICA components. All three lesion patterns
involved deactivation of left IFG; however, large IFG le-
sions appear to be less advantageous, perhaps due to per-
sisting disconnection of pathways preventing successful
information transmission between language areas.
Moreover, there was no compensatory deactivation in
contralateral IFG for large IFG lesions, which might be—
at least functionally—disconnected. On the contrary, right
IFG compensation could be found for the small prefrontal
lesion, and right IFG and homologous superior temporal
gyrus compensation for temporo-parietal lesions.
AcknowledgementsWe thank Ruth Bitzer, Sibylle Huefner and Stephanie
Elkeles for assistance with delivering speech therapy,
Christoph Kaller and the Freiburg Brain Imaging group
for valuable advice on image analyses, and the three re-
viewers for their very helpful comments. We want to
thank one reviewer in particular for providing AFNI cluster
size thresholds.
FundingThis research was supported by the German Ministry for
Education and Research (BMBF, 01GW0662) and the
German Research Foundation (DFG, HU 292/10-1 and
AB 282/2-1).
Supplementary materialSupplementary material is available at Brain online.
ReferencesAudio-visuelles Messprogramm (AVMP). Version 1.0. P & L
Softwaredesign; 1997.
Abel S, Dressel K, Bitzer R, Kuemmerer D, Mader I, Weiller C, et al.
The separation of processing stages in a lexical interference fMRI-
paradigm. Neuroimage 2009a; 44: 1113–24.
Abel S, Dressel K, Kuemmerer D, Saur D, Mader I, Weiller C, et al.
Correct and erroneous picture naming responses in healthy subjects.
Neurosci Lett 2009b; 463: 167–71.
Abel S, Dressel K, Weiller C, Huber W. Enhancement and suppression
in a lexical interference fMRI-paradigm. Brain Behav 2012a; 2:
109–27.
Abel S, Huber W, Weiller C, Amunts K, Eickhoff S, Heim S. The
influence of handedness on hemispheric interaction during word
production: insights from effective connectivity. Brain Connect
2011; 1: 219–31.Abel S, Weiller C, Huber W. The impact of lexical therapy on brain
reorganization in aphasia (German paper). L.O.G.O.S
Interdisziplinar 2012b; 20: 196–203.
Abel S, Weiller C, Huber W, Willmes K. Neural underpinnings for
model-oriented therapy of aphasic word production.
Neuropsychologia 2014; 57: 154–65.Abel S, Willmes K, Huber W. Model-oriented naming therapy. Testing
predictions of a connectionist model. Aphasiology 2007; 21:
411–47.
Ashburner J, Friston KJ. Unified segmentation. Neuroimage 2005; 26:
839–51.Axer H, Klingner CM, Prescher A. Fiber anatomy of dorsal and
ventral language streams. Brain Lang 2012; 127: 192–204.
Badre D, Wagner AD. Selection, integration, and conflict monitoring.
Neuron 2004; 41: 473–87.
Blasi V, Young AC, Tansy AP, Petersen SE, Snyder AZ, Corbetta M.
Word retrieval learning modulates right frontal cortex in patients
with left frontal damage. Neuron 2002; 36: 159–70.
Bonakdarpour B, Parrish TB, Thompson CK. Hemodynamic response
function in patients with stroke-induced aphasia. Neuroimage 2007;
36: 322–31.
Breier JI, Maher LM, Schmadeke S, Hasan KM, Papanicolaou AC.
Changes in language-specific brain activation after therapy for apha-
sia using magnetoencephalography: a case study. Neurocase 2007;
13: 169–77.
Cabeza R, Nyberg L. Imaging cognition II. J Cogn Neurosci 2000; 12:
1–47.
Calhoun VD, Adali T, Giuliani NR, Pekar JJ, Kiehl KA, Pearlson GD.
Method for multimodal analysis of independent source differences in
schizophrenia. Hum Brain Mapp 2006; 27: 47–62.
Calvert GA, Brammer MJ, Morris RG, Williams SCR, King N,
Matthews PM. Using fMRI to study recovery from acquired dys-
phasia. Brain Lang 2000; 71: 391–99.
Cao Y, Vikingstad BS, George KP, Johnson AF, Welch KM. Cortical
language activation in stroke patients recovering from aphasia.
Stroke 1999; 30: 2331–40.
Cappa SF. Neuroimaging of recovery from aphasia. Neuropsychol
Rehabil 2000; 10: 365–76.
Cornelissen K, Laine M, Tarkiainen A, Jarvensivu T, Martin N,
Salmelin R. Adult brain plasticity elicited by anomia treatment.
J Cogn Neurosci 2003; 15: 444–61.
Crinion J, Ashburner J, Leff A, Brett M, Price C, Friston K. Spatial
normalization of lesioned brains: performance evaluation and
impact on fMRI analyses. Neuroimage 2007; 37: 866–75.
14 | BRAIN 2015: Page 14 of 16 S. Abel et al.
by guest on February 23, 2015
Dow
nloaded from
Crinion J, Leff A. Recovery and treatment of aphasia after
stroke: functional imaging studies. Curr Opin Neurobiol 2007; 20:
667–73.
Crosson B, McGregor K, Gopinath KS, Conway TW, Benjamin M,
Chang YL, et al. Functional MRI of language in aphasia. Psych Rev
2007; 17: 157–77.
Crosson B, Moore AB, Gopinath K, White KD, Wierenga CE,
Gaiefsky ME, et al. Role of the right and left hemispheres in recov-
ery of function during treatment of intention in aphasia. J Cogn
Neurosci 2005; 17: 392–406.
Cusack R, Cumming N, Bor D, Norris D, Lyzenga J. An
automated post-hoc noise cancellation tool for audio
recordings acquired in an MRI scanner. Hum Brain Mapp 2005;
24: 299–304.
Donix M, Petrowski K, Jurjanz L, Huebner T, Herold U, Baeumler D,
et al. Age and the neural network of personal familiarity. PLoS One
2010; 5: e15790.Dressel K, Weiller C, Huber W, Abel S. Impaired word retrieval in a
cognitive model and in the brain. A therapy study including three
single cases. Sprache Stimme Gehor 2011; 35: 19–25.
Fridriksson J, Morrow-Odom L, Moser D, Fridriksson A, Baylis G.
Neural recruitment associated with anomia treatment in aphasia.
Neuroimage 2006; 32: 1403–12.
Fridriksson J, Moser D, Bonilha L, Morrow-Odom KL, Shaw H,
Fridriksson A, et al. Neural correlates of phonological and seman-
tic-based anomia treatment in aphasia. Neuropsychologia 2007; 45:
1812–22.Gainotti G. The riddle of the right hemisphere’s contribution
to the recovery of language. Eur J Disord Commun 1993; 28:
227–46.
Goldenberg G, Spatt J. Influence of size and site of cerebral lesion on
spontaneous recovery of aphasia and on success of language ther-
apy. Brain Lang 1994; 47: 684–98.
Heiss WD, Thiel A. A proposed regional hierarchy in recovery of post-
stroke aphasia. Brain Lang 2006; 98: 118–23.
Henson RNA. Neuroimaging studies of priming. Prog Neurobiol
2003; 70: 53–81.
Horner AJ, Henson RN. Priming, response learning and repetition
suppression. Neuropsychologia 2008; 46: 1979–91.
Indefrey P, Levelt WJM. The spatial and temporal signatures of word
production components. Cognition 2004; 92: 101–44.
Kuemmerer D, Hartwigsen G, Kellmeyer P, Glauche V, Mader I,
Kloeppel S, et al. Damage to ventral and dorsal language pathways
in acute aphasia. Brain 2013; 136 (Pt 2): 619–29.
Leger A, Demonet JF, Ruff S, Aithamon B, Touyeras B, Puel M, et al.
Neural substrates of spoken language rehabilitation in an aphasic
patient. Neuroimage 2002; 17: 174–83.Marcotte K, drover-Roig D, Damien B, de PM, Genereux S,
Hubert M, et al. Therapy-induced neuroplasticity in chronic apha-
sia. Neuropsychologia 2012; 50: 1776–86.
Meinzer M, Flaisch T, Breitenstein C, Wienbruch C, Elbert T,
Rockstroh B. Functional re-recruitment of dysfunctional brain
areas predicts language recovery in chronic aphasia. Neuroimage
2008; 39: 2038–46.
Meinzer M, Harnish S, Conway T, Crosson B. Recent developments in
structural and functional imaging of aphasia recovery after stroke.
Aphasiology 2011; 25: 271–90.Meinzer M, Obleser J, Flaisch T, Eulitz C, Rockstroh B. Recovery
from aphasia as a function of language therapy in an early bilingual
patient demonstrated by fMRI. Neuropsychologia 2007; 45:
1247–56.
Menke R, Meinzer M, Kugel H, Deppe M, Baumgartner A,
Schiffbauer H, et al. Imaging short- and long-term training success
in chronic aphasia. BMC Neurosci 2009; 10: 118.
Miura K, Nakamura Y, Miura F, Yamada I, Takahashi M,
Yoshikawa A, et al. Functional magnetic resonance imaging to
word generation task in a patient with Broca’s aphasia. J Neurol
1999; 246: 939–42.
Musso M, Weiller C, Kiebel S, Muller SP, Bulau P, Rijntjes M.
Training-induced plasticity in aphasia. Brain 1999; 122: 1781–90.
Naeser MA, Martin PI, Theoret H, Kobayashi M, Fregni F,
Nicholas M, et al. TMS suppression of right pars triangularis, but
not pars opercularis, improves naming in aphasia. Brain Lang 2011;
119: 206–13.
Naeser MA, Palumbo CL, Helm-Estabrooks N, Stiassny-Eder D,
Albert ML. Severe nonfluency in aphasia. Brain 1989; 112 (Pt 1):
1–38.
Perani D, Cappa SF, Tettamanti M, Rosa M, Scifo P, Miozzo A, et al.
A fMRI study of word retrieval in aphasia. Brain Lang 2003; 85:
357–68.
Price CJ. A review and synthesis of the first 20 years of PET and fMRI
studies of heard speech, spoken language and reading. Neuroimage
2012; 62: 816–47.
Price CJ. The anatomy of language: contributions from functional
neuroimaging. J Anat 2000; 197: 377–500.
Price CJ. The anatomy of language: a review of 100 fMRI studies
published in 2009. Ann N Y Acad Sci 2010; 1191: 62–88.
Price CJ, Warburton EA, Moore CJ, Frackowiak RSJ, Friston KJ.
Dynamic diaschisis. J Cog Neurosci 2001; 13: 419–29.Raboyeau G, De BX, Marie N, Balduyck S, Puel M, Bezy C, et al.
Right hemisphere activation in recovery from aphasia. Neurology
2008; 70: 290–98.
Raichle ME, Snyder AZ. A default mode of brain function.
Neuroimage 2007; 37: 1083–90.
Richter M, Miltner WH, Straube T. Association between therapy out-
come and right-hemispheric activation in chronic aphasia. Brain
2008; 131: 1391–401.Ridderinkhof KR, van den Wildenberg WPM, Segalowitz SJ,
Carter CS. Neurocognitive mechanisms of cognitive control. Brain
Cogn 2004; 56: 140.
Saur D, Kreher BW, Schnell S, Kuemmerer D, Kellmeyer P, Vry MS,
et al. Ventral and dorsal pathways for language. Proc Natl Acad Sci
USA 2008; 105: 18035–40.
Scott SK, Wise RJS. Functional imaging and language. Speech
Commun 2003; 41: 7–21.Seghier ML, Ramlackhansingh A, Crinion J, Leff AP, Price CJ. Lesion
identification using unified segmentation-normalisation models and
fuzzy clustering. Neuroimage 2008; 41: 1253–66.
Slotnick SD, Moo LR, Segal JB, Hart J. Distinct prefrontal cortex
activity associated with item memory and source memory for
visual shapes. Cogn Brain Res 2003; 17: 75–82.
Snodgrass JG, Vanderwart M. A standardized set of 260 pictures.
J Exp Psych-Hum L 1980; 6: 174–215.
Specht K, Zahn R, Willmes K, Weis S, Holtel C, Krause BJ, et al. Joint
independent component analysis of structural and functional images
reveals complex patterns of functional reorganisation in stroke
aphasia. Neuroimage 2009; 47: 2057–63.
Szaflarski JP, Allendorfer JB, Banks C, Vannest J, Holland SK.
Recovered vs. non-recovered from post-stroke aphasia. Restor
Neurol Neuros 2013; 31: 347–60.Thompson CK, den Ouden DB. Neuroimaging and recovery of lan-
guage in aphasia. Curr Neurol Neurosci Rep 2008; 8: 475–83.
van Turennout M, Bielamowicz L, Martin A. Modulation of neural
activity during object naming. Cereb Cortex 2003; 13: 381–91.
van Turennout M, Ellmore T, Martin A. Long-lasting cortical plasti-
city in the object naming system. Nat Neurosci 2000; 3: 1329–34.
Vigneau M, Beaucousin V, Herve PY, Duffau H, Crivello F, Houde O,
et al. Meta-analyzing left hemisphere language areas. Neuroimage
2006; 30: 1414–32.
Vigneau M, Beaucousin V, Herve PY, Jobard G, Petit L, Crivello F,
et al. What is right-hemisphere contribution to phonological,
lexico-semantic, and sentence processing? Neuroimage 2011; 54:
577–93.
Vitali P, Abutalebi J, Tettamanti M, Danna M, Ansaldo AI, Perani D,
et al. Training-induced brain remapping in chronic aphasia.
Neurorehabil Neural Repair 2007; 21: 152–60.
Brain reorganization in aphasia BRAIN 2015: Page 15 of 16 | 15
by guest on February 23, 2015
Dow
nloaded from

Warren JE, Crinion JT, Lambon Ralph MA, Wise RJ. Anterior tem-poral lobe connectivity correlates with functional outcome after
aphasic stroke. Brain 2009; 132: 3428–42.
Weiller C, Isensee C, Rijntjes M, Huber W, Muller S, Bier D, et al.
Recovery from Wernicke’s Aphasia. Ann Neurol 1995; 37: 723–32.
Wisenburn B, Mahoney K. A meta-analysis of word-finding treatmentsfor aphasia. Aphasiology 2009; 23: 1338–52.
Zahn R, Schwarz M, Huber W. Functional activation studies of word
processing in the recovery from aphasia. J Physiol 2006; 99:
370–85.
16 | BRAIN 2015: Page 16 of 16 S. Abel et al.
by guest on February 23, 2015
Dow
nloaded from