ther“ edta pe” cost of brexit - oliverwyman.com€¦ · copyright © 2018oliver wyman and...
TRANSCRIPT
THE “RED TAPE” COST OF BREXIT

Copyright © 2018 Oliver Wyman and Clifford Chance 1
Brexit outcomes remain uncertain with a wide range of future trading relationships between the EU271 and UK still possible. Most firms remain unsure of the impact Brexit will have on their businesses. Our analysis begins to fill that gap in understanding. In our first report in this series, we have not tried to calculate the full economic impact of Brexit on the UK and EU27 economies. Rather, we have focused on the direct impacts that will result from new tariff and non-tariff barriers that could be imposed on trade between the UK and EU27 (see note on methodology).
Understanding this initial set of “red tape” costs is essential for firms in their contingency and broader strategic planning. We have partnered with Clifford Chance to estimate these “red tape” costs across every sector of the economy where the EU27 and UK revert to a World Trade Organization (WTO) trading relationship with one another. We have chosen this scenario based on client feedback that this is a useful case for businesses to understand in greater depth. Our modelling assumes sufficient time through a transition period to implement new requirements such as ensuring customs infrastructure is in place. In order to put in context the size of these costs to business we have expressed them as a percentage of Gross Value Added (GVA)2 which is a commonly used measure of economic output by sector. Our report does not make the case for any specific policy options.
SUMMARY FINDINGS
RELATIVE SIZE
The annual direct (or “red tape”) cost of WTO
tariff and non-tariff barriers is estimated to total
around £27 billion for UK firms (or equivalent
to 1.5 percent of GVA) and around £31 billion
for EU27 firms (or equivalent to 0.4 percent of
GVA) after initial steps to mitigate the impacts
have been taken. They are of a similar absolute
magnitude but about four times greater for the
UK as a percentage of GVA.
CONCENTRATION
Around 70 percent of the aggregate impact falls
in just five sectors in both the EU27 and UK. The
clustering of certain sectors means that specific
regions are disproportionally impacted, such as
London in the UK or Bavaria in Germany.
CUSTOMS UNION
A future customs arrangement that is broadly
equivalent to the EU Customs Union would
likely reduce the UK direct costs to £17 billion
(equivalent to 1.0 percent of GVA) and for the
EU27 to £14 billion (equivalent to 0.2 percent
of GVA).3
COMPANY MITIGATIONS
Our interviews show that there are steps
companies can take individually to mitigate the
costs of Brexit. For many companies mitigations
will reduce “red tape” costs by 10 to 30 percent.
This varies significantly by sector and company:
for some no mitigations will be possible and
for others much higher mitigation could be
achieved. Our estimated impacts outlined in this
paper have included the impact of reasonable
and practical steps that companies can take,
which vary by sector and geography. Small
firms will be least able to mitigate these costs.
Achieving this mitigation is not trivial: it will take
time, planning, resourcing, and investment for
companies to deliver. In our estimates we have
not included the upfront investment required to
achieve mitigations.
CONTEXT AND PURPOSE
Copyright © 2018 Oliver Wyman and Clifford Chance 2
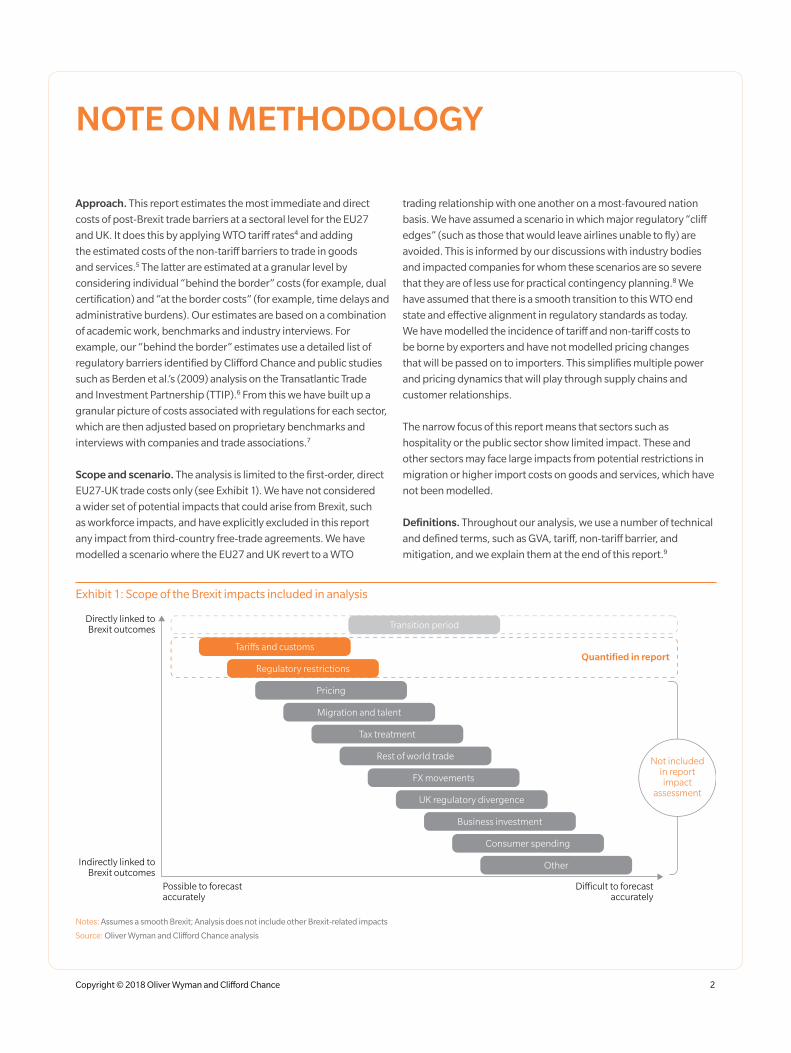
Exhibit 1: Scope of the Brexit impacts included in analysis
Directly linked to Brexit outcomes
Possible to forecast accurately
Di�cult to forecast accurately
Indirectly linked to Brexit outcomes
Transition period
Quantified in reportTari�s and customs
Regulatory restrictions
Pricing
Migration and talent
Tax treatment
Rest of world trade
FX movements
UK regulatory divergence
Business investment
Consumer spending
Other
Not included in report impact
assessment
Notes: Assumes a smooth Brexit; Analysis does not include other Brexit-related impacts
Source: Oliver Wyman and Clifford Chance analysis
Approach. This report estimates the most immediate and direct
costs of post-Brexit trade barriers at a sectoral level for the EU27
and UK. It does this by applying WTO tariff rates4 and adding
the estimated costs of the non-tariff barriers to trade in goods
and services.5 The latter are estimated at a granular level by
considering individual “behind the border” costs (for example, dual
certification) and “at the border costs” (for example, time delays and
administrative burdens). Our estimates are based on a combination
of academic work, benchmarks and industry interviews. For
example, our “behind the border” estimates use a detailed list of
regulatory barriers identified by Clifford Chance and public studies
such as Berden et al.’s (2009) analysis on the Transatlantic Trade
and Investment Partnership (TTIP).6 From this we have built up a
granular picture of costs associated with regulations for each sector,
which are then adjusted based on proprietary benchmarks and
interviews with companies and trade associations.7
Scope and scenario. The analysis is limited to the first-order, direct
EU27-UK trade costs only (see Exhibit 1). We have not considered
a wider set of potential impacts that could arise from Brexit, such
as workforce impacts, and have explicitly excluded in this report
any impact from third-country free-trade agreements. We have
modelled a scenario where the EU27 and UK revert to a WTO
trading relationship with one another on a most-favoured nation
basis. We have assumed a scenario in which major regulatory “cliff
edges” (such as those that would leave airlines unable to fly) are
avoided. This is informed by our discussions with industry bodies
and impacted companies for whom these scenarios are so severe
that they are of less use for practical contingency planning.8 We
have assumed that there is a smooth transition to this WTO end
state and effective alignment in regulatory standards as today.
We have modelled the incidence of tariff and non-tariff costs to
be borne by exporters and have not modelled pricing changes
that will be passed on to importers. This simplifies multiple power
and pricing dynamics that will play through supply chains and
customer relationships.
The narrow focus of this report means that sectors such as
hospitality or the public sector show limited impact. These and
other sectors may face large impacts from potential restrictions in
migration or higher import costs on goods and services, which have
not been modelled.
Definitions. Throughout our analysis, we use a number of technical
and defined terms, such as GVA, tariff, non-tariff barrier, and
mitigation, and we explain them at the end of this report.9
NOTE ON METHODOLOGY
Copyright © 2018 Oliver Wyman and Clifford Chance 3
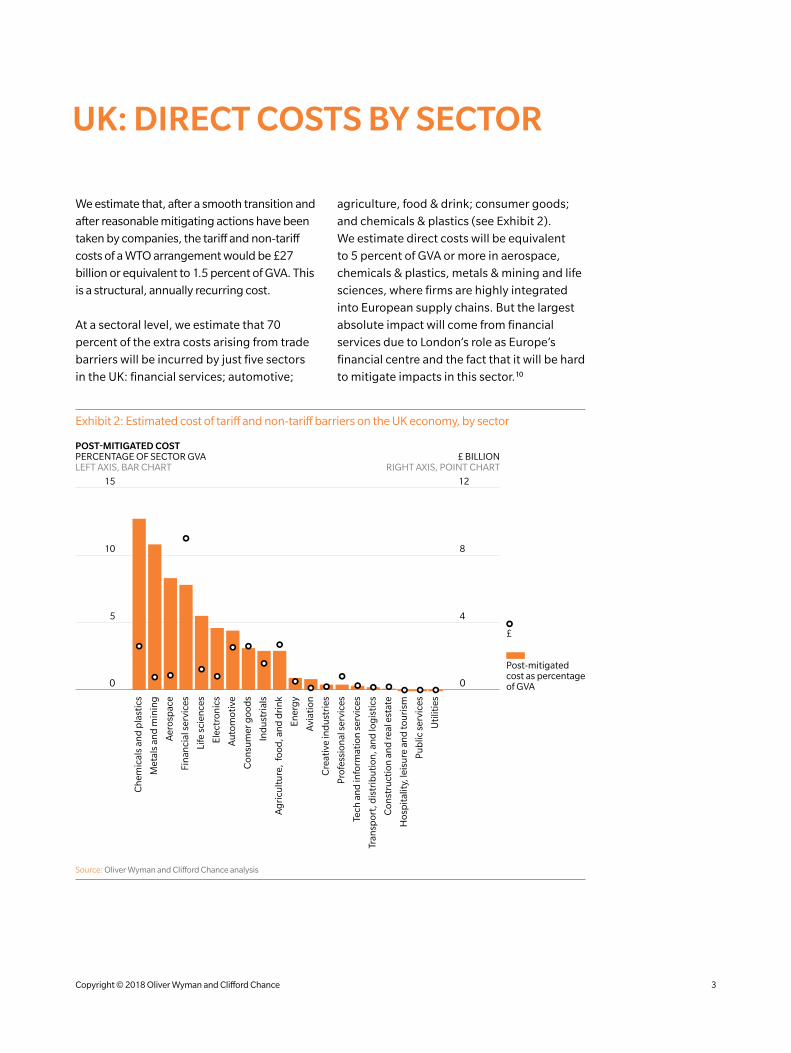
Exhibit 2: Estimated cost of tariff and non-tariff barriers on the UK economy, by sector
PERCENTAGE OF SECTOR GVALEFT AXIS, BAR CHART
£ BILLIONRIGHT AXIS, POINT CHART
POST-MITIGATED COST
5 4
10 8
15 12
Post-mitigated cost as percentage of GVA
£
Ch
emic
als
and
pla
stic
s
Met
als
and
min
ing
Aer
osp
ace
Fin
anci
al s
ervi
ces
Life
sci
ence
s
Elec
tron
ics
Au
tom
otiv
e
Con
sum
er g
ood
s
Ind
ust
rial
s
Ag
ricu
ltu
re,
food
, an
d d
rin
k
Ener
gy
Avi
atio
n
Cre
ativ
e in
du
stri
es
Pro
fess
ion
al s
ervi
ces
Tech
an
d in
form
atio
n s
ervi
ces
Tran
spor
t, d
istr
ibu
tion
, an
d lo
gis
tics
Con
stru
ctio
n a
nd
real
est
ate
Hos
pit
alit
y, le
isu
re a
nd
tou
rism
Uti
litie
s
Pu
blic
ser
vice
s
00
Source: Oliver Wyman and Clifford Chance analysis
UK: DIRECT COSTS BY SECTOR
We estimate that, after a smooth transition and
after reasonable mitigating actions have been
taken by companies, the tariff and non-tariff
costs of a WTO arrangement would be £27
billion or equivalent to 1.5 percent of GVA. This
is a structural, annually recurring cost.
At a sectoral level, we estimate that 70
percent of the extra costs arising from trade
barriers will be incurred by just five sectors
in the UK: financial services; automotive;
agriculture, food & drink; consumer goods;
and chemicals & plastics (see Exhibit 2).
We estimate direct costs will be equivalent
to 5 percent of GVA or more in aerospace,
chemicals & plastics, metals & mining and life
sciences, where firms are highly integrated
into European supply chains. But the largest
absolute impact will come from financial
services due to London’s role as Europe’s
financial centre and the fact that it will be hard
to mitigate impacts in this sector.10

Copyright © 2018 Oliver Wyman and Clifford Chance 4
The impact of reverting to WTO arrangements
will be very different across the regions of
the UK. This reflects variations in the sectoral
mix across the country. Given that financial
services firms will take by far the largest hit,
London will feel the greatest direct effect
equivalent to roughly 2.5 percent of its GVA
and accounting for approximately 40 percent
of the national total. The impact on other
regions will be between approximately 0.9
percent and 2.4 percent depending on the
local industrial mix, such as automotive, and
chemicals and plastics in the North East and
aerospace in Wales (see Exhibit 3).
Exhibit 3: Estimated cost of tariff and non-tariff barriers, by UK region
60 3.0
40 2.0
20 1.0
PERCENTAGE OF TOTAL UK COSTLEFT AXIS, BAR CHART
PERCENTAGE OF REGION’S GVARIGHT AXIS, POINT CHART
Lon
don
Sou
th E
ast
Nor
th W
est
Wes
t Mid
lan
ds
East
of E
ng
lan
d
Scot
lan
d
Sou
th W
est
York
shir
e an
d T
he
Hu
mb
er
East
Mid
lan
ds
Wal
es
Nor
th E
ast
Nor
ther
n Ir
elan
d
POST-MITIGATED COST
Percentage of total UK cost
Region’s GVA
0 0.0
Source: ONS 2016; Oliver Wyman and Clifford Chance analysis

Copyright © 2018 Oliver Wyman and Clifford Chance 5
Because the EU27 is a net exporter to the UK,
the absolute cost of new trade barriers to EU27-
based companies is estimated to be greater
than the direct impact on the UK at £31 billion.
This is a smaller proportion of GVA than the
costs to the UK. The direct costs of Brexit are
concentrated in a few sectors across the EU27
(see Exhibit 4). Between them, automotive;
agriculture, food & drink; chemicals & plastics;
consumer goods; and industrials will incur an
estimated 75 percent of the impact despite
accounting for just 23 percent of the EU27’s
economic output.
The ability of EU27 firms to mitigate the impact
of trade barriers varies by sector but our research
shows that at an aggregate level EU27 firms are
better positioned to mitigate cost increases. This
is because a larger proportion of their exports
are in goods rather than services, and they
also typically have a wider range of alternative
suppliers to choose from within the EU27.
Country-level differences will be pronounced.
In Ireland, for example, the exposure of
the agricultural sector to UK consumers is
a particular pinch point, and in Germany
four of the sixteen states – Bavaria, Baden-
Württemberg, North Rhine-Westphalia, and
Lower Saxony – will shoulder around 70 percent
of the total impact due to their respective
strength in automotive and manufacturing.
Exhibit 4: Estimated cost of tariff and non-tariff barriers on the EU27 economy, by sector
PERCENTAGE OF SECTOR GVALEFT AXIS, BAR CHART
£ BILLIONRIGHT AXIS, POINT CHART
POST-MITIGATED COST
5 4
10 8
15 12
Post-mitigated cost as percentage of GVA
£
Ch
emic
als
and
pla
stic
s
Met
als
and
min
ing
Life
sci
ence
s
Elec
tron
ics
Ag
ricu
ltu
re,
food
, an
d d
rin
k
Con
sum
er g
ood
s
Ind
ust
rial
s
Avi
atio
n
Fin
anci
al s
ervi
ces
Ener
gy
Tran
spor
t, d
istr
ibu
tion
, an
d lo
gis
tics
Pro
fess
ion
al s
ervi
ces
Tech
an
d in
form
atio
n s
ervi
ces
Cre
ativ
e in
du
stri
es
Con
stru
ctio
n a
nd
real
est
ate
Hos
pit
alit
y, le
isu
re, a
nd
tou
rism
Pu
blic
ser
vice
s
Uti
litie
s
00
Au
tom
otiv
e
Aer
osp
ace
Source: Oliver Wyman and Clifford Chance analysis
EU27: DIRECT COSTS BY SECTOR
Copyright © 2018 Oliver Wyman and Clifford Chance 6
CUSTOMS UNION
If the UK remains in a comprehensive customs
union with the EU27 that provides market
access broadly equivalent to the EU Customs
Union the costs arising from tariffs would be
avoided and some of the border costs reduced.
The benefits would thus largely be felt by
firms trading in goods rather than by firms
providing services, as the provision of services
is not covered by a customs union. Notably
such a customs union would not mitigate the
potential impact on the UK’s financial services
sector. A customs union does not by default
include mutual recognition of certification and
so our modelling reflects that default scenario.
These sectoral differences mean that a customs
union would reduce costs to the EU27 more
than it would to the UK, given that 76 percent
of EU27 exports to the UK are in goods
compared to 62 percent for UK exports to the
EU27.11 Our research estimates that remaining
in a customs union rather than moving to WTO
rules would reduce the UK impact to £17 billion
(equivalent to 1.0 percent of GVA) and the
EU27 impact to £14 billion (equivalent to 0.2
percent of GVA). Due to the concentration of
financial services firms in London, most of the
benefits of remaining in a customs union would
be felt outside of the capital.
As outlined above, we have factored in the
impact of actions that companies can take
to mitigate the costs of Brexit. Through this
analysis, two themes stood out.
First, the ability to mitigate varies by sector.
For example, the automotive and aerospace
sectors have the greatest opportunities to
mitigate the direct costs to their current
business, primarily by making more use of
domestic suppliers or in some cases changing
the location of final assembly. In another case,
financial services firms, which do not have
supply chains in the normal sense, will have
fewer such opportunities and are likely to have
to establish local sales, risk management, and
control functions inside the EU27.
The model we have used takes into account
the initial set of steps that companies can
take to reduce the red-tape cost of Brexit.
Based on interviews, steps such as developing
better IT systems, warehousing at borders,
and localisation of supply chains can and will
be taken by companies to reduce the impacts
but the scope to do so varies significantly by
company, industry and geography.
While our analysis takes into account these
first-order considerations, we believe this
to be a starting point.12 When planning for
Brexit, companies need to be thinking beyond
first-order mitigations and consider both the
operational and strategic impacts. The best
prepared firms are preparing contingencies
MITIGATING ACTIONS FOR INDUSTRY
Copyright © 2018 Oliver Wyman and Clifford Chance 7
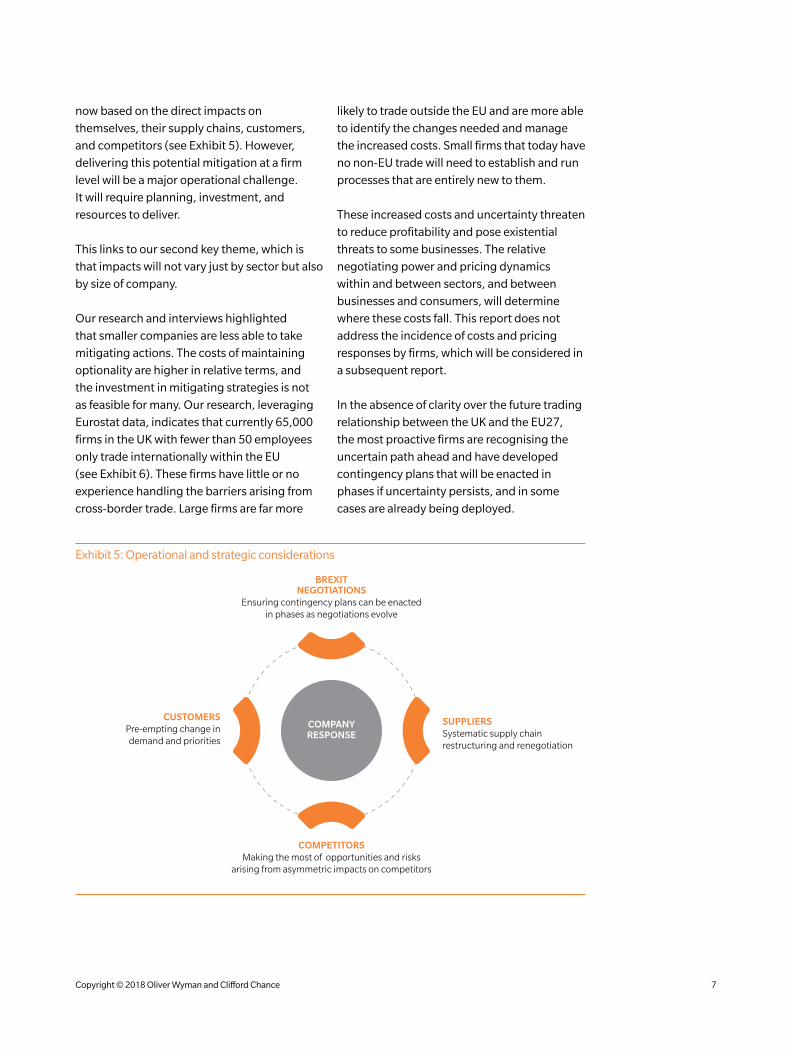
Exhibit 5: Operational and strategic considerations
CUSTOMERSPre-empting change in demand and priorities
SUPPLIERSSystematic supply chain restructuring and renegotiation
BREXITNEGOTIATIONS
Ensuring contingency plans can be enacted in phases as negotiations evolve
COMPETITORSMaking the most of opportunities and risks
arising from asymmetric impacts on competitors
COMPANYRESPONSE
now based on the direct impacts on
themselves, their supply chains, customers,
and competitors (see Exhibit 5). However,
delivering this potential mitigation at a firm
level will be a major operational challenge.
It will require planning, investment, and
resources to deliver.
This links to our second key theme, which is
that impacts will not vary just by sector but also
by size of company.
Our research and interviews highlighted
that smaller companies are less able to take
mitigating actions. The costs of maintaining
optionality are higher in relative terms, and
the investment in mitigating strategies is not
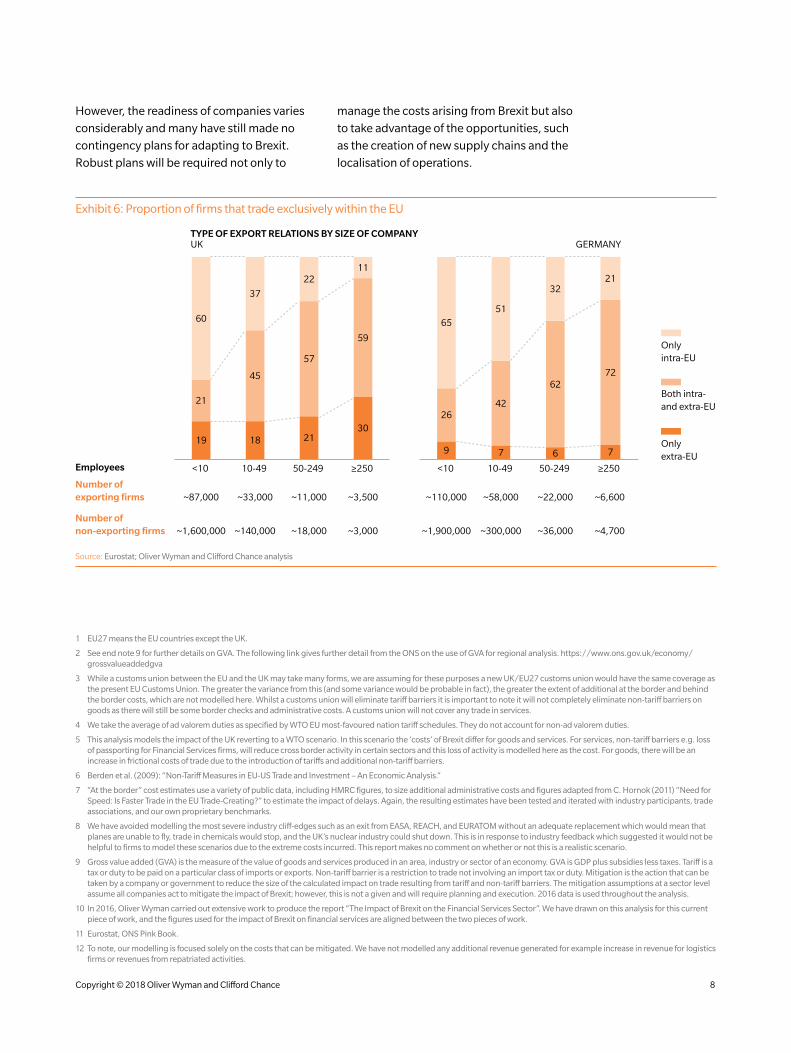
as feasible for many. Our research, leveraging
Eurostat data, indicates that currently 65,000
firms in the UK with fewer than 50 employees
only trade internationally within the EU
(see Exhibit 6). These firms have little or no
experience handling the barriers arising from
cross-border trade. Large firms are far more
likely to trade outside the EU and are more able
to identify the changes needed and manage
the increased costs. Small firms that today have
no non-EU trade will need to establish and run
processes that are entirely new to them.
These increased costs and uncertainty threaten
to reduce profitability and pose existential
threats to some businesses. The relative
negotiating power and pricing dynamics
within and between sectors, and between
businesses and consumers, will determine
where these costs fall. This report does not
address the incidence of costs and pricing
responses by firms, which will be considered in
a subsequent report.
In the absence of clarity over the future trading
relationship between the UK and the EU27,
the most proactive firms are recognising the
uncertain path ahead and have developed
contingency plans that will be enacted in
phases if uncertainty persists, and in some
cases are already being deployed.
Copyright © 2018 Oliver Wyman and Clifford Chance 8
Exhibit 6: Proportion of firms that trade exclusively within the EU
UKTYPE OF EXPORT RELATIONS BY SIZE OF COMPANY
GERMANY
Only intra-EU
Both intra- and extra-EU
Only extra-EU
Number of exporting firms
Number of non-exporting firms
Employees
~87,000
~1,600,000
<10
19
21
60
~33,000
~140,000
10-49
18
45
37
~11,000
~18,000
50-249
21
57
22
~3,500
~3,000
≥250
30
59
11
~110,000
~1,900,000
<10
9
26
65
~58,000
~300,000
10-49
7
42
51
~22,000
~36,000
50-249
6
62
32
~6,600
~4,700
≥250
7
72
21
Source: Eurostat; Oliver Wyman and Clifford Chance analysis
1 EU27 means the EU countries except the UK.
2 See end note 9 for further details on GVA. The following link gives further detail from the ONS on the use of GVA for regional analysis. https://www.ons.gov.uk/economy/grossvalueaddedgva
3 While a customs union between the EU and the UK may take many forms, we are assuming for these purposes a new UK/EU27 customs union would have the same coverage as the present EU Customs Union. The greater the variance from this (and some variance would be probable in fact), the greater the extent of additional at the border and behind the border costs, which are not modelled here. Whilst a customs union will eliminate tariff barriers it is important to note it will not completely eliminate non-tariff barriers on goods as there will still be some border checks and administrative costs. A customs union will not cover any trade in services.
4 We take the average of ad valorem duties as specified by WTO EU most-favoured nation tariff schedules. They do not account for non-ad valorem duties.
5 This analysis models the impact of the UK reverting to a WTO scenario. In this scenario the ‘costs’ of Brexit differ for goods and services. For services, non-tariff barriers e.g. loss of passporting for Financial Services firms, will reduce cross border activity in certain sectors and this loss of activity is modelled here as the cost. For goods, there will be an increase in frictional costs of trade due to the introduction of tariffs and additional non-tariff barriers.
6 Berden et al. (2009): “Non-Tariff Measures in EU-US Trade and Investment – An Economic Analysis.”
7 “At the border” cost estimates use a variety of public data, including HMRC figures, to size additional administrative costs and figures adapted from C. Hornok (2011) “Need for Speed: Is Faster Trade in the EU Trade-Creating?” to estimate the impact of delays. Again, the resulting estimates have been tested and iterated with industry participants, trade associations, and our own proprietary benchmarks.
8 We have avoided modelling the most severe industry cliff-edges such as an exit from EASA, REACH, and EURATOM without an adequate replacement which would mean that planes are unable to fly, trade in chemicals would stop, and the UK’s nuclear industry could shut down. This is in response to industry feedback which suggested it would not be helpful to firms to model these scenarios due to the extreme costs incurred. This report makes no comment on whether or not this is a realistic scenario.
9 Gross value added (GVA) is the measure of the value of goods and services produced in an area, industry or sector of an economy. GVA is GDP plus subsidies less taxes. Tariff is a tax or duty to be paid on a particular class of imports or exports. Non-tariff barrier is a restriction to trade not involving an import tax or duty. Mitigation is the action that can be taken by a company or government to reduce the size of the calculated impact on trade resulting from tariff and non-tariff barriers. The mitigation assumptions at a sector level assume all companies act to mitigate the impact of Brexit; however, this is not a given and will require planning and execution. 2016 data is used throughout the analysis.
10 In 2016, Oliver Wyman carried out extensive work to produce the report “The Impact of Brexit on the Financial Services Sector”. We have drawn on this analysis for this current piece of work, and the figures used for the impact of Brexit on financial services are aligned between the two pieces of work.
11 Eurostat, ONS Pink Book.
12 To note, our modelling is focused solely on the costs that can be mitigated. We have not modelled any additional revenue generated for example increase in revenue for logistics firms or revenues from repatriated activities.
However, the readiness of companies varies
considerably and many have still made no
contingency plans for adapting to Brexit.
Robust plans will be required not only to
manage the costs arising from Brexit but also
to take advantage of the opportunities, such
as the creation of new supply chains and the
localisation of operations.
Copyright © 2018 Oliver Wyman and Clifford Chance 9
AUTHORS
OLIVER WYMAN
Kumar Iyer Partner, London [email protected]
Lisa Quest Partner, London [email protected]
Patrick Hunt Principal, London [email protected]
CLIFFORD CHANCE
Jessica Gladstone Partner, London [email protected]
Mark Poulton Partner, London [email protected]
Phillip Souta Head of UK Public Policy, London [email protected]
CONTRIBUTORS
OLIVER WYMAN
Rafael Asensio, Madrid
Francois Austin, London
Fabian Brandt, Munich
Duncan Brewer, London
Pablo Campos, Madrid
Paddy Doran, London
Crispin Ellison, London
Rebecca Emerson, London
Andrea Federico, Milan
Nick Harrison, London
Finja Kütz, Munich
Hanna Moukanas, Paris
Lindsey Naylor, London
Neil Reid, Frankfurt
Gilles Roucolle, Paris
Xavier Ruaux, Paris
Ted Rudholm-Alfvin, Amsterdam
David Stewart, London
Nick Studer, London
Davide Taliente, London
Giovanni Viani, Milan
CLIFFORD CHANCE
Chris Bates, London
Hans Beerlage, Amsterdam
Marc Benzler, Frankfurt
Alex Cook, Prague
Robert Crothers, London
Niek De Pauw, Brussels
Javier Garcia de Enterria, Madrid
Isabelle Hessell-Tiltman, London
Jenine Hulsmann, London
Daud Khan, London
Thomas Krecek, Frankfurt
Christian Kremer, Luxembourg
Stephen Lewis, London
Dan Neidle, London
Michel Petite, Paris
David Pudge, London
Anselm Raddatz, Düsseldorf
Jörg Rhiel, Frankfurt
Jaime Sánchez, Madrid
Laurent Schoenstein, Paris
Paolo Sersale, Milan
SPECIAL THANKS
The authors would like to recognise the additional contributions from the following individuals: Andrew Bailey, Sourav Choudhury, Michael Cottrell, Elinor Godfrey, Rachel Gregory, Violet Marcel, Lucy Melville, Korbinian Scharf, Jamie Whyte, Philipp Zelter, and Hertford College, University of Oxford.

ABOUT OLIVER WYMAN
Oliver Wyman is a global leader in management consulting that combines deep industry knowledge with specialised expertise in strategy, operations, risk management, and organisation transformation.
ABOUT CLIFFORD CHANCE
Clifford Chance is one of the world’s pre-eminent law firms, with significant depth and range of resources across five continents.
Copyright © 2018 Oliver Wyman and Clifford Chance
All rights reserved. This report may not be reproduced or redistributed, in whole or in part, without the written permission of Oliver Wyman and Clifford Chance.
Oliver Wyman and Clifford Chance accept no liability whatsoever for the actions of third parties in this respect.
The information and opinions in this report were prepared by Oliver Wyman and Clifford Chance. This report is not investment advice and should not be relied on for such advice or as a substitute for consultation with professional accountants, tax, legal or financial advisors. Oliver Wyman and Clifford Chance have made every effort to use reliable, up-to-date and comprehensive information and analysis, but all information is provided without warranty of any kind, express or implied. Oliver Wyman and Clifford Chance disclaim any responsibility to update the information or conclusions in this report. Oliver Wyman and Clifford Chance accept no liability for any loss arising from any action taken or refrained from as a result of information contained in this report or any reports or sources of information referred to herein, or for any consequential, special or similar damages even if advised of the possibility of such damages. The report is not an offer to buy or sell securities or a solicitation of an offer to buy or sell securities. This report may not be sold without the written consent of Oliver Wyman and Clifford Chance.
www.oliverwyman.com www.cliffordchance.com