theory of planned behavior: sensitivity and specificity in … · theory of planned behavior:...
TRANSCRIPT
38
© 2016 The authors and IJLTER.ORG. All rights reserved.
International Journal of Learning, Teaching and Educational Research Vol. 15, No. 7, pp. 38-52, June 2016
Theory of Planned Behavior: Sensitivity and
Specificity in Predicting Graduation and Drop-Out among College and University Students
Catherine S. Fichten,1234 Rhonda Amsel,3 Mary Jorgensen,2 Mai N. Nguyen,2
Jillian Budd,2 Alice Havel,12 Laura King,5 Shirley Jorgensen,1 & Jennison Asuncion2
1Dawson College, 2Adaptech Research Network, 3McGill University, 4Jewish General Hospital, 5Cégep André-Laurendeau
Montreal, Canada Abstract. We examined sensitivity and specificity when using the three theory of planned behavior (TPB) scales (Perceived Behavioral Control, Subjective Norms, Attitude) to predict graduation and drop-out in a longitudinal study of 252 college and university students with disabilities and in a separate cross-sectional study of a random sample of 1380 junior/community college students. The results (a) show the utility of the TPB in predicting graduation, (b) underscore that when predicting outcome, graduation and drop-out are not polar opposites, and (c) highlight the need to consider sensitivity and specificity separately. We discuss the implications of using different scale cutoffs depending on the goal of testing as well as uses of the TPB scales in research and practice.
Keywords: theory of planned behavior, sensitivity, specificity,
graduation, college, university, prediction, longitudinal cross-sectional
Introduction. Academic persistence and graduation are important to students (better jobs), colleges and universities (funding issues), parents (who often pay the fees), as well as society at large (better educated work force). Postsecondary institutions are highly invested in improving retention and graduation rates (Selingo, 2015). Yet, postsecondary graduation rates are typically below 55% (ACT, 2006; Jorgensen et al., 2005; Shapiro, Dundar, Yuan, Harrell, & Wakhungu, 2014). Prediction of graduation and drop-out has a relatively poor track record (e.g., Jorgensen, Ferraro, Fichten, & Havel, 2009). Models are especially poor at predicting drop-out. This is the case even if many variables such as grades, gender, and survey results are included (Jorgensen, Fichten, & Havel, 2008). What is needed to identify students at risk is a brief paper and pencil measure that correctly identifies both those likely to graduate and those likely to drop out.

39
© 2016 The authors and IJLTER.ORG. All rights reserved.
We recently developed a questionnaire based on Ajzen’s (2002, 2012) Theory Of Planned Behavior (TPB) and tested it in a sample of 845 college students (Fichten et al., 2016) and 611 college and university students with various disabilities (Fichten, et al., 2014). The TPB suggests that behavior is influenced by Intention to carry out the behavior. Intention is predicted by: Perceived Behavioral Control (i.e., how easy or difficult it is to enact the behavior - in this case graduation), Subjective Norms (i.e., perceived views of individuals important in the student’s life), and Attitude (i.e., favorable or unfavorable evaluation of graduation). Ajzen’s ( n.d.) model in Figure 1 illustrates the TPB. The model has been shown to be highly effective and influential in numerous areas, including postsecondary contexts (Kovac, Cameron, & Høigaard, 2014; Kyle, White, Hyde, & Occhipinti, 2014; Prentice, Caska, & McLaughlin 2009; Schuchart, 2013; Thomas, 2014). Indeed, our studies of intention to graduate among postsecondary students with and without disabilities show that the TPB model predicted 44% of the variability in intention to graduate among college students in general (Fichten, et al., 2016), and 25% of the variability among students with disabilities (Fichten, et al., 2014).
Figure 1. Theory Of Planned Behavior
Sensitivity, Specificity, True and False Positives and Negatives. It is not possible to examine actual graduation and drop-out rates while students are enrolled – only the intention to do so. Yet, it is during this period that it is most important for institutions to identify individuals at risk for drop-out as this is when colleges and universities can implement remedial or other forms of programming to prevent drop-out. Typically a single score obtained from a logistic or multiple regression is used when using composite scores or a questionnaire to predict intention to graduate - including in our own studies (Fichten, et al, 2014, 2016). Most of the time researchers are pleased when over 25% of the variability in intention to graduate scores is predicted. The problem with this approach, however, is that it takes into account both students who definitely intend to graduate as well those who

40
© 2016 The authors and IJLTER.ORG. All rights reserved.
are thinking of dropping out. What if the measure predicts one better than the other? In an example from medicine (cf. MedicineNet.Com, n.d.), if a test designed to detect cancer returns a positive result, but the person does not actually have cancer (“false positive”), this would be very undesirable. Similarly, it is also undesirable for a test to return a negative result when the person actually does have cancer (“false negative”). Ideally, a test has to be accurate in predicting both true positives and negatives (i.e., correct predictions) while avoiding false positives and negatives. The typical way to express this is through “sensitivity” and “specificity” of a score (see Table 1 for definitions). Such concepts are frequently utilized in medicine (e.g. Baldessarini, Finklestein, & Arana, 1983), but rarely in social psychology or education. A notable exception is a study by Jorgensen et al. (2008), which used predictors based on individual and institutional factors; the results showed that the variables did a relatively good job of predicting graduation but a poor job of predicting drop-out. This illustrates the notion that in this context, graduation and drop-out are not simply two poles of a continuum. An illustrative example. The example in Table 1 illustrates this dilemma. Here, a hypothetical sample of 1000 students complete a questionnaire intended to predict whether they will graduate or not. Four years later 50% of the students have graduated and 50% have dropped out. Thus it is possible to determine actual graduation and drop-out .
Graduated Dropped Out Marginal Sum
Will Graduate a =450 c =400 850
Will Drop Out b = 50 d = 100 150Marginal Sum 500 500 1000
Note. Sensitivity = 90%, Specificity = 20%
Graduated Dropped Out Marginal Sum
Will Graduate a = True Positive c = False Positive a+c
Will Drop Out b = False Negative d = True Negative b+dMarginal Sum a+b c+d a+b+c+d
Table 1. Hypothetical Example of 1000 College Students Where 500 Actually
Graduated and 500 Actually Dropped Out
False positive: A result that indicates that a condition is present when it is not (e.g., if a test
designed to detect cancer returns a positive result but the person does not have cancer).
False negative: A result that appears negative when it should not (e.g., if a test designed to detect cancer returns a negative result but the person actually does have cancer).
Sensitivity = a/(a+b), True Positive/All Actual Graduates; Specificity = d/(c+d) True Negative/All Actual Drop-outs
Actual
Predicted
Actual
Predicted
41
© 2016 The authors and IJLTER.ORG. All rights reserved.
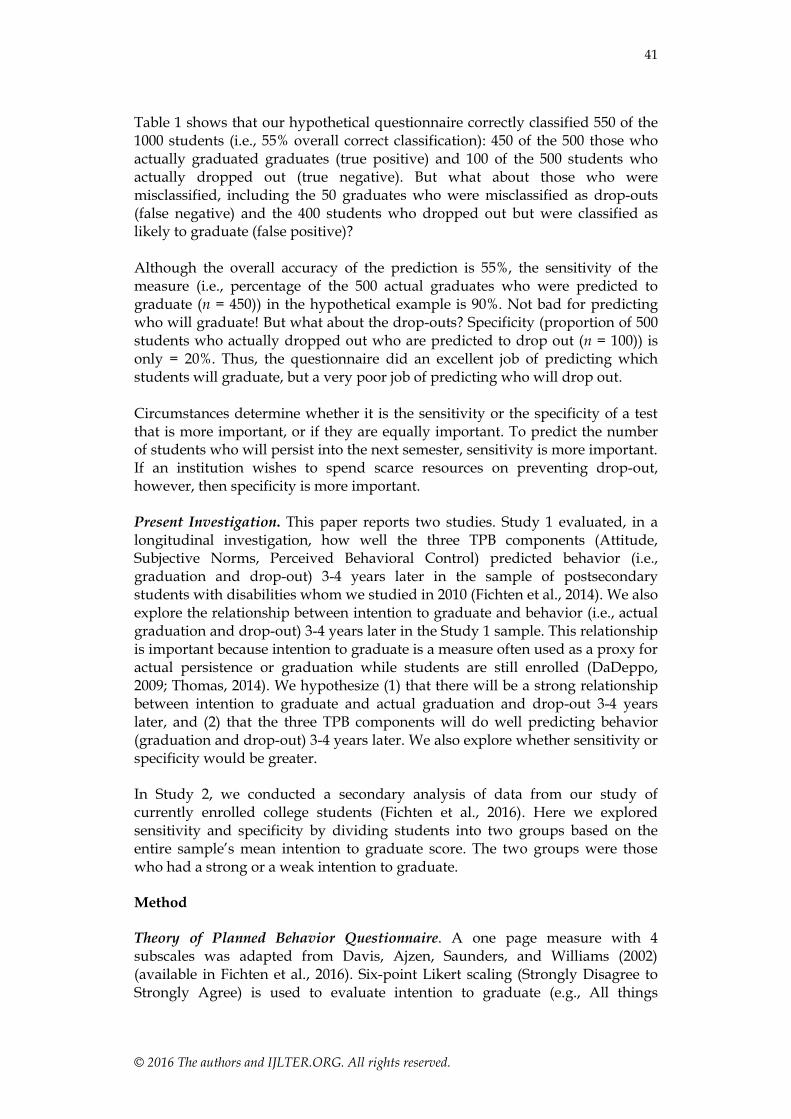
Table 1 shows that our hypothetical questionnaire correctly classified 550 of the 1000 students (i.e., 55% overall correct classification): 450 of the 500 those who actually graduated graduates (true positive) and 100 of the 500 students who actually dropped out (true negative). But what about those who were misclassified, including the 50 graduates who were misclassified as drop-outs (false negative) and the 400 students who dropped out but were classified as likely to graduate (false positive)? Although the overall accuracy of the prediction is 55%, the sensitivity of the measure (i.e., percentage of the 500 actual graduates who were predicted to graduate (n = 450)) in the hypothetical example is 90%. Not bad for predicting who will graduate! But what about the drop-outs? Specificity (proportion of 500 students who actually dropped out who are predicted to drop out (n = 100)) is only = 20%. Thus, the questionnaire did an excellent job of predicting which students will graduate, but a very poor job of predicting who will drop out. Circumstances determine whether it is the sensitivity or the specificity of a test that is more important, or if they are equally important. To predict the number of students who will persist into the next semester, sensitivity is more important. If an institution wishes to spend scarce resources on preventing drop-out, however, then specificity is more important.
Present Investigation. This paper reports two studies. Study 1 evaluated, in a longitudinal investigation, how well the three TPB components (Attitude, Subjective Norms, Perceived Behavioral Control) predicted behavior (i.e., graduation and drop-out) 3-4 years later in the sample of postsecondary students with disabilities whom we studied in 2010 (Fichten et al., 2014). We also explore the relationship between intention to graduate and behavior (i.e., actual graduation and drop-out) 3-4 years later in the Study 1 sample. This relationship is important because intention to graduate is a measure often used as a proxy for actual persistence or graduation while students are still enrolled (DaDeppo, 2009; Thomas, 2014). We hypothesize (1) that there will be a strong relationship between intention to graduate and actual graduation and drop-out 3-4 years later, and (2) that the three TPB components will do well predicting behavior (graduation and drop-out) 3-4 years later. We also explore whether sensitivity or specificity would be greater. In Study 2, we conducted a secondary analysis of data from our study of currently enrolled college students (Fichten et al., 2016). Here we explored sensitivity and specificity by dividing students into two groups based on the entire sample’s mean intention to graduate score. The two groups were those who had a strong or a weak intention to graduate.
Method Theory of Planned Behavior Questionnaire. A one page measure with 4 subscales was adapted from Davis, Ajzen, Saunders, and Williams (2002) (available in Fichten et al., 2016). Six-point Likert scaling (Strongly Disagree to Strongly Agree) is used to evaluate intention to graduate (e.g., All things

42
© 2016 The authors and IJLTER.ORG. All rights reserved.
considered, it is possible that I might not complete my program of study), perceived behavioral control over graduation (e.g., I can overcome any obstacles or problems that could prevent me from completing my program of study if I want to), and subjective norms related to graduation (e.g., Most people who are important to me expect me to complete my program of study). Attitude toward graduation is rated on 6-point Likert-type scales (e.g., very undesirable to very desirable ). Scoring is the average value of each scale. Attitude, subjective norms and perceived behavioral control scale means can be added together for a Total TPB score. Fichten et al. (2014) reported acceptable psychometric properties for the measure: Cronbach’s alphas ranged from .71 to .83 and test-retest reliability ranged from .62 to .74. Preliminary concurrent validation data were acceptable. Higher scores indicate more positive views about graduation. Study 1. Participants Participants consisted of 252 Canadians with disabilities who had been enrolled in a diploma or degree program in the spring 2010 semester and who, by the end of 2013, had either graduated from this program (193 graduates: 126 females, 67 males) or dropped out (59 premature leavers: 38 females, 20 males, 1 did not indicate). 175 individuals had attended a university and 77 a junior/community college. Participants had been enrolled in 75 different Canadian postsecondary institutions and were, on average 32 years old at follow-up. Most participants had been pursuing a bachelor’s degree (n = 120). There was no significant difference between groups on full-time (n = 204) versus part-time (n = 46) status, or on the number of disabilities/impairments reported in 2010. Both groups were most likely to have attention deficit hyperactivity disorder, or a learning disability, or a mental health related disability. The only significant difference between graduates and premature leavers was on mental health related disability, with a larger proportion of premature leavers reporting this, X2(1,252) = 6.99, p = .014, φ=.44. Study 1: Procedure In a protocol approved by the Dawson College Research Ethics Board in the fall 2013 term we followed up on a sample of 611 Canadian students with disabilities who had been enrolled in degree or diploma programs in the spring 2010 semester and on whom we reported in a previous paper (Fichten et al., 2014). We tried contacting students through the email or postal mail they provided in 2010. Two-hundred and fifty individuals could not be reached. Of the 361 individuals whose mail did not bounce back, 284 responded (return rate = 79%). Thirty-two of them were still enrolled in the same program as in 2010; they are not of interest here. Only the 193 graduates and 59 premature leavers are involved in the present investigation. Mean duration of the follow-up was 3.75 years. Participants were asked: “Did you graduate with a (name of the participant’s diploma/degree program in 2010) at (name of the participant’s school in 2010)?”
43
© 2016 The authors and IJLTER.ORG. All rights reserved.
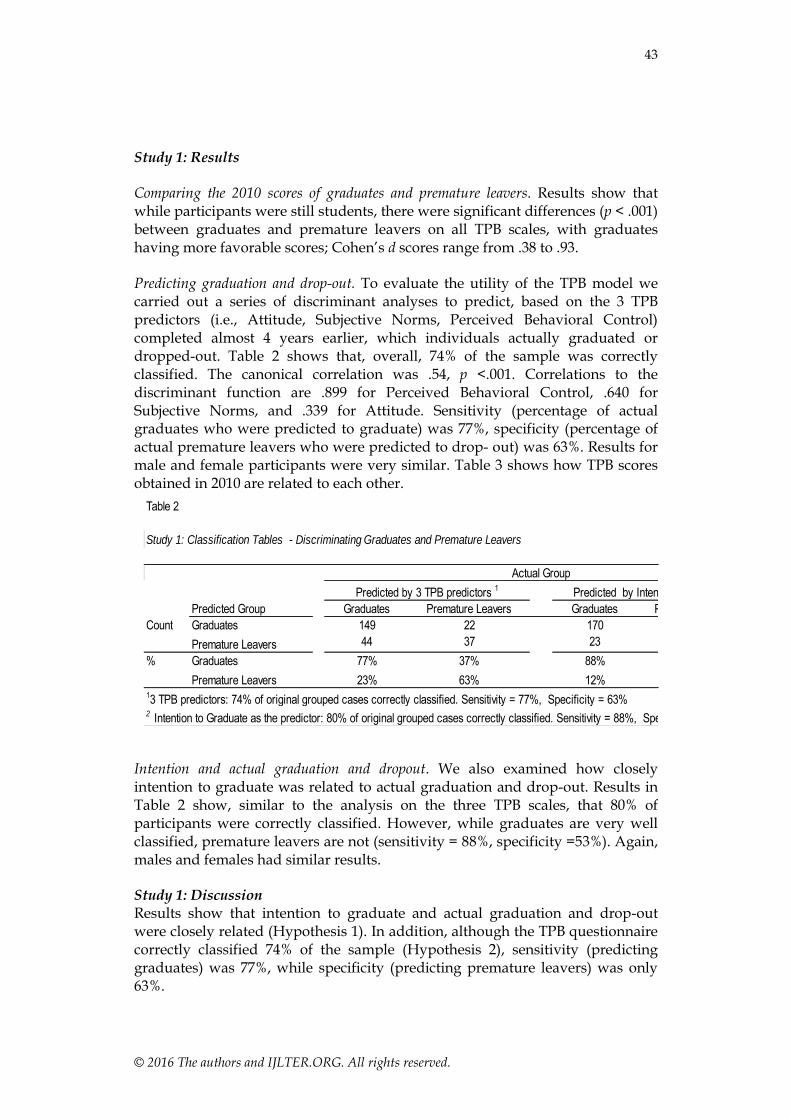
Study 1: Results Comparing the 2010 scores of graduates and premature leavers. Results show that while participants were still students, there were significant differences (p < .001) between graduates and premature leavers on all TPB scales, with graduates having more favorable scores; Cohen’s d scores range from .38 to .93. Predicting graduation and drop-out. To evaluate the utility of the TPB model we carried out a series of discriminant analyses to predict, based on the 3 TPB predictors (i.e., Attitude, Subjective Norms, Perceived Behavioral Control) completed almost 4 years earlier, which individuals actually graduated or dropped-out. Table 2 shows that, overall, 74% of the sample was correctly classified. The canonical correlation was .54, p <.001. Correlations to the discriminant function are .899 for Perceived Behavioral Control, .640 for Subjective Norms, and .339 for Attitude. Sensitivity (percentage of actual graduates who were predicted to graduate) was 77%, specificity (percentage of actual premature leavers who were predicted to drop- out) was 63%. Results for male and female participants were very similar. Table 3 shows how TPB scores obtained in 2010 are related to each other.
Intention and actual graduation and dropout. We also examined how closely intention to graduate was related to actual graduation and drop-out. Results in Table 2 show, similar to the analysis on the three TPB scales, that 80% of participants were correctly classified. However, while graduates are very well classified, premature leavers are not (sensitivity = 88%, specificity =53%). Again, males and females had similar results. Study 1: Discussion Results show that intention to graduate and actual graduation and drop-out were closely related (Hypothesis 1). In addition, although the TPB questionnaire correctly classified 74% of the sample (Hypothesis 2), sensitivity (predicting graduates) was 77%, while specificity (predicting premature leavers) was only 63%.
Table 2
Study 1: Classification Tables - Discriminating Graduates and Premature Leavers
Predicted Group Graduates Premature Leavers Graduates Premature LeaversCount Graduates 149 22 170 28
Premature Leavers 44 37 23 31% Graduates 77% 37% 88% 47%
Premature Leavers 23% 63% 12% 53%13 TPB predictors: 74% of original grouped cases correctly classified. Sensitivity = 77%, Specificity = 63%2 Intention to Graduate as the predictor: 80% of original grouped cases correctly classified. Sensitivity = 88%, Specificity = 53%
Actual GroupPredicted by 3 TPB predictors 1 Predicted by Intention to Graduate 2
44
© 2016 The authors and IJLTER.ORG. All rights reserved.
Study 2: Participants and Procedure A random sample of 1380 (796 females, 576 males, 8 other/prefer not to say) Canadian junior/community college students participated. Mean age was 20 (SD = 4, range 18-45). All students had completed a minimum of 1 semester of studies. All completed the TPB scales in class during the first few days of the fall 2014 academic term in a protocol approved by the Dawson College Research Ethics Board. Data on 854 of these students were reported in a previous paper (Fichten et al., 2016).The main outcome measure was intention to graduate. This was used both as a continuous variable in a multiple regression analysis and as a binary score (strong and weak intention to graduate) based on the scale mean (M = 5.673). Study 2: Results Comparing TPB scores of those with strong and weak intention to graduate. Results show significant (p < .001) moderate to strong differences (Cohen’s d ranges from .52 to .78) between the two groups on all TPB predictor scales, with those with strong intention to graduate having higher scores on all three predictor scales: Perceived Behavioral Control, Subjective Norms, and Attitude.
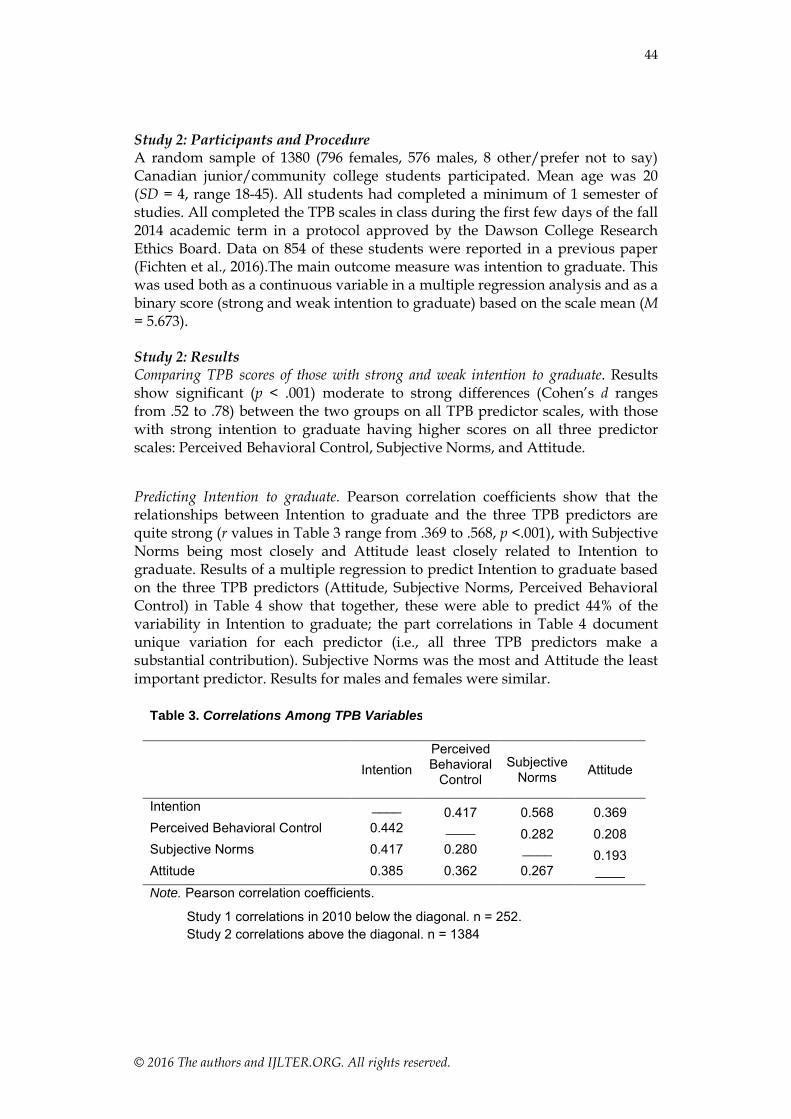
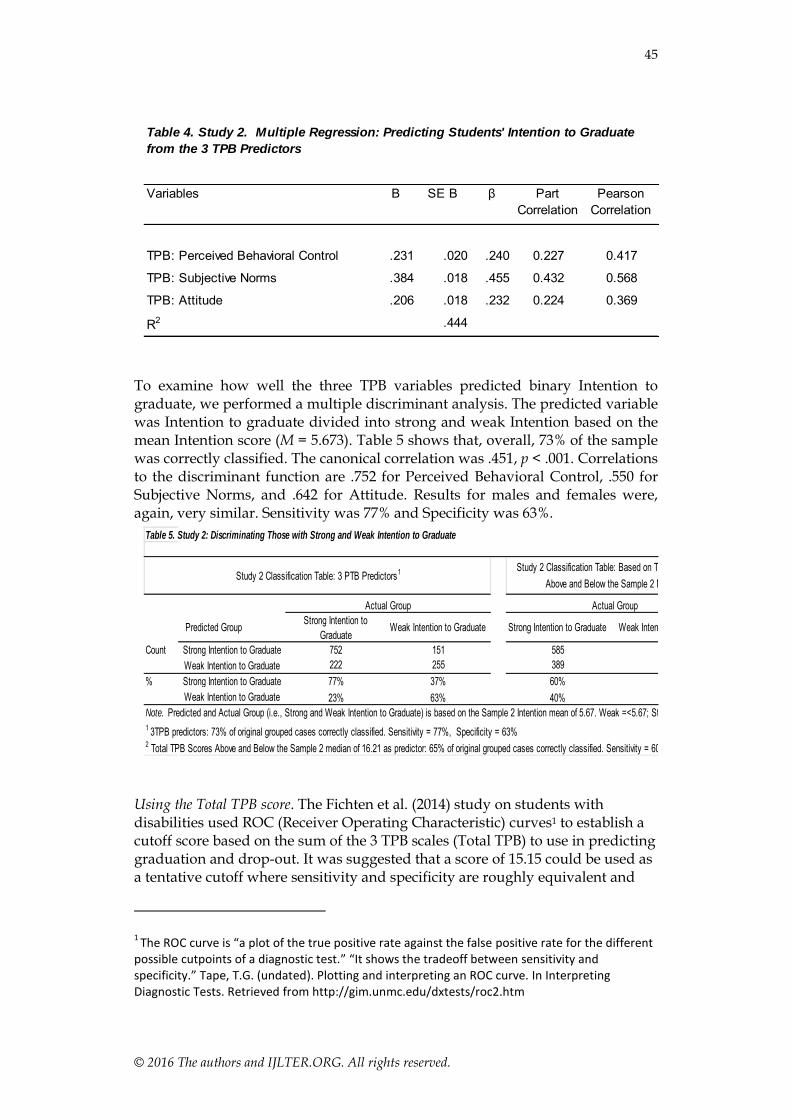
Predicting Intention to graduate. Pearson correlation coefficients show that the relationships between Intention to graduate and the three TPB predictors are quite strong (r values in Table 3 range from .369 to .568, p <.001), with Subjective Norms being most closely and Attitude least closely related to Intention to graduate. Results of a multiple regression to predict Intention to graduate based on the three TPB predictors (Attitude, Subjective Norms, Perceived Behavioral Control) in Table 4 show that together, these were able to predict 44% of the variability in Intention to graduate; the part correlations in Table 4 document unique variation for each predictor (i.e., all three TPB predictors make a substantial contribution). Subjective Norms was the most and Attitude the least important predictor. Results for males and females were similar.
Table 3. Correlations Among TPB Variables
Intention
Perceived Behavioral
Control Subjective
Norms Attitude
Intention ____ 0.417 0.568 0.369 Perceived Behavioral Control 0.442 ____ 0.282 0.208 Subjective Norms 0.417 0.280 ____ 0.193 Attitude 0.385 0.362 0.267 ____ Note. Pearson correlation coefficients.
Study 1 correlations in 2010 below the diagonal. n = 252.
Study 2 correlations above the diagonal. n = 1384
45
© 2016 The authors and IJLTER.ORG. All rights reserved.
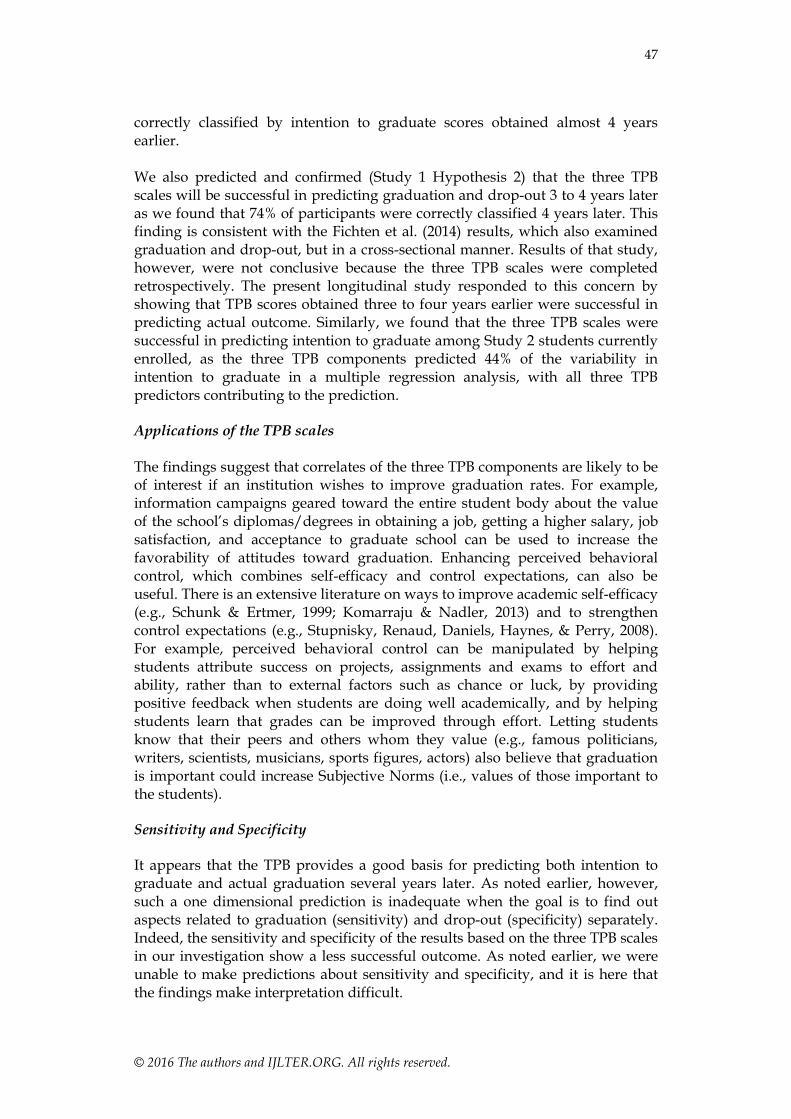
To examine how well the three TPB variables predicted binary Intention to graduate, we performed a multiple discriminant analysis. The predicted variable was Intention to graduate divided into strong and weak Intention based on the mean Intention score (M = 5.673). Table 5 shows that, overall, 73% of the sample was correctly classified. The canonical correlation was .451, p < .001. Correlations to the discriminant function are .752 for Perceived Behavioral Control, .550 for Subjective Norms, and .642 for Attitude. Results for males and females were, again, very similar. Sensitivity was 77% and Specificity was 63%.
Using the Total TPB score. The Fichten et al. (2014) study on students with disabilities used ROC (Receiver Operating Characteristic) curves1 to establish a cutoff score based on the sum of the 3 TPB scales (Total TPB) to use in predicting graduation and drop-out. It was suggested that a score of 15.15 could be used as a tentative cutoff where sensitivity and specificity are roughly equivalent and
1 The ROC curve is “a plot of the true positive rate against the false positive rate for the different
possible cutpoints of a diagnostic test.” “It shows the tradeoff between sensitivity and specificity.” Tape, T.G. (undated). Plotting and interpreting an ROC curve. In Interpreting Diagnostic Tests. Retrieved from http://gim.unmc.edu/dxtests/roc2.htm
Table 5. Study 2: Discriminating Those with Strong and Weak Intention to Graduate
Predicted Group Strong Intention to Graduate
Weak Intention to Graduate Strong Intention to Graduate Weak Intention to Graduate
Count Strong Intention to Graduate 752 151 585 99Weak Intention to Graduate 222 255 389 307
% Strong Intention to Graduate 77% 37% 60% 24%Weak Intention to Graduate 23% 63% 40% 76%
Note. Predicted and Actual Group (i.e., Strong and Weak Intention to Graduate) is based on the Sample 2 Intention mean of 5.67. Weak =<5.67; Strong >5.67.1 3TPB predictors: 73% of original grouped cases correctly classified. Sensitivity = 77%, Specificity = 63%2 Total TPB Scores Above and Below the Sample 2 median of 16.21 as predictor: 65% of original grouped cases correctly classified. Sensitivity = 60%, Specificity = 76%
Actual Group Actual Group
Study 2 Classification Table: 3 PTB Predictors1 Study 2 Classification Table: Based on Total TPB Scores Above and Below the Sample 2 Median2
Variables B SE B β Part Correlation
Pearson Correlation
TPB: Perceived Behavioral Control .231 .020 .240 0.227 0.417
TPB: Subjective Norms .384 .018 .455 0.432 0.568
TPB: Attitude .206 .018 .232 0.224 0.369
R2 .444
Table 4. Study 2. Multiple Regression: Predicting Students' Intention to Graduate
from the 3 TPB Predictors

46
© 2016 The authors and IJLTER.ORG. All rights reserved.
will identify 2/3 of both those who are likely to graduate and those who are likely to drop out. To evaluate the utility of this cutoff in determining which individuals could be targeted for remediation and which could not, here we conducted a multiple discriminant analysis using the binary score as the predictor variable. The predicted variable was again Intention to graduate divided into strong and weak intention based on the mean intention to graduate score (M = 5.673). This resulted in specificity of 89% but a very poor sensitivity (46%). To examine whether the present sample’s median total TPB would result in better specificity, we used the Study 2 median score of 16.21 and again predicted binary Intention to graduate. Table 5 shows that, overall, only 65% of the sample was correctly classified. The canonical correlation was .325, p < .001. However, sensitivity was 60% and specificity was 76% Thus, raising the Total TPB cutoff score resulted in better specificity but poorer sensitivity. Study 2: Discussion Results show that when we divided participants on the mean Intention to graduate score, 73% of the sample was correctly classified. Sensitivity was 77% and Specificity was 63%, values virtually identical to those of Study 1. Again, the three TPB predictors were better able to predict those who strongly intended to graduate (sensitivity) from those whose intention to graduate was weaker (specificity). Attempts to improve specificity by increasing the value of the cutoff were successful, but resulted in poorer sensitivity. General Discussion Our goal was to examine the usefulness of the Theory of Planned Behavior (TPB) scales in predicting graduation and drop-out. It should be noted that all scales of the TPB model fit on a single page, so it is easy and fast to administer (see Fichten et al, 2016). Some data already exist concerning its utility when evaluating intention to graduate and actual graduation and drop-out when measures were administered concurrently (i.e., not longitudinally) in samples of individuals with various disabilities (Fichten et al., 2014) as well as nondisabled college students (Fichten, et al., 2016). What is unique about the present investigation is that here we examined, in a longitudinal study, (a) how well responses on the TPB questionnaire (completed while students were still enrolled), predicted graduation and drop-out several years later, (b) how closely the intention to graduate component of the TPB model, is related to actual graduation and drop-out, and (c) how useful the TPB model and questionnaire are in predicting which specific students will drop out or graduate in a large random sample of junior/community college students. As predicted (Study 1 Hypothesis 1), we found that a strong relationship exists between questionnaire responses concerning intention to graduate obtained three to four years earlier, and actual graduation and drop-out. This prediction was confirmed, as 80% of graduates and premature leavers in Study 1 were
47
© 2016 The authors and IJLTER.ORG. All rights reserved.
correctly classified by intention to graduate scores obtained almost 4 years earlier. We also predicted and confirmed (Study 1 Hypothesis 2) that the three TPB scales will be successful in predicting graduation and drop-out 3 to 4 years later as we found that 74% of participants were correctly classified 4 years later. This finding is consistent with the Fichten et al. (2014) results, which also examined graduation and drop-out, but in a cross-sectional manner. Results of that study, however, were not conclusive because the three TPB scales were completed retrospectively. The present longitudinal study responded to this concern by showing that TPB scores obtained three to four years earlier were successful in predicting actual outcome. Similarly, we found that the three TPB scales were successful in predicting intention to graduate among Study 2 students currently enrolled, as the three TPB components predicted 44% of the variability in intention to graduate in a multiple regression analysis, with all three TPB predictors contributing to the prediction. Applications of the TPB scales The findings suggest that correlates of the three TPB components are likely to be of interest if an institution wishes to improve graduation rates. For example, information campaigns geared toward the entire student body about the value of the school’s diplomas/degrees in obtaining a job, getting a higher salary, job satisfaction, and acceptance to graduate school can be used to increase the favorability of attitudes toward graduation. Enhancing perceived behavioral control, which combines self-efficacy and control expectations, can also be useful. There is an extensive literature on ways to improve academic self-efficacy (e.g., Schunk & Ertmer, 1999; Komarraju & Nadler, 2013) and to strengthen control expectations (e.g., Stupnisky, Renaud, Daniels, Haynes, & Perry, 2008). For example, perceived behavioral control can be manipulated by helping students attribute success on projects, assignments and exams to effort and ability, rather than to external factors such as chance or luck, by providing positive feedback when students are doing well academically, and by helping students learn that grades can be improved through effort. Letting students know that their peers and others whom they value (e.g., famous politicians, writers, scientists, musicians, sports figures, actors) also believe that graduation is important could increase Subjective Norms (i.e., values of those important to the students). Sensitivity and Specificity It appears that the TPB provides a good basis for predicting both intention to graduate and actual graduation several years later. As noted earlier, however, such a one dimensional prediction is inadequate when the goal is to find out aspects related to graduation (sensitivity) and drop-out (specificity) separately. Indeed, the sensitivity and specificity of the results based on the three TPB scales in our investigation show a less successful outcome. As noted earlier, we were unable to make predictions about sensitivity and specificity, and it is here that the findings make interpretation difficult.

48
© 2016 The authors and IJLTER.ORG. All rights reserved.
The results of both studies show that sensitivity (i.e., predicting who will graduate) was generally quite impressive, with a score of 77% in both Studies 1 and 2. However, predicting who will drop out (i.e., specificity) was weaker (i.e., 63%) in both studies. In summary, the model was reasonably good at predicting who will graduate, but not who will drop out. Such results are similar to findings by Jorgensen et al. (2008) using a very different array of predictors. Moreover, the results highlight the importance of noting that graduation and drop-out, when it comes to predicting these, are not polar opposites. For example, providing financial aid may help prevent drop-out of those in financial need, but is not likely to increase the likelihood of graduation for the entire college population (cf. Dwyer, Hodson, & McCloud, 2013; Gentry, 2014). Improving specificity and identifying individual students who are likely to drop out. Using a cutoff on the Total TPB score (i.e., the sum of the three TPB components: Attitude, Subjective Norms, and Perceived Behavioral Control) was quite successful in improving the prediction of drop-out and in identifying individual students who are likely to drop-out or to graduate. This approach was also used in the Fichten et al. (2014) study, where a cutoff of 15.15 was suggested for further investigation. When we used this cutoff, we once more obtained good sensitivity (89%) but poor specificity (46%). To try to increase the specificity of the score in Study 2 we used the current sample’s median of 16.21. This resulted in much improved specificity (75%) at the cost of relatively poor sensitivity (60%). See-saw. Thus, the lower the cutoff, the higher the sensitivity, while the higher the cutoff, the better the specificity. What cutoff to use depends on the goal of testing. Using and Studying the Theory of Planned Behavior in Predicting Graduation and Dropout The one-page measure comprising the three Theory of Planned Behavior scales is available in Fichten et al. (2016). It can be added to college and university institutional research measures for further investigation. It is free, takes less than 5 minutes to complete, and appears to have good potential for predicting intention to graduate as well as actual graduation. Although the three components do not perform especially well in predicting drop-out, using the Total TPB scale and adjusting the cutoff can result in acceptable specificity and, thereby, predict which students are likely to drop out. Three types of scores are typically used when predicting graduation: predicting the percentage of the variability in scores, such as the R2 used in our investigation; predicting an overall single score reflecting graduation/dropout in discriminant analysis classification tables that are based on the percentage of

49
© 2016 The authors and IJLTER.ORG. All rights reserved.
original cases correctly classified; and the use of individual students’ scores to identify who is likely to drop-out and who to graduate. The type of analysis that should be used depends on the purpose of testing. If it is to study characteristics that predict graduation, then a single score that reflects the variability that is explained by the three predictors, such as R2, or the overall single score from a multiple discriminant analysis classification table, will do quite well. Different cut-off scores: implications of the see-saw. If the goal is to obtain an idea about the success of the school’s recruitment policies or to predict retention into the next semester, then increasing sensitivity is likely to be most important. Our results suggest that using the Total TPB score with a relatively low cutoff will increase sensitivity. If the purpose it is to determine which specific students to target in intervention programs to prevent drop-out, then increasing specificity is most important. This is best accomplished by using the Total TPB measure with a high cutoff. Schools can consider using different cutoff scores depending on their needs and resources. For example, if the goal is to identify as many of the students who are likely to drop out as possible in order to target them for interventions such as remedial efforts, financial aid possibilities, how to study and exam anxiety workshops, etc., and the school has adequate resources so that false negatives (falsely identifying students who are actually likely to graduate as potential drop-outs) do not matter, then setting the cutoff on the Total TPB well above the median is likely to yield the desired results. This can allow faculty and those responsible for student services and student success to better support these students with early interventions. If, on the other hand, resources are scarce, and the school does not wish to spend limited resources on remediating those who are likely to graduate anyway, then setting a lower cutoff can be the solution. Limitations and Future Research The present investigation has several limitations which can affect the generalizability of the results. First, we must note that both Studies 1 and 2 are correlational, and, thus causality cannot be inferred. In addition, in spite of the relatively lengthy follow-up period, Study 1 participants constitute an atypical group (i.e., individuals with disabilities). In Study 2 we used a random sample of over 1000 students. However, they were enrolled in only two junior/community colleges, and since they had not yet graduated, only intention to graduate could be studied. Moreover, in Study 2 the TPB scales and intention to graduate were administered concurrently, mainly in the beginning of the semester. In future investigations we suggest that the TPB model be used to study graduation and drop-out in large, preferably random samples of students at different levels (e.g., college diploma, bachelor, graduate studies, etc.), and fields of study (e.g., sciences, arts, etc.), at various levels of credential completion (e.g., first year vs. near completion of the credential). It is possible that students are
50
© 2016 The authors and IJLTER.ORG. All rights reserved.
more optimistic about graduation at the beginning of the semester than at other times (A. Havel, personal communication, August, 2014), so the timing of administration could be varied and its impact investigated. Since students are most likely to drop out early in their academic career (Jorgensen, Ferraro, Fichten, & Havel, 2009) it is worthwhile to examine TPB scores during the first or second semester of studies. Persistence from one semester to the next, rather than graduation, can be used as the outcome variable. The generalizability of the model to students with different backgrounds, both ethnic and socioeconomic, as well as different individual differences, including disability, gender, and age needs further evaluation. Future research should examine different ways of “extending” the model (cf. Stone, Jawahar, & Kisamore, 2010) to improve the sensitivity and specificity of predicting graduation and drop-out. One possibility includes examination of reasons for drop-out (Jorgensen, Ferraro, Fichten, & Havel, 2009) and exploring how these are related to the three TPB predictors. We also suggest that future research examine the impact of different cutoff scores, with the possibility of ranking students on intention to graduate and evaluating whether this ranking works to predict actual behavior. If so, then it can be possible to determine the nature of effective interventions to increase intention to graduate among these students by the school, government, families, and the students themselves.
References
ACT. (2006). National collegiate retention and persistence to degree rates: 2006. Retrieved from https://www.noellevitz.com/documents/shared/Papers_and_Research/ACT_Data/ACT_2006.pdf
Ajzen, I. (2002). Perceived behavioral control, self-efficacy, locus of control, and the theory of planned behavior. Journal of Applied Social Psychology, 32(4), 665-683. doi:10.1111/j.1559-1816.2002.tb00236.x.
Ajzen, I. (2012). The theory of planned behavior. In P. A. M. Lange, A. W. Kruglanski, & E. T. Higgins (Eds.), Handbook of theories of social psychology (Vol. 1, pp. 438-459). UK: Sage.
Ajzen, I. (n.d.). Theory of Planned Behavior. Retrieved from http://people.umass.edu/aizen/index.html
Baldessarini, R. J., Finklestein, S., & Arana, G. W. (1983). The predictive power of diagnostic tests and the effect of prevalence of illness. Archives of General Psychiatry, 40(5), 569-573. doi:10.1001/archpsyc.1983.01790050095011.
DaDeppo, L.M. (2009). Integration factors related to the academic success and intent to persist of college students with learning disabilities. Learning Disabilities Research & Practice, 24(3), 122-131.
Davis, L. E., Ajzen, I., Saunders, J., & Williams, T. (2002). The decision of African American students to complete high school: An application of the theory of planned behavior. Journal of Educational Psychology, 94(4), 810-819. doi:10.1037//0022-0663.94.4.810.
Dwyer, R. E., Hodson, R., & McCloud, L. (2013). Gender, debt, and dropping out

51
© 2016 The authors and IJLTER.ORG. All rights reserved.
of college. Gender & Society, 27(1), 30-55. doi:10.1177/0891243212464906. Fichten, C.S., Heiman, T., Jorgensen, M., Nguyen, M., Havel, A., King, L., Budd,
J., & Amsel, R. (2016). Theory of Planned Behavior predicts graduation intentions of Canadian and Israeli postsecondary students with and without learning disabilities/attention deficit hyperactivity disorder. International Journal of Higher Education, 5(1) Online. DOI: 10.5430/ijhe.v5n1p208
Fichten, C. S., Nguyen, M. N., Amsel, R., Jorgensen, S., Budd, J., Jorgensen, M., … & Barile, M. (2014). How well does the Theory of Planned Behavior predict graduation among college and university students with disabilities? Social Psychology of Education, 17(4), 657-685. doi:10.1007/s11218-014-9272-8.
Gentry, R. (2014). Sustaining college students' persistence and achievement through exemplary
instructional strategies. Research in Higher Education, 24. Retrieved from http://www.aabri.com/manuscripts/141918.pdf
Jorgensen, S., Ferraro, V., Fichten, C.S., & Havel, A. (2009). Predicting college retention and dropout: Sex and disability. (10 pages). ERIC (Education Resources Information Center) (ED505873).
Jorgensen, S., Fichten, C. S., Havel, A., Lamb, D., James, C., & Barile, M. (2005). Academic performance of college students with and without disabilities: An archival study. Canadian Journal of Counselling, 39(2), 101-117.
Jorgensen, S., Fichten, C.S., & Havel, A. (2008, October). Predicting student attrition - How helpful are surveys? Presentation at the Canadian Institutional Research and Planning Association (CIRPA) annual convention, Quebec, October 26-28, 2008. Retrieved from http://www.adaptech.org/sites/default/files/abPredictingStudentAttritionHowHelpful.pdf
Jorgensen, S., Fichten, C. S., & Havel, A. (2009). Academic success of graduates with and without disabilities – A comparative study of university entrance scores. Pédagogie Collégiale, 22(5), 26-29. Retrieved from http://www.adaptech.org/sites/default/files/AbAcademicSuccessOfGraduates.pdf
Kyle, V. A., White, K. M., Hyde, M. K., & Occhipinti, S. (2014). The role of goal importance in predicting university students' high academic performance. Australian Journal of Educational & Developmental Psychology, 14, 17-28.
MedicineNet.Com. ( n.d.). Definition of false positive. Retrieved from http://www.medicinenet.com/script/main/art.asp?articlekey=3377
Prentice, G.R., Caska, B. A., & McLaughlin, C. G. (2009) Examining psychology undergraduates’ statistics results using the Theory of Planned Behavior and background factors. Irish Journal of Psychology, 30(3-4), 161-170. doi:10.1080/03033910.2009.10446307.
Schuchart, C. (2013). Upward mobility among secondary education students: The decision to
obtain a better certificate. European Journal of Psychology of Education, 28(2), 201-221. doi:10.1007/s10212-012-0110-0.
Schunk, D. H., & Ertmer, P. A. (1999). Self-regulatory processes during computer

52
© 2016 The authors and IJLTER.ORG. All rights reserved.
skill acquisition: Goal and self-evaluative influences. Journal of Educational Psychology, 91(2), 251-260.
Selingo, J. J. (2015). Student success: Building a culture for retention and completion on college campuses. Chronicle of Higher Education & Blackboard. Retrieved from http://images.results.chronicle.com/Web/TheChronicleofHigherEducation/%7Bfaae77d0-4f3b-40ef-9fda-462c876d0789%7D_Student_Success_Survey_Blackborad.pdf
Stone, T.H., Jawahar, I.M., & Kisamore, J.L. (2010). Predicting academic misconduct intentions and behavior using the Theory of Planned Behavior and personality. Basic and Applied Social Psychology, 32(1), 35-45, DOI:10.1080/01973530903539895
Stupnisky, R. H., Renaud, R. D., Daniels, L. M., Haynes, T. L., & Perry, R. P. (2008). The interrelation of first-year college students' critical thinking disposition, perceived academic control, and academic achievement. Research in Higher Education, 49(6), 513-530. doi:10.1007/s11162-008-9093-8.
Tape, T. G. (undated). Plotting and interpreting an ROC curve. Interpreting diagnostic tests. Retrieved from http://gim.unmc.edu/dxtests/ROC2.htm
Thomas, D. (2014). Factors that influence college completion intention of undergraduate students. The Asia-Pacific Education Researcher, 23(2), 225-235. doi:10.1007/s40299-013-0099-4.