theory of melting of molecular crystals within the new modified model: the complete pictures of the...
TRANSCRIPT

ARTICLE IN PRESS
0378-4371/$ - se
doi:10.1016/j.ph
�CorrespondE-mail addr
Physica A 369 (2006) 484–492
www.elsevier.com/locate/physa
Theory of melting of molecular crystals within the new modifiedmodel: The complete pictures of the transition temperatures
Mustafa Keskina,�, Mustafa Yazıcıb, S- ukru Ozganb
aDepartment of Physics, Erciyes University, 38039 Kayseri, TurkeybDepartment of Physics, Kahramanmaras- Sutc- u Imam University, 46100 Kahramanmaras-, Turkey
Received 22 August 2005; received in revised form 16 November 2005
Available online 11 January 2006
Abstract
The new modified form of the Pople–Karasz theory of melting of molecular crystals was introduced and applied to
investigate the thermodynamics of melting, solid–solid, solid–nematic and nematic–isotropic liquid transitions in the
previous papers. In this paper, we give the complete pictures of the transition temperatures and compare with the original
Pople–Karasz (PK) theory and its previous modified theories. We also found that the new modified model also gives a
much better agreement with available experimental data for the solid–nematic transition than the PK and its previous
modified theories by using the different adjustable parameters.
r 2006 Elsevier B.V. All rights reserved.
Keywords: The new modified Pople–Karasz theory; Solid–liquid; Solid–solid; Solid–nematic and nematic–isotropic liquid transitions
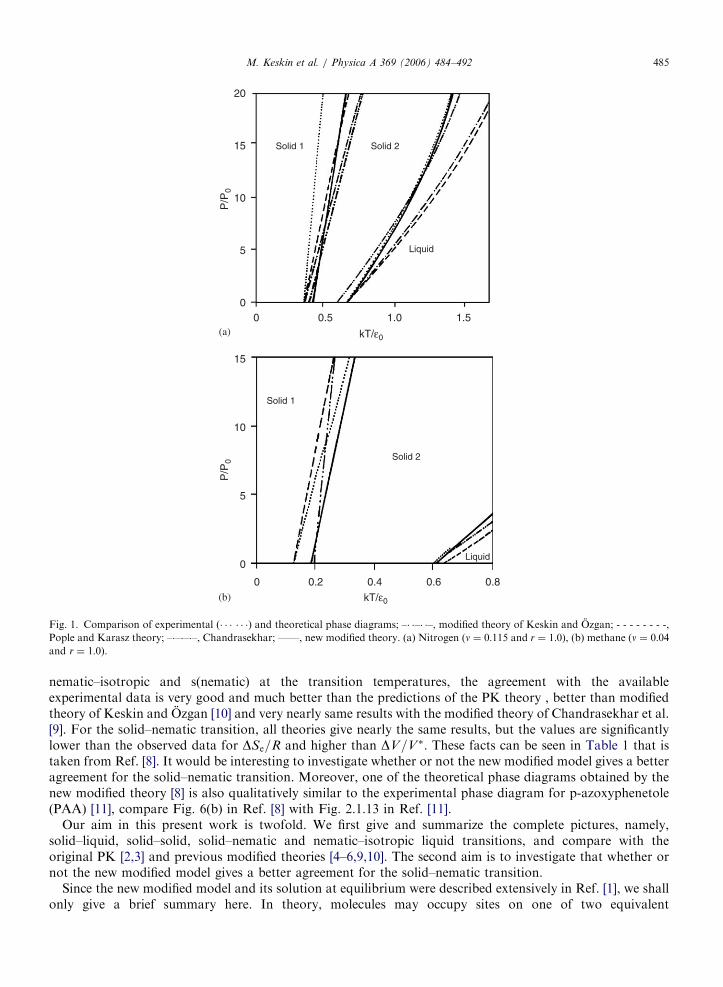
In a previous paper [1] we presented a new modified form of the Pople–Karasz (PK) theory of the melting ofthe molecular crystals [2] and discussed its applications to the melting (solid–liquid) and solid–solidtransitions. The quantitative predictions of the new modified theory was compared with availableexperimental data and found that for the melting transitions the agreement is excellent and much betterthan with the calculations of the PK theory [2,3] and its previous modified theories [4–6,10]. For example, weobtained the theoretical phase diagrams for nitrogen and methane in Figs. 1(a) and (b) (solid line), respectively[1]. These figures also contain the experimental data [7] (dotted line), the results of the PK theory [3] (dashedline), the modified theories of Chandrasekhar et al. [4] (dashed dotted line) and Keskin and Ozgan [5] (dasheddouble dotted line). From Fig. 1, one can see that the new modified theory gives a very good agreement formelting transitions in which the other theories do not give this kind of good agreement. Approximateagreement is obtained for the solid–solid transitions, however, for these transitions the experimentalagreement with the new modified theory is still better than previous modified theories except at zero and lowpressures. We also used this new modified theory to investigate thermodynamics of the solid–nematic andnematic–isotropic liquid transitions [8]. The results are compared with available data for some compounds [9]and the predictions of the original PK theory [2,3] and its previous modified theories [9,10]. For
e front matter r 2006 Elsevier B.V. All rights reserved.
ysa.2005.12.033
ing author.
ess: [email protected] (M. Keskin).
ARTICLE IN PRESS
P/P
0
Solid 2Solid 1
Liquid
1.51.00.500
5
20
10
15
P/P
0
kT/ε0
kT/ε0
15
10
5
0.20 0.6 0.80.4
0
Solid 1
Solid 2
Liquid
(a)
(b)
Fig. 1. Comparison of experimental (� � � � � �) and theoretical phase diagrams; –� �–� �–, modified theory of Keskin and Ozgan; - - - - - - - -,
Pople and Karasz theory; –�–�–�–, Chandrasekhar; ——, new modified theory. (a) Nitrogen (n ¼ 0:115 and r ¼ 1:0), (b) methane (n ¼ 0:04and r ¼ 1:0).
M. Keskin et al. / Physica A 369 (2006) 484–492 485
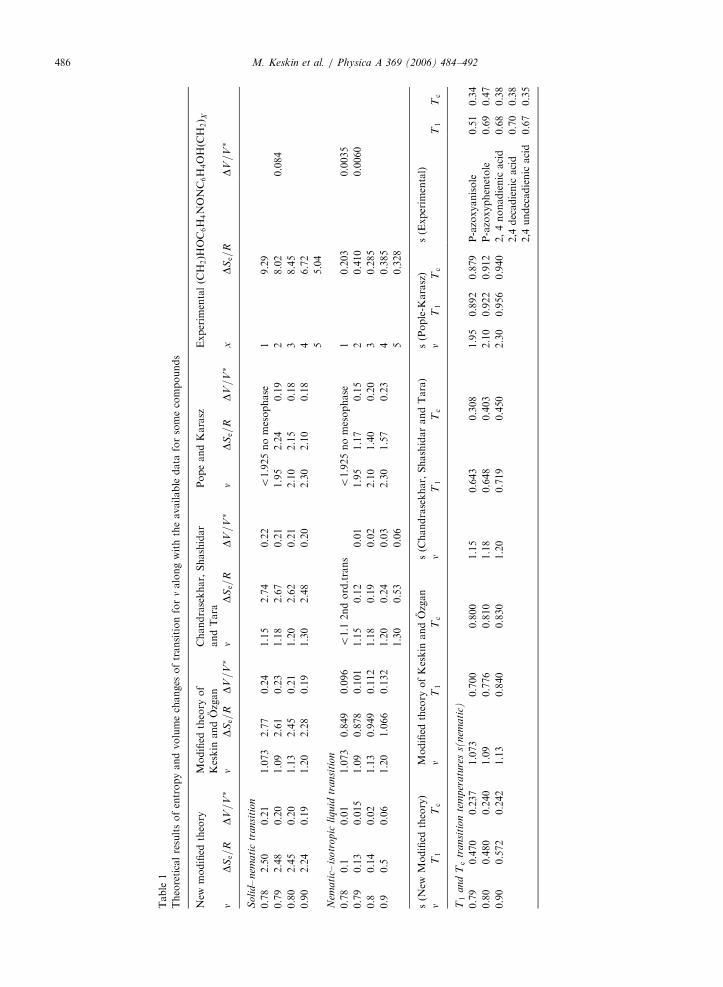
nematic–isotropic and s(nematic) at the transition temperatures, the agreement with the availableexperimental data is very good and much better than the predictions of the PK theory , better than modifiedtheory of Keskin and Ozgan [10] and very nearly same results with the modified theory of Chandrasekhar et al.[9]. For the solid–nematic transition, all theories give nearly the same results, but the values are significantlylower than the observed data for DSe=R and higher than DV=V�. These facts can be seen in Table 1 that istaken from Ref. [8]. It would be interesting to investigate whether or not the new modified model gives a betteragreement for the solid–nematic transition. Moreover, one of the theoretical phase diagrams obtained by thenew modified theory [8] is also qualitatively similar to the experimental phase diagram for p-azoxyphenetole(PAA) [11], compare Fig. 6(b) in Ref. [8] with Fig. 2.1.13 in Ref. [11].
Our aim in this present work is twofold. We first give and summarize the complete pictures, namely,solid–liquid, solid–solid, solid–nematic and nematic–isotropic liquid transitions, and compare with theoriginal PK [2,3] and previous modified theories [4–6,9,10]. The second aim is to investigate that whether ornot the new modified model gives a better agreement for the solid–nematic transition.
Since the new modified model and its solution at equilibrium were described extensively in Ref. [1], we shallonly give a brief summary here. In theory, molecules may occupy sites on one of two equivalent
ARTICLE IN PRESS
Table
1
Theoreticalresultsofentropyandvolumechanges
oftransitionfornalongwiththeavailable
data
forsomecompounds
New
modified
theory
Modified
theory
of
Keskin
andOzgan
Chandrasekhar,Shashidar
andTara
PopeandKarasz
Experim
entalðC
H2ÞH
OC
6H
4NONC
6H
4OHðC
H2Þ X
nD
Se=R
DV=V�
nD
Se=R
DV=V�
nD
Se=R
DV=V�
nD
Se=R
DV=V�
xD
Se=R
DV=V�
Soli
d–
nem
ati
ctr
ansi
tion
0.78
2.50
0.21
1.073
2.77
0.24
1.15
2.74
0.22
o1:925nomesophase
19.29
0.79
2.48
0.20
1.09
2.61
0.23
1.18
2.67
0.21
1.95
2.24
0.19
28.02
0.084
0.80
2.45
0.20
1.13
2.45
0.21
1.20
2.62
0.21
2.10
2.15
0.18
38.45
0.90
2.24
0.19
1.20
2.28
0.19
1.30
2.48
0.20
2.30
2.10
0.18
46.72
55.04
Nem
ati
c–is
otr
op
icli
qu
idtr
an
siti
on
0.78
0.1
0.01
1.073
0.849
0.096
o1:1
2ndord.trans
o1:925nomesophase
10.203
0.0035
0.79
0.13
0.015
1.09
0.878
0.101
1.15
0.12
0.01
1.95
1.17
0.15
20.410
0.0060
0.8
0.14
0.02
1.13
0.949
0.112
1.18
0.19
0.02
2.10
1.40
0.20
30.285
0.9
0.5
0.06
1.20
1.066
0.132
1.20
0.24
0.03
2.30
1.57
0.23
40.385
1.30
0.53
0.06
50.328
s(N
ewModified
theory)
Modified
theory
ofKeskin
andOzgan
s(C
handrasekhar,ShashidarandTara)
s(Pople-K
arasz)
s(Experim
ental)
nT
1T
cn
T1
Tc
nT
1T
cn
T1
Tc
T1
Tc
T1
an
dT
ctr
ansi
tion
tem
per
atu
res
s(nem
ati
c)
0.79
0.470
0.237
1.073
0.700
0.800
1.15
0.643
0.308
1.95
0.892
0.879
P-azoxyanisole
0.51
0.34
0.80
0.480
0.240
1.09
0.776
0.810
1.18
0.648
0.403
2.10
0.922
0.912
P-azoxyphenetole
0.69
0.47
0.90
0.572
0.242
1.13
0.840
0.830
1.20
0.719
0.450
2.30
0.956
0.940
2,4nonadienic
acid
0.68
0.38
2,4
decadienic
acid
0.70
0.38
2,4
undecadienic
acid
0.67
0.35
M. Keskin et al. / Physica A 369 (2006) 484–492486

ARTICLE IN PRESSM. Keskin et al. / Physica A 369 (2006) 484–492 487
interpenetrating lattices of N-sites, referred to as A- and B-sites, in order to allow for possibility of increasingdisorder in the positions of molecules in a crystal. It is also assumed that the molecule can take up one of twoorientations on any site, so that now we have four possibilities A1, A2, B1 and B2. If all molecules occupy sitesand orientations of the same type, say A1-sites, the state is perfect order (or solid at the zero temperature), andthe state of complete disorder (or the liquid phase) as one in which all four configurations are equallypopulated. It should be mentioned that there could also be states with a positional order and no orientationalorder and vice versa. It is assumed that each A-site is surrounded by z equivalent neighboring B-sites and eachB-site by z A-sites. Also the number of A-sites closest to any given A-site or the number of B-sites closest toany given B-site is z0. Moreover, there are three energies: The first one is W , the energy of the A1B1 or A2B2
interactions, the second one is W 0, the orientational energy of the A1A2 or B1B2 and the third one is W 00 whichis associated with positions and orientations together, hence W 00 is the energy of the A1B2 or A2B1interactionsas in Ref. [5] but it was neglected in the other theories [2,9]. Thus zW is the energy needed to transfer themolecule from one site to the other sites with the same orientation, e.g. A1 to B1. z0W 0 is the energy required toturn out the molecule from one orientation to the other orientation on the same site, e.g. from A1 to A2 whenremainder of the orientation is A1. Interactions between more distant neighbors are neglected. Since W 00 isassociated the positional and orientational energies, it should be combined with zW and z0W 0. We used simplythe arithmetic mean, including the adjustable parameter r. The reason including r factor is to obtain betteragreement with experimental data. Hence,
W 00 ¼ rzW þ z0W 0
2
� �. (1)
It is worthwhile to mention that this choice is arbitrary. Nevertheless, we have tried to use the geometric meanof W and W 0 in our previous modified works [5,6,10], but the better agreement with experimental data havebeen found by using the arithmetic mean of W and W 0. Hence, we also use the arithmetic mean in Refs. [1,8],and also in this paper. Up to this stage, the present theory is exactly the same with the modified PK theoryintroduced by Keskin and Ozgan [5].
On the other hand, to evaluate the contribution of the disorder to the various thermodynamic quantities it isnecessary to specify the dependence of W and W 0 on volume. Chandrasekhar et al. [12,13] found that theempirical trends in the properties, particularly for large orientational barriers which is the main region ofinterest in the present work, are reproduced well by the theory when W varies as V�4 and W 0 varies as V�3.Hence, W and W 0 can be defined explicitly as
W ¼W 0ðV 0=V Þ4
and
W 0 ¼W 00ðV 0=V Þ3, (2)
where W 0 and W 00 are the constants that depend on the properties of the material. W 0 is found to be 0:977�0,
as in the PK theory and differs slightly in the LJD theory [14] because the modified tables of Wentorf et al. [15]have been used. �0 is the energy minimum of the intermolecular potential. V 0 is the standard volume if themolecules are placed on fcc with a nearest-neighboring distance of 21=6r0 (r0 is the separation for zerointeraction). These definitions are introduced and used by Chandrasekhar et al. [4,9,12,13] to modify the PKtheory and investigating the melting of the molecular crystals. Therefore, the present modified theorycombines the modified theories of Chandrasekhar et al. [9] with Keskin and Ozgan [5] that are based on thePK theory [2].
The thermodynamic properties of the disordered system are evaluated relative to those of perfectly orderedone by the LACVM [16], which is identical to the MFA or the Bragg–Williams approximation. First, we definethe degree of a positional order Q, which is the fraction of the molecules in A-sites, related to the fraction ofB-sites, and the degree of orientational order S, where S is the fraction of the molecules in one orientation.
ARTICLE IN PRESSM. Keskin et al. / Physica A 369 (2006) 484–492488
Using the LACVM, the free energy per site for disorder is given [1]
f ¼bF
N¼ ðzW=kTÞf½ð1� 2S þ 2S2Þ þ rSð1� SÞ�Qð1�QÞ þ ðV=V 0Þn½ð1� 2Qþ 2Q2Þ þ rQð1�QÞ�
�Sð1� SÞg þ ½S lnS þ 2Q lnQþ ð1� SÞ lnð1� SÞ þ 2ð1�QÞ lnð1�QÞ�, ð3Þ
where f indicates the free energy contribution per site due to the disordering of Q and S. n ¼ z0W 00=zW 0 is a
measure of the relative energy barriers for the rotation of a molecule and for its diffusion to an interstitial site,and it is one of the key parameters in the theory. Hence the non-dimensional parameter n is supposedindependent of temperature and volume and is thus characteristic of the material. b ¼ 1=kT , where T is theabsolute temperature and k is the Boltzmann factor. The first curly bracket is the internal energy and thesecond bracket is due to the entropy of the disorder.
In order to present the complete pictures of the transition temperatures, the isotherms should be obtainedby evaluating the pressure as a function of volume, temperature and n. The pressure can be conveniently splitin two parts [2]
P ¼ P0 þ Pd, (4)
where P0 ¼ �ðqF0=qV ÞT and Pd ¼ �ðqFd=qV ÞT . The first part, P0 (or F0) gives the contribution due to thecompletely ordered solid and the second, Pd (or Fd) gives the contribution due to the disordering. F0 has beenobtained using the tabulated values of Wentorf et al. [15] on the basis of the Lennard–Jones 6–12intermolecular potential and three shell spherically smoothed cell fields (extrapolated to lower temperatureswhere necessary). The pressure Pd can be obtain as a function V=V 0, kT=�0 and n within the LACVM [1] as
PdV 0
NkT¼
zW
kT
� �4V 0
VQð1�QÞ½ð1� 2S þ 2S2Þ þ rSð1� SÞ� þ 3nSð1� SÞ½ð1� 2Qþ 2Q2Þ þ rQð1�QÞ�
� �.
(5)
Now, one can obtain the complete isotherms by adding P0V0=NkT to this equation. However, since thecomplete isotherms were obtained and their behavior were investigated in the previous papers, extensively[1,8], we will not present and investigate their behavior in this work.
As explained in the previous papers [1,8] and as well as the modified theory of Keskin and Ozgan [5,6,10],the transition temperatures depend on values of n, which is a measure of the relative energy barriers for therotation of a molecule and for its diffusion to an interstitial site, and the adjustable parameter, r. The reasonfor including the factor r is to obtain better agreement with the available experimental data. Calculations ofthe thermodynamic parameters in the rest of the paper have been carried out as a function of V=V 0 and kT=�0for a fcc lattice in terms of the Lennard–Jones potential, so that z ¼ 6 and z0 ¼ 12. Moreover, the calculationshave been performed for r ¼ 1:6, because our previous works [1,5,6,8,10] show that, in general, the agreementbetween our theories and the experimental data is better in this particular value of r. Therefore, in this workwe also took r ¼ 1:6 for the calculations of the complete pictures of the transition temperatures. Theapproximate ranges of n defining the different types of transition are calculated and given in Table 2 alongwith the PK and previous modified theories.
In order to see the complete pictures of transition temperatures, first we obtained reduced transitiontemperatures, kT=�0 (k is the Boltzmann factor and �0 is the energy minimum of intermolecular potential), ofsolid–liquid (S–L), solid–solid (S–S), solid–nematic (S–N) and nematic–isotropic liquid (N–I) transitions as afunction of n, together with the values given by the PK and previous modified theories, seen in Fig. 2. Second,volume changes, DV=V� (DV is the increase in volume and V� is the volume of phase immediately below thetransition), S–L, S–S, S–N and N–I transitions as a function of n are calculated and illustrated in Fig. 3 alongwith the PK [3] and previous modified theories [4,17].
On the other hand, the changes of entropy DSe of S–L, S–S, S–N and N–I transitions as a function of n canbe found by calculating the entropies of the two phases in equilibrium form
Se ¼ S0 þ Sd, (6)
S0 ¼ �ðqF 0=qTÞV and Sd ¼ �ðqFd=qTÞV . (7)

ARTICLE IN PRESS
Table 2
The ranges of n defining types of transition for the new modified model, the PK and the other two modified theories
New modified theory Modified theory of
Keskin and Ozgan
Pope and Karasz Chandrasekhar,
Shashidar and Tara
Types of transitions
no0:302 no0:331 no0:325 no0:298 Two transitions, solid–solid rotational
transition preceding the melting transition
no0:24 no0:25 no0:17 no0:264 Second-order solid–solid Transition
0:24ono0:302 0:25ono0:331 0:17ono0:325 0:264ono0:298 First-order solid–solid transition
0:302ono0:75 0:331ono1:115 0:325ono1:925 0:298ono0:975 Single transition
n40:75 n41:115 n41:925 n40:975 Two transitions, positional melting
preceding the rotational melting
No second order No second order No second order 0:975ono1:047 Second-order mesomorphic–isotropic
transition
n40:75 n41:115 n41:1925 n41:047 First-order mesomorphic–isotropic
transition
kT /
ε 0
S-N
0.8
S-S
S-L
1.2
S-L
N-I
0.0 0.4
0.6
0.0
0.4
0.2
ν
Fig. 2. Reduced transition temperatures, kT=�0, of solid–liquid (S–L), solid–nematic (S–N) and nematic–isotropic (N–I) liquid transitions
as a function of n; –� �–� �–, modified theory of Keskin and Ozgan; - - - - - - - -, Pople and Karasz theory; –�–�–�-, Chandrasekhar et al.; ——,
new modified theory.
M. Keskin et al. / Physica A 369 (2006) 484–492 489
Using Eqs. (1) and (7), Sd can be found
Sd
R¼ �½S lnS þ 2Q lnQþ ð1� SÞ lnð1� SÞ þ 2ð1�QÞ lnð1�QÞ�, (8)
where R is the gas constant. S0 and Sd are entropies of ordering and disordering of the system, respectively. S0
is taken from the tabulated values of Wentorf et al. [15]. The changes of entropy, DSe=R, of S–L, S–S, S–Nand N–I transitions as a function of n, together with the values given by the PK and previous modified theoriesis plotted in Fig. 4. We should also mention that all these figures aree obtained with the help of the isothermswhich were explained in the previous papers extensively [1,8].
It is seen from Figs. 2 to 4 that the PK and the modified theories give nearly the same results for no0:75, butfor nX0:75 the new modified model and the previous modified models give nearly the same results. The largestdifference between the PK and modified theories occurs during the first-order mesomorphic–isotropictransition. This transition comes forth at n ¼ 1:925 in the PK theory [3,4], at n ¼ 1:115 in the modified theoryof Keskin and Ozgan [10,17], at n ¼ 1:047 in the modified theory of Chandrasekhar et al. [4] and at n ¼ 0:75 in

ARTICLE IN PRESS
ν
1.0
2.0
0.0 0.4
3.0
0.00.8
S-L
S-N
S-S
S-L
1.2
N-I
∆Se/
R
Fig. 4. Entropy changes of S–L, S–N and N–I liquid transitions as a function of n; –� �–� �–, modified theory of Keskin and Ozgan; - - - - - - -,
Pople and Karasz theory; –�–�–�–, Chandrasekhar et al.; ——, new modified theory.
0.0ν
0.2
0.1
S-L
0.3
S-S
S-N
N-I
1.20.8
S-L
0.40.0
∆V/V
*
Fig. 3. Relative volume changes of S–L, S–N and N–I liquid transitions as a function of n; –� �–� �–�, modified theory of Keskin and Ozgan;
- - - - - - - -, Pople and Karasz theory; –�–�–�-, Chandrasekhar et al.; ——, new modified theory.
M. Keskin et al. / Physica A 369 (2006) 484–492490
the new modified theory. Due to this fact, the modified theories give nearly the same DV=V� and DSe=R forthe N–I transitions, and for the s (nematic) at the transition temperatures T1 and T c. Nevertheless, if oneexamines the available experimental data one can see that the modified theory of Chandrasekhar et al. [9] andthe new modified theory [8] give much better agreement with the experimental data, as seen in Table 1. On theother hand, the small difference between the new modified model and previous models for no0:75 leads agood agreement between the new modified model and the available experimental data [1]. More specifically,for melting transitions the agreement is excellent and much better than with the calculations of the PK theoryand its previous modified theories. Approximate agreement is obtained for the S–S transitions. However, forthese transitions the experimental agreement with the present modified theory is still better than previousmodified theories except at zero and low pressures.
ARTICLE IN PRESS
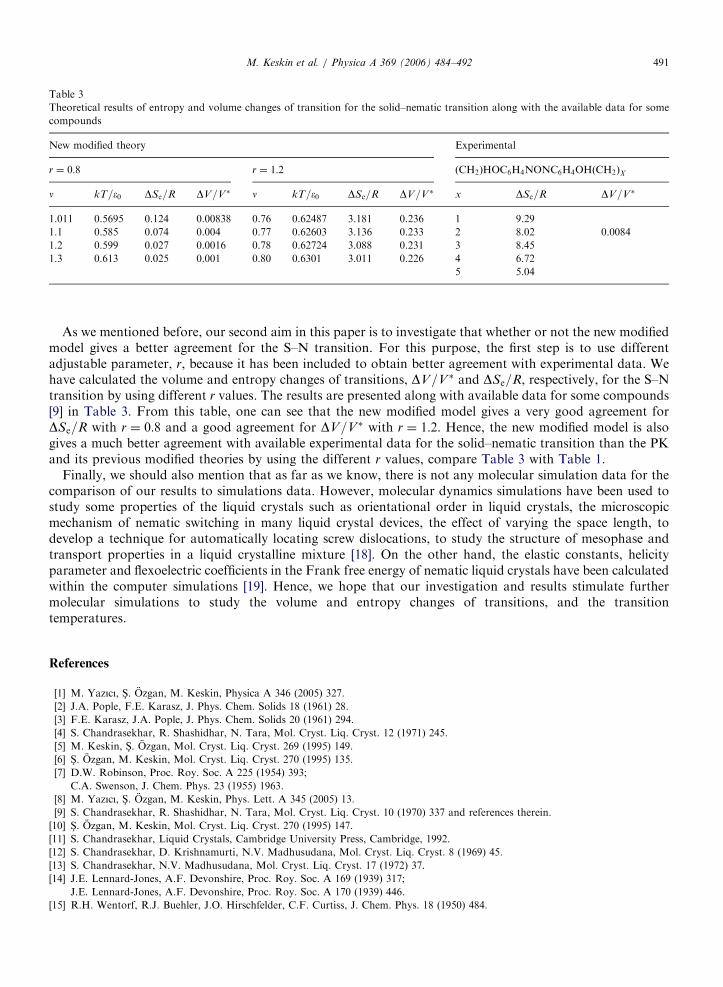
Table 3
Theoretical results of entropy and volume changes of transition for the solid–nematic transition along with the available data for some
compounds
New modified theory Experimental
r ¼ 0:8 r ¼ 1:2 ðCH2ÞHOC6H4NONC6H4OHðCH2ÞX
n kT=�0 DSe=R DV=V� n kT=�0 DSe=R DV=V� x DSe=R DV=V�
1.011 0.5695 0.124 0.00838 0.76 0.62487 3.181 0.236 1 9.29
1.1 0.585 0.074 0.004 0.77 0.62603 3.136 0.233 2 8.02 0.0084
1.2 0.599 0.027 0.0016 0.78 0.62724 3.088 0.231 3 8.45
1.3 0.613 0.025 0.001 0.80 0.6301 3.011 0.226 4 6.72
5 5.04
M. Keskin et al. / Physica A 369 (2006) 484–492 491
As we mentioned before, our second aim in this paper is to investigate that whether or not the new modifiedmodel gives a better agreement for the S–N transition. For this purpose, the first step is to use differentadjustable parameter, r, because it has been included to obtain better agreement with experimental data. Wehave calculated the volume and entropy changes of transitions, DV=V� and DSe=R, respectively, for the S–Ntransition by using different r values. The results are presented along with available data for some compounds[9] in Table 3. From this table, one can see that the new modified model gives a very good agreement forDSe=R with r ¼ 0:8 and a good agreement for DV=V� with r ¼ 1:2. Hence, the new modified model is alsogives a much better agreement with available experimental data for the solid–nematic transition than the PKand its previous modified theories by using the different r values, compare Table 3 with Table 1.
Finally, we should also mention that as far as we know, there is not any molecular simulation data for thecomparison of our results to simulations data. However, molecular dynamics simulations have been used tostudy some properties of the liquid crystals such as orientational order in liquid crystals, the microscopicmechanism of nematic switching in many liquid crystal devices, the effect of varying the space length, todevelop a technique for automatically locating screw dislocations, to study the structure of mesophase andtransport properties in a liquid crystalline mixture [18]. On the other hand, the elastic constants, helicityparameter and flexoelectric coefficients in the Frank free energy of nematic liquid crystals have been calculatedwithin the computer simulations [19]. Hence, we hope that our investigation and results stimulate furthermolecular simulations to study the volume and entropy changes of transitions, and the transitiontemperatures.
References
[1] M. Yazıcı, S- . Ozgan, M. Keskin, Physica A 346 (2005) 327.
[2] J.A. Pople, F.E. Karasz, J. Phys. Chem. Solids 18 (1961) 28.
[3] F.E. Karasz, J.A. Pople, J. Phys. Chem. Solids 20 (1961) 294.
[4] S. Chandrasekhar, R. Shashidhar, N. Tara, Mol. Cryst. Liq. Cryst. 12 (1971) 245.
[5] M. Keskin, S- . Ozgan, Mol. Cryst. Liq. Cryst. 269 (1995) 149.
[6] S- . Ozgan, M. Keskin, Mol. Cryst. Liq. Cryst. 270 (1995) 135.
[7] D.W. Robinson, Proc. Roy. Soc. A 225 (1954) 393;
C.A. Swenson, J. Chem. Phys. 23 (1955) 1963.
[8] M. Yazıcı, S- . Ozgan, M. Keskin, Phys. Lett. A 345 (2005) 13.
[9] S. Chandrasekhar, R. Shashidhar, N. Tara, Mol. Cryst. Liq. Cryst. 10 (1970) 337 and references therein.
[10] S- . Ozgan, M. Keskin, Mol. Cryst. Liq. Cryst. 270 (1995) 147.
[11] S. Chandrasekhar, Liquid Crystals, Cambridge University Press, Cambridge, 1992.
[12] S. Chandrasekhar, D. Krishnamurti, N.V. Madhusudana, Mol. Cryst. Liq. Cryst. 8 (1969) 45.
[13] S. Chandrasekhar, N.V. Madhusudana, Mol. Cryst. Liq. Cryst. 17 (1972) 37.
[14] J.E. Lennard-Jones, A.F. Devonshire, Proc. Roy. Soc. A 169 (1939) 317;
J.E. Lennard-Jones, A.F. Devonshire, Proc. Roy. Soc. A 170 (1939) 446.
[15] R.H. Wentorf, R.J. Buehler, J.O. Hirschfelder, C.F. Curtiss, J. Chem. Phys. 18 (1950) 484.

ARTICLE IN PRESSM. Keskin et al. / Physica A 369 (2006) 484–492492
[16] R. Kikuchi, Phys. Rev. 81 (1951) 988.
[17] S- . Ozgan, M. Keskin, Mol. Cryst. Liq. Cryst. 287 (1996) 265.
[18] See, e.g., D. Sandstrom, A. V. Komolkin, A. Maliniak, J. Chem. Phys. 104 (1996) 9620;
M.R. Wilson, J. Chem. Phys. 107 (1997) 8654;
D. Sandstrom, A.V. Komolkin, A. Maliniak, J. Chem. Phys. 106 (1997) 7438;
M. Allen, M.A. Warren, M.R. Wilson, Phys. Rev. E 57 (1998) 5585;
A.V. Lyulin, M.S. Al-Barwani, M.P. Allen, M.R. Wilson, I. Neelov, N.K. Allsopp, Macromolecules 31 (1998) 4626;
C. McBride, M.R. Wilson J.A.K. Howard, Mol. Phys. 93 (1998) 955.
[19] M.P. Allen, A.J. Masters, J. Mater. Chem. 11 (2001) 2678.