theory, experimentation and numerical modelling of … lecture_part 1_ziskind.pdf · theory,...
TRANSCRIPT

1
Theory, experimentation and numerical modelling of thermal-fluid processes in PCMs
Part I
Gennady Ziskind
Heat Transfer LaboratoryDepartment of Mechanical Engineering
Ben-Gurion University of the NegevBeer-Sheva, Israel
1
Motivation
2
Large heat-storage capacity of phase-change
materials (PCMs) makes them attractive for use
in various thermal energy storage systems
where their latent heat is utilized.
There exists a wide range of applications for
such systems, from energy storage in buildings
to electronics cooling and thermal management
of air- and spacecraft.

2
Application: heat storage facilities
3
Application: cooling of electronics
4
3
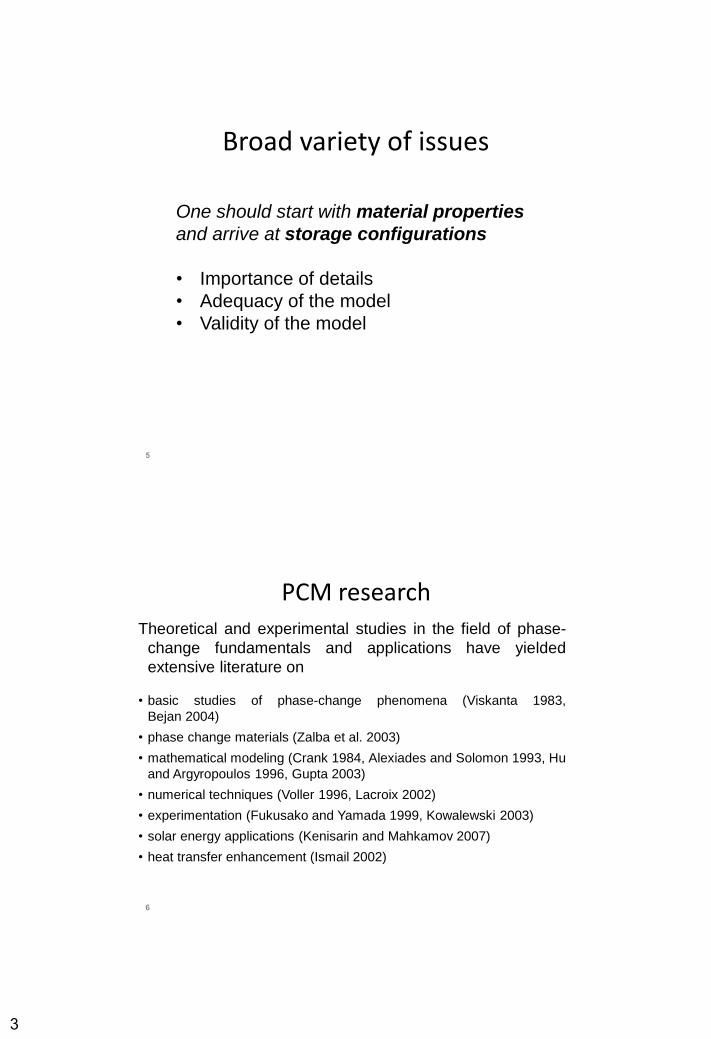
Broad variety of issues
5
One should start with material properties
and arrive at storage configurations
• Importance of details
• Adequacy of the model
• Validity of the model
PCM research
6
Theoretical and experimental studies in the field of phase-
change fundamentals and applications have yielded
extensive literature on
• basic studies of phase-change phenomena (Viskanta 1983,
Bejan 2004)
• phase change materials (Zalba et al. 2003)
• mathematical modeling (Crank 1984, Alexiades and Solomon 1993, Hu
and Argyropoulos 1996, Gupta 2003)
• numerical techniques (Voller 1996, Lacroix 2002)
• experimentation (Fukusako and Yamada 1999, Kowalewski 2003)
• solar energy applications (Kenisarin and Mahkamov 2007)
• heat transfer enhancement (Ismail 2002)

4
Books since 2000
7
A. Faghri, Y. Zhang, Transport
Phenomena in Multiphase Systems,
2006.
Outline of this talk
8
• Heat transfer in phase change processes - recent
developments
• Geometries suggested for:
- latent-heat thermal energy
storage (LHTES) systems
- electronics cooling
• Numerical and experimental approaches that could
lead to reliable results and their generalization
Kenisarin and Mahkamov (2007)

5
Beyond the scope
• Phase-change slurries and micro-encapsulated PCM
• PCM-soaked graphite matrices
• Enhancement techniques other then fins(metal honeycombs, metal matrices, conductive particles…)
• Water-ice systems(i.e. cases in which solid is denser than liquid)
9
Classical formulationOne-dimensional phase change (solidification)
10
SLx x
0 SLx x 2
2
1S S
S
T T
tx
SLx x2
2
1L L
L
T T
tx
S SL L SL mT ( x ,t ) T ( x ,t ) T
S SL L SL SLS L
T ( x ,t ) T ( x ,t ) dxk k L
x x dt
2c
Ste tl
p m wc T T
SteL
Dimensionless time Stefan number
• Even one-dimensional conduction-governed phase
change is a non-linear problem
6
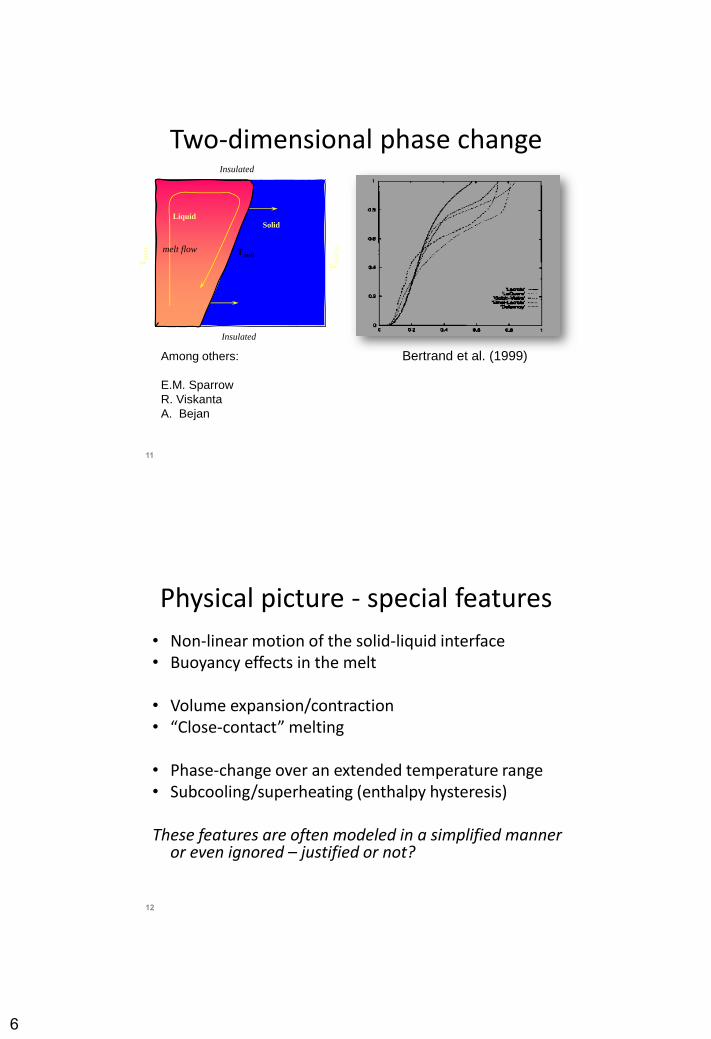
Two-dimensional phase change
11
TC
OL
D
TH
OT
Solid
Insulated
Tmelt
Liquid
Insulated
melt flow
Bertrand et al. (1999)Among others:
E.M. Sparrow
R. Viskanta
A. Bejan
Physical picture - special features
• Non-linear motion of the solid-liquid interface• Buoyancy effects in the melt
• Volume expansion/contraction• “Close-contact” melting
• Phase-change over an extended temperature range • Subcooling/superheating (enthalpy hysteresis)
These features are often modeled in a simplified manner or even ignored – justified or not?
12

7
Methods of our studies
13
Numerical:• Enthalpy formulation
• Enthalpy-porosity approach for the phase-change region
inside the PCM
• Volume-of-fluid (VOF) model for the PCM-air system
with a moving internal interface
Experimental:• Commercially available paraffin-type materials
• Temperature-controlled environment
Verification and validation
• “Verification” ~ solving the equations right
• “Validation” ~ solving the right equations
Patrick J. Roache
Verification and validation in computational science
and engineering (1998, p. 23)
Accordingly, careful examination is performed in every case
• Grid size/structure and time-step dependence
• Comparison with experiments
Not only overall results but also patterns are compared
14

8
Melting
15
Geometries:
• Cylindrical shells (tubes)
• Spherical shells
• Finned systems
Features:
• Time to complete the process
• Melting patterns
• Instant melt fractions and heat fluxes
Objective:
• Generalization
Vertical tube
16
L. Fraiman, E. Benisti ,G. Ziskind, R. Letan
ASME Biennial ESDA Conference, Haifa 2008 Sparrow and Broadbent (1982)
Pal and Joshi (2001)
(tall enclosure)

9
Summary of experimental results
17
• Melting time from 2.5 to about 70 minutes
Generalized results and correlation
18
9 4
1 1 1 3/
MF X / .
10
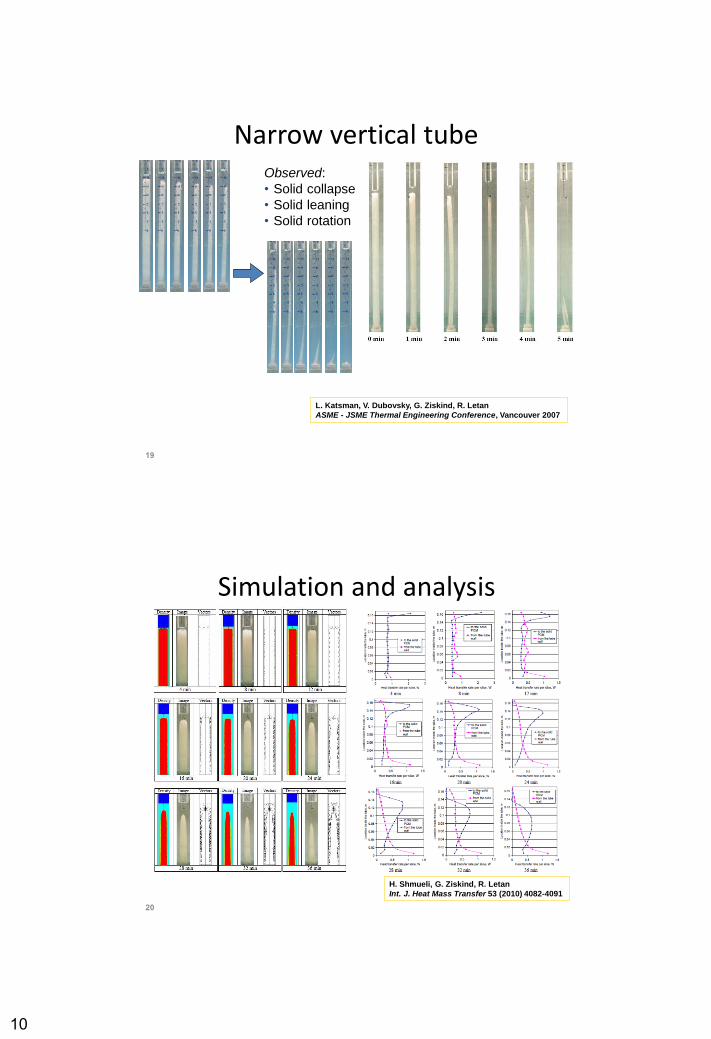
Narrow vertical tube
19
Observed:
• Solid collapse
• Solid leaning
• Solid rotation
L. Katsman, V. Dubovsky, G. Ziskind, R. Letan
ASME - JSME Thermal Engineering Conference, Vancouver 2007
Simulation and analysis
20
H. Shmueli, G. Ziskind, R. Letan
Int. J. Heat Mass Transfer 53 (2010) 4082-4091
11
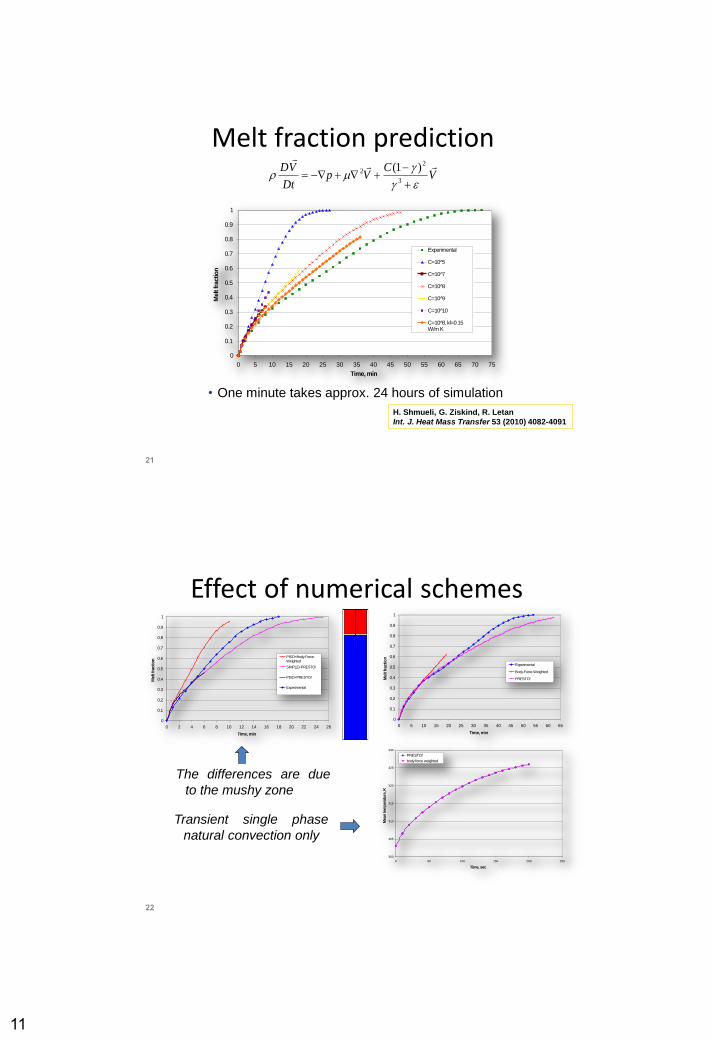
Melt fraction prediction
21
0
0.1
0.2
0.3
0.4
0.5
0.6
0.7
0.8
0.9
1
0 5 10 15 20 25 30 35 40 45 50 55 60 65 70 75
Time, min
Melt fra
ction
Experimental
C=10 5̂
C=10 7̂
C=10 8̂
C=10 9̂
C=10 1̂0
C=10 8̂, kl=0.15W/m K
VC
VpDt
VD
3
22 )1(
H. Shmueli, G. Ziskind, R. Letan
Int. J. Heat Mass Transfer 53 (2010) 4082-4091
• One minute takes approx. 24 hours of simulation
Effect of numerical schemes
22
0
0.1
0.2
0.3
0.4
0.5
0.6
0.7
0.8
0.9
1
0 2 4 6 8 10 12 14 16 18 20 22 24 26
Time, min
Melt fra
ctio
n
PISO+Body-Force-Weighted
SIMPLE+PRESTO!
PISO+PRESTO!
Experimental
0
0.1
0.2
0.3
0.4
0.5
0.6
0.7
0.8
0.9
1
0 5 10 15 20 25 30 35 40 45 50 55 60 65
Time, min
Melt fra
ctio
n
Experimental
Body-Force-Weighted
PRESTO!
300
305
310
315
320
325
330
0 50 100 150 200 250
Time, sec
Mean tem
pera
ture
, K
PRESTO!
body force weighted
Transient single phase
natural convection only
The differences are due
to the mushy zone

12
Spherical shell: Experimental
23
When the solid is fixed by some
mechanical obstacle, both melting
patterns and qualitative characteristics
of the process become entirely different
(Khodadadi and Zhang 2001, compare
also Ettouney et al. 2005, Felix Regin et
al. 2006)
• Laboratory studies could lead to results rather different
from those in real systems
E. Assis, L. Katzman, G. Ziskind, R. Letan
Int. J. Heat Mass Transfer 50 (2007) 1790-1804
24
Spherical shell: Modeling
Fomin and Saitoh (1999)
(based on Bareiss and Beer 1984(
13
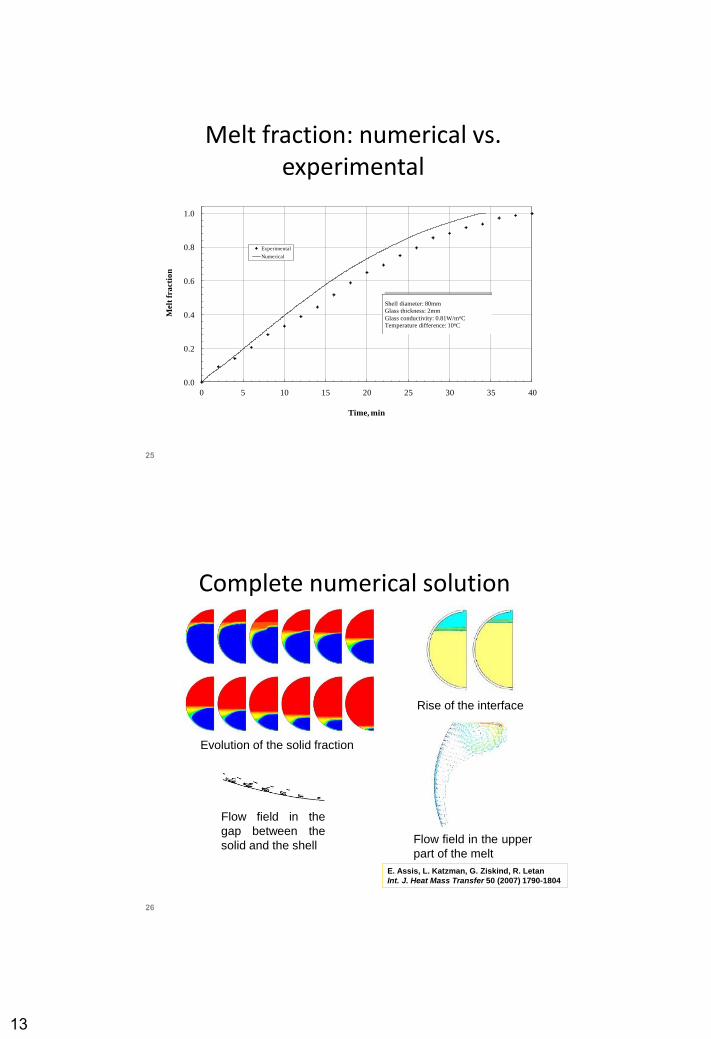
Melt fraction: numerical vs. experimental
0.0
0.2
0.4
0.6
0.8
1.0
0 5 10 15 20 25 30 35 40
Melt
fra
cti
on
Time, min
Experimental
Numerical
Shell diameter: 80mm
Glass thickness: 2mm
Glass conductivity: 0.81W/moC
Temperature difference: 10oC
25
Complete numerical solution
26
Evolution of the solid fraction
Flow field in the upper
part of the melt
Flow field in the
gap between the
solid and the shell
Rise of the interface
E. Assis, L. Katzman, G. Ziskind, R. Letan
Int. J. Heat Mass Transfer 50 (2007) 1790-1804

14
Melt fraction correlation
27
• Stefan numbers smaller than 0.1 are characteristic
to latent-heat thermal storage systems
28
15
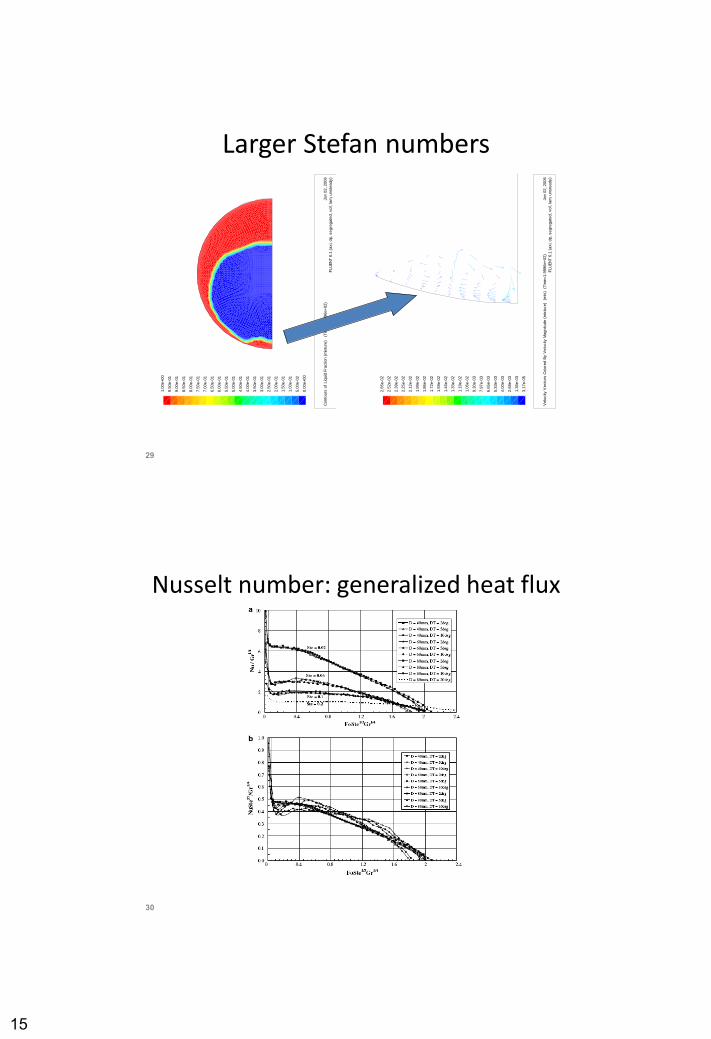
Larger Stefan numbers
Conto
urs
of
Liq
uid
Fra
ctio
n (
mix
ture
) (T
ime=1.9
996e+02)
FLU
EN
T 6
.1 (
axi,
dp, segre
gate
d, vof,
lam
, unste
ady)
Jan 0
2, 2006
1.0
0e+00
9.5
0e-0
1
9.0
0e-0
1
8.5
0e-0
1
8.0
0e-0
1
7.5
0e-0
1
7.0
0e-0
1
6.5
0e-0
1
6.0
0e-0
1
5.5
0e-0
1
5.0
0e-0
1
4.5
0e-0
1
4.0
0e-0
1
3.5
0e-0
1
3.0
0e-0
1
2.5
0e-0
1
2.0
0e-0
1
1.5
0e-0
1
1.0
0e-0
1
5.0
0e-0
2
0.0
0e+00
Velo
city
Vecto
rs C
olo
red B
y V
elo
city
Magnitu
de (
mix
ture
) (
m/s
) (
Tim
e=1.9
996e+02)
FLU
EN
T 6
.1 (
axi,
dp, segre
gate
d, vof,
lam
, unste
ady)
Jan 0
2, 2006
2.6
5e-0
2
2.5
2e-0
2
2.3
9e-0
2
2.2
5e-0
2
2.1
2e-0
2
1.9
9e-0
2
1.8
6e-0
2
1.7
2e-0
2
1.5
9e-0
2
1.4
6e-0
2
1.3
3e-0
2
1.1
9e-0
2
1.0
6e-0
2
9.3
0e-0
3
7.9
7e-0
3
6.6
5e-0
3
5.3
3e-0
3
4.0
0e-0
3
2.6
8e-0
3
1.3
6e-0
3
3.1
7e-0
5
29
Nusselt number: generalized heat flux
30
16
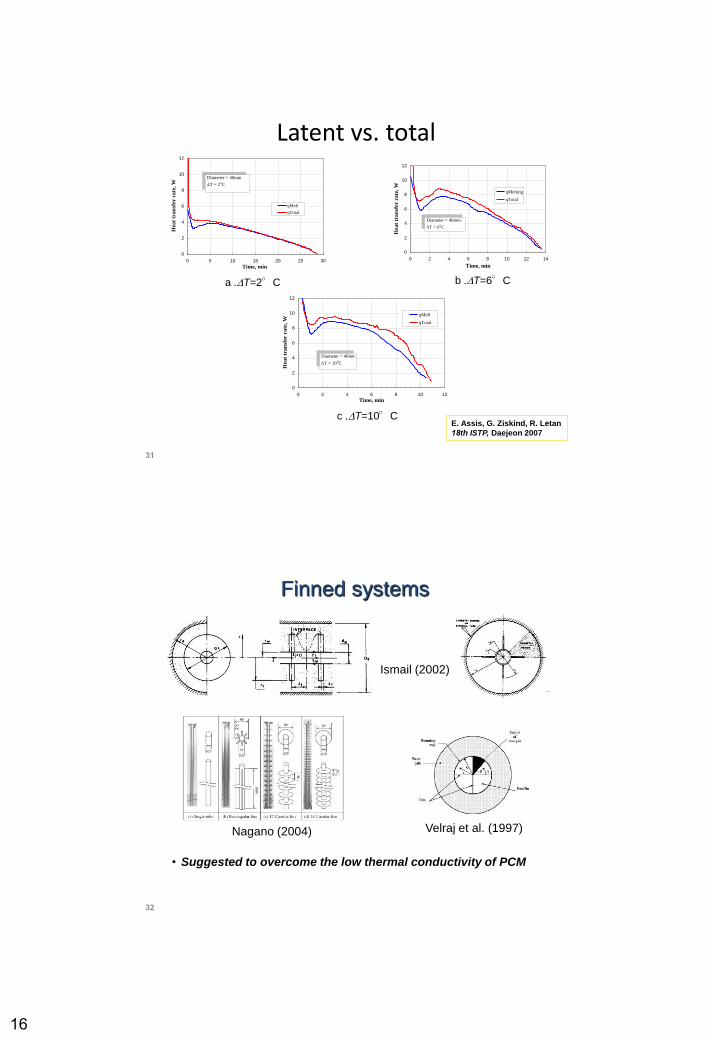
Latent vs. total
31
0
2
4
6
8
10
12
0 5 10 15 20 25 30
Time, min
Hea
t tr
an
sfer
ra
te,
W
qMelt
qTotal
Diameter = 40mm
T = 2oC
a .T=2°C
0
2
4
6
8
10
12
0 2 4 6 8 10 12 14
Time, min
Hea
t tr
an
sfer
rate
, W
qMelting
qTotal
Diameter = 40mm
T = 6oC
b .T=6°C
0
2
4
6
8
10
12
0 2 4 6 8 10 12
Time, min
Hea
t tr
an
sfer
ra
te,
W
qMelt
qTotal
Diameter = 40mm
T = 10oC
c .T=10°CE. Assis, G. Ziskind, R. Letan
18th ISTP, Daejeon 2007
32
Finned systems
Ismail (2002)
Nagano (2004) Velraj et al. (1997)
• Suggested to overcome the low thermal conductivity of PCM

17
33
Detailed parametric study
34
Computational domain
V. Shatikian, G. Ziskind, R. Letan
Int. J. Heat Mass Transfer 48 (2005) 3689-3706

18
Examples
35
Dimensional analysis
36
Fin efficiency accounted for
Melt fraction vs. FoSte

19
Effect of convection
37
Ra included
Heat flux at the base
Figure 1. Definition of the problem.
Table 1. Geometry parameters.
Case lf, mm lt, mm lb, mm
1 10 1.2 4
2 10, 15, 20 0.6 2
3 10 0.3 1
l f
lb
lt
Air
q''w
PC
M
fin computational domain
base
38
V. Shatikian, G. Ziskind, R. Letan
Int. J. Heat Mass Transfer 51 (2008) 1488-1493
20
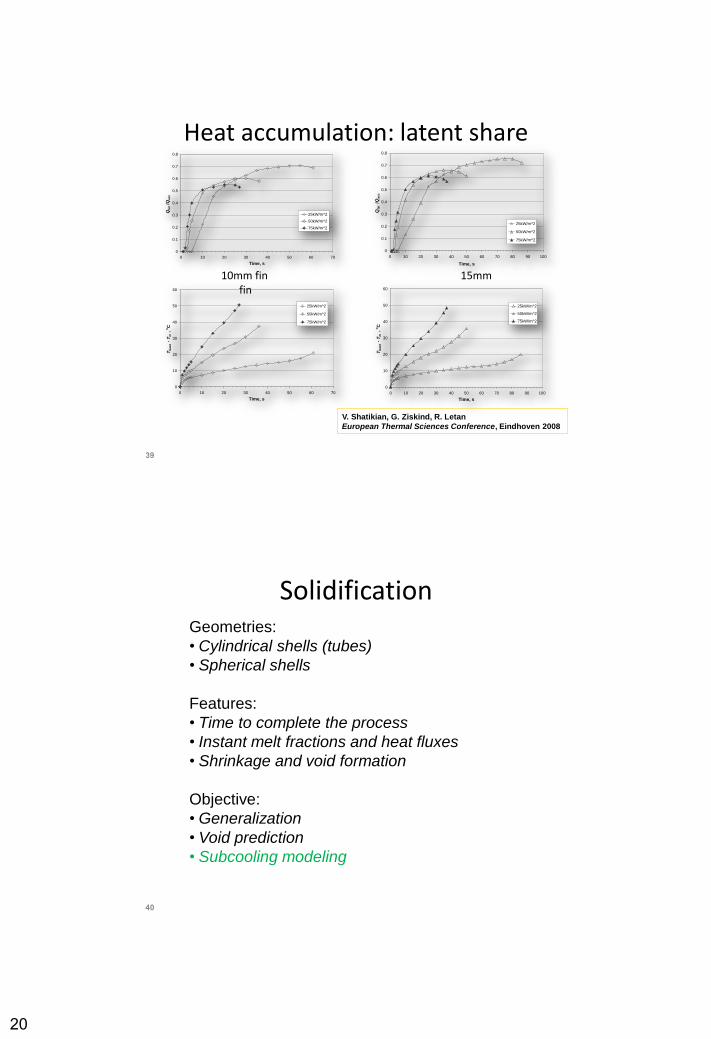
Heat accumulation: latent share
10mm fin 15mm fin
39
0
0.1
0.2
0.3
0.4
0.5
0.6
0.7
0.8
0 10 20 30 40 50 60 70
Time, s
Qla
t / Q
acc
25kW/m^2
50kW/m^2
75kW/m^2
0
10
20
30
40
50
60
0 10 20 30 40 50 60 70
Time, s
Tb
as
e - T
m ,
oC
25kW/m^2
50kW/m^2
75kW/m^2
0
0.1
0.2
0.3
0.4
0.5
0.6
0.7
0.8
0 10 20 30 40 50 60 70 80 90 100
Time, s
Qla
t /
Qa
cc
25kW/m^2
50kW/m^2
75kW/m^2
0
10
20
30
40
50
60
0 10 20 30 40 50 60 70 80 90 100
Time, s
Tb
as
e -
Tm
, o
C
25kW/m^2
50kW/m^2
75kW/m^2
V. Shatikian, G. Ziskind, R. Letan
European Thermal Sciences Conference, Eindhoven 2008
Solidification
40
Geometries:
• Cylindrical shells (tubes)
• Spherical shells
Features:
• Time to complete the process
• Instant melt fractions and heat fluxes
• Shrinkage and void formation
Objective:
• Generalization
• Void prediction
• Subcooling modeling

21
Cylindrical shell: cooling direction
41
Adiabatic bottom
Cooled bottom
Experimental
Liquid
Air
Shell
H
H*
D
Model
V. Dubovsky, E. Assis, E. Kochavi, G. Ziskind, R. Letan
European Thermal Sciences Conference, Eindhoven 2008
Shamsundar and
Sparrow (1976)
Cylindrical shell: analysis
42
Same T
Same size
Melt fraction vs. time
Melt fraction vs. time
Melt fraction vs. Fo
Melt fraction vs. FoSte
22
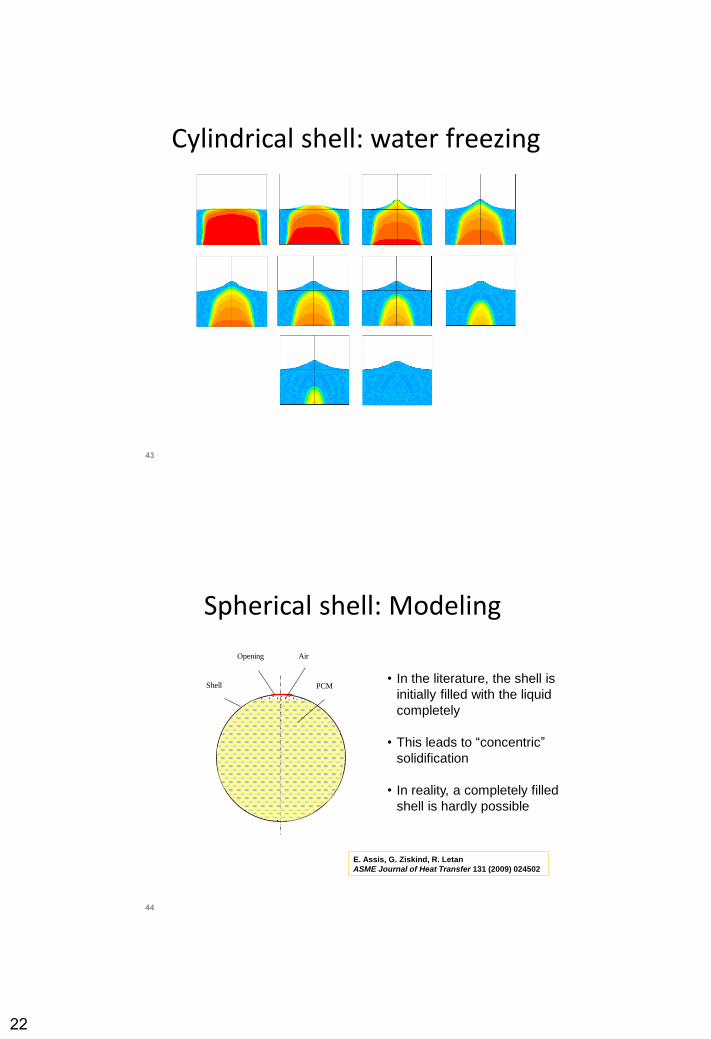
Cylindrical shell: water freezing
43
Spherical shell: Modeling
44
Shell
Opening Air
PCM
E. Assis, G. Ziskind, R. Letan
ASME Journal of Heat Transfer 131 (2009) 024502
• In the literature, the shell is
initially filled with the liquid
completely
• This leads to “concentric”
solidification
• In reality, a completely filled
shell is hardly possible
23
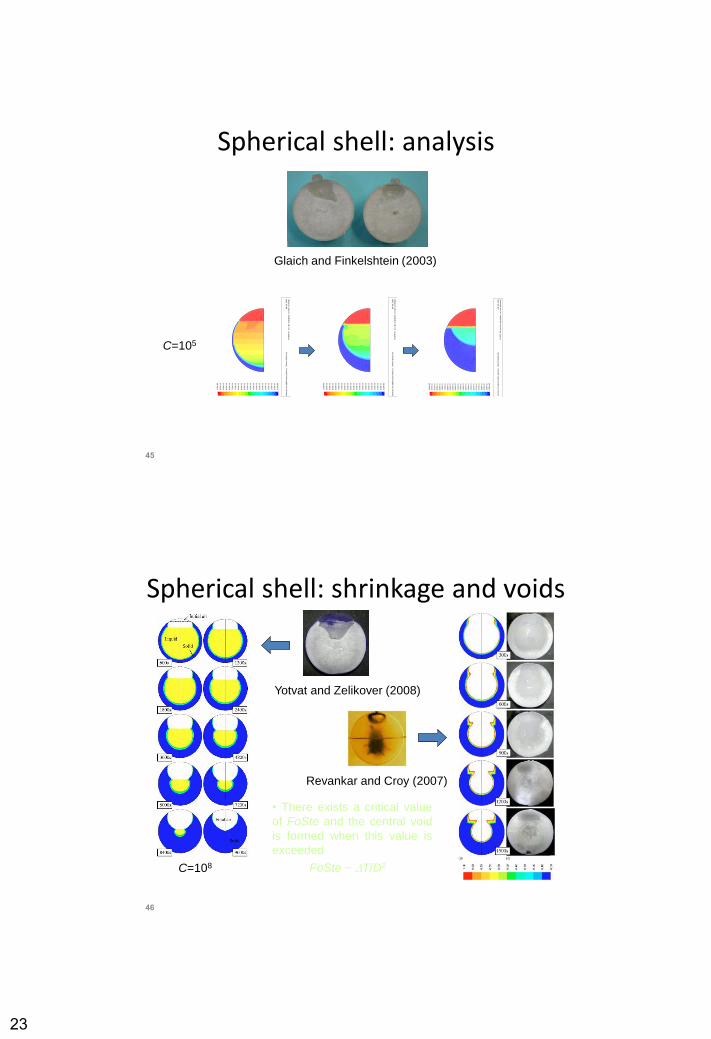
Spherical shell: analysis
45
Glaich and Finkelshtein (2003)
Conto
urs
of
Liq
uid
Fra
ctio
n (
mix
ture
) (T
ime=4.8
000e+03)
FLU
EN
T 6
.1 (
axi,
dp, segre
gate
d, vof,
lam
, unste
ady)
Mar
16, 2006
1.0
0e+00
9.5
0e-0
1
9.0
0e-0
1
8.5
0e-0
1
8.0
0e-0
1
7.5
0e-0
1
7.0
0e-0
1
6.5
0e-0
1
6.0
0e-0
1
5.5
0e-0
1
5.0
0e-0
1
4.5
0e-0
1
4.0
0e-0
1
3.5
0e-0
1
3.0
0e-0
1
2.5
0e-0
1
2.0
0e-0
1
1.5
0e-0
1
1.0
0e-0
1
5.0
0e-0
2
0.0
0e+00
Conto
urs
of
Liq
uid
Fra
ctio
n (
mix
ture
) (T
ime=6.4
220e+03)
FLU
EN
T 6
.1 (
axi,
dp, segre
gate
d, vof,
lam
, unste
ady)
Mar
16, 2006
1.0
0e+00
9.5
0e-0
1
9.0
0e-0
1
8.5
0e-0
1
8.0
0e-0
1
7.5
0e-0
1
7.0
0e-0
1
6.5
0e-0
1
6.0
0e-0
1
5.5
0e-0
1
5.0
0e-0
1
4.5
0e-0
1
4.0
0e-0
1
3.5
0e-0
1
3.0
0e-0
1
2.5
0e-0
1
2.0
0e-0
1
1.5
0e-0
1
1.0
0e-0
1
5.0
0e-0
2
0.0
0e+00
Conto
urs
of
Liq
uid
Fra
ctio
n (
mix
ture
) (T
ime=9.5
903e+03)
FLU
EN
T 6
.1 (
axi,
dp, segre
gate
d, vof,
lam
, unste
ady)
Apr
09, 2006
1.0
0e+00
9.5
7e-0
1
9.1
3e-0
1
8.7
0e-0
1
8.2
6e-0
1
7.8
3e-0
1
7.3
9e-0
1
6.9
6e-0
1
6.5
2e-0
1
6.0
9e-0
1
5.6
5e-0
1
5.2
2e-0
1
4.7
8e-0
1
4.3
5e-0
1
3.9
1e-0
1
3.4
8e-0
1
3.0
4e-0
1
2.6
1e-0
1
2.1
7e-0
1
1.7
4e-0
1
1.3
0e-0
1
8.7
0e-0
2
4.3
5e-0
2
0.0
0e+00
C=105
Spherical shell: shrinkage and voids
46
Yotvat and Zelikover (2008)
C=108
Revankar and Croy (2007)
FoSte ~ T/D2
• There exists a critical value
of FoSte and the central void
is formed when this value is
exceeded
24
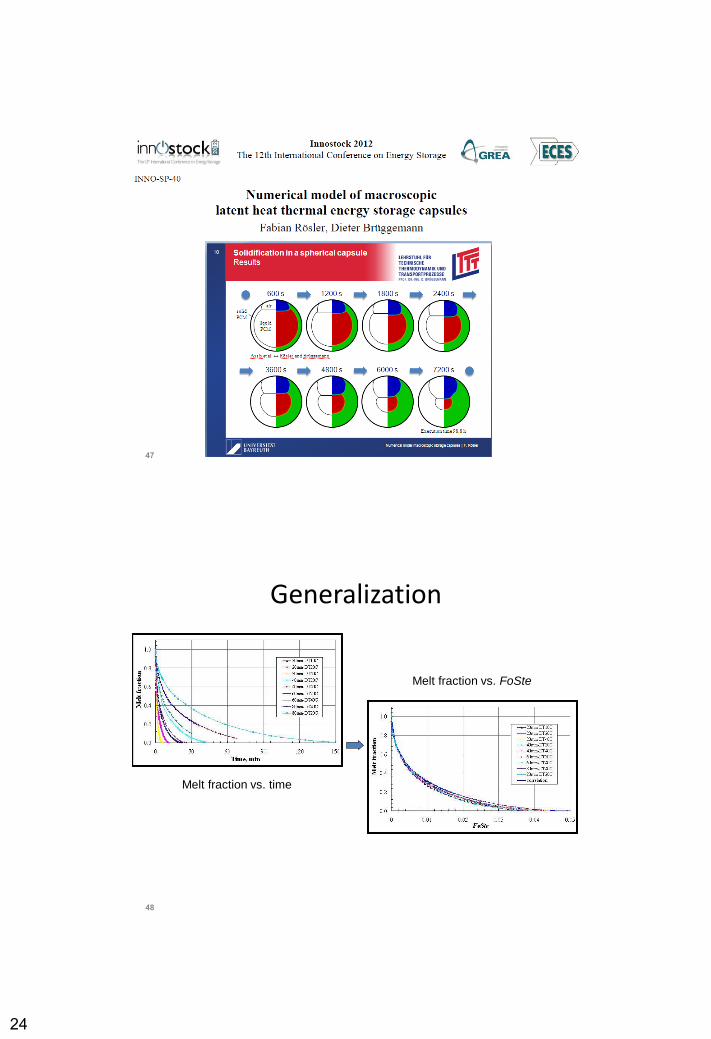
47
Generalization
48
Melt fraction vs. time
Melt fraction vs. FoSte

25
Spherical shell: attempt of analysis
0.0
0.2
0.4
0.6
0.8
1.0
0 30 60 90 120 150 180
Time, min
melt
fra
cti
on
Casting
Shell Diameter = 80mm
T = 20 oC
0.0
0.2
0.4
0.6
0.8
1.0
0 10 20 30 40 50 60 70
time, min
mel
t fr
act
ion
Casting Shell Diameter: 40mm
ΔT = -10 oC, -20
oC
49
FoSte ~ T/D2
• There exists a critical value
of FoSte and the central void
is formed when this value is
exceeded
Melting revisited
0
0.2
0.4
0.6
0.8
1
0 5 10 15 20 25 30 35 40
Time, min
melt f
raction
Melting after
solidification
Diameter: 80mm
T = 6oC
Mushy zone: 2oC
50
Assis (2007)
26
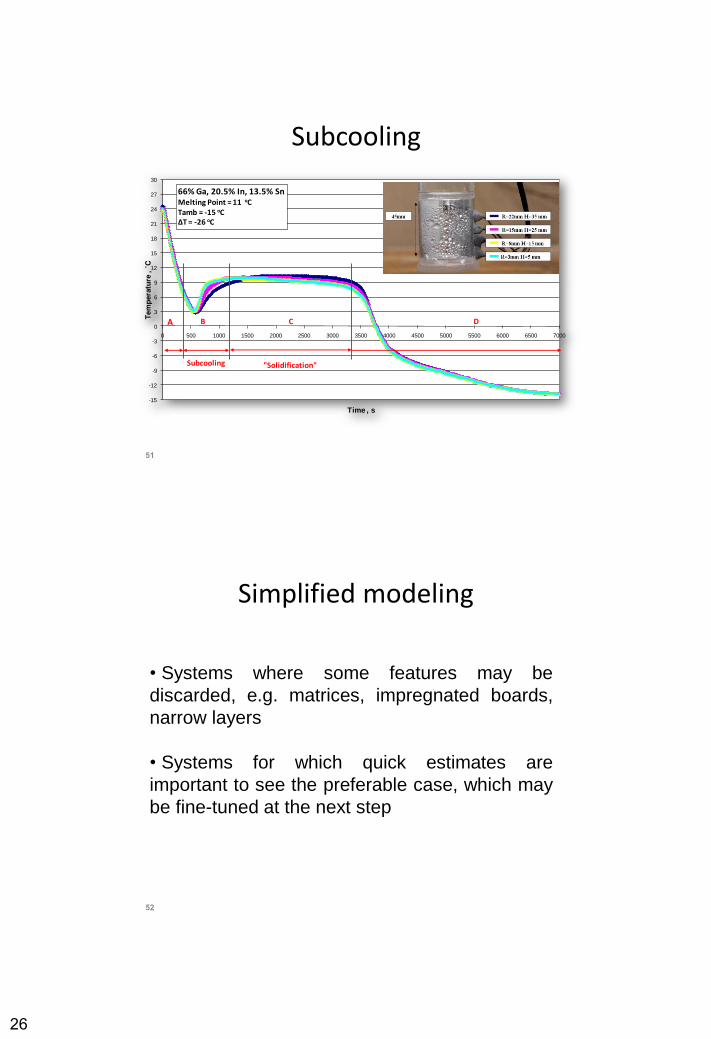
Subcooling
51
-15
-12
-9
-6
-3
0
3
6
9
12
15
18
21
24
27
30
0 500 1000 1500 2000 2500 3000 3500 4000 4500 5000 5500 6000 6500 7000
Tem
pera
ture
, ˚
C
Time , s
66% Ga, 20.5% In, 13.5% SnMelting Point = 11 oCTamb = -15 oCΔT = -26 oC
"Solidification"
B A
Subcooling
C D
Simplified modeling
52
• Systems where some features may be
discarded, e.g. matrices, impregnated boards,
narrow layers
• Systems for which quick estimates are
important to see the preferable case, which may
be fine-tuned at the next step
27
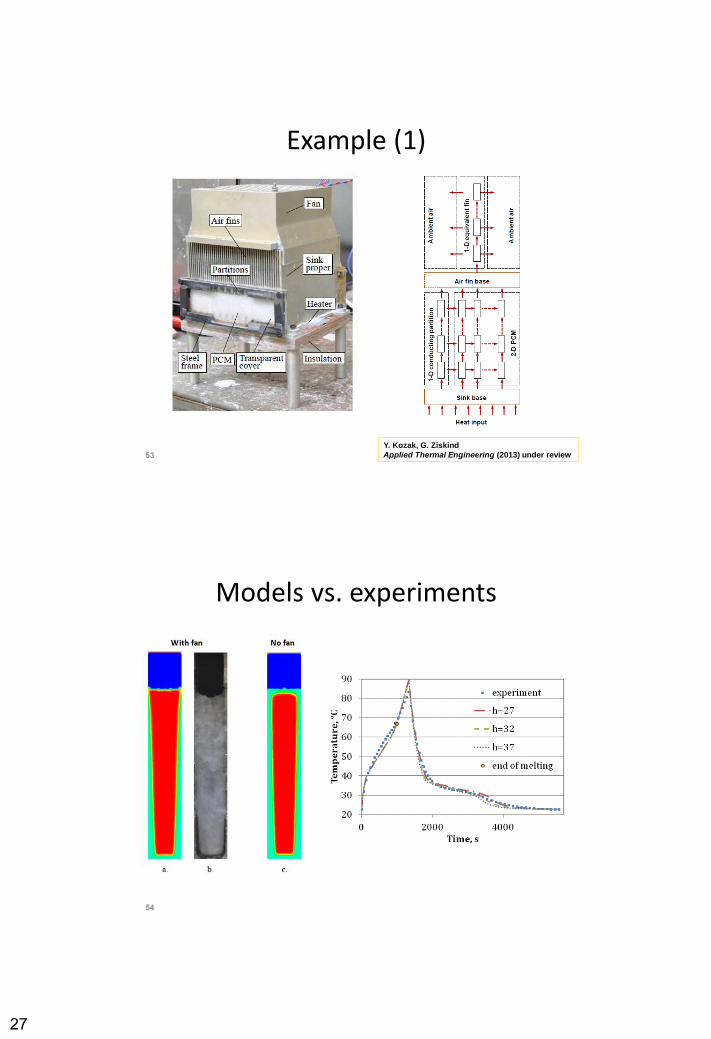
Example (1)
53
Y. Kozak, G. Ziskind
Applied Thermal Engineering (2013) under review
Models vs. experiments
54

28
(Example (2
55
V. Dubovsky, G. Ziskind, R. Letan
Applied Thermal Engineering (2011)
Parameter variation
56
29
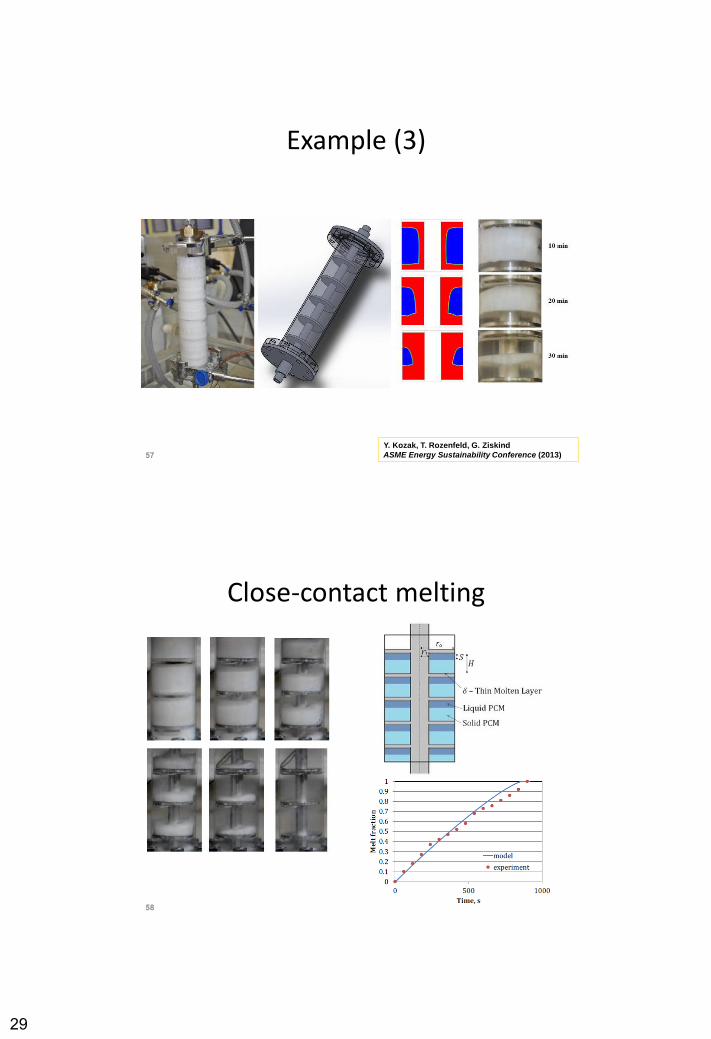
Example (3)
57
Y. Kozak, T. Rozenfeld, G. Ziskind
ASME Energy Sustainability Conference (2013)
Close-contact melting
58
30
Closing remarks
59
• “New level of realism” in the simulations – resulting in
a detailed picture of the processes – is possible
• In many cases, a full simulation is essential because
otherwise the results do not reflect the reality and their
use can be misleading
• Still, it is very important to be flexible and apply a variety
of approaches
• Validation vs. experiments is indispensable
• Modeling challenges:
properties of real materials
in melting - mushy zone
in solidification - void formation and subcooling
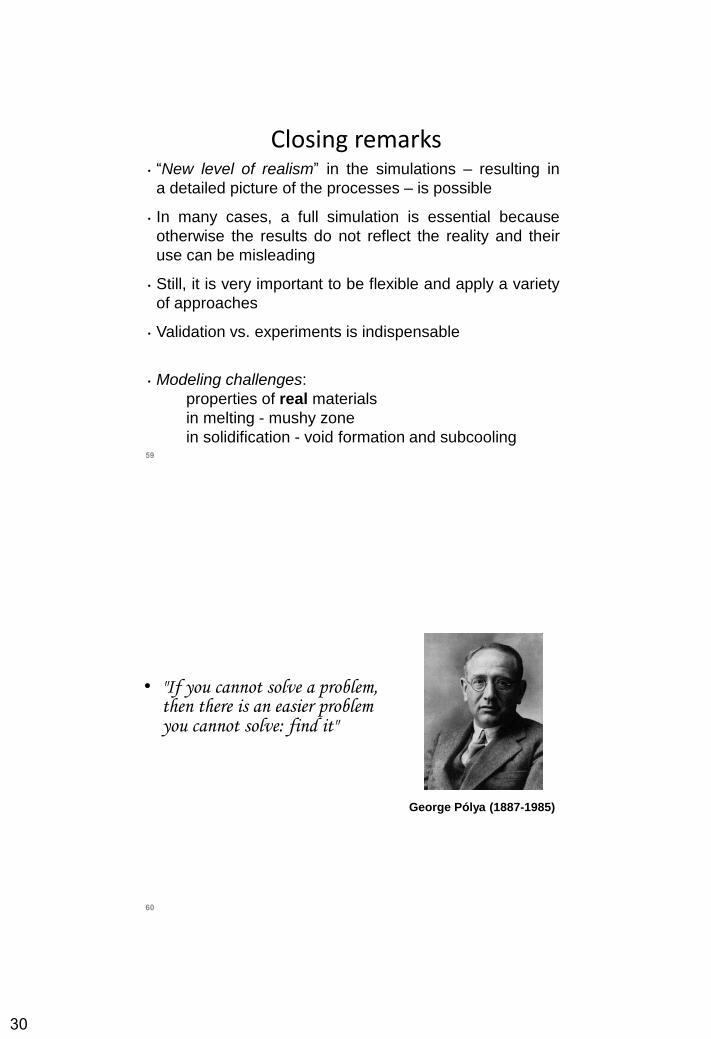
• "If you cannot solve a problem, then there is an easier problem you cannot solve: find it"
60
George Pólya (1887-1985)

31
• Tafasta meruba lo tafasta (Hebrew: תפשת מרובה לא תפשת)
If you have seized a lot, you have not seized
• The general meaning is that an over-ambitious claim defeatsitself: the intended analogy is to one who grabs more than he canhold
16.04.2013COST TU0802 Training School,
DUBLIN61