theoretical model for the mechanical behavior of prestressed beams under torsion · pdf...
TRANSCRIPT

Page 1 of 19
Civil & EnvironmEntal EnginEEring | rEsEarCh artiClE
Theoretical model for the mechanical behavior of prestressed beams under torsionSérgio M.R. Lopes and Luís F.A. Bernardo
Cogent Engineering (2014), 1: 943934
Lopes & Bernardo, Cogent Engineering (2014), 1: 943934http://dx.doi.org/10.1080/23311916.2014.943934
Civil & EnvironmEntal EnginEEring | rEsEarCh artiClE
Theoretical model for the mechanical behavior of prestressed beams under torsionSérgio M.R. Lopes1 and Luís F.A. Bernardo2*
abstract: In this article, a global theoretical model previously developed and validated by the authors for reinforced concrete beams under torsion is reviewed and corrected in order to predict the global behavior of beams under torsion with uniform longitudinal prestress. These corrections are based on the introduction of prestress factors and on the modification of the equilibrium equations in order to incorporate the contribution of the prestressing reinforcement. The theoretical results obtained with the new model are compared with some available results of prestressed concrete (PC) beams under torsion found in the literature. The results obtained in this study validate the proposed computing procedure to predict the overall behavior of PC beams under torsion.
subjects: Civil, Environmental and geotechnical Engineering, Concrete & Cement, structural Engineering
Keywords: prestress concrete, beams, torsion, theoretical model
1. introductionSince the original space-truss analogy (STA) proposed by Rausch (1929), several developments have been proposed to predict the behavior of reinforced concrete (RC) beams under torsion. Several studies from many authors up to 1980 can be found in the literature, for instance: Andersen, Cowan,
*Corresponding author: Luís F.A. Bernardo, Department of Civil Engineering and Architecture, University of Beira Interior, Edifício II das Engenharias, Calçada Fonte do Lameiro, 6201-001 Covilhã, Portugal E-mail: [email protected]
Reviewing editor:Amir H. Alavi, Michigan State University, USA
Additional article information is available at the end of the article
ABOUT THE AUTHORSSérgio M.R. Lopes is a full professor in the Department of Civil Engineering of the University of Coimbra, Portugal. He is a member of the Research Centre CEMUC—Centre for Mechanical Engineering, Portugal. His research interests include behavior of Structural Concrete, Bridges, High Strength Concrete Structures, Alkali Activated Materials and Structures, Non-Metallic Reinforcement, and Composite Timber-Concrete Structures.Luís F.A. Bernardo is an assistant professor at the Department of Civil Engineering and Architecture of the University of Beira Interior, Portugal. He is a member of the Research Centre C-made: Centre of Materials and Building Technologies, Portugal. His research interests include the mechanical behavior of structural concrete and the development of new structural materials and building systems.
PUBLIC INTEREST STATEMENTThis article presents a theoretical study on the mechanical behavior of structural concrete, in particular of structural beams under torsion. A previous theoretical model from the authors is extended in order to be able to predict the global and realistic behavior of prestressed concrete beams under torsion. Such structural elements are widely used in special buildings and bridges. From this theoretical model, a new computational software was edited, which can be made available for researchers and structural engineers for research and structural design practice. The results of this study are also useful for future revisions of Codes of Practice for structural engineers.
Received: 23 April 2014Accepted: 06 July 2014Published: 08 August 2014
© 2014 The Author(s). This open access article is distributed under a Creative Commons Attribution (CC-BY) 3.0 license.
Page 2 of 19

Page 3 of 19
Lopes & Bernardo, Cogent Engineering (2014), 1: 943934http://dx.doi.org/10.1080/23311916.2014.943934
Walsh, Lampert, Thurlimann, Elfgren, Müller, Collins, and Mitchell. The STA as a high historical value, it constitutes the base for torsion design of the European Model Code since 1978 and also the American Code since 1995.
Among the analytical models based on the STA, the variable angle truss-model (VATM) proposed by Hsu and Mo (1985) is probably the most used theoretical truss model to predict the ultimate behavior of beams under torsion. This model firstly aimed to unify the torsion design of small and large sections and also of RC and prestressed concrete (PC) beams. When compared to the STA, the VATM incorporates a compressive stress (σ)–strain (ε) relationship for the concrete in the struts which allows to account for the softening effect, instead of a conventional σ–ε relationship for uni-axial compression. Several authors proposed further versions of the VATM, for instance: Rahal and Collins (1996), Bhatti and Almughrabi (1996) and Wang and Hsu (1997). Generally, these models are only able to compute the ultimate torsional strength of the beams and are mainly focused on RC beams. VATM is able to predict the global behavior of RC and PC beams under torsion throughout the entire loading history, although very good results are observed only for high loading levels (Bernardo, Andrade, & Lopes, 2012a; Hsu & Mo, 1985). This is because VATM assumes that the beam is exten-sively cracked in all levels of loading, which is true only for high level of loading. Furthermore, for low level of loading, the concrete core of solid sections (neglected in the VATM) also influences the tor-sional stiffness of the beams.
Recently, Jeng and Hsu (2009), and Jeng, Chiu, and Chen (2010), extended the softened mem-brane model, previously developed to treat theoretically RC membrane elements under shear (Hsu & Zhu, 2002), to RC and PC beams under torsion. The new model was called softened membrane model for torsion (SMMT). Bernardo, Andrade, and Nunes (in press) extended the VATM to RC beams under torsion. The new model was called generalized softened variable angle truss-model for rein-forced concrete beams under torsion (GSVATM). These analytical methods (SMMT and GSVATM) in-corporate the influence of the concrete in tension in the perpendicular direction of the concrete struts and are able to predict the entire Torque (T)–Twist (θ) curve for all the loading levels. When compared with experimental data available in the literature (namely cracking and resistance torque, as well as the corresponding twists), the authors found that the theoretical predictions from the SMMT and the GSVATM are generally good. However, it was also found that the theoretical models don’t predict very well the torsional stiffness of the post-cracked ascending branch of the T–θ curves, mainly for beams with lower reinforcement ratio. In general, the post-cracked stiffness is overesti-mated. This is because in the theoretical T–θ curves a sudden “fall” of the torques is observed after the concrete cracking (Bernardo et al., in press; Jeng et al., 2010; Jeng & Hsu, 2009). This behavior is not experimentally observed in RC and PC beams under torsion. This observation constitutes a draw-back of the referred theoretical models because it is very important to predict well the post-cracked branch of the T–θ curves, for instance to allow to check the internal deformation and stress states of the beams for the serviceability limit states.
Bernardo and Lopes (2008, 2011) developed a simple calculation procedure in order to also predict the overall theoretical behavior of RC beams under torsion. The theoretical approach was firstly performed by studying different behavioral states, each of one identified with the different states observed experimentally. These behavioral states were characterized individually by the authors by using different theories, namely:
• Linear elastic analysis in non-cracked state (State I): state characterized with Theory of Elasticity, Skew-Bending Theory, and Bredt’s Thin Tube Theory;
• Linear elastic analysis in cracked state (State II): state characterized with a simplest version of the STA, assuming an angle of 45° for the concrete struts and assuming a linear σ–ε relationship for the materials; and
• Non-linear analysis: state characterized with VATM, assuming non-linear σ–ε relationships for the materials and also the softening effect for the concrete in compression.
Page 4 of 19
Lopes & Bernardo, Cogent Engineering (2014), 1: 943934http://dx.doi.org/10.1080/23311916.2014.943934
The transition between the different theoretical states was performed by adopting semi-empirical criteria. This general approach proposed by Bernardo and Lopes (2008, 2011) has been already vali-dated by the authors. From the comparative analysis between the theoretical predictions from the analytical model and the experimental results, the authors showed that the procedure was ade-quate to predict the global behavior of normal-strength (NS) and high-strength (HS) RC beams under torsion, including the post-cracked ascending branch of the T–θ curves.
In this article, the previously proposed theoretical model from Bernardo and Lopes (2008, 2011) is revised and corrected in order to incorporate PC beams. The theoretical predictions obtained from the new computing procedure, namely through the calculation of the overall T–θ curves, are com-pared with the results of some experimental tests on PC beams under pure torsion which were found in literature. In this study, only beams with uniform longitudinal prestress are analyzed because this situation is the simplest solution for the problem of pure torsion.
2. research significanceWhen applied rationally, prestress increases resistance to cracking of a RC beam under bending. This is due to the fact that prestress induces a compressive stress which opposes tensile stress caused by the bending moment (Alnuaimi & Bhatt, 2006). Cracking can only occur when tensile stress, due to bending, exceeds compressive stress due to prestress.
Prestress also increases resistance to cracking of a RC beam under shear or under torsion. In these cases, prestress induces a compressive stress which, combined with tangential stress induced by shear or torsion, results in a state of biaxial stress (shear + compression). This state of biaxial stress delays the cracking of concrete.
In order to justify the advantages of including longitudinal prestress in beams under high levels of torsional forces, some relevant aspects should be highlighted.
Tensile strength of concrete is not incremented in direct proportion to its compressive strength. For this reason, concrete’s full potential cannot be reached in structures in which resistance to crack-ing or ultimate member resistance is governed by tensile stresses often induced by shear or torsion. Thus, an appropriate prestress increases global resistance capacity to shear or torsion and enables a higher portion of concrete in the transversal section to be effective.
When compared with normal-strength concrete (NSC), prestress is particularly important for high-strength concrete (HSC) members because such members are expected to have less stiffness due to smaller transversal sections. Prestress can increase the stiffness of structural elements with small transversal sections and allows for a better control of deformation and cracking. Thus, prestressed HSC combines the best characteristics of HSC with the advantages of prestress technique. This is also true for structural members under shear or torsion. The study of the mechanical behavior of pre-stressed beams under torsion is, therefore, important.
It should be referred that the incorporation of longitudinal prestress for solving practical problems of pure torsion is a not common case. However, the incorporation of longitudinal prestress in struc-tural elements under interaction forces, with high level torsional forces, is common cases. The tor-sional effects in RC beams under interaction forces still need to be studied (Bairan Garcia & Mari Bernat, 2006a, 2006b; Kim & Yoo, 2006; Koechlin, Andrieux, Millard, & Potapov, 2008).
In a hypothetical situation with pure torsion, the existence of a longitudinal compression state due to longitudinal prestress corresponds to a situation of interaction forces. Thus, a re-evaluation and correction of the theoretical models for RC beams under torsion must be carried out. So far, consistent theoretical models only exist to predict the global behavior of RC beams under torsion (Bernardo et al., 2012a; Bernardo, Andrade, & Lopes, 2012b; Bernardo & Lopes, 2008, 2011).

Page 5 of 19
Lopes & Bernardo, Cogent Engineering (2014), 1: 943934http://dx.doi.org/10.1080/23311916.2014.943934
3. theoretical idealization of the T–θ curveFrom tests of RC beams under pure torsion until failure, a typical experimental T–θ curve can be drawn (Figure 1). Three zones corresponding to different behavioral states can be differentiated, namely: Zone 1, Zone 2, and Zone 3 (Figure 1). In Figure 1, the following parameters were used to characterize the typical experimental T–θ curve (see Figure 1):
Tcr cracking torque
�Icr twist corresponding to Tcr for the final part of Zone 1 (linear elastic analysis in non-cracked
state)
�IIcr twist corresponding to Tcr for the initial part of Zone 2.b (linear elastic analysis in cracked
state)
Tly; Tty torque corresponding to yielding of torsional reinforcement (longitudinal and transversal, respectively)
θly; θty twist corresponding to Tly and Tty, respectively
Tr maximum torque
θTr twist corresponding to Tr
(GJ)i torsion stiffness in Zone 1 (linear elastic analysis in non-cracked state)
(GJ)ii torsion stiffness in Zone 2.b (linear elastic analysis in cracked state)
In Figure 1, Zone 1 corresponds to the non-cracking behavior of the beam (State I). This stage can be characterized by using a linear elastic analysis in non-cracked state. In the present study, the theoretical models adopted to characterize Zone 1 are the following: Theory of Elasticity, Skew-Bending Theory and Bredt’s Thin Tube Theory.
Zone 2 corresponds to the cracked behavior beam (State II). The upper limit of Zone 2 is attributed to the point in which elastic behavior of materials is no longer valid. Zone 2.a corresponds to a sud-den increase of twist for a constant torque after Tcr is reached. This zone is not easily observed in hollow beams (Bernardo & Lopes, 2009). The beam in State II (mainly in Zone 2.b) can be character-ized with a linear elastic analysis in cracked state. In this study, the model adopted was based on the STA with concrete struts at an angle of 45° and assuming linear behavior for the materials.
State II is considered no longer valid from the point when the torsional reinforcement (longitudi-nal or transversal) starts to yield or when the compression concrete struts start to behave non-line-arly due to the high stress level. From this point, Zone 3 begins (see Figure 1). To characterize the behavior of the beam in Zone 3, the VATM is used considering the non-linear behavior of the materi-als and the softening effect for the concrete in compression in the struts.
Figure 1. typical T–θ curve for a rC beam under torsion (Bernardo & lopes, 2011).
Page 6 of 19
Lopes & Bernardo, Cogent Engineering (2014), 1: 943934http://dx.doi.org/10.1080/23311916.2014.943934
In previous articles from the authors (Bernardo & Lopes, 2008, 2011), Zones 1, 2, and 3 identified in the T–θ curve of Figure 1 were separately studied. To accomplish the transition within the three zones, semi-empirical criteria were established so that the theoretical T–θ curve could be entirely drawn. This procedure was accomplished for NSC RC beams (Bernardo & Lopes, 2008) and also for HSC RC beams (Bernardo & Lopes, 2011), with plain and hollow cross sections. In the referred arti-cles, a computing procedure was also proposed to compute the global behavior of RC beams under torsion, namely by drawing the theoretical T–θ curve. The theoretical results were compared with experimental results of tested RC beams under pure torsion. Such comparative analysis enabled to validate the proposed theoretical model and also the computing procedure.
In the following section, the theoretical models previously presented by the authors are reviewed and modified in order to cover PC beams under torsion. Only longitudinal uniform prestress is considered.
4. modification of the theoretical models
4.1. Criterion of concrete failure under a biaxial stress stateIn order to evaluate the efficiency of prestress in increasing the resistance torque for a RC beam, it is necessary to adopt a concrete failure criterion for biaxial stress state. From that failure criterion, it is possible to compute a simple prestress factor, which is defined as the ratio between the resistance of a PC beam with respect to the resistance of a non-prestressed beam (Hsu, 1984).
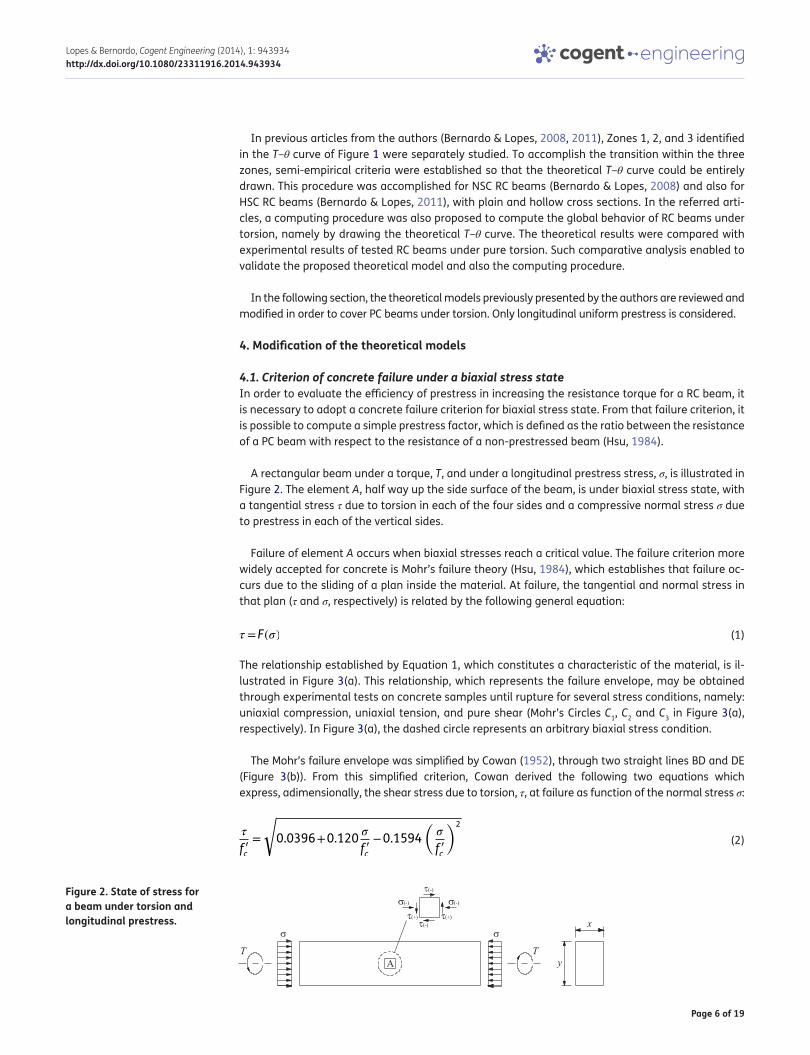
A rectangular beam under a torque, T, and under a longitudinal prestress stress, σ, is illustrated in Figure 2. The element A, half way up the side surface of the beam, is under biaxial stress state, with a tangential stress τ due to torsion in each of the four sides and a compressive normal stress σ due to prestress in each of the vertical sides.
Failure of element A occurs when biaxial stresses reach a critical value. The failure criterion more widely accepted for concrete is Mohr’s failure theory (Hsu, 1984), which establishes that failure oc-curs due to the sliding of a plan inside the material. At failure, the tangential and normal stress in that plan (τ and σ, respectively) is related by the following general equation:
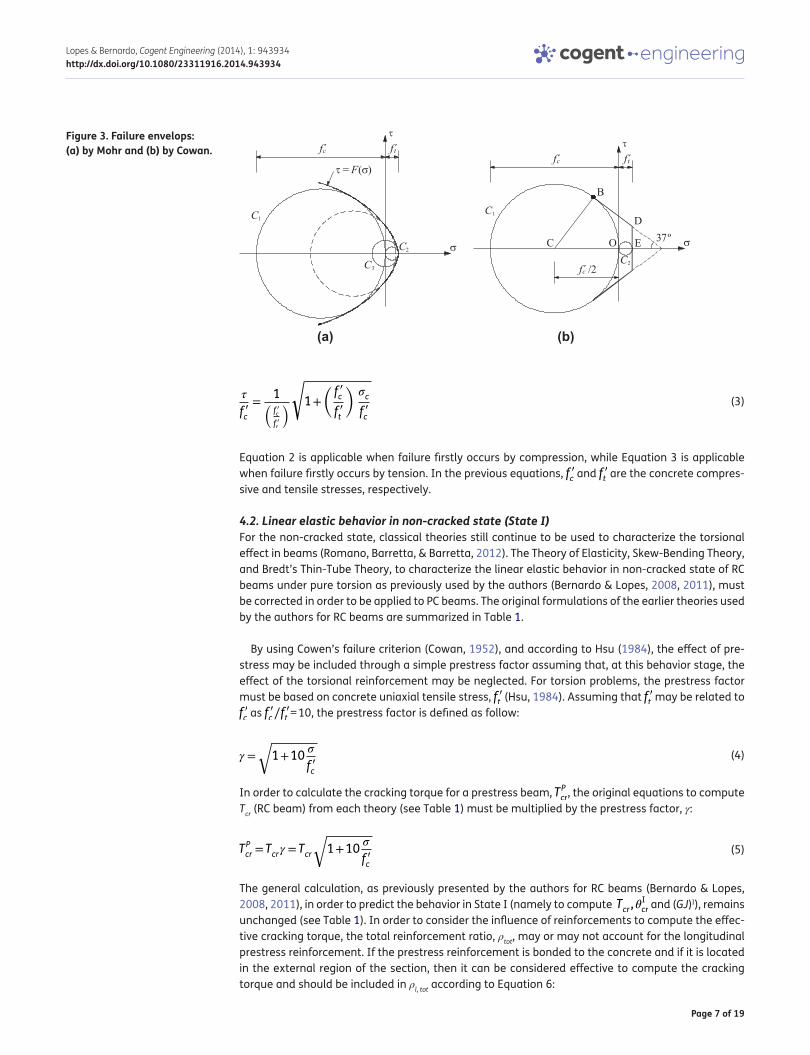
The relationship established by Equation 1, which constitutes a characteristic of the material, is il-lustrated in Figure 3(a). This relationship, which represents the failure envelope, may be obtained through experimental tests on concrete samples until rupture for several stress conditions, namely: uniaxial compression, uniaxial tension, and pure shear (Mohr’s Circles C1, C2 and C3 in Figure 3(a), respectively). In Figure 3(a), the dashed circle represents an arbitrary biaxial stress condition.
The Mohr’s failure envelope was simplified by Cowan (1952), through two straight lines BD and DE (Figure 3(b)). From this simplified criterion, Cowan derived the following two equations which express, adimensionally, the shear stress due to torsion, τ, at failure as function of the normal stress σ:
(1)� =F(�)
(2)�
f �c=
√0.0396+0.120
�
f �c−0.1594
(�
f �c
)2
Figure 2. state of stress for a beam under torsion and longitudinal prestress.
Page 7 of 19
Lopes & Bernardo, Cogent Engineering (2014), 1: 943934http://dx.doi.org/10.1080/23311916.2014.943934
Equation 2 is applicable when failure firstly occurs by compression, while Equation 3 is applicable when failure firstly occurs by tension. In the previous equations, f ′c and f ′t are the concrete compres-sive and tensile stresses, respectively.
4.2. Linear elastic behavior in non-cracked state (State I)For the non-cracked state, classical theories still continue to be used to characterize the torsional effect in beams (Romano, Barretta, & Barretta, 2012). The Theory of Elasticity, Skew-Bending Theory, and Bredt’s Thin-Tube Theory, to characterize the linear elastic behavior in non-cracked state of RC beams under pure torsion as previously used by the authors (Bernardo & Lopes, 2008, 2011), must be corrected in order to be applied to PC beams. The original formulations of the earlier theories used by the authors for RC beams are summarized in Table 1.
By using Cowen’s failure criterion (Cowan, 1952), and according to Hsu (1984), the effect of pre-stress may be included through a simple prestress factor assuming that, at this behavior stage, the effect of the torsional reinforcement may be neglected. For torsion problems, the prestress factor must be based on concrete uniaxial tensile stress, f ′t (Hsu, 1984). Assuming that f ′t may be related to f ′c as f �c∕f
�
t = 10, the prestress factor is defined as follow:
In order to calculate the cracking torque for a prestress beam, TPcr, the original equations to compute Tcr (RC beam) from each theory (see Table 1) must be multiplied by the prestress factor, γ:
The general calculation, as previously presented by the authors for RC beams (Bernardo & Lopes, 2008, 2011), in order to predict the behavior in State I (namely to compute Tcr ,�
Icr and (GJ)I), remains
unchanged (see Table 1). In order to consider the influence of reinforcements to compute the effec-tive cracking torque, the total reinforcement ratio, ρtot, may or may not account for the longitudinal prestress reinforcement. If the prestress reinforcement is bonded to the concrete and if it is located in the external region of the section, then it can be considered effective to compute the cracking torque and should be included in ρl, tot according to Equation 6:
(3)�
f �c=
1(f �c
f �t
)√1+
(f �c
f �t
)�c
f �c
(4)� =
√1+10
�
f �c
(5)TPcr =Tcr� =Tcr
√1+10
�
f �c
Figure 3. Failure envelops: (a) by mohr and (b) by Cowan.
(a) (b)

Page 8 of 19
Lopes & Bernardo, Cogent Engineering (2014), 1: 943934http://dx.doi.org/10.1080/23311916.2014.943934
table 1. Equations for linear elastic behavior in non-cracked state (state i) (Bernardo & lopes, 2008, 2011)skew-Bending theory Bredt’s thin-tube theory
NSC beams NSC beams
Tcr =6y(x2+10) 3
√f �c (plain section) Tcr =2Ac(1.2Ac∕pc)
(2.5
√f �c
) (plain section)
Tcr =6(x2+10)y 3
√f �c (4h∕x) for h ≤ x/4 (hollow section) Tcr =2Act
(2.5
√f �c
) (hollow section)
If h > x/4 then h = x/4
HSC beams HSC beams
Tcr =5.1y(x2+10) 3
√f �c (plain section) Tcr =1.7Ac(1.2Ac ∕pc)
(2.5
√f �c
) (plain section)
Tcr =5.1(x2+10)y 3
√f �c (4h∕x) (hollow section) Tcr =1.7Act
(2.5
√f �c
) (hollow section)
theory of Elasticity
Tcr =WTfctm
WT =�x2y (plain section)
WT =2Ah (hollow section)
general equations
�Icr =
Tcr, ef
K(GJ)I J=�x3y (plain section) J=4A2h∕u (hollow section)
Tcr, ef =(1+4�tot)Tcr �tot =�l+�t �l=AlAc
�t =AtutAcs
Symbology
fctm = average concrete strength in tension
f ′c = concrete strength in compression
h, t = wall thickness of the hollow section
pc = perimeter of the outer line of the section
s = longitudinal stirrups’ spacing
u = perimeter of area A: u = 2x1 + 2y1
ut = perimeter of the center line of the stirrups
x, y = minor and major external dimension of the plain section, respectively
x1, y1 = minor and major dimension of the rectangular area defined by the center lines of walls of the hollow sec-tion, respectively
A = area limited by the center line of the wall of the hollow section (A = x1y1)
Ac = area of the section limited by the outer perimeter (includes the hollow area)
Al = total area of the longitudinal reinforcement
At = area of one leg of the transversal reinforcement
G = shear modulus (G=Ec∕[2(1+�)
], Ec is the Young’s modulus of concrete and υ is the Poisson’s coefficient)
J = stiffness factor
K = correcting factor (K ≈ .7–1)
Tcr; Tcr, ef = cracking torque (nominal value and effective value, respectively)
WT = elastic modulus of torsion
α, β = St. Venant’s coefficients
ρl = longitudinal reinforcement ratio
ρt = transversal reinforcement ratio
ρtot = total reinforcement ratio
�Icr = twist corresponding to Tcr
Page 9 of 19
Lopes & Bernardo, Cogent Engineering (2014), 1: 943934http://dx.doi.org/10.1080/23311916.2014.943934
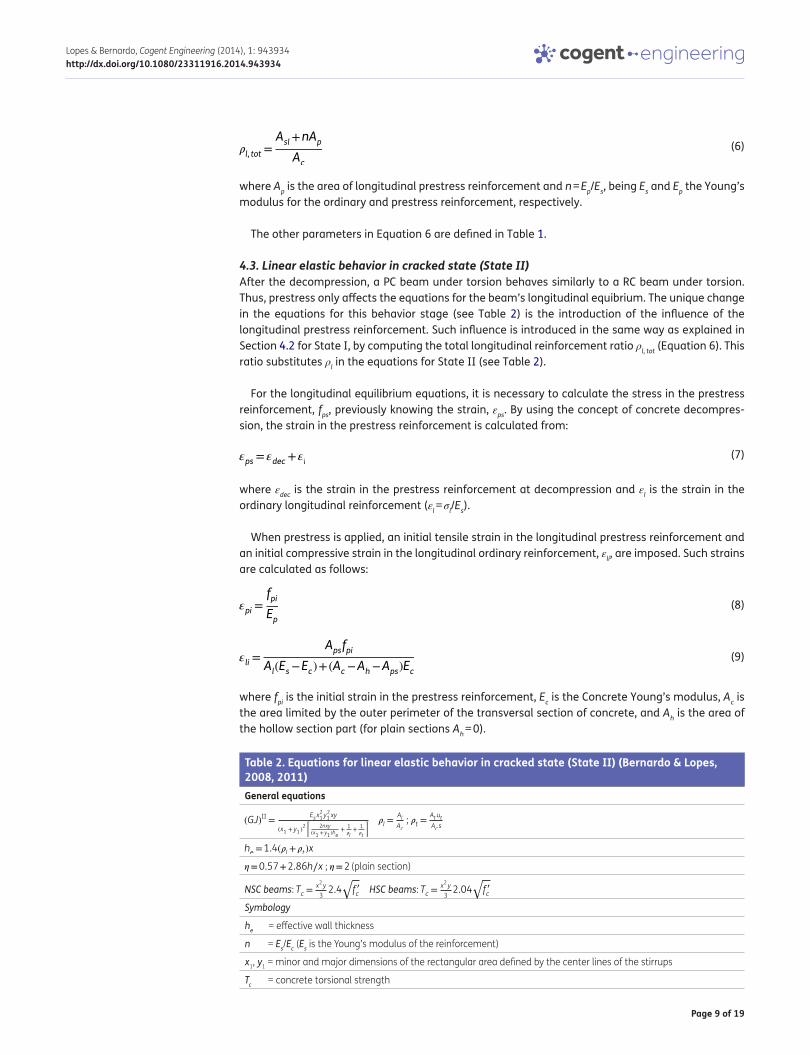
where Ap is the area of longitudinal prestress reinforcement and n = Ep/Es, being Es and Ep the Young’s modulus for the ordinary and prestress reinforcement, respectively.
The other parameters in Equation 6 are defined in Table 1.
4.3. Linear elastic behavior in cracked state (State II)After the decompression, a PC beam under torsion behaves similarly to a RC beam under torsion. Thus, prestress only affects the equations for the beam’s longitudinal equibrium. The unique change in the equations for this behavior stage (see Table 2) is the introduction of the influence of the longitudinal prestress reinforcement. Such influence is introduced in the same way as explained in Section 4.2 for State I, by computing the total longitudinal reinforcement ratio ρl, tot (Equation 6). This ratio substitutes ρl in the equations for State II (see Table 2).
For the longitudinal equilibrium equations, it is necessary to calculate the stress in the prestress reinforcement, fps, previously knowing the strain, εps. By using the concept of concrete decompres-sion, the strain in the prestress reinforcement is calculated from:
where εdec is the strain in the prestress reinforcement at decompression and εl is the strain in the ordinary longitudinal reinforcement (εl = σl/Es).
When prestress is applied, an initial tensile strain in the longitudinal prestress reinforcement and an initial compressive strain in the longitudinal ordinary reinforcement, εli, are imposed. Such strains are calculated as follows:
where fpi is the initial strain in the prestress reinforcement, Ec is the Concrete Young’s modulus, Ac is the area limited by the outer perimeter of the transversal section of concrete, and Ah is the area of the hollow section part (for plain sections Ah = 0).
(6)�l, tot=Asl+nAp
Ac
(7)�ps=�dec+�l
(8)�pi =fpi
Ep
(9)�li =Apsfpi
Al(Es−Ec)+(Ac−Ah−Aps)Ec
table 2. Equations for linear elastic behavior in cracked state (state ii) (Bernardo & lopes, 2008, 2011)general equations
(GJ)II=Esx
21y
21 xy
(x1 +y1 )2[
2nxy(x1 +y1 )he
+1�l+1�t
] �l=AlAc
; �t =AtutAcs
he=1.4(�l+�t)x
�=0.57+2.86h∕x ; �=2 (plain section)
NSC beams: Tc =x2y
32.4
√f �c HSC beams: Tc =
x2y
32.04
√f �c
Symbology
he = effective wall thickness
n = Es/Ec (Es is the Young’s modulus of the reinforcement)
x1, y1 = minor and major dimensions of the rectangular area defined by the center lines of the stirrups
Tc = concrete torsional strength

Page 10 of 19
Lopes & Bernardo, Cogent Engineering (2014), 1: 943934http://dx.doi.org/10.1080/23311916.2014.943934
When the torque increases in a PC beam, the compressive strain in the longitudinal ordinary reinforcement decreases until it becomes null (at decompression). The strain in the longitudinal prestress reinforcement at decompression is:
For torque levels higher than the torque corresponding to εdec, the PC beam behaves similarly to a RC beam.
Since the stresses immediately after the decompression stage are relatively low, a linear σ–ε rela-tionship may be assumed for the prestress reinforcement. Thus, the stress in the prestress reinforce-ment, fps, may be calculated from:
Following the same methodology as for RC beams (Bernardo & Lopes, 2008, 2011), the ordinate at the origin of the theoretical straight line in linear elastic behavior in State II is given by �T′c, being T′c the contribution of concrete (Figure 4). From an extensive parametric analysis, Bernardo (2003) pro-posed Equation 12 to calculate T′c, where γ1 represents a prestress factor which is function of γ.
4.4. Transition between linear elastic analysis in non-cracked and cracked statesThe same criteria proposed by the authors and validated for RC beams under torsion (Bernardo & Lopes, 2008, 2011), for the transition between the two early states of behavior, will be also adopted for PC beams.
Figure 4 shows the typical theoretical T–θ curve for linear elastic non-cracked and cracked states (Zones 1 and 2 of Figure 1). It should be noted that the horizontal line of the transition from non-cracked to cracked states is hardly observed in tests of hollow beams (�IIcr−�
Icr is normally very small
or zero).
4.5. Non-linear analysisThe original formulation for non-linear analysis based on VATM, for RC beams under torsion, is pre-sented in Table 3. As referred in Section 4.3, in order to account for the influence of prestress rein-forcement, the force in the ordinary longitudinal reinforcement (Alfl) must be substituted by the total force including both the ordinary and the prestress reinforcement (Alfl + Apsfps). Thus, the new equa-tions to compute the angle of the concrete struts, α, and the effective thickness of the concrete struts, td, are:
(10)�dec =�pi+�li
(11)fps=�psEp
(12)T�c =Tc�1=Tc
(2.20
√1+10
�
f �c−1.53
)
Figure 4. transition from non-cracked and cracked states.

Page 11 of 19
Lopes & Bernardo, Cogent Engineering (2014), 1: 943934http://dx.doi.org/10.1080/23311916.2014.943934
All the remaining equations of VATM for RC beams under torsion (equilibrium and compatibility equations) remains unchanged for PC beams (see Table 3).
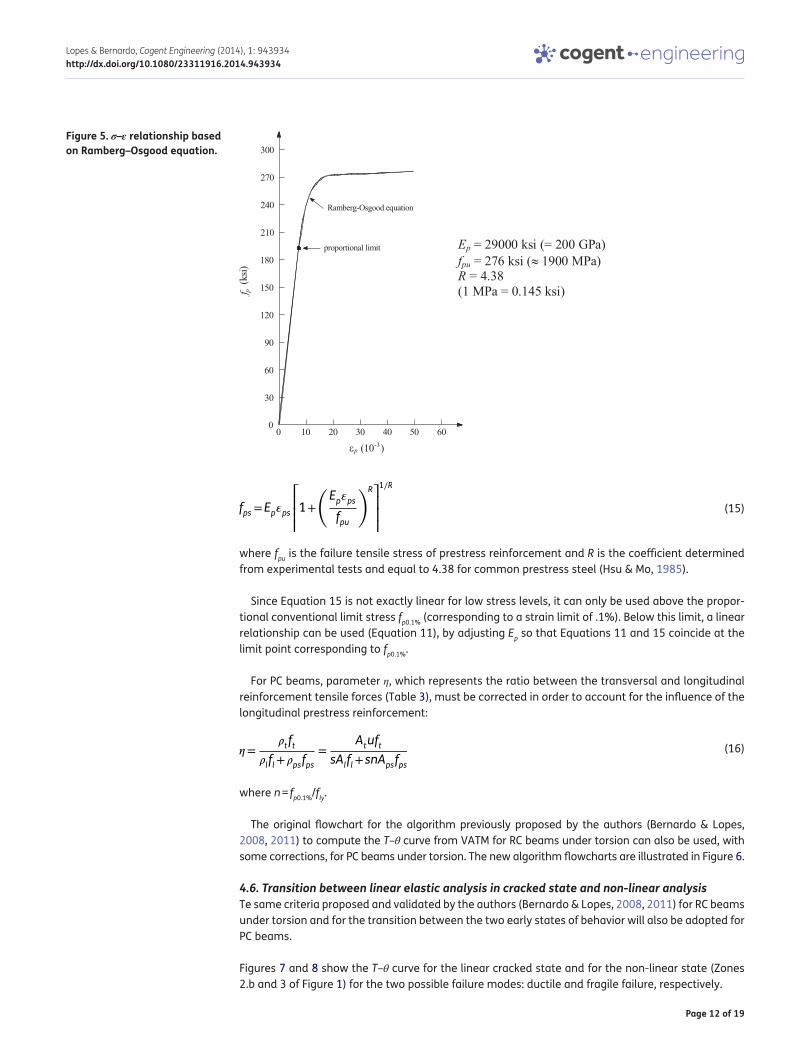
A classical bilinear σ–ε relationship (with horizontal landing after yielding) is assumed for the ordi-nary reinforcement. For prestress reinforcement, the Ramberg–Osgood equation (Hsu & Mo, 1985) will be used to describe the σ–ε relationship (Figure 5):
(13)cos2 �=Alfl+Apsfps
po�dtd
(14)td=Alfl+Apsfps
po�d+Atfts�d
table 3. Equations for non-linear analysis (Bernardo & lopes, 2008, 2011)general equations
T =2Aotd�d sin � cos � cos2 �= Alflpo�dtd
td=Alflpo�d
+Atfts�d
�t =
(A2o�d
poT tg �−
1
2
)�ds �l=
(A2o�d
poT cot g�−
1
2
)�ds �=
�ds
2td sin � cos �
Softened σ–ε relationship for NSC Softened σ–ε relationship for HSC
�d= f�
c
[2(
�d
�o
)−�
(�d
�o
)2] if �d ≤�o∕� �d= �
�of �c
[2
(�d
��o
�o
)−
(�d
��o
�o
)2] if �d∕��o�o ≤1
�d=f�c
�(1−�
2) if 𝜀d >𝜀o∕𝜆 �d= ��of �c
[1−
(�d∕�o−��o
2−��o
)2] if 𝜀d∕𝜁𝜀o𝜀o >1
�=√
�m
�d
−0.3 �=�d−�p
2�o−�p �p =�o∕� �
�o=
0.81√1+Kf �dt
��o=
0.9√1+400�dt
�m=�l+�t+2�d ; �d =�ds∕2 �dt =�l+�t+�d Kf =10f
�c
� �= �t ft
�l fl
�d=k1(1∕�)f�
c �d=k1��of �c
k1=��ds
�o
−�2
3
(�ds
�o
)2 if �ds ≤�o∕� k1=
�ds
�p
(1−
�ds
3�p
) �p = �
�o�o if �ds ≤ �
�o�o
k1=(1− 1
(2�−1)2
)(1− 1
3
�p
�ds
)+
1
(2�−1)2
�ds
�p
(1− 1
3
�ds
�p
) if
𝜀ds >𝜀o∕𝜆
k1=
[1− 1
(2∕��o
−1)2
] (1− 1
3
�p
�ds
)+
1(2∕�
�o−1
)2�ds
�p
(1− 1
3
�ds
�p
)
�p = ��o�o if 𝜀ds >𝜁
𝜀o𝜀o
Symbology
fl, ft = longitudinal an transversal reinforcement stress, respectively
td = effective thickness of the concrete strut
po = perimeter of the area Ao
Ao = area limited by the center line of the flow of shear stresses
T = torque
α = angle of the concrete struts
εd = average strain in the concrete strut
εds = strain at the surface of the concrete strut
εl, εt = strains in the longitudinal and transversal reinforcement, respectively
εdt = tension strain in the perpendicular direction to diagonal strut
εo = compressive strain corresponding to the maximum stress in the concrete
θ = twist
γm = maximum distortion
σd = average stress in the diagonal concrete strut
ζσo, ζεo, λ = reducing factors to account for the softening effect
Page 12 of 19
Lopes & Bernardo, Cogent Engineering (2014), 1: 943934http://dx.doi.org/10.1080/23311916.2014.943934
where fpu is the failure tensile stress of prestress reinforcement and R is the coefficient determined from experimental tests and equal to 4.38 for common prestress steel (Hsu & Mo, 1985).
Since Equation 15 is not exactly linear for low stress levels, it can only be used above the propor-tional conventional limit stress fp0.1% (corresponding to a strain limit of .1%). Below this limit, a linear relationship can be used (Equation 11), by adjusting Ep so that Equations 11 and 15 coincide at the limit point corresponding to fp0.1%.
For PC beams, parameter η, which represents the ratio between the transversal and longitudinal reinforcement tensile forces (Table 3), must be corrected in order to account for the influence of the longitudinal prestress reinforcement:
where n = fp0.1%/fly.
The original flowchart for the algorithm previously proposed by the authors (Bernardo & Lopes, 2008, 2011) to compute the T–θ curve from VATM for RC beams under torsion can also be used, with some corrections, for PC beams under torsion. The new algorithm flowcharts are illustrated in Figure 6.
4.6. Transition between linear elastic analysis in cracked state and non-linear analysisTe same criteria proposed and validated by the authors (Bernardo & Lopes, 2008, 2011) for RC beams under torsion and for the transition between the two early states of behavior will also be adopted for PC beams.
Figures 7 and 8 show the T–θ curve for the linear cracked state and for the non-linear state (Zones 2.b and 3 of Figure 1) for the two possible failure modes: ductile and fragile failure, respectively.
(15)fps=Ep�ps
⎡⎢⎢⎣1+
�Ep�ps
fpu
�R⎤⎥⎥⎦
1∕R
(16)�=�tft
�lfl+�psfps=
AtuftsAlfl+snApsfps
Figure 5. σ–ε relationship based on ramberg–osgood equation.

Page 13 of 19
Lopes & Bernardo, Cogent Engineering (2014), 1: 943934http://dx.doi.org/10.1080/23311916.2014.943934
For the ductile failure (Figure 7), it is assumed that the linear cracked state is valid until the tor-sional reinforcement (transversal and/or longitudinal) yields. Once the transition point is defined, Δθ is calculated from Δθ = θy − �IIy (see Figure 7). Then, the non-linear zone of the T–θ curve is horizontally shifted to the left by Δθ to reset the continuity of the whole curve.
Figure 8 shows the procedure to perform the transition when the concrete in the struts reaches its ultimate strain before the yielding of the torsional reinforcement. The transition point is defined from the slopes of the curves from both states: linear cracked and non-linear sates (there’s a point from which the slope of non-linear state curve equals the slope of the linear state curve). The torque level of this point is identified in Figure 8 by TA. The corresponding twists are: �IIA and θA. Δθ is the value of the horizontal shift of the non-linear branch of the curve to the left to make the whole curve continuous.
Figure 6. Flowcharts for the calculation of T–θ curve: (a) nsC prestressed beams and (b) hsC prestressed beams.
(a) (b)
Notes: (1) See Table 3 and (2) Eurocode 2 (2010).

Page 14 of 19
Lopes & Bernardo, Cogent Engineering (2014), 1: 943934http://dx.doi.org/10.1080/23311916.2014.943934
5. Comparative analysis with experimental resultsBased on the theoretical models and criteria described in Section 4, the computing procedure previ-ously developed and validated by the authors for RC beams under torsion (Bernardo & Lopes, 2008, 2011) is extended in order to compute the T–θ curve for NS and HS PC beams under pure torsion, with rectangular plain and hollow cross-section. In order to validate the computing procedure, the predictions will be compared to some experimental results available in the literature.
The amount of experimental studies focused on PC beams under torsion is limited. Furthermore, some of the tests reported in literature cannot be used in this study for some reasons. For instance, some older studies simply do not meet the basic design recommendations found in current codes of practice (minimum reinforcement, maximum spacing, minimum wall thickness of hollow sections, etc.). In these cases, beams show atypical behaviors. In some other experimental studies, the au-thors present an average twist for all the beam length, and not the twist of the critical section. Therefore, concentrated twists on the critical section cannot be derived from tests. In this case, the experimental twists cannot be directly compared with the theoretical predictions because these lat-ter represent the twists in the critical section. This aspect is particularly important in slender beams because failure zone is located in a small region of the beam.
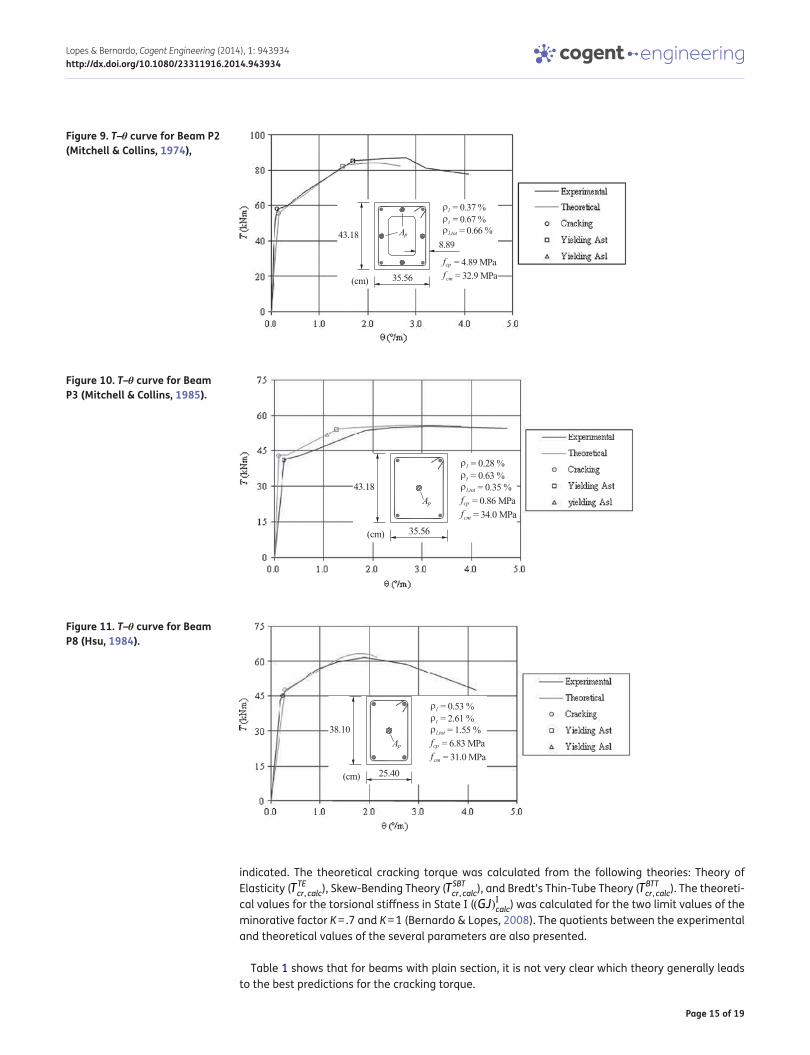
As a consequence, experimental tests related with only five prestressed beams under torsion found in literature will be used for comparative analysis. In these tests, the rotations were recorded in the failure zone of the beams, which enabled comparative analysis with theoretical predictions. The beams are the following ones: Beams P2 and P3 (Mitchell & Collins, 1974), Beam P8 from (Hsu, 1984) and Beams D1 and D2 (Bernardo, 2003). The experimental results of these beams enable to plot the full T–θ curves in the critical zone. Such curves are illustrated in Figures 9–13, where fcp rep-resents the initial concrete stress due to prestress.
Table 4 summarizes the comparative analysis of the linear elastic stage in State I. Thus, the experimental values for the cracking torque (Tcr, exp) and the torsional stiffness in State I ((GJ)Iexp) are
Figure 7. transition from linear cracked state to non-linear state—Ductile failure (Bernardo & lopes, 2011).
Figure 8. transition from linear cracked state to non-linear state—Fragile failure (Bernardo & lopes, 2011).
Page 15 of 19
Lopes & Bernardo, Cogent Engineering (2014), 1: 943934http://dx.doi.org/10.1080/23311916.2014.943934
indicated. The theoretical cracking torque was calculated from the following theories: Theory of Elasticity (TTEcr, calc), Skew-Bending Theory (TSBTcr, calc), and Bredt’s Thin-Tube Theory (TBTTcr, calc). The theoreti-cal values for the torsional stiffness in State I ((GJ)Icalc) was calculated for the two limit values of the minorative factor K = .7 and K = 1 (Bernardo & Lopes, 2008). The quotients between the experimental and theoretical values of the several parameters are also presented.
Table 1 shows that for beams with plain section, it is not very clear which theory generally leads to the best predictions for the cracking torque.
Figure 9. T–θ curve for Beam P2 (mitchell & Collins, 1974),
Figure 10. T–θ curve for Beam P3 (mitchell & Collins, 1985).
Figure 11. T–θ curve for Beam P8 (hsu, 1984).

Page 16 of 19
Lopes & Bernardo, Cogent Engineering (2014), 1: 943934http://dx.doi.org/10.1080/23311916.2014.943934
For beams with hollow sections, the best prediction of the cracking torque is obtained with Bredt’s Thin-Tube Theory. Despite the limited number of tested beams, it is possible to state that the trend is similar to the one observed in previous articles (Bernardo & Lopes, 2008, 2011) related with RC beams with hollow section.
Table 4 shows considerable deviations for all the beams between the theoretical and experimen-tal values of the torsional stiffness in State I ((GJ)I). It is possible that the difficulty associated to the experimental measurements of very low twists at this stage led to an inconclusive analysis.
Table 5 summarizes the comparative analysis for the linear elastic stage in State II. The experi-mental values of the ordinate at the origin ((�Tc)exp) and the torsional stiffness in State II ((GJ)IIexp)
Figure 12. T–θ curve for Beam D1 (Bernardo, 2003).
Figure 13. T–θ curve for Beam D2 (Bernardo, 2003).
table 4. Comparative analysis for elastic cracked stage (state i)Beam section
typeTcr, exp
(knm)TTE
cr, calc
(knm)Tcr, exp
TTE
cr, calc
TSBT
cr, calc
(knm)
Tcr, exp
TSBT
cr, calc
TBTT
cr, calc
(knm)Tcr, exp
TBTT
cr, calc
(GJ)I
exp
(knm2)(GJ)
I
calc
(knm2)(GJ)
I
exp
(GJ)I
calc
(GJ)I
calc
(knm2)(GJ)
I
exp
(GJ)I
calc
K = .7 K = 1.0P2 Hollow 58.0 88.6 .65 68.3 .85 55.5 1.04 24013 19338 1.24 27617 .87
P3 Plain 41.2 43.1 .96 44.8 .92 48.2 .86 11294 26212 .43 37433 .30
P8 Plain 45.2 40.8 1.11 42.9 1.05 47.6 .95 13126 9399 1.40 13422 .98
D1 Hollow 172.9 251.2 .69 166.4 1.04 165.4 1.05 152188 157283 .97 224612 .68
D2 Hollow 184.7 208.8 .89 174.2 1.06 170.5 1.08 143187 143376 1.00 204752 .70

Page 17 of 19
Lopes & Bernardo, Cogent Engineering (2014), 1: 943934http://dx.doi.org/10.1080/23311916.2014.943934
are indicated. Table 5 also includes the theoretical values calculated for the same parameters ((�Tc)calc and (GJ)IIcalc). Torsional stiffness can be calculated with or without the influence of prestress reinforcement. For Beams P3 and P8 (centered prestressed reinforcement) and for Beams D1 and D2 (external prestress), the calculation of (GJ)II should not include the influence of prestress reinforce-ment. For Beam P2 (prestressed reinforcement located in the peripheral shell area of the section) the calculation of (GJ)II should include the influence of prestress reinforcement.
Table 5 shows excellent predictions for the ordinate at the origin, ηTc, of the straight line of linear elastic behavior in State II. Except for Beam P3, the predictions for the torsional stiffness in State II, (GC)II are good.
Table 6 summarizes the comparative analysis for the non-linear stage. This table presents the experimental and theoretical values of the strength or maximum torque (Tr, exp and Tr, calc, respectively) as well as the corresponding twist values (θTr, exp and θTr, calc, respectively).
For the non-linear state, Table 3 generally shows good predictions, namely for the maximum torque.
Despite the limited number of experimental results, it seems to be possible to state that the cor-rections introduced in the equations of the theoretical models described in Section 4, in view to predict the theoretical behavior of PC beams under torsion, are valid.
Figures 9–13 illustrate graphically the results transcribed in Tables 4–6, through the T–θ Curves. For the theoretical point related to the cracking torque and for the torsional stiffness, the best pre-dictions from Table 1 were used. Figures 9–13 are in line with the general conclusions previously established from the analysis of Tables 4–6.
6. ConclusionsIn this article, some corrections were introduced in a global theoretical model previously proposed by the authors for RC beams under torsion in order to predict the global behavior of beams under torsion with uniform longitudinal prestress. These corrections were based on the introduction of prestress factors and on the modification of the longitudinal equilibrium equations for the non-linear stage.
table 6. Comparative analysis for non-linear stageBeam Tr, exp (knm) Tr, cal (knm) T
r, exp
Tr, calc
θTr, exp (°/m) θTr, cal (°/m) �Tr,exp
�Tr, calc
P2 87.1 84.1 1.04 2.80 2.03 1.38
P3 55.8 56.0 1.00 3.14 3.38 .93
P8 61.8 63.3 .98 1.89 1.88 1.01
D1 396.0 390.8 1.01 1.73 1.84 .94
D2 447.7 395.0 1.13 1.93 1.64 1.18
table 5. Comparative analysis for elastic cracked stage (state ii)Beam (ηTc)exp (knm) (ηTc)calc (knm) (�T
c)exp
(�Tc)calc
(GJ)II
exp (knm2) (GJ)
II
calc (knm2) (GJ)
II
exp
(GJ)II
calc
P2 54.1 52.2 1.04 1061.6 1173.4 .91
P3 39.1 40.0 .98 451.2 645.4 .70
P8 43.2 43.8 .99 757.0 736.8 1.03
D1 156.9 155.9 1.01 9261.2 9018.5 1.03
D2 166.0 159.5 1.04 9529.6 9219.1 1.03

Page 18 of 19
Lopes & Bernardo, Cogent Engineering (2014), 1: 943934http://dx.doi.org/10.1080/23311916.2014.943934
From the comparative analyzes performed in this study, the following conclusions can be drawn:
• For PC beams with hollow sections, the best prediction of the cracking torque is obtained with Bredt’s Thin-Tube Theory. For PC beams with plain section, it is not very clear which theory gen-erally leads to the best predictions for the cracking torque.
• Considerable deviations for all the test beams were observed between the theoretical and ex-perimental values of the torsional stiffness in State I. This is probably associated with the very small magnitude of the twists at this stage, which can lead to high dispersions of the experimen-tal measurements.
• In general, good predictions for the ascending branch of the T–θ curves in the cracked stage (State II) were obtained.
• For the non-linear state (ultimate stage), good predictions were obtained, namely for the maxi-mum torque.
Despite the limited number of experimental results, it can be stated that the correction of the global theoretical model previously developed and validated by the authors for RC beams under torsion (Bernardo & Lopes, 2008, 2011) led to generally good predictions when compared to some available experimental results of PC beams under torsion found in the literature. However, given the limited num-ber of analyzed beams, it is nevertheless important to carry out more analyzes based on further experi-mental results. Therefore, new projects aiming to testing PC beams under torsion would be very useful.
author detailsSérgio M.R. Lopes1
E-mail: [email protected]ís F.A. Bernardo2
E-mail: [email protected] FCTUC, University of Coimbra, Portugal.2 Department of Civil Engineering and Architecture, University
of Beira Interior, Edifício II das Engenharias, Calçada Fonte do Lameiro, 6201-001 Covilhã, Portugal.
Citation informationCite this article as: Theoretical model for the mechanical behavior of prestressed beams under torsion, S.M.R. Lopes & L.F.A. Bernardo, Cogent Engineering (2014), 1: 943934.
referencesAlnuaimi, A. S., & Bhatt, P. (2006). Direct design of partially
prestressed concrete hollow beams. Advances in Structural Engineering, 9, 459–476. http://dx.doi.org/10.1260/136943306778812741
Bairan Garcia, J. M., & Mari Bernat, A. R. (2006a). Coupled model for the non-linear analysis of anisotropic sections subjected to general 3D loading. Part 1: Theoretical formulation. Computers and Structures, 84, 2254–2263. http://dx.doi.org/10.1016/j.compstruc.2006.08.036
Bairan Garcia, J. M., & Mari Bernat, A. R. (2006b). Coupled model for the nonlinear analysis of sections made of anisotropic materials, subjected to general 3D loading. Part 2: Implementation and validation. Computers and Structures, 84, 2264–2276. http://dx.doi.org/10.1016/j.compstruc.2006.08.035
Bernardo, L. F. A. (2003). Torção em Vigas em Caixão de Betão de Alta Resistência [Torsion in reinforced high-strength concrete hollow beams] (PhD thesis). University of Coimbra, Portugal, 692 pp. (in Portuguese).
Bernardo, L. F. A., Andrade, J. M., & Lopes, S. M. R. (2012a). Softened truss model for reinforced NSC and HSC
FundingThe authors received no direct funding for this research.
beams under torsion: A comparative study. Engineering Structures, 42, 278–296. http://dx.doi.org/10.1016/j.engstruct.2012.04.036
Bernardo, L. F. A., Andrade, J. M., & Lopes, S. M. R. (2012b). Modified variable angle truss-model for torsion in reinforced concrete beams. Materials and Structures, 45, 1877–1902. http://dx.doi.org/10.1617/s11527-012-9876-4
Bernardo, L. F. A., Andrade, J. M. A., & Nunes, N. C. G. (in press). Generalized softened variable angle truss-model for reinforced concrete beams under torsion. Materials and Structures. doi:10.1617/s11527-014-0301-z
Bernardo, L. F. A., & Lopes, S. M. R. (2008). Behaviour of concrete beams under torsion: NSC plain and hollow beams. Materials and Structures, 41, 1143–1167. http://dx.doi.org/10.1617/s11527-007-9315-0
Bernardo, L. F. A., & Lopes, S. M. R. (2009). Torsion in HSC hollow beams: Strength and ductility analysis. ACI Structural Journal, 106, 39–48.
Bernardo, L. F. A., & Lopes, S. M. R. (2011). Theoretical behavior of HSC sections under torsion. Engineering Structures, 33, 3702–3714. http://dx.doi.org/10.1016/j.engstruct.2011.08.007
Bhatti, M. A., & Almughrabi, A. (1996). Refined model to estimate torsional strength of reinforced concrete beams. Journal of the American Concrete Institute, 93, 614–622.
Cowan, H. J. (1952). Strength of reinforced concrete under the action of combined stresses, and the representation of the criterion of failure by a space model. Nature, 169, 663 pp. http://dx.doi.org/10.1038/169663a0
Hsu, T. T. C. (1984). Torsion of reinforced concrete. New York, NY: Van Nostrand Reinhold.
Hsu, T. T. C., & Mo, Y. L. (1985). Softening of concrete in torsional members—Prestressed concrete. Journal of the American Concrete Institute, 82, 603–615.
Hsu, T. T. C., & Zhu, R. R. H. (2002). Softened membrane model for reinforced concrete elements in shear. ACI Structural Journal, 99, 460–469.
Jeng, C. H., Chiu, H. J., & Chen, C. S. (2010). Modelling the initial stresses in prestressed concrete members under torsion. ASCE Conference Proceedings, 369, 1773–1781.
Jeng, C. H., & Hsu, T. T. C. (2009). A softened membrane model for torsion in reinforced concrete members. Engineering

Page 19 of 19
Lopes & Bernardo, Cogent Engineering (2014), 1: 943934http://dx.doi.org/10.1080/23311916.2014.943934
© 2014 The Author(s). This open access article is distributed under a Creative Commons Attribution (CC-BY) 3.0 license.You are free to: Share — copy and redistribute the material in any medium or format Adapt — remix, transform, and build upon the material for any purpose, even commercially.The licensor cannot revoke these freedoms as long as you follow the license terms.
Under the following terms:Attribution — You must give appropriate credit, provide a link to the license, and indicate if changes were made. You may do so in any reasonable manner, but not in any way that suggests the licensor endorses you or your use. No additional restrictions You may not apply legal terms or technological measures that legally restrict others from doing anything the license permits.
Cogent Engineering (ISSN: 2331-1916) is published by Cogent OA, part of Taylor & Francis Group. Publishing with Cogent OA ensures:• Immediate, universal access to your article on publication• High visibility and discoverability via the Cogent OA website as well as Taylor & Francis Online• Download and citation statistics for your article• Rapid online publication• Input from, and dialog with, expert editors and editorial boards• Retention of full copyright of your article• Guaranteed legacy preservation of your article• Discounts and waivers for authors in developing regionsSubmit your manuscript to a Cogent OA journal at www.CogentOA.com
Structures, 31, 1944–1954. http://dx.doi.org/10.1016/j.engstruct.2009.02.038
Kim, K., & Yoo, C. H. (2006). Ultimate strength interaction of bending and torsion of steel/concrete composite trapezoidal box girders in positive bending. Advances in Structural Engineering, 9, 707–718. http://dx.doi.org/10.1260/136943306778827529
Koechlin, P., Andrieux, S., Millard, A., & Potapov, S. (2008). Failure criterion for reinforced concrete beams and plates subjected to membrane force, bending and shear. European Journal of Mechanics A/Solids, 27, 1161–1183. http://dx.doi.org/10.1016/j.euromechsol.2007.12.009
Mitchell, D., & Collins, M. P. (1974, March). The behavior of structural concrete beams in pure torsion. Civil Engineering Publication No.74-06. Department of Civil Engineering, University of Toronto, 88 pp.
NP EN 1992-1-1. (2010, March). Eurocode 2: Design of concrete structures—Part 1: General rules and rules for buildings.
Rahal, K. N., & Collins, M. P. (1996). Simple model for predicting torsional strength of reinforced and prestressed concrete sections. Journal of the American Concrete Institute, 93, 658–666.
Rausch, E. (1929). Design of reinforced concrete in torsion (PhD thesis). Berlin (in German).
Romano, G., Barretta, A., & Barretta, R. (2012). On torsion and shear of Saint-Venant beams. European Journal of Mechanics A/Solids, 35, 47–60. http://dx.doi.org/10.1016/j.euromechsol.2012.01.007
Wang, W., & Hsu, C. T. T. (1997). Limit analysis of reinforced concrete beams subjected to pure torsion. Journal of Structural Engineering, 123, 86–94. http://dx.doi.org/10.1061/(ASCE)0733-9445(1997)123:1(86)