thegrayinstitute‘open’high-content,fluorescencelifetime...
TRANSCRIPT
Journal of Microscopy, 2013 doi: 10.1111/jmi.12057
Received 11 December 2012; accepted 9 May 2013
The Gray Institute ‘open’ high-content, fluorescence lifetimemicroscopes
P . R . B A R B E R ∗,†, §, I . D . C . T U L L I S ∗, G . P . P I E R C E ∗,R . G . N E W M A N ∗, J . P R E N T I C E ∗, M . I . R O W L E Y §,D . R . M A T T H E W S‡, §,‖, S . M . A M E E R -B E G‡, § & B . V O J N O V I C ∗, §∗Gray Institute for Radiation Oncology & Biology, Dept. Of Oncology, University of Oxford, Oxford,U.K.
†Institute for Mathematical and Molecular Biomedicine, King’s College London, London, U.K.
‡Richard Dimbleby Department of Cancer Research, New Hunts House, King’s College London,London, U.K.
§Randall Division of Cell and Molecular Biophysics, New Hunts House, King’s College London,London, U.K.
‖Now at The University of Queensland, Brisbane St Lucia, Australia
Key words. FLIM, FRET, high-content microscopy, TCSPC, tissue microarray.
Summary
We describe a microscopy design methodology and detailsof microscopes built to this ‘open’ design approach. Thesedemonstrate the first implementation of time-domain fluo-rescence microscopy in a flexible automated platform withthe ability to ease the transition of this and other advancedmicroscopy techniques from development to use in routine bi-ology applications. This approach allows easy expansion andmodification of the platform capabilities, as it moves awayfrom the use of a commercial, monolithic, microscope bodyto small, commercial off-the-shelf and custom made modularcomponents. Drawings and diagrams of our microscopes havebeen made available under an open license for noncommercialuse at http://users.ox.ac.uk/∼atdgroup. Several automatedhigh-content fluorescence microscope implementations havebeen constructed with this design framework and optimized forspecific applications with multiwell plates and tissue microar-rays. In particular, three platforms incorporate time-domainFLIM via time-correlated single photon counting in an auto-mated fashion. We also present data from experiments per-formed on these platforms highlighting their automated wide-field and laser scanning capabilities designed for high-contentmicroscopy. Devices using these designs also form radiation-beam ‘end-stations’ at Oxford and Surrey Universities, show-ing the versatility and extendibility of this approach.
Correspondence to: P. R. Barber, Gray Institute for Radiation Oncology & Biology,
Dept. of Oncology, University of Oxford, Old Road Campus Research Building, Roo-
sevelt Drive, Oxford, OX3 7DQ, U.K. Tel: 01865 617392; fax: 01865 617334;
e-mail: [email protected]
Introduction
One of the most highly resolved optical imaging techniquesfor the study of live cells is fluorescence microscopy and thisremains the mainstay for imaging intact cells and other bi-ological samples. High-content information using automatedfluorescence microscopes and large numbers of biological cellsis required for many assays to counter the biological noise ofthe ensemble, for example the study of protein–protein inter-actions (Hu & Kerppola, 2003) and is essential where the aimis the detection of rare events, such as performing gene knock-down and RNAi assays (Neumann et al., 2006). Automatedfluorescence microscopes designed for such experiments aretherefore crucial to such assays and necessarily must be ableto handle a large data throughput (the high-resolution scan-ning of a tissue microarray (TMA) or a 384-well plate of livecells may require the acquisition of more than 1 billion pixels ofinformation). It is also important that, for whole assay automa-tion, any microscopy imaging system developed is compatiblewith robot-assisted preparation of samples in terms of its phys-ical arrangement (e.g. an inverted microscope geometry withsimple access to the sample and/or minimal mechanical partsabove the sample position).
With this in mind, the development of an ‘Open’ automatedfluorescence microscopy platform, in which significant designaspects are not hidden, is very desirable in a research envi-ronment. It is further desirable that these platforms use read-ily obtainable components as far as possible, in conjunctionwith a minimum of specialised ‘in-house’ developed subassem-blies. Where the latter are essential, these should be imple-mented to ‘open’ standards and complemented by mature and
C© 2013 The Authors. Journal of Microscopy published by John Wiley & Sons Ltd on behalf of Royal Microscopical Society.
This is an open access article under the terms of the Creative Commons Attribution License, which permits use, distribution and reproduction in any medium, provided theoriginal work is properly cited.

2 P . R . B A R B E R E T A L .
sufficiently advanced commercial products (cameras, detec-tors, lenses, etc.). As well as being able to meet the abovecriteria, such a system should also be able to accommodatenovel techniques, which can be implemented and made avail-able for routine biological use much more quickly than com-mercial companies can release a new product based on noveltechnology. The problems associated with relying solely on thecommercial development of products is not just one of time,but this route is by no means guaranteed to happen at all, itmay be expensive when it does happen and users may then bereliant on a specific company for support.
The commercial route has its place, of course, as operatingmicroscopes of this type often requires support from technicalpersonnel and, on a large scale, companies are best placed toprovide this long-term support. The advantages of in-house de-velopment are clear when flexibility is required to perform newand varied experiments. Furthermore, the knowledge gainedin development remains in-house, and includes device capa-bilities and limitations, such that the microscope is no longer a‘black box’. Once a system has been installed, experiment flex-ibility is also highly desirable in a University research environ-ment (as opposed to an industrial screening programme) andallows the use of different imaging modalities, such as time-and polarization-resolved imaging that have been included inour platform designs. The performance of an in-house systemcan be optimized for the local experiments and system com-ponents added as required. The platform must also providequantitative data for bioinformatics and have the ability to op-timize, often on a daily basis, what information is exported andin the most appropriate format. In-house developed systemsare therefore optimal in many circumstances. By publishingand releasing details of our systems, with drawings, circuit di-agrams and source code for custom items, we hope that otherusers can take a speedier route to in-house developed andmaintained high-content microscope platforms.
Recently, an open-source software framework for drivingsuch microscopes, Micromanager,1 has come to fruition (Edel-stein et al., 2010). We chose, at an early stage in our platformdevelopment, not to use this framework but instead to developour own. At that time, Micromanager did not support the de-vices we required and tests showed that it had stability prob-lems. Device support for Micromanager and stability has im-proved and it would be possible in the future for our frameworksoftware to support the open-source Micromanager drivers.The two are thus not mutually exclusive. We stress that thedecision to develop the in-house framework was driven by theneed for greater flexibility and less dependence on third parties.Our own experience has shown that software under in-housecontrol could be written to have the features desired of theseplatforms; we could not be sure that Micromanager could meetthose needs. Other microscope acquisition programs are ableto provide some automation through macro languages and
1 http://valelab.ucsf.edu/∼MM/MMwiki/index.php/Micro-Manager
similar approaches.2 These environments are not suitable forthe development of the novel applications and functions thatare described in this paper which require direct interfacingwith time critical hardware and the use of manufacturers’software development kits.
In particular, our implementations of automated platformshave been designed and constructed to incorporate fluores-cence lifetime imaging (FLIM) and have been optically op-timized for time-domain FLIM performed by time-correlatedsingle photon counting (TCSPC), demonstrating the first im-plementation of this type whereas previously published sys-tems have incorporated frequency-domain FLIM (e.g. Espositoet al., 2007). The optical path has been simplified to be moresuitable for short laser pulses and provides high light through-put by minimizing optical paths and reflections from surfaces.The inclusion of FLIM is important as it is the gold standardmethod for the detection of protein–protein interactions viaForster resonance energy transfer (FRET; Becker et al., 2001)and is therefore particularly significant for high-content pro-teomic studies.
In particular, we have combined a laser scanning arrange-ment that is easily registered with camera-based imaging.This allows fast, sequential and automated operation witha conventional wide-field camera, using multiple fluorescence‘cubes’ in combination with laser-scanning, or laser-scanningconfocal, FLIM. A specific advantage of the system describedhere is the combination of laser, camera and stage scanningtogether for both micro and meso-imaging. Although similararrangements have been recently made available commer-cially, (e.g. Prior,3 Leica4) we are better able to improve andchange the system as required for specific applications. Theswitching speed between modes (wide-field fluorescence, laserscanning, etc.) is faster than in many commercial microscopesand is achieved through the use of a customized optical pathswitch and a cube changing unit; these modify the optical path,switching between modes in typically less than one second. Toensure that quantitative fluorescence microscopy can be per-formed over extended periods of time, and results comparedbetween experiments performed weeks apart, the fluorescenceexcitation path includes an excitation optical power monitorthat measures the illumination power of every fluorescence ex-posure. This provides us with the ability to measure long-termexcitation stability. Furthermore the sample illumination of-fers extremely ‘flat’, i.e. even, illumination across the samplefield, with less than ±2% variation across the imaged field.
In this paper, a general overview of a complete ‘open’ high-content FLIM microscope is provided and details are given onspecific custom-made components, where space allows, and inthe Supporting Information, where more detailed descriptions
2 e.g. ImagePro: http://www.mediacy.com/index.aspx?page=Image_Pro_All_
Prods, and Metamorph: www.metamorph.com3 http://www.prioruk.com4 http://www.leica-microsystems.com/products/light-microscopes/
C© 2013 The Authors. Journal of Microscopy published by John Wiley & Sons Ltd on behalf of Royal Microscopical Society.
G R A Y O P E N L I F E T I M E M I C R O S C O P E S 3
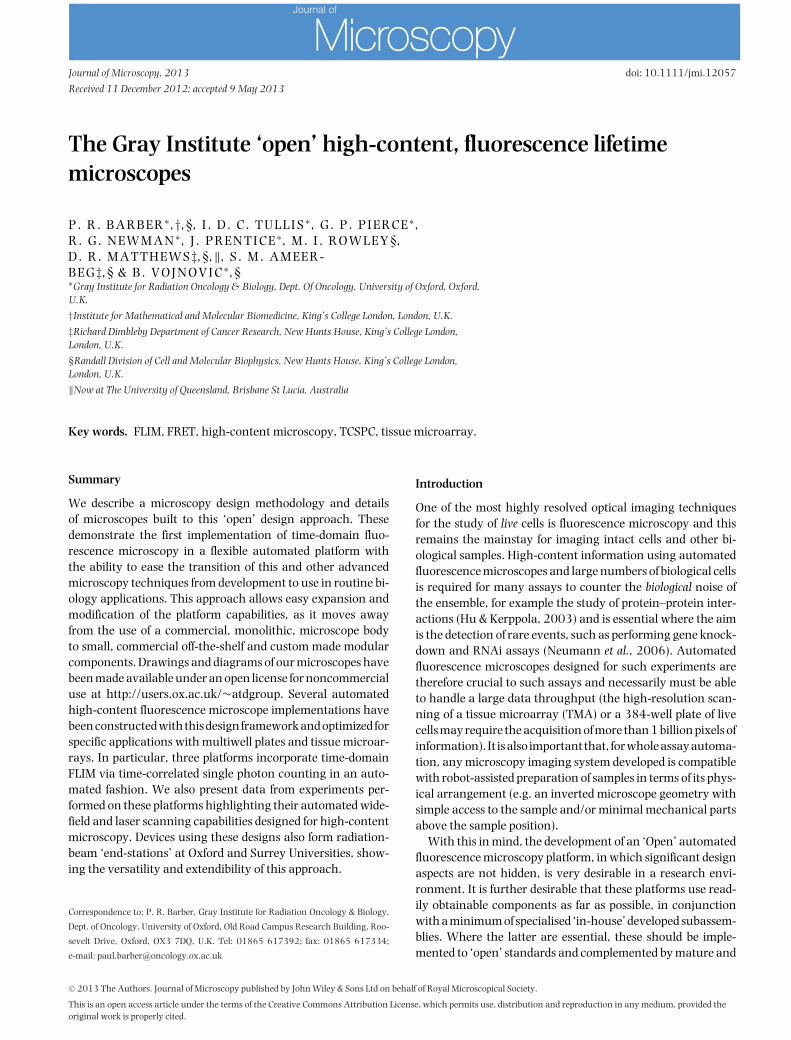
Fig. 1. The Open Microscope ‘Abbe’. (a) External photograph with light shielding in place around the optical components. (b, c) 3-D rendered CAD of theinternal optics.
are provided. Furthermore, aspects of some custom designedparts are described online, where appropriate, on our groupWebsite5 and detailed CAD drawings (SolidWorks,6 Waltham,Massachusetts, USA) can be made available to interested par-ties. To date we have constructed six systems; although theassemblies vary significantly, they share much of their hard-ware designs. The control software is more generally applica-ble and currently drives an additional four microscopes, basedon commercial Nikon microscope bodies. This reuse of the soft-ware enables us to build up a suite of microscopes that all havea common interface but with varying mixes of in-house andcommercial hardware, and varying levels of automation.
In the following sections the custom hardware componentsare described, followed by descriptions of the major softwarecomponents. The applications section demonstrates how dif-ferent combinations of hardware have been used for practicalpurposes since completion and details of the two principal sys-tems named ‘Abbe’ and ‘Galileo’, installed at The Gray Insti-tute, University of Oxford, and at The Randall Division, King’sCollege London are presented here.
Hardware development
The descriptions that follow relate principally to the ‘Abbe’ sys-tem is pictured in Figure 1 along with the 3-D rendered CAD
5 http://users.ox.ac.uk/∼atdgroup6 http://www.solidworks.com/
output. The construction mainly consists of an optical cageframework (30- and 60-mm cage systems, Thorlabs Ltd., Ely,UK) with some custom made assemblies where extra stabilityor construction flexibility was required. The inverted fluores-cence microscope arrangement is employed with no compo-nents above the sample stage so as to make it compatible withsample preparation robots (e.g. the PerkinElmer JANUS7). Thesystems occupy approximately 1 m3, with a bench footprintof ∼800 × 700 mm, including electronic modules and thecomputer housing, in addition to space for operator seating.
The main construction links together the following ma-jor commercial components: a fluorescence excitation illu-minator (Lumen 200, Prior Ltd, Cambridge, UK); an opti-cal shutter (VS25–52-ZM1, Uniblitz, Rochester, New York,USA); a white-light continuum laser (SC450-M, 80 MHz rep.rate, 4 ps pulse width, 450–2400 nm, Fianium Ltd, Ham-ble, UK); galvanometer-based mirror scanners (VM1000, GSIGroup, Unterschleissheim, Germany); filters (Semrock Inc.,Rochester, New York, USA) and filter cubes (TE2000 style,Nikon UK Ltd, Kingston Upon Thames, UK); piezo z-drive(Mipos 500 SG, PiezoSystem Jena GmbH, Jena, Germany);objective lens (e.g. 20x 0.75 NA S Fluor or 40x 0.9 NA SFluor, Nikon UK Ltd.); motorised sample translation x-y stage(SCAN IM 100×100 with ITK Corvus Controller, Marzhauser
7 http://www.perkinelmer.com/Catalog/Category/ID/Janus
C© 2013 The Authors. Journal of Microscopy published by John Wiley & Sons Ltd on behalf of Royal Microscopical Society.
4 P . R . B A R B E R E T A L .
Wetzlar GmbH & Co. KG, Wetzlar, Germany); wide-field flu-orescence camera (1.3 megapixel, ORCA-ERII, HamamatsuPhotonics UK Ltd, Welwyn Garden City, UK); photomultipliertime-resolved detector (PMH-100–0, Becker and Hickl GmbH,Berlin, Germany); TCSPC acquisition electronics (SPC-830,Becker and Hickl GmbH); and PC running Windows XP (DualPentium 3 GHz, 2 GB RAM, Scan Computers InternationalLtd, Bolton, UK). Numerous additional commercial compo-nents (lenses, mirrors etc.) have also been used and all areavailable off the shelf.
These commercial components are supplemented by in-house developed electromechanical devices controlled via aninternal distributed I2C bus.8 This internal bus is derived froma single USB connection to the host computer. The I2C-drivensubassembies include a communications hub, an optical pathswitch, a filter cube changer, laser scanners, an excitationpower monitor and a coarse z-drive. These components aredescribed in the following subsections and, in addition, thesupporting and online information provide more details in-cluding circuit diagrams and printed circuit board layouts forthese and other components and accessories.
The machining and construction cost of in-house developedcomponents is no more than £6,500 (10,000 US$) which in-cludes the framework, optical mounting and optics for the lasermounting, XY laser scanning system, fluorescence detection,cube slider, optical path switch and wide-field fluorescenceillumination. The overall cost, including the galvanometerscanners, lenses, etc. is well within £11,000 (17,000 US$),which is significantly lower than that of commercial systemsof comparable complexity and which are likely to be com-plemented by similar objectives, stages and stage controllers,cameras, etc, which inevitably raise overall cost. Commercialmicroscope bodies can be fitted with a number of output portsbut these, in general, must be specified at time of orderingand cannot be retro-added when experimental requirementschange. Commercial microscope bodies are engineered in away to allow transportation and are often supplied in modularform, and their rugged construction is usually associated witha high degree of mechanical stability and low temperaturedrift. The stability of the Abbe system has been assessed overa period of 30 h when the unit was in a normal laboratoryenvironment, with the ambient temperature varying by nomore than a few degrees, by measuring the Z-drive autofocusposition and X, Y image shift by crosscorrelation (see Support-ing Information). The peak-to-peak drift in X, Y and Z was nomore than 2 µm, with a standard deviation of less than 0.5µm. Although microscopes with a monolithic body may havetheoretical stabilities superior to this, it is our experience that,in practice, the overall stability is determined primarily by theparticular stage inserts used and by the method of holding asample (specimen slide, multiwell plate, etc.) in the stage in-
8 “I2C bus specification and user manual”, http://www.nxp.com/acrobat/
usermanuals/UM10204_3.pdf
sert. Tests with a Nikon Eclipse body, fitted with a similar stage,yielded very comparable drifts in the same environment.
Fluorescence excitation path
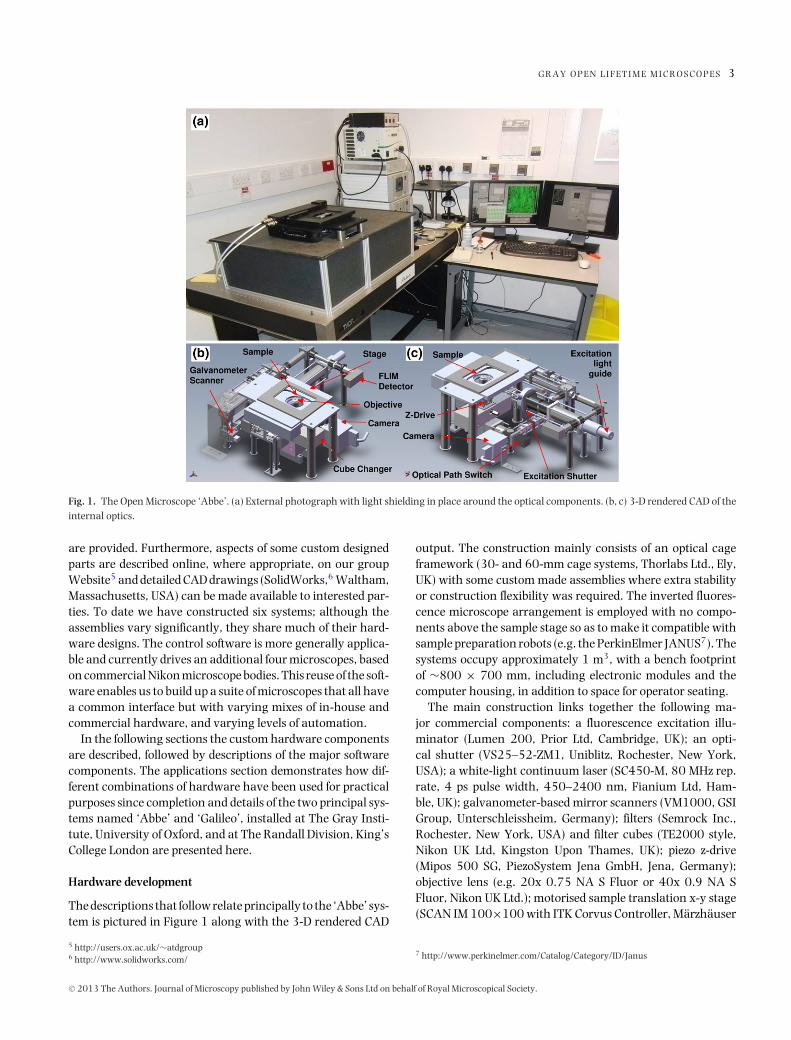
The fluorescence excitation path for wide-field camera-basedimaging uses the conventional Kohler epi-illumination opticalarrangement in a folded path as shown in Figure 2. This ar-rangement has been designed to provide a uniform and stableexcitation field, a task made easier by the use of the Prior Lu-men 200 source’s liquid light-guide. Lenses (L1 and L2) collectand collimate the light from the guide through the fast opticalshutter and the condenser aperture (A1). Lenses (L3 and L4)form the Kohler arrangement where the illuminated field canbe adjusted with the field aperture (A2). The path is folded withmirrors M1 and M2. After L4, light is directed into the objectivelens by the fluorescence filter cube (FL cube). Emission fromthe sample proceeds through the FL cube and is directed to thecamera by a mirror and the optical path switch (c.f. Figures S2and S6), focussed by a 200 mm tube lens (L6, Nikon CF 160series, part #NT58–520, Edmund Optics Ltd, York, UK). Theillumination field flatness (Fig. 2c) does not vary significantlywith the range of 10x, 20x and 40x, S Fluor and LU Plan FluorNikon objectives in our possession. The illumination flatnessis significantly superior to that provided by conventional mer-cury lamps and is primarily, but not exclusively the result ofusing a liquid-filled optical guide.
Laser beam scanners
Laser scanning microscopy requires a method of laser beamscanning, such that a collimated beam is pivoted on theback focal plane of the objective. In common with the ma-jority of laser scanning microscopy, we use mirror-basedgalvanometer-driven scanners: these devices are straightfor-ward to use and provide high light throughput. Two suchscanners are required (for the X and Y directions) to be lo-cated at the first focal plane of the scan lens (L11 in Fig. 3)for optimal performance. In other systems, the scannersare often arranged to be both as close as possible to thispoint in a so-called ‘close-coupled’ arrangement, because twogalvanometer-driven scanners cannot be physically at thesame point.
To allow a greater optical aperture through the scanningsystem, we have chosen to link the scanners with an optical re-lay 4-f system (see Fig. 3). This decision introduces additionaloptics into the laser beam path and as a result may also com-promise the beam quality and therefore the achievable imageresolution. This is not such a problem considering the FLIMapplication where, in practice, the resolution is often reducedintentionally, through post-acquisition pixel binning, to ob-tain sufficient photon counts within each pixel or to provide asatisfactory time resolution with the available acquisition cardmemory, usually operated to provide a 256 × 256 pixel image
C© 2013 The Authors. Journal of Microscopy published by John Wiley & Sons Ltd on behalf of Royal Microscopical Society.
G R A Y O P E N L I F E T I M E M I C R O S C O P E S 5
Fig. 2. (a) Fluorescence (FL) excitation path for camera-based imaging: L, lens; A, aperture; M, mirror; D, dichroic mirror. The possibility for an additionalexcitation source is shown entering from the left via D1. (b) Example image of hematoxylin and eosin stained tissue taken with a FL cube for Cy2 withprofile of a line drawn in yellow from bottom right to top left. (c) An average of 10 images of a uniform fluorescent sample at semi-random stage positionsto even out tissue structure (normalized display bit depth) showing flat illumination to within 4% over the image (note the expanded vertical scale).
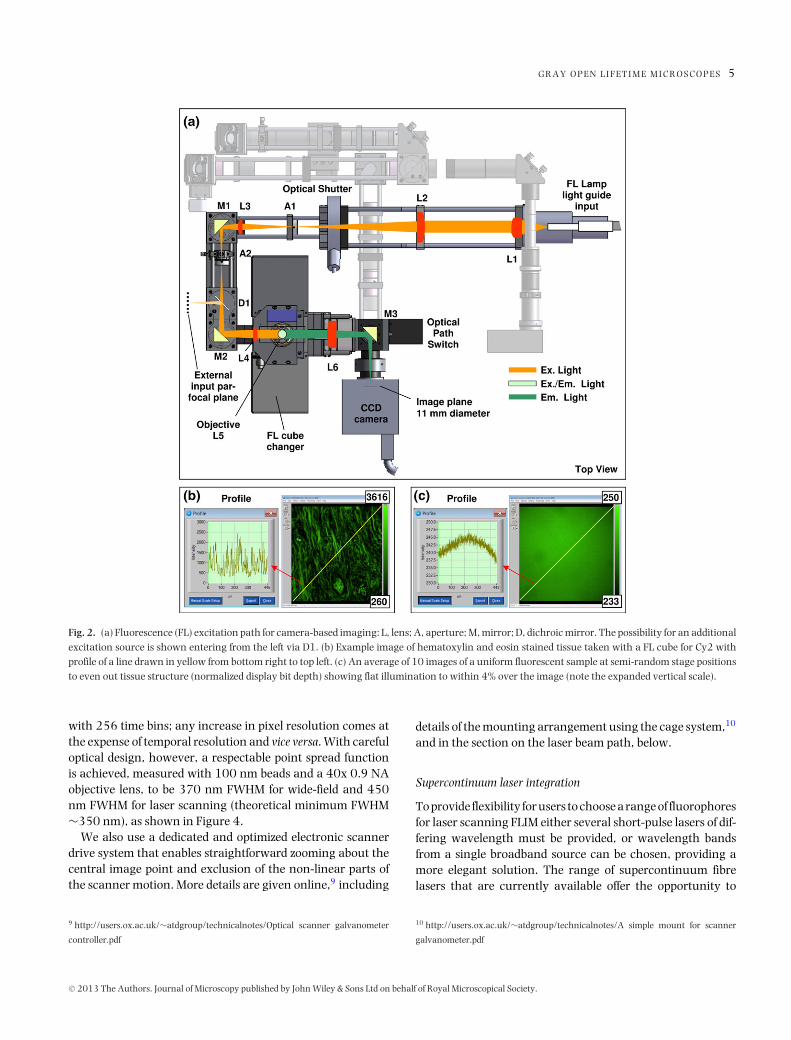
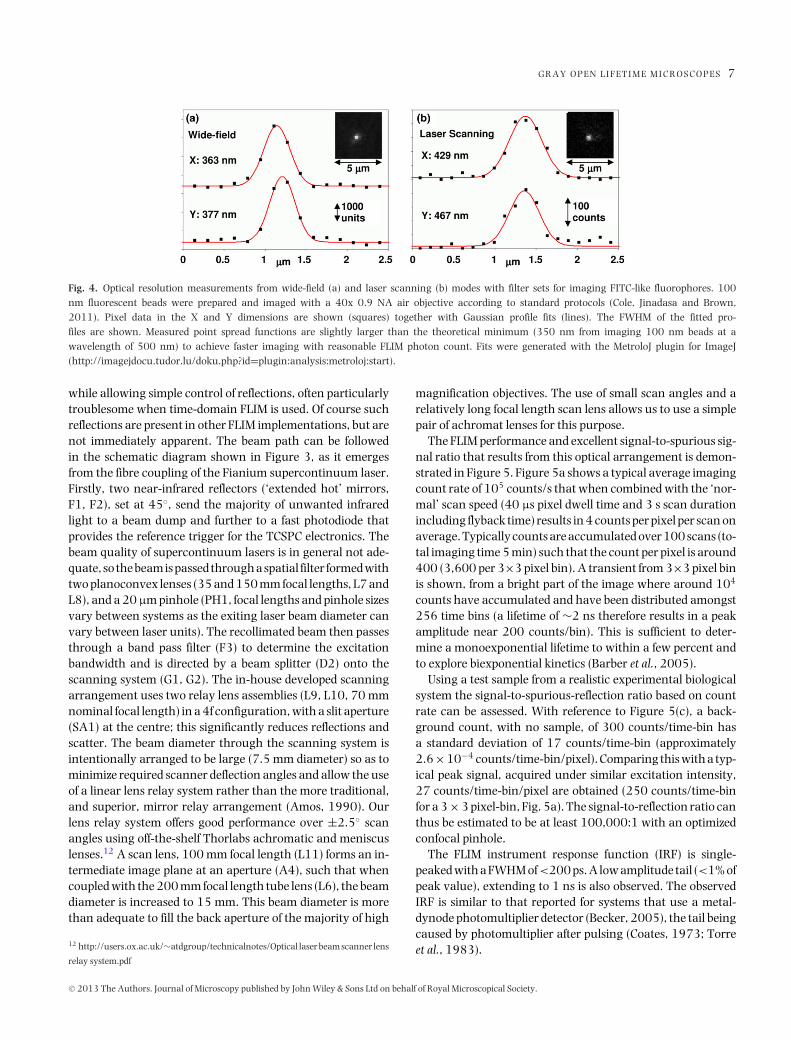
with 256 time bins; any increase in pixel resolution comes atthe expense of temporal resolution and vice versa. With carefuloptical design, however, a respectable point spread functionis achieved, measured with 100 nm beads and a 40x 0.9 NAobjective lens, to be 370 nm FWHM for wide-field and 450nm FWHM for laser scanning (theoretical minimum FWHM∼350 nm), as shown in Figure 4.
We also use a dedicated and optimized electronic scannerdrive system that enables straightforward zooming about thecentral image point and exclusion of the non-linear parts ofthe scanner motion. More details are given online,9 including
9 http://users.ox.ac.uk/∼atdgroup/technicalnotes/Optical scanner galvanometer
controller.pdf
details of the mounting arrangement using the cage system,10
and in the section on the laser beam path, below.
Supercontinuum laser integration
To provide flexibility for users to choose a range of fluorophoresfor laser scanning FLIM either several short-pulse lasers of dif-fering wavelength must be provided, or wavelength bandsfrom a single broadband source can be chosen, providing amore elegant solution. The range of supercontinuum fibrelasers that are currently available offer the opportunity to
10 http://users.ox.ac.uk/∼atdgroup/technicalnotes/A simple mount for scanner
galvanometer.pdf
C© 2013 The Authors. Journal of Microscopy published by John Wiley & Sons Ltd on behalf of Royal Microscopical Society.

6 P . R . B A R B E R E T A L .
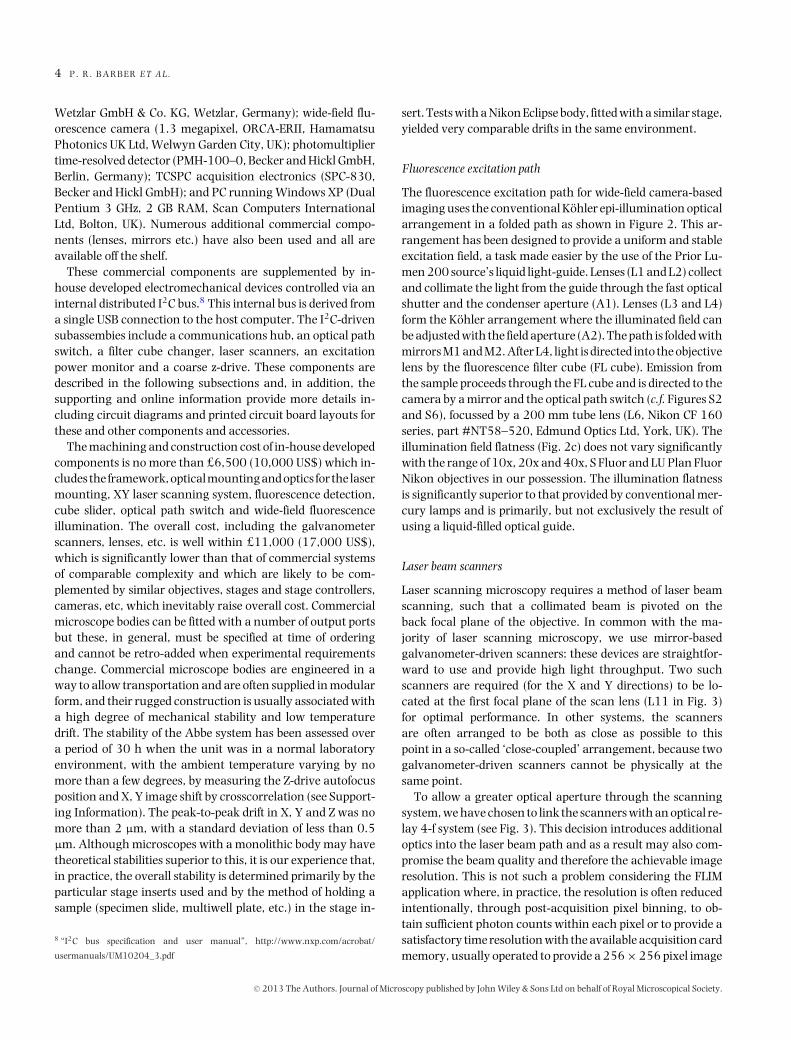
Fig. 3. Schematic diagram of the laser scanning beam path (see text for description). L, lens; F, filter; PH, pinhole; A, aperture; SA, slit aperture; D, dichroicmirror; G, galvanometer. (a) Cut-away side view showing the laser beam conditioning optics at the back of the system. (b) View showing a cut-away sideview of the beam scanning optics. (c) Top view of the whole system combining the optics from views (a) and (b) with the rest of the system including thephotomultiplier arm.
do the latter. The available wavelength range extends downto ∼450 nm (or lower, depending on laser model) and wellinto the infrared. These lasers also provide short pulses (∼4ps) suitable for time-domain FLIM with a reasonably con-stant pulse shape over a range of powers. We select excitationand emission wavelengths with manually replaceable filters(Fig. 3, F3 and F4) and either a dichroic (Fig. 3, D2) or partiallysilvered mirror, though a motorised filter changer could alsobe incorporated. We have solved several engineering aspectsassociated with mounting these lasers and the exclusion ofunwanted infrared light present in the beam; these are shown
in Figure 3 (F1 and NIR beam dump) and more details areavailable online.11
Laser scanning beam path
The beam path for laser scanning has been designed to offeran optimal compromise between beam and image quality andthe number of optical components. Minimizing optical compo-nents has advantages in reducing light scatter and power loss
11 http://users.ox.ac.uk/∼atdgroup/technicalnotes/Fianium laser optical head
mounting.pdf
C© 2013 The Authors. Journal of Microscopy published by John Wiley & Sons Ltd on behalf of Royal Microscopical Society.
G R A Y O P E N L I F E T I M E M I C R O S C O P E S 7
Fig. 4. Optical resolution measurements from wide-field (a) and laser scanning (b) modes with filter sets for imaging FITC-like fluorophores. 100nm fluorescent beads were prepared and imaged with a 40x 0.9 NA air objective according to standard protocols (Cole, Jinadasa and Brown,2011). Pixel data in the X and Y dimensions are shown (squares) together with Gaussian profile fits (lines). The FWHM of the fitted pro-files are shown. Measured point spread functions are slightly larger than the theoretical minimum (350 nm from imaging 100 nm beads at awavelength of 500 nm) to achieve faster imaging with reasonable FLIM photon count. Fits were generated with the MetroloJ plugin for ImageJ(http://imagejdocu.tudor.lu/doku.php?id=plugin:analysis:metroloj:start).
while allowing simple control of reflections, often particularlytroublesome when time-domain FLIM is used. Of course suchreflections are present in other FLIM implementations, but arenot immediately apparent. The beam path can be followedin the schematic diagram shown in Figure 3, as it emergesfrom the fibre coupling of the Fianium supercontinuum laser.Firstly, two near-infrared reflectors (‘extended hot’ mirrors,F1, F2), set at 45◦, send the majority of unwanted infraredlight to a beam dump and further to a fast photodiode thatprovides the reference trigger for the TCSPC electronics. Thebeam quality of supercontinuum lasers is in general not ade-quate, so the beam is passed through a spatial filter formed withtwo planoconvex lenses (35 and 150 mm focal lengths, L7 andL8), and a 20 µm pinhole (PH1, focal lengths and pinhole sizesvary between systems as the exiting laser beam diameter canvary between laser units). The recollimated beam then passesthrough a band pass filter (F3) to determine the excitationbandwidth and is directed by a beam splitter (D2) onto thescanning system (G1, G2). The in-house developed scanningarrangement uses two relay lens assemblies (L9, L10, 70 mmnominal focal length) in a 4f configuration, with a slit aperture(SA1) at the centre; this significantly reduces reflections andscatter. The beam diameter through the scanning system isintentionally arranged to be large (7.5 mm diameter) so as tominimize required scanner deflection angles and allow the useof a linear lens relay system rather than the more traditional,and superior, mirror relay arrangement (Amos, 1990). Ourlens relay system offers good performance over ±2.5◦ scanangles using off-the-shelf Thorlabs achromatic and meniscuslenses.12 A scan lens, 100 mm focal length (L11) forms an in-termediate image plane at an aperture (A4), such that whencoupled with the 200 mm focal length tube lens (L6), the beamdiameter is increased to 15 mm. This beam diameter is morethan adequate to fill the back aperture of the majority of high
12 http://users.ox.ac.uk/∼atdgroup/technicalnotes/Optical laser beam scanner lens
relay system.pdf
magnification objectives. The use of small scan angles and arelatively long focal length scan lens allows us to use a simplepair of achromat lenses for this purpose.
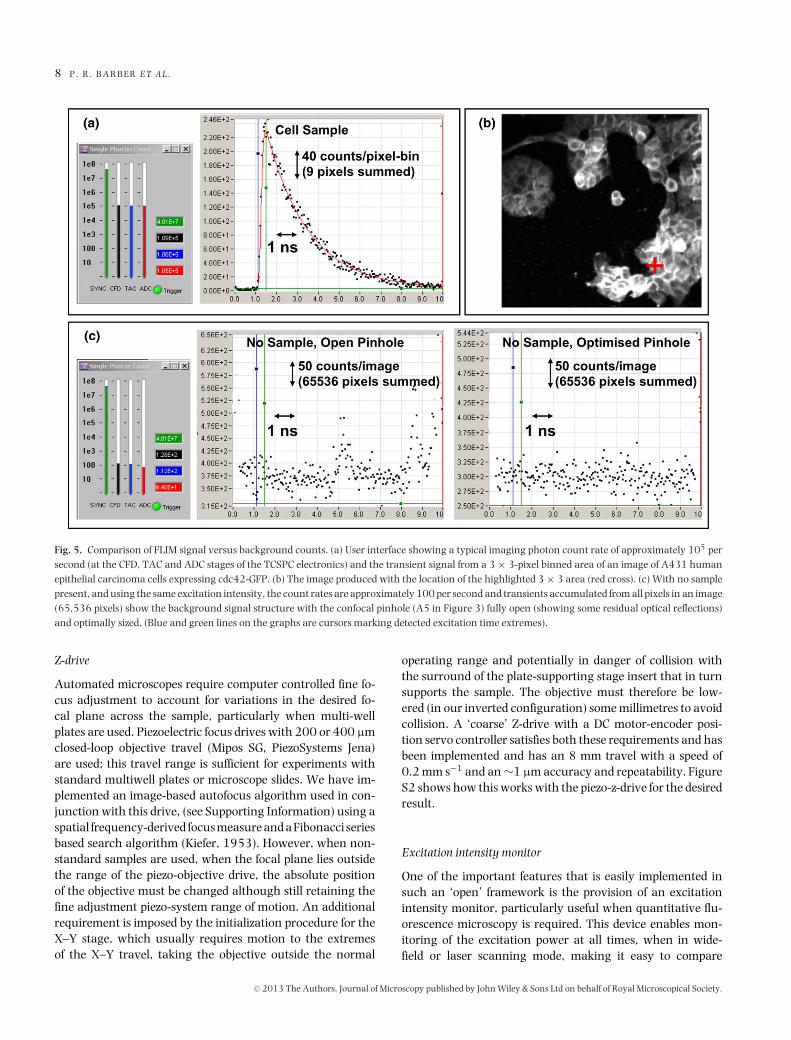
The FLIM performance and excellent signal-to-spurious sig-nal ratio that results from this optical arrangement is demon-strated in Figure 5. Figure 5a shows a typical average imagingcount rate of 105 counts/s that when combined with the ‘nor-mal’ scan speed (40 µs pixel dwell time and 3 s scan durationincluding flyback time) results in 4 counts per pixel per scan onaverage. Typically counts are accumulated over 100 scans (to-tal imaging time 5 min) such that the count per pixel is around400 (3,600 per 3×3 pixel bin). A transient from 3×3 pixel binis shown, from a bright part of the image where around 104
counts have accumulated and have been distributed amongst256 time bins (a lifetime of ∼2 ns therefore results in a peakamplitude near 200 counts/bin). This is sufficient to deter-mine a monoexponential lifetime to within a few percent andto explore biexponential kinetics (Barber et al., 2005).
Using a test sample from a realistic experimental biologicalsystem the signal-to-spurious-reflection ratio based on countrate can be assessed. With reference to Figure 5(c), a back-ground count, with no sample, of 300 counts/time-bin hasa standard deviation of 17 counts/time-bin (approximately2.6×10−4 counts/time-bin/pixel). Comparing this with a typ-ical peak signal, acquired under similar excitation intensity,27 counts/time-bin/pixel are obtained (250 counts/time-binfor a 3 × 3 pixel-bin, Fig. 5a). The signal-to-reflection ratio canthus be estimated to be at least 100,000:1 with an optimizedconfocal pinhole.
The FLIM instrument response function (IRF) is single-peaked with a FWHM of<200 ps. A low amplitude tail (<1% ofpeak value), extending to 1 ns is also observed. The observedIRF is similar to that reported for systems that use a metal-dynode photomultiplier detector (Becker, 2005), the tail beingcaused by photomultiplier after pulsing (Coates, 1973; Torreet al., 1983).
C© 2013 The Authors. Journal of Microscopy published by John Wiley & Sons Ltd on behalf of Royal Microscopical Society.
8 P . R . B A R B E R E T A L .
Fig. 5. Comparison of FLIM signal versus background counts. (a) User interface showing a typical imaging photon count rate of approximately 105 persecond (at the CFD, TAC and ADC stages of the TCSPC electronics) and the transient signal from a 3 × 3-pixel binned area of an image of A431 humanepithelial carcinoma cells expressing cdc42-GFP. (b) The image produced with the location of the highlighted 3 × 3 area (red cross). (c) With no samplepresent, and using the same excitation intensity, the count rates are approximately 100 per second and transients accumulated from all pixels in an image(65,536 pixels) show the background signal structure with the confocal pinhole (A5 in Figure 3) fully open (showing some residual optical reflections)and optimally sized. (Blue and green lines on the graphs are cursors marking detected excitation time extremes).
Z-drive
Automated microscopes require computer controlled fine fo-cus adjustment to account for variations in the desired fo-cal plane across the sample, particularly when multi-wellplates are used. Piezoelectric focus drives with 200 or 400 µmclosed-loop objective travel (Mipos SG, PiezoSystems Jena)are used; this travel range is sufficient for experiments withstandard multiwell plates or microscope slides. We have im-plemented an image-based autofocus algorithm used in con-junction with this drive, (see Supporting Information) using aspatial frequency-derived focus measure and a Fibonacci seriesbased search algorithm (Kiefer, 1953). However, when non-standard samples are used, when the focal plane lies outsidethe range of the piezo-objective drive, the absolute positionof the objective must be changed although still retaining thefine adjustment piezo-system range of motion. An additionalrequirement is imposed by the initialization procedure for theX–Y stage, which usually requires motion to the extremesof the X–Y travel, taking the objective outside the normal
operating range and potentially in danger of collision withthe surround of the plate-supporting stage insert that in turnsupports the sample. The objective must therefore be low-ered (in our inverted configuration) some millimetres to avoidcollision. A ‘coarse’ Z-drive with a DC motor-encoder posi-tion servo controller satisfies both these requirements and hasbeen implemented and has an 8 mm travel with a speed of0.2 mm s−1 and an ∼1 µm accuracy and repeatability. FigureS2 shows how this works with the piezo-z-drive for the desiredresult.
Excitation intensity monitor
One of the important features that is easily implemented insuch an ‘open’ framework is the provision of an excitationintensity monitor, particularly useful when quantitative flu-orescence microscopy is required. This device enables mon-itoring of the excitation power at all times, when in wide-field or laser scanning mode, making it easy to compare
C© 2013 The Authors. Journal of Microscopy published by John Wiley & Sons Ltd on behalf of Royal Microscopical Society.
G R A Y O P E N L I F E T I M E M I C R O S C O P E S 9
and normalize experimental results. It offers an additionallevel of quality control and provides means to remove un-certainties associated with the illumination such as excitationsource and optical alignment and sample staining efficacy;these are in general uncontrolled in traditional epifluorescenceor laser scanning microscopy. Individual excitation monitorsare easily calibrated against one another using a large areaphotodiode or power meter allowing comparison between mi-croscopes in an additional level of standardisation.
The timing and duration of the power measurement mustoccur during the imaging exposure. This uses a softwarethread in the main program that is started simultaneouslywith acquisition. The thread contains an appropriate pro-grammable delay to synchronize the measurement relativeto the acquisition with an accuracy of a few milliseconds. Thetime required for digitization is of the order of 60 ms, and there-fore the power associated with exposures of typically less than100 ms cannot be measured. The excitation monitor uses aphotodiode to monitor a partial optical reflection of the excita-tion light (Fig. S4). The photodiode output is passed througha logarithmic amplifier so that the very wide range (sub-nWto mW) can be processed before digitization.
Fluorescence filter cube changing unit
Wide-field fluorescence imaging is conventionally achievedusing a ‘cube’ of optical filters suitably arranged to give the re-quired wavelength discrimination (Ploem and Tanke, 1987).We employ cubes made to fit Nikon TE2000 microscopes anduse motorised switching between them for different wave-length ranges with a filter cube changing unit. For simplicity ofconstruction, we opted for a linear arrangement of cubes. Thishas the disadvantage that only three cube positions can beimplemented; however, we have found this sufficient for mosthigh content imaging applications. Our unit employs a gearedDC motor to drive the cube slider through a rack and pinionarrangement and a step-wise position feedback arrangement(Fig. S5). Cube changing occurs in around 1 s.
Optical path switch
A motorised optical path switch is used in our platforms toguide light from the objective/tube lens to a camera or tothe laser scanning arm for FLIM. This uses a kinematicallymounted corner reflector prism, driven by a microsteppingmotor that offers position changing in hundreds of millisec-onds. High level software controls this and keeps track of whichdevice (camera, etc.) is on which optical port (Fig. S6).
Software development
Software is the ‘glue’ that empowers the hardware compo-nents to behave as an integrated imaging platform. This soft-ware ties together disparate hardware components, be they
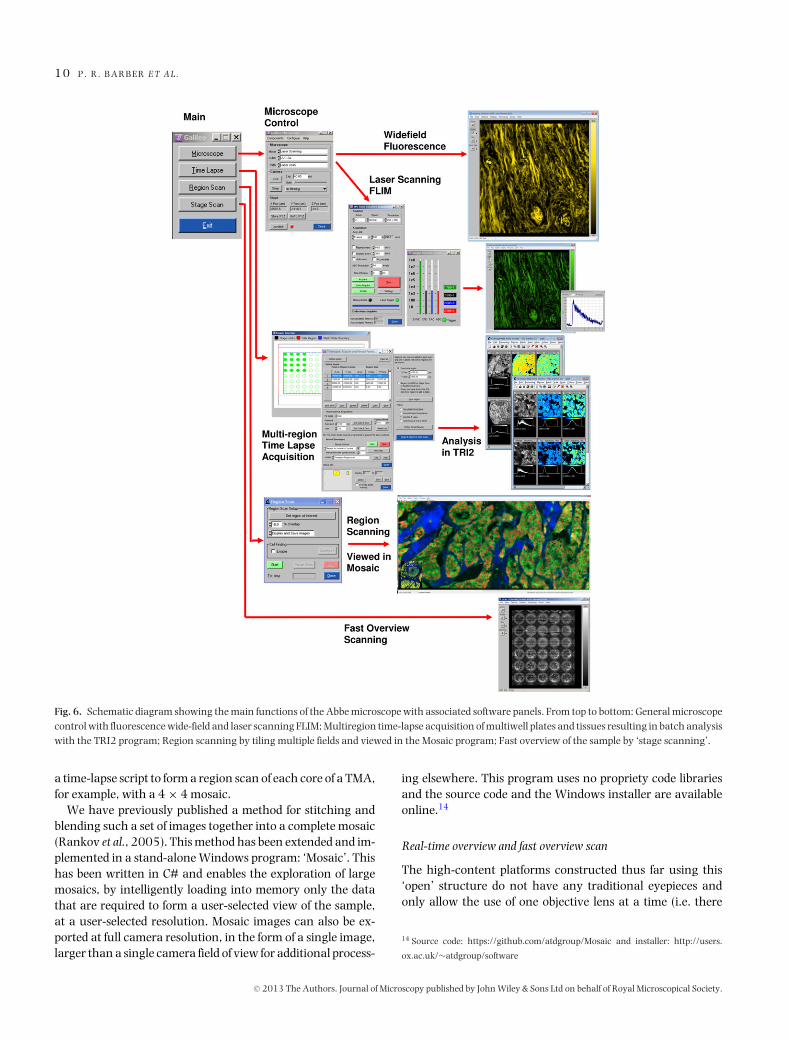
custom built or from an OEM supplier, to perform high-levelfunctions and experiment protocols. The main capabilities ofthe current platforms are outlined in Figure 6 where the prin-cipal software panels are shown, as described in the followingsections.
The software interfaces to all the controllable hardwarecomponents and keeps metadata on those that are not con-trollable. It handles the automated acquisition and savingof images and data as well as providing novel functions tolocate regions of interest or the well of a multiwell plate,increasing the practical flexibility of platform use. The soft-ware remains modular to enable software ‘packages’ fordifferent microscopes with different hardware and is object-oriented such that multiple devices of the same type may existon one system. The integrated control of photon counting elec-tronics and laser scanners allows automated FLIM via TCSPCand time lapse acquisition of cells, tissue and in vivo.
Especially novel aspects of the software include scriptablemultipoint time-lapse and high-resolution large-area regionscanning by image tiling, and these are described below.In addition, we have developed stand alone programs thatprovide postprocessing, such as ‘TRI2’ (Barber et al., 2009;Rowley et al., 2011) that provides time-resolved lifetime fit-ting and colour image unmixing, and ‘Mosaic’ which is ableto stitch and blend image tiles for the exploration of arbitrarilysized regions or the export of mosaics at full resolution. Moredetails are, again, provided on our Website.
Python time-lapse scripting
Although the main program is written in ‘C’, the program-ming language Python13 has been embedded within it. Thisallows Python scripts to be called by the ‘C’ code that con-trol the actions of the platform through custom classes thatextend the standard Python language. Importantly, this hasbeen used to form a generic and flexible multipoint time-lapsefeature, allowing user-customization at run time. This makesthe system flexible in the face of changing user needs, with-out the need for a complete recompilation of the program norexperience with ‘C’ programming.
Region scanning and mosaicing
Region scanning allows large regions of tissue, or cell dishes,to be imaged at the platforms native resolution with a givenobjective lens. This is achieved by sequentially stepping thestage (i.e. sample) across the objective and acquiring one ormore camera images at each step. The result is thus a largenumber of images that overlap slightly (typically by 10% oftheir XY dimensions) and together cover the entire region ofinterest. The region scanning function can also be called from
13 http://www.python.org/
C© 2013 The Authors. Journal of Microscopy published by John Wiley & Sons Ltd on behalf of Royal Microscopical Society.
1 0 P . R . B A R B E R E T A L .
Fig. 6. Schematic diagram showing the main functions of the Abbe microscope with associated software panels. From top to bottom: General microscopecontrol with fluorescence wide-field and laser scanning FLIM; Multiregion time-lapse acquisition of multiwell plates and tissues resulting in batch analysiswith the TRI2 program; Region scanning by tiling multiple fields and viewed in the Mosaic program; Fast overview of the sample by ‘stage scanning’.
a time-lapse script to form a region scan of each core of a TMA,for example, with a 4 × 4 mosaic.
We have previously published a method for stitching andblending such a set of images together into a complete mosaic(Rankov et al., 2005). This method has been extended and im-plemented in a stand-alone Windows program: ‘Mosaic’. Thishas been written in C# and enables the exploration of largemosaics, by intelligently loading into memory only the datathat are required to form a user-selected view of the sample,at a user-selected resolution. Mosaic images can also be ex-ported at full camera resolution, in the form of a single image,larger than a single camera field of view for additional process-
ing elsewhere. This program uses no propriety code librariesand the source code and the Windows installer are availableonline.14
Real-time overview and fast overview scan
The high-content platforms constructed thus far using this‘open’ structure do not have any traditional eyepieces andonly allow the use of one objective lens at a time (i.e. there
14 Source code: https://github.com/atdgroup/Mosaic and installer: http://users.
ox.ac.uk/∼atdgroup/software
C© 2013 The Authors. Journal of Microscopy published by John Wiley & Sons Ltd on behalf of Royal Microscopical Society.
G R A Y O P E N L I F E T I M E M I C R O S C O P E S 1 1
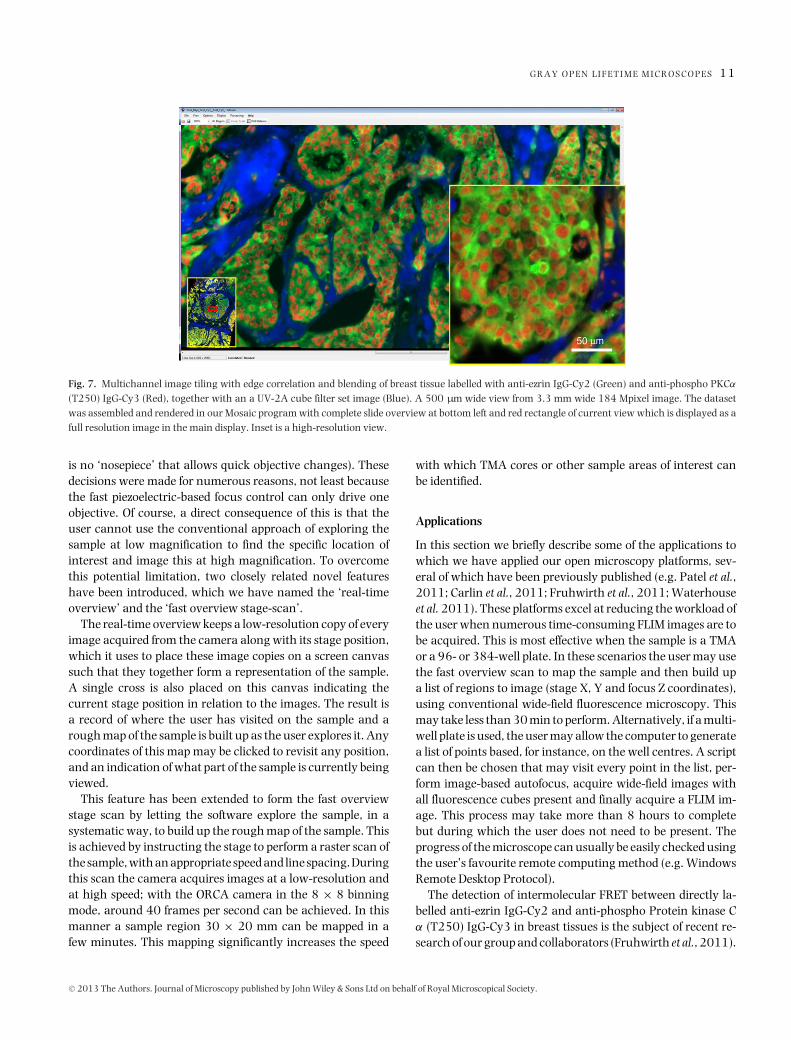
Fig. 7. Multichannel image tiling with edge correlation and blending of breast tissue labelled with anti-ezrin IgG-Cy2 (Green) and anti-phospho PKCα
(T250) IgG-Cy3 (Red), together with an a UV-2A cube filter set image (Blue). A 500 µm wide view from 3.3 mm wide 184 Mpixel image. The datasetwas assembled and rendered in our Mosaic program with complete slide overview at bottom left and red rectangle of current view which is displayed as afull resolution image in the main display. Inset is a high-resolution view.
is no ‘nosepiece’ that allows quick objective changes). Thesedecisions were made for numerous reasons, not least becausethe fast piezoelectric-based focus control can only drive oneobjective. Of course, a direct consequence of this is that theuser cannot use the conventional approach of exploring thesample at low magnification to find the specific location ofinterest and image this at high magnification. To overcomethis potential limitation, two closely related novel featureshave been introduced, which we have named the ‘real-timeoverview’ and the ‘fast overview stage-scan’.
The real-time overview keeps a low-resolution copy of everyimage acquired from the camera along with its stage position,which it uses to place these image copies on a screen canvassuch that they together form a representation of the sample.A single cross is also placed on this canvas indicating thecurrent stage position in relation to the images. The result isa record of where the user has visited on the sample and arough map of the sample is built up as the user explores it. Anycoordinates of this map may be clicked to revisit any position,and an indication of what part of the sample is currently beingviewed.
This feature has been extended to form the fast overviewstage scan by letting the software explore the sample, in asystematic way, to build up the rough map of the sample. Thisis achieved by instructing the stage to perform a raster scan ofthe sample, with an appropriate speed and line spacing. Duringthis scan the camera acquires images at a low-resolution andat high speed; with the ORCA camera in the 8 × 8 binningmode, around 40 frames per second can be achieved. In thismanner a sample region 30 × 20 mm can be mapped in afew minutes. This mapping significantly increases the speed
with which TMA cores or other sample areas of interest canbe identified.
Applications
In this section we briefly describe some of the applications towhich we have applied our open microscopy platforms, sev-eral of which have been previously published (e.g. Patel et al.,2011; Carlin et al., 2011; Fruhwirth et al., 2011; Waterhouseet al. 2011). These platforms excel at reducing the workload ofthe user when numerous time-consuming FLIM images are tobe acquired. This is most effective when the sample is a TMAor a 96- or 384-well plate. In these scenarios the user may usethe fast overview scan to map the sample and then build upa list of regions to image (stage X, Y and focus Z coordinates),using conventional wide-field fluorescence microscopy. Thismay take less than 30 min to perform. Alternatively, if a multi-well plate is used, the user may allow the computer to generatea list of points based, for instance, on the well centres. A scriptcan then be chosen that may visit every point in the list, per-form image-based autofocus, acquire wide-field images withall fluorescence cubes present and finally acquire a FLIM im-age. This process may take more than 8 hours to completebut during which the user does not need to be present. Theprogress of the microscope can usually be easily checked usingthe user’s favourite remote computing method (e.g. WindowsRemote Desktop Protocol).
The detection of intermolecular FRET between directly la-belled anti-ezrin IgG-Cy2 and anti-phospho Protein kinase Cα (T250) IgG-Cy3 in breast tissues is the subject of recent re-search of our group and collaborators (Fruhwirth et al., 2011).
C© 2013 The Authors. Journal of Microscopy published by John Wiley & Sons Ltd on behalf of Royal Microscopical Society.
1 2 P . R . B A R B E R E T A L .
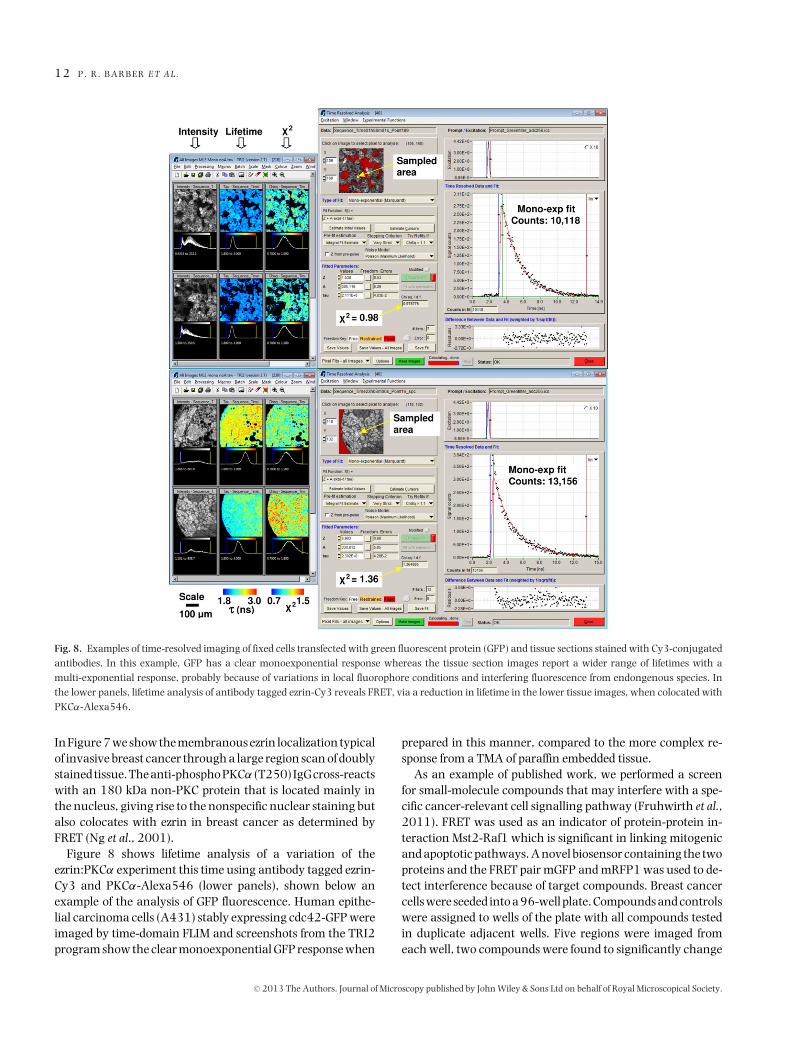
Fig. 8. Examples of time-resolved imaging of fixed cells transfected with green fluorescent protein (GFP) and tissue sections stained with Cy3-conjugatedantibodies. In this example, GFP has a clear monoexponential response whereas the tissue section images report a wider range of lifetimes with amulti-exponential response, probably because of variations in local fluorophore conditions and interfering fluorescence from endongenous species. Inthe lower panels, lifetime analysis of antibody tagged ezrin-Cy3 reveals FRET, via a reduction in lifetime in the lower tissue images, when colocated withPKCα-Alexa546.
In Figure 7 we show the membranous ezrin localization typicalof invasive breast cancer through a large region scan of doublystained tissue. The anti-phospho PKCα (T250) IgG cross-reactswith an 180 kDa non-PKC protein that is located mainly inthe nucleus, giving rise to the nonspecific nuclear staining butalso colocates with ezrin in breast cancer as determined byFRET (Ng et al., 2001).
Figure 8 shows lifetime analysis of a variation of theezrin:PKCα experiment this time using antibody tagged ezrin-Cy3 and PKCα-Alexa546 (lower panels), shown below anexample of the analysis of GFP fluorescence. Human epithe-lial carcinoma cells (A431) stably expressing cdc42-GFP wereimaged by time-domain FLIM and screenshots from the TRI2program show the clear monoexponential GFP response when
prepared in this manner, compared to the more complex re-sponse from a TMA of paraffin embedded tissue.
As an example of published work, we performed a screenfor small-molecule compounds that may interfere with a spe-cific cancer-relevant cell signalling pathway (Fruhwirth et al.,2011). FRET was used as an indicator of protein-protein in-teraction Mst2-Raf1 which is significant in linking mitogenicand apoptotic pathways. A novel biosensor containing the twoproteins and the FRET pair mGFP and mRFP1 was used to de-tect interference because of target compounds. Breast cancercells were seeded into a 96-well plate. Compounds and controlswere assigned to wells of the plate with all compounds testedin duplicate adjacent wells. Five regions were imaged fromeach well, two compounds were found to significantly change
C© 2013 The Authors. Journal of Microscopy published by John Wiley & Sons Ltd on behalf of Royal Microscopical Society.

G R A Y O P E N L I F E T I M E M I C R O S C O P E S 1 3
the biosensor response compared to the controls. Analysis wasperformed using in-house developed lifetime fitting software(TRI2).
Work involving primary antibodies in TMAs has also re-cently been published that highlights the use of these plat-forms towards personalized treatment for cancer by Kelleheret al. (2009). In addition, to demonstrate the flexibility of thesein-house developed systems it is worth highlighting anotherrecently published work by Matthews et al. (Matthews et al.,2010; Matthews et al., 2012) in which wide-field anisotropycapability has been included into one of the open microscopesthrough the addition of a polarization-resolved imager (Quad-view, Photometrics, Tucson, Arizona, USA). This showedhow long-term, unsupervised imaging could take place to re-veal FRET in a biosensor in a large number of samples viaanisotropy.
The ‘open’ microscope approach has also been used to con-struct two radiobiology ‘end-stations’ at the ends of radiationbeam lines and enable fast radiation targeting and imagingof biological material (cells and tissues). The placement ofadvanced fluorescence imaging systems of the end of a ra-diation beam line opens up completely novel radiobiologicalstudies, where the consequences of ionising radiation on bio-logical materials can be studied in situ, at short times followingirradiation.
One of the installations developed with the approach de-scribed here is located in the Wolfson Tower at Surrey Uni-versity, UK (Merchant et al., 2012). In that case an ‘upright’microscope arrangement was used, imaging cells with a water-dipping objective, where the cells are irradiated with a highenergy particle beam (protons and other heavier ions) frombelow. Conventional microscope bodies are completely unac-ceptable in such a situation, where radiation beam controlelements have to be combined with trans-illumination con-denser optics (Kirkby et al., 2007) and where the objectivemust be moved to allow clearance for sample insertion (ratherthan the stage lowered, as in conventional microscopes).
The second end-station is installed at the Gray Institute lin-ear accelerator facility (described online15), in the Departmentof Oncology, Oxford, which uses submicrosecond pulses of 6MeV electrons to trigger DNA damage in mammalian cells. Sig-nalling mechanisms active at short times (seconds) and longer(hours) involved in the recruitment of DNA repair proteins arestudied, using multiple markers (at different wavelengths) andtime-lapse microscopy. This arrangement uses a very similar‘inverted’ microscope to that described here, but in additionis coupled to a robotic sample transfer system, controlled bycomplementary software tools integrated with the microscopesoftware. The installation is housed in an environmental en-closure providing the necessary 37◦C/5% CO2 environmentappropriate for live-cell time-lapse imaging. Here, ionising
15 http://users.ox.ac.uk/∼atdgroup/radiation.shtml
radiation levels are very high, and necessitate extensive ra-diation shielding of the microscope, using lead. Once again,commercial microscope bodies could not be used, partiallybecause of their footprint and difficult-to-shield shapes. More-over, access to any optical components damaged by long-termexposure to ionising radiation would be difficult and probablyimpossible, particularly if these components are cemented intoplace.
Conclusion
We present an ‘open’ microscopy platform design method-ology and several physical implementations that allow ad-vanced fluorescence microscopy techniques to be incorpo-rated into automated biological assays. The design is describedas ‘open’ for two reasons. Firstly, drawings and diagramshave been published on the internet under an open licensefor non-commercial use, so that other research departmentsmay benefit. Secondly, it allows easy expansion and modifica-tion as it moves away from the use of a commercial, mono-lithic, microscope body. It uses readily available commercialoptical components and a modular and extendable softwareframework.
Six such platforms are now in use within our group and col-laborators, in Oxford University, King’s College London andSurrey University. These platforms use combinations of hard-ware and software from the designs presented here. Three ofthese platforms incorporate time-domain FLIM via TCSPC im-plemented in an automated fashion. Previously published ex-periments, that contain data obtained with these devices, arehighlighted here to show that imaging data can be obtainedfrom multiwell plates in a time-lapse fashion and from tissueslides and tissue microarrays. Platforms using these designsalso form radiation-beam ‘end-stations’ in Oxford and Surreyand show the versatility and extension of this approach inexperimental systems not traditionally readily coupled withmicroscopy.
This work demonstrates the first implementation of time-domain FLIM in an automated platform and presents a noveland groundbreaking resource for the biological microscopycommunity that will help to bridge the gap between the devel-opment of advanced fluorescence microscopy techniques andtheir routine use by biologists.
Acknowledgements
We are indebted to T Ng, G Weitsman, L Carman, E Ofo, GPatel, B Waterhouse, A Kong, K Kirkby, G Grime, M Mer-chant, J C Jeynes and G Shortland for distinct aspects of thework presented here. Programming in early versions of thesoftware was performed by R Locke, J Gilbey and R Edens. Thiswork was supported by CR-UK (grant C133/A/1812) and theEPSRC/BBSRC (grants EP/C546105/1 and EP/C546113/1).
C© 2013 The Authors. Journal of Microscopy published by John Wiley & Sons Ltd on behalf of Royal Microscopical Society.
1 4 P . R . B A R B E R E T A L .
References
Amos, W.B. (1990) Achromatic Scanning System. US Patent No:4,997,242.
Barber, P.R., Ameer-Beg, S.M., Gilbey, J., Carlin, L.M., Keppler, M., Ng, T.C.& Vojnovic, B. (2009) Multiphoton time-domain fluorescence lifetimeimaging microscopy: practical application to protein-protein interac-tions using global analysis. J. R. Soc. Interface 6, S93–S105.
Barber, P.R., Ameer-Beg, S.M., Gilbey, J., Edens, R.J., Ezike, I. & Vojnovic,B. (2005) Global and pixel kinetic data analysis for FRET detection bymulti-photon time-domain FLIM. Proc. SPIE 5700, 171–181.
Becker, W. (2005) Advanced Time-Correlated Single Photon Counting Tech-niques. Springer-Verlag, Berlin/Heidelberg, Germany.
Becker, W., Benndorf, K., Bergmann, A., Biskup, C., Konig, K., Tirplapur,U. & Zimmer, T. (2001) FRET measurements by TCSPC laser scanningmicroscopy. Proc. SPIE 4431, 414–419.
Carlin, L. M., Evans, R., Milewicz, H., et al. (2011) A targeted siRNA screenidentifies regulators of Cdc42 activity at the natural killer cell immuno-logical synapse. Sci. Signal. 4, ra81, doi: 0.1126/scisignal.2001729.
Coates, P.B. (1973) The origins of afterpulses in photomultipliers. J. Phys.D: Appl. Phys. Vol. 6(10), 1159, doi:10.1088/0022-3727/6/10/301.
Cole, R. W., Jinadasa, T. & Brown, C. M. (2011) Measuring and interpret-ing point spread functions to determine confocal microscope resolutionand ensure quality control. Nat. Prot. 6, 1929–1941.
Edelstein, A., Amodaj, N., Hoover, K., Vale, R. & Stuurman, N. (2010)Computer Control of Microscopes Using µManager, in Current Protocols inMolecular Biology (ed. by F.M. Ausubel, R. Brent, R.E. Kingston, D.D.Moore, J.G. Seidman, J.A. Smith & K. Struhl), John Wiley & Sons, Inc.,Hoboken, NJ, USA.
Esposito, A., Dohm, C.P., Bahr, M. & Wouters, F.S. (2007) Unsupervisedfluorescence lifetime imaging microscopy for high-content and high-throughput screening. Mol. Cell. Proteom. 6, 1446–1454.
Fruhwirth, G.O., Fernandes, L.P., Weitsman, G., et al. (2011) How forsterresonance energy transfer imaging improves the understanding of pro-tein interaction networks in cancer biology. Chem. Phys. Chem. 12,442–461. doi: 10.1002/cphc.201000866
Hu, C.-D. & Kerppola, T.K. (2003) Simultaneous visualization of mul-tiple protein interactions in living cells using multicolor fluorescencecomplementation analysis. Nat. Biotechnol. 21, 539–545.
Kelleher, M., Fruhwirth, G., Patel, G., et al. (2009) The potential of opticalproteomic technologies to individualize prognosis and guide rationaltreatment for cancer patients. Target. Oncol. 4, 235–252.
Kiefer, J., (1953) Sequential minimax search for a maximum. Proc. Amer.Math. Soc. 4, 502–506.
Kirkby, K.J., Grime, G.W., Webb, R.P., Kirkby, N.F., Folkard, M., Prise,K.M., & Vojnovic, B. (2007) A scanning focused vertical ion nanobeam:a new UK facility for cell irradiation and analysis. Nucl. Instrum. Meth.Phys. Res. B 260, 97–100.
Matthews, D.R., Carlin, L.M., Ofo, E., Barber, P.R., Vojnovic, B., Irving, M.,Ng, T., & Ameer-Beg, S.M. (2010) Time-lapse FRET microscopy usingfluorescence anisotropy. J. Microsc. 237, 51–62.
Matthews, D.R, Fruhwirth, G.O., Weitsman, G., et al. (2012) A multi-functional imaging approach to high-content protein interactionscreening. PLoS One. 7(4), e33231.
Merchant, M.J., Jeynes, J.C.G., Grime, G.W., et al. (2012) A focused scan-ning vertical beam for charged particle irradiation of living cells withsingle counted particles. Radiat. Res. 178, 182–190.
Neumann, B., Held, M., Liebel, U., Erfle, H., Rogers, P., Pep-perkok, R. & Ellenberg, J. (2006) High-throughput RNAi screen-
ing by time-lapse imaging of live human cells. Nat. Meth. 3, 385–390.
Ng, T., Parsons, M., Hughes, W. E., et al. (2001) Ezrin is a downstreameffector of trafficking PKC–integrin complexes involved in the controlof cell motility. EMBO J. 20, 2723–2741.
Patel, G.S., Kiuchi, T., Lawler, K., et al. (2011) The challenges of integrat-ing molecular imaging into the optimization of cancer therapy. Integr.Biol. 3, 603–631.
Peter, M., Ameer-Beg, S.M., Hughes, M.K.Y., Keppler, M.D., Prag, S.,Marsh, M., Vojnovic, B. & Ng, T. (2005) Multiphoton-FLIM Quan-tification of the EGFP-mRFP1 FRET Pair for Localization of MembraneReceptor-Kinase Interactions. Biophys. J. 88, 1224–1237.
Ploem, J.S. & Tanke, H.J. (1987) Introduction to Fluorescence Microscopy,Microscopy Handbooks vol. 10, Royal Microscopical Society, OxfordUniversity Press, London.
Rankov, V., Locke, R.J., Edens, R.J., Barber, P.R. & Vojnovic, B. (2005) Analgorithm for image stitching and blending. Proc. SPIE 5701, 190–199.
Rowley, M., Barber, P.R., Coolen, A.C.C. & Vojnovic, B. (2011) Bayesiananalysis of fluorescence lifetime imaging data. Proc. SPIE 7903, 74.
Torre, S., Antonioli, T, Benetti, P. (1983) Study of afterpulse effects inphotomultiplier. Rev. Sci. Instrum. 54(12), 1777–1780.
Waterhouse, B.R., Gijsen, M., Barber, P.R., Tullis, I.D.C., Vojnovic, B. &Kong, A. (2011) Assessment of EGFR/HER2 dimerization by FRET-FLIM utilizing Alexa-conjugated secondary antibodies in relation totargeted therapies in cancers. Oncotarget 2, 728–736.
Supporting Information
Additional Supporting information may be found in the onlineversion of this article at the publisher’s website:
Fig. S1. USB1 Communications Hub Interface board. Designedto be rack mounted, it has connectors for equipment internaland external to the rack chassis.Fig. S2. The basic assembly of the inverted microscope: twoblocks attach a corner reflector mirror to the base. A fluores-cence cube assembly is placed on top of this and the sampleimaging objective is screwed into a combined coarse and fineadjustment focus assembly.Fig. S3. (A, C) CAD reconstruction and photograph of the dualz-drive showing an objective lens mounted onto the piezo-drive. This is all atop a platform driven by a PIC controlledmotor via a simple mechanical arrangement. (B, D) Softwarepanels for controlling the coarse drive and piezo-drive.Fig. S4. Excitation Intensity Monitor. (A) Completed view withcage mount ready for insertion into C4W cube. (B) Coverremoved to reveal the custom compact PCB. (C) Softwarepanel showing measured level and information about thecalibration.Fig. S5. Fluorescence Filter Cube Changing Unit CAD recon-structions and photographs. (A) CAD view with transparentaccess covers. (B) Close-up of the cube holder (one cube of threein place). (C) Completed external view. (D) Cover removed toallow cube access.Fig. S6. (A) A view of the four-position motorised optical pathselector from the input side. (B) Exploded CAD reconstruction.
C© 2013 The Authors. Journal of Microscopy published by John Wiley & Sons Ltd on behalf of Royal Microscopical Society.