thee competitiveness of south african manufacturing and the role of technology strategic...
TRANSCRIPT
Thee Competitiveness of South African Manufacturing and the Role of Technology
Strategic Communications
5th CSIR Annual Conference9 September 2015

Outline of Presentation
2
Introduction to FTI Consulting
Inroductory Remarks
Recent Economic Outcomes in SA & Manufacturing
Changing Global Manufacturing Landscape
Policy & Strategic Agenda for Manufacturing

Section 1
3
Introduction to FTI Consulting

FTI Consulting: Who We Are
FCNPublicly traded
$1.58BLNMarket capitalization(1)
1982Year founded
4,400+Total employees worldwide
440+Senior Managing Directors
2 Nobel Laureates
10/10Advisor to the world’s top 10 bank holding companies
94/100Advisor to 94 of the world’s top 100 law firms
47/10047 of Global100 corporations are clients
16Experts in 16 industry specialties
79Offices in 79 cities around the globe
(1)Total Shares outstanding times the closing share price as of December 31, 2014.4
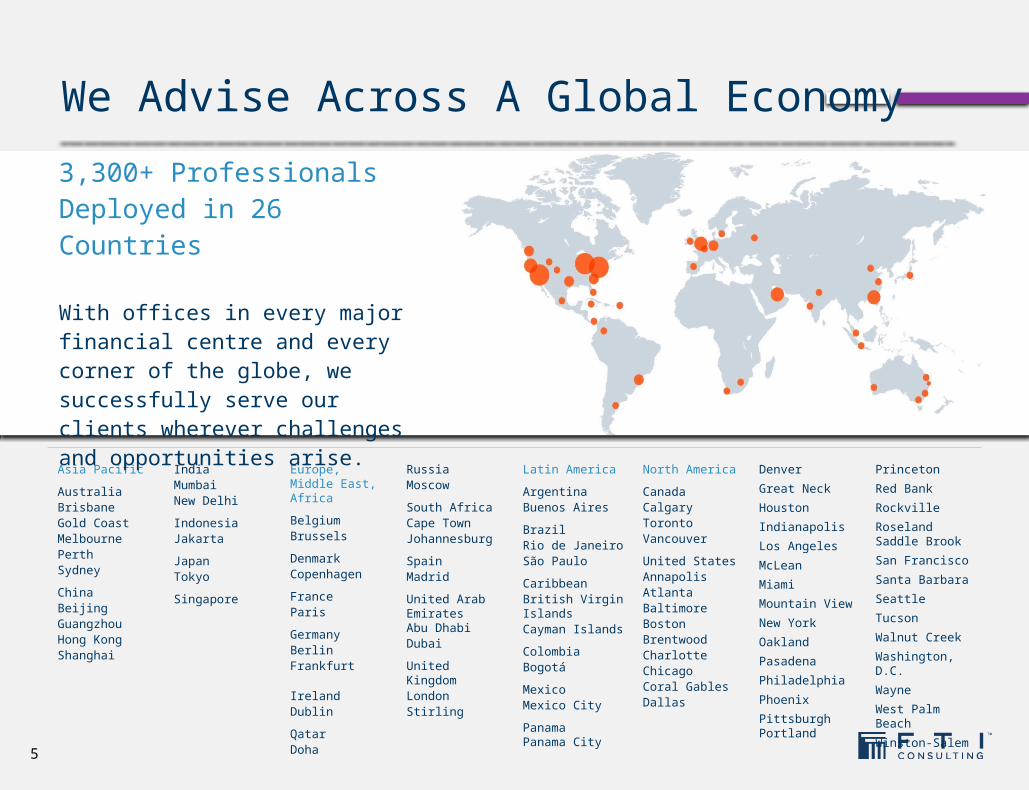
We Advise Across A Global Economy
Asia Pacific
AustraliaBrisbaneGold CoastMelbournePerthSydney
ChinaBeijingGuangzhouHong Kong Shanghai
IndiaMumbaiNew Delhi
IndonesiaJakarta
JapanTokyo
Singapore
Europe, Middle East, Africa
BelgiumBrussels
DenmarkCopenhagen
FranceParis
GermanyBerlinFrankfurt
IrelandDublin
QatarDoha
RussiaMoscow
South AfricaCape TownJohannesburg
SpainMadrid
United Arab EmiratesAbu DhabiDubai
United KingdomLondonStirling
Latin America
ArgentinaBuenos Aires
BrazilRio de Janeiro São Paulo
CaribbeanBritish Virgin IslandsCayman Islands
ColombiaBogotá
MexicoMexico City
PanamaPanama City
North America
CanadaCalgaryTorontoVancouver
United StatesAnnapolisAtlantaBaltimoreBostonBrentwoodCharlotteChicagoCoral GablesDallas
Denver
Great Neck
Houston
Indianapolis
Los Angeles
McLean
Miami
Mountain View
New York
Oakland
Pasadena
Philadelphia
Phoenix
PittsburghPortland
Princeton
Red Bank
Rockville
RoselandSaddle Brook
San Francisco
Santa Barbara
Seattle
Tucson
Walnut Creek
Washington, D.C.
Wayne
West Palm Beach
Winston-Salem5
3,300+ ProfessionalsDeployed in 26 Countries
With offices in every major financial centre and every corner of the globe, we successfully serve our clients wherever challenges and opportunities arise.
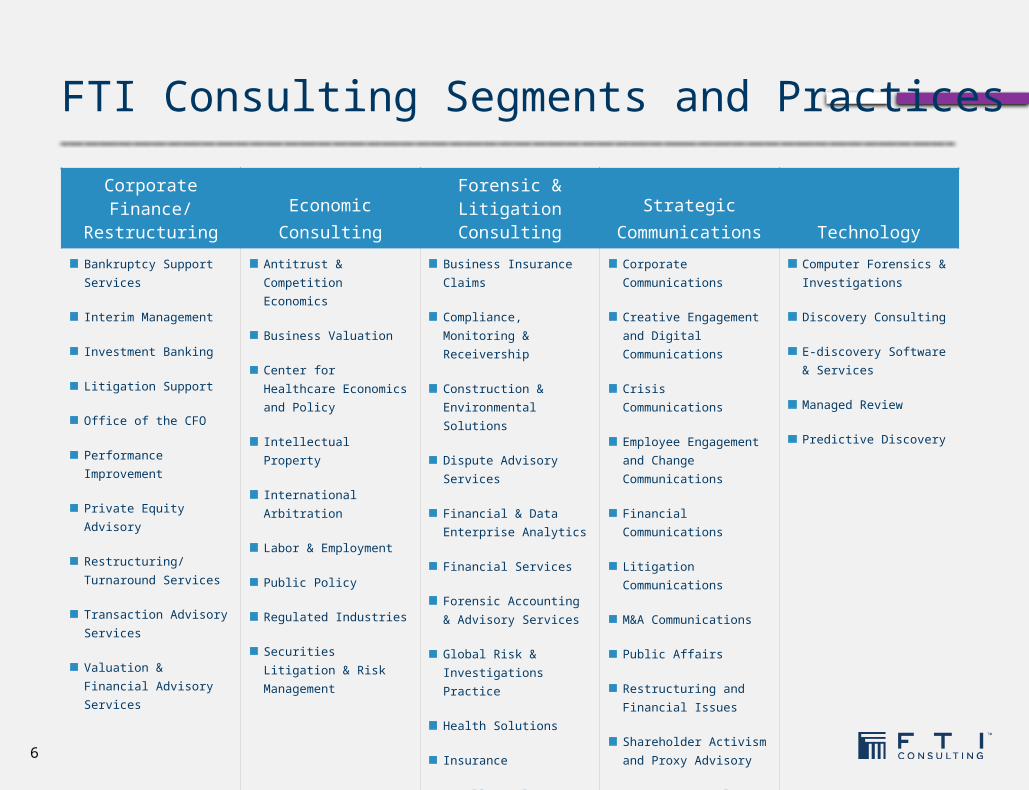
FTI Consulting Segments and Practices
Corporate Finance/
RestructuringEconomicConsulting
Forensic &Litigation
ConsultingStrategic
Communications Technology
Bankruptcy Support Services
Interim Management
Investment Banking
Litigation Support
Office of the CFO
Performance Improvement
Private Equity Advisory
Restructuring/Turnaround Services
Transaction Advisory Services
Valuation & Financial Advisory Services
Antitrust & Competition Economics
Business Valuation
Center for Healthcare Economics and Policy
Intellectual Property
International Arbitration
Labor & Employment
Public Policy
Regulated Industries
Securities Litigation & Risk Management
Business Insurance Claims
Compliance, Monitoring & Receivership
Construction & Environmental Solutions
Dispute Advisory Services
Financial & Data Enterprise Analytics
Financial Services
Forensic Accounting & Advisory Services
Global Risk & Investigations Practice
Health Solutions
Insurance
Intellectual Property
Trial Services
Corporate Communications
Creative Engagement and Digital Communications
Crisis Communications
Employee Engagement and Change Communications
Financial Communications
Litigation Communications
M&A Communications
Public Affairs
Restructuring and Financial Issues
Shareholder Activism and Proxy Advisory
Strategy Consulting & Research
Computer Forensics & Investigations
Discovery Consulting
E-discovery Software & Services
Managed Review
Predictive Discovery
6

FTI Consulting South Africa
7
Majority-owned by FTI Consulting – New York-listed firm
SA offices in Johannesburg and Cape Town
Heavyweight and medium-weight resourcing approach
BEE Level 2 certification – July 2015
SEC compliance and regulatory standards in everything we do!

Section 2
8
Inroductory Remarks

In recent decades SA has been experiencing a gradual
de-industrialization, driven by a cocktail of factors
A Schematic History of SA Manufacturing
Source: Adapted from GIBS
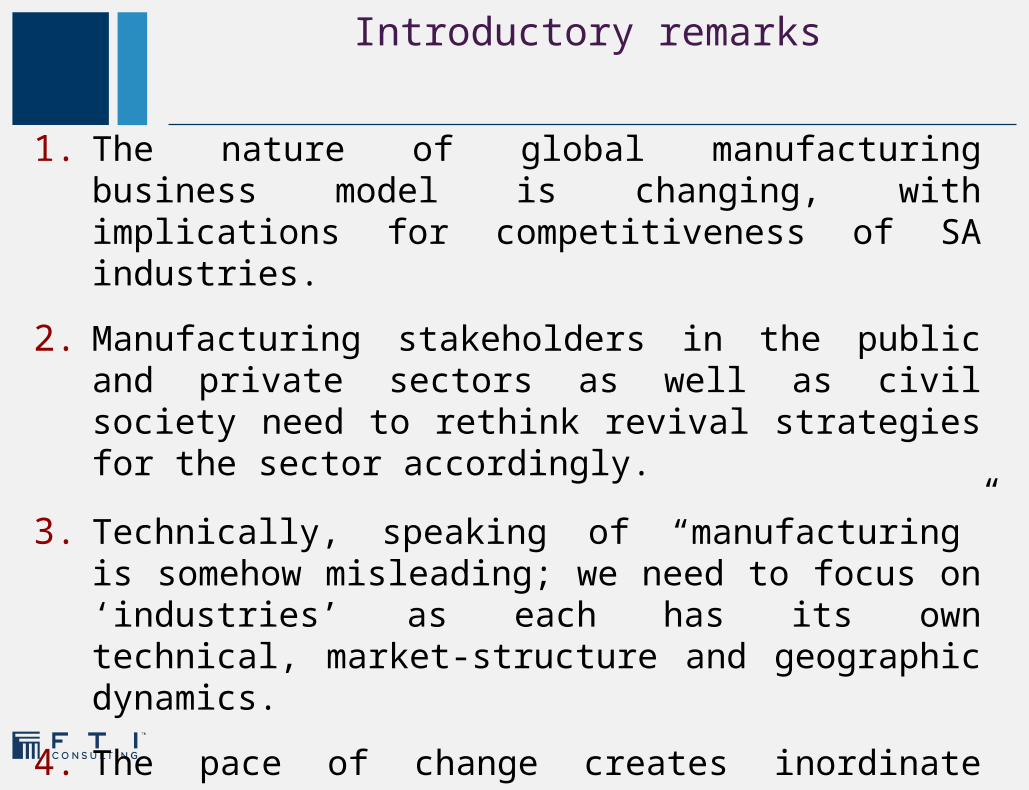
1. The nature of global manufacturing business model is changing, with implications for competitiveness of SA industries.
2. Manufacturing stakeholders in the public and private sectors as well as civil society need to rethink revival strategies for the sector accordingly.
3. Technically, speaking of “manufacturing” is somehow misleading; we need to focus on ‘industries’ as each has its own technical, market-structure and geographic dynamics.
4. The pace of change creates inordinate complexity for industrial policy making- old style policy formulation is a waste of opportunity!
Introductory remarks

Section 3
11
Recent Economic Outcomes in SA & Manufacturing

The performance of SA’s economy remains tied to that of its manufacturing sector
Annual growth in GDP and manufacturing production, South Africa, 1974 - 2014
Source: SARB and PAIRS
-10.0
-7.5
-5.0
-2.5
0.0
2.5
5.0
7.5
10.0
GDP at market prices
Pe
r ce
nt
-4 -2 0 2 4 6 8-15
-10
-5
0
5
10
15
GDP at market pricesM
an
ufa
ctu
rin
g o
utp
ut

Manufacturing contribution to GDP typically rises as the
economy develops but SA has been an exception
Source: McKinsey Global Institute and PAIRSNote: 1 1990 International dollars
1995-2014 SA Average =
15.3%
Manufacturing share in an economy
2013 SA per capita GDPUSD6886.3 (World Bank)

In addition to falling short by standards, SA manufacturing contribution to GDP has gradually
been declining
Manufacturing contribution to GDP, South Africa, 1963 - 2014
Source: SARB and PAIRS
1963
1966
1969
1972
1975
1978
1981
1984
1987
1990
1993
1996
1999
2002
2005
2008
2011
2014
0
5
10
15
20
Pe
r ce
nt

Commodities still dominate in terms of the share of total SA exports
Source: IMF, Haver , SARS and PAIRS
SA export products (% of total exports, average 2010 – 2013)
Mineral products
24%
Precious metals
21%
Base metals13%
Vehicles9%
Machinery9%
Others24%

Sub-Saharan Africa has emerged as a key destination for SA exports
Source: IMF, Haver , SARS and PAIRS
Export markets (% of total exports, average 2010 – 2013)
sub-Saharan Africa26%
Euro area14%
China11%
US8%
Japan6%
ROW35%

Meanwhile, SA’s share of global exports has lagged that of its BRICS peers
South Africa’s share of global trade in context, 2001 - 2013
Source: TradeMap and PAIRS
2001
2002
2003
2004
2005
2006
2007
2008
2009
2010
2011
2012
2013
0
2
4
6
8
10
12
14
SA Brazil IndiaChina Russia
Pe
r ce
nt
2001
2002
2003
2004
2005
2006
2007
2008
2009
2010
2011
2012
2013
0.0
0.5
1.0
1.5
2.0
2.5
3.0
3.5
SA Brazil India Russia
Pe
r ce
nt

Rising manufacturing unit labour cost is eroding competitiveness
Manufacturing employment, labour productivity and unit labour cost, South Africa, 2000 - 2013
Source: SARB and PAIRS
2000
2001
2002
2003
2004
2005
2006
2007
2008
2009
2010
2011
2012
2013
0
50
100
150
200
250
Employment Labour productivity Unit labour cost
Ind
ex (
20
00
=1
00
)
Onset of widening gap between labour cost and productivity

SA scores below the median of EMEs in many other respects
SA’s competitiveness score in context , 2014/15
Source: WEF, OECD and IMF

Ten most problematic factors for SA exporters in 2013
Technical requirements and standards abroad
rules of origin requirements abroad
Difficulties in meeting qlity/qtity requirements of buyers
Corruption at foreign borders
Access to trade finance
High cost or delays caused by international transporta-tion
Inappropriate production technology and skills
Burdensome procedures at foreign borders
Tariff barriers abroad
Identifying potential markets and buyers
Access to imported inputs at competitive prices
High cost or delays caused by domestic transportation
3.9
3.9
4.6
5.4
5.8
8.7
8.9
8.9
9.3
11.2
12.9
16.6
Sco
re

Section 4
21
Changing Global Manufacturing Landscape

Final product assembly is the most common entry point for African manufacturers into global value
chain
Top activities performed in manufacturing value chains in Africa, 2014
After-sales customer service
Design, research and development
Ancillary services (input retail, equipment services)
Sales and marketing
Intermediate inputs (production of components, modules)
Packaging and shipping
Final product assembly
0% 100%
24%
33%
44%
56%
58%
64%
79%
Share of respondents
Source: 2014 AEO Experts Survey and PAIRS
Note: Based on a survey of AEO country economists.
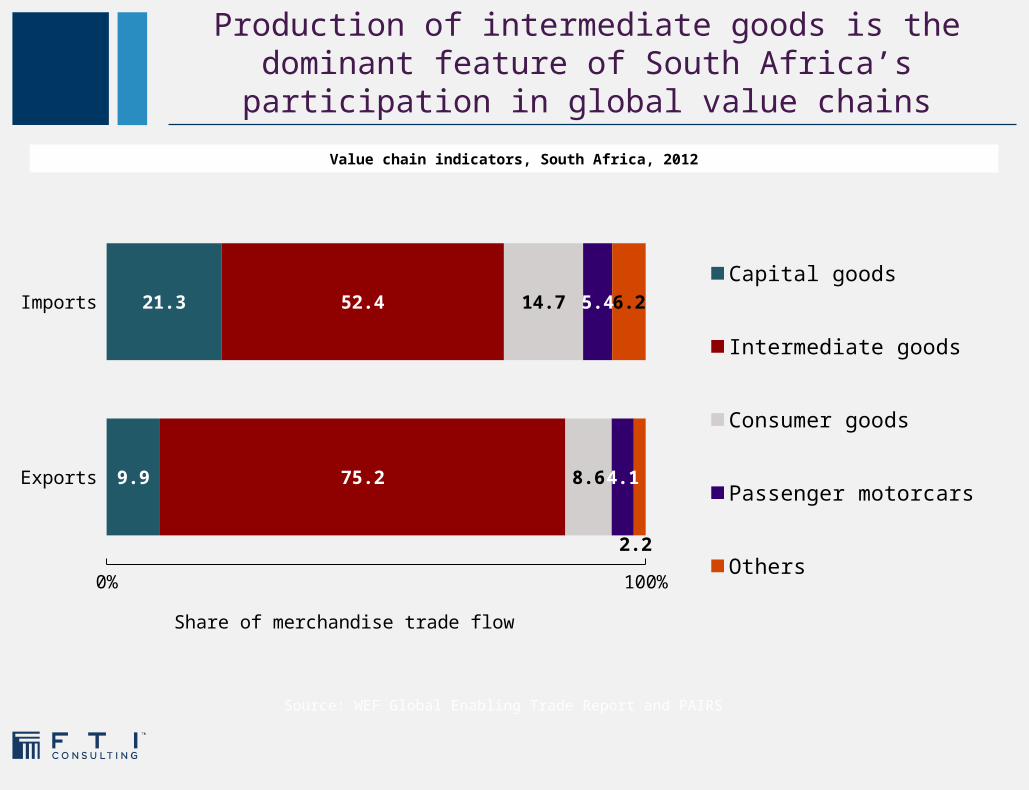
Production of intermediate goods is the dominant feature of South Africa’s participation in global value
chains
Value chain indicators, South Africa, 2012
Exports
Imports
0% 100%
9.9
21.3
75.2
52.4
8.6
14.7
4.1
5.4
2.2
6.2
Capital goods
Intermediate goods
Consumer goods
Passenger motorcars
Others
Share of merchandise trade flow
Source: WEF Global Enabling Trade Report and PAIRS

1. Improvements in ICT and transport infrastructure have contributed to the globalisation of manufacturing value chains.
2. Outsourcing and off-shoring of functions within companies’ manufacturing value chains are rising.
3. The following factors drive this trend:
a. Containing cost and improving productivity;b. Penetrating new markets; andc. Gaining access to strategic assets in other
countries e.g. skilled labour and technological know-how.
Changing global manufacturing practices
Source: Adapted from BIS

1. The concept of “manufacturing” is no longer understood in terms of production alone; it increasingly encompasses varying types of activities:
2. In fact, distinctions between manufacturing and services are no longer clear-cut.
Changing global manufacturing practices
Research Design Production
Logistics &
distribution
Sales & marketing
After sales
services
Illustrative manufacturing value chain
Source: Adapted from BIS

1. “Servitization” refers to the innovation of an organisation’s capabilities and processes to generate greater value via a shift from selling products to selling Product-Service Systems (Neely 2013).
2. As such, addressing SA’s manufacturing competitiveness stalemate and reviving the sector’s performance requires taking into account and embracing the emerging global trends.
3. The servitization of manufacturing is happening during an era characterised by creative destruction and the emergence of disruptive technologies.
More than producing goods:From manufacturing to “manu-services”

Creative destruction and the “age of discontinuity”
Source: McKinsey
Average lifetime of S&P 500 companies

Challenging the status quo:the advent of disruptive technologies
Source: Adapted from McKinsey Global Institute
Some key potentially economically disruptive technologies
Cloud technology
The internet of things
Automation of knowledge work
Mobile internet

Meanwhile, ICT affordability and skills stock in SA falls below the average of peer countries
Source: WEF, Global Information Technology Report (2014)
High score = better

Section 5
30
Policy & Strategic Agenda for Manufacturing

To succeed in repositioning SA manufacturing performance in a changing global environment
requires a concerted effort
Public sector:•Create a positive environment for the sector through strategically coherent policies and institutions•Promoting frank and robust engagement with the private sector
Private sector:•Provide effective on-the-job training and promoting technology-related training•Pro-actively engaging in industrial policy making
Appropriate Infrastructure & Operational Environment:•Critical infrastructure: power, transportation, ...•Industrial relations stability
Source: Adapted from GIBS

Introducing Advanced Manufacturing Technologies will require us to go the Extra Mile
Source: Adapted from GIBS
“A lot of incentives would be required, before a widespread adoption of industry 4.0 applications amongst South African manufacturers will happen.“ “The lack of infrastructure is a key risk for the success of the industrial internet in South Africa. That needs to be overcome first.“ “A lot of South African manufacturers are focused on immediate issues, like labour and electricity. There is a general lack of focus on building for the future and investing in education and training as well as R&D and innovation.“ “A shortage of skills should not stop new investments in technology. Skills will eventually catch-up with industry needs or training will happen.“

Thank you for your attention
[email protected]: 011 214 2400
Content Acknowledgement: Pan African Research and Investment Services and the Manufacturing Circle
Contact Details