theclimateoftheworldofgameofthrones - university …ggdjl/westeros/game_thrones_1.0... ·...
TRANSCRIPT
The Climate of the world of Game of Thrones
Samwell Tarly1,*,2
1
The Citadel, Oldtown, Westeros.
*Previous address: The Wall, The North, Westeros.
2
The Cabot Institute, University of Bristol, UK.
Correspondence to: [email protected] ; @ClimateSamwell
Abstract. It is well known that
the climate of the world of Game
of Thrones is chaotic; the durations
of the seasons are essentially
unpredictable (whatever the quack-5
scientists of King’s Landing may try
to tell you about predicting the
onset of winter), and the seasons
last several years. In this paper, in-
spired by the terrible weather on10
the way here to Oldtown, I attempt
to understand and explain this fas-
cinating and mysterious climate.
I start by presenting observa-
tional evidence from various an-15
cient manuscripts from the Citadel
Library, and then, with the aid of
a Climate Model, present a theory for
the changing seasons based on vari-
ations in the orbit of the planet20
around the Sun. I then explore the im-
plications of this theory for phenom-
ena such as the likely attack plans
of invading dragon hordes from Es-
sos, the dominance of the seas by25
the Iron Fleet,the hibernation zones
of White Walkers in summer, and the
trading routes between Westeros
and the Free cities across the Nar-
row Sea. Followingthis, I compare the 30
climate of various regions in the
world of Game of Thrones with those
of the ‘real’ Earth, and show that
the climate of The Wall in winter
resembles very closely that of Lap- 35
land in Sweden/Finland, and Fairbanks,
Alaska, whereas the climate of Cast-
erly Rock, home of the scheming Lannis-
ters, resembles that of Changsha
in China, and Houston, Texas. Finally, I 40
make a prediction of the “Climate Sen-
sitivity” of the world of Game of
Thrones, the amount of global warm-
ing that would occur if concentra-
tions of greenhouse gases in the 45
atmosphere were to be doubled (due
to the recent increase in carbon
dioxide and methane emissions from
dragons, and the excessive use of
wildfire). I show that this warm- 50
ing would likely be accompanied by sea
level rise that could lead to the in-

2 Phil. Trans. R. Soc. of King’s Landing: Volume 1, Issue 1
undation of coastal cities, includ-
ing the outskirts of King’s Landing
(which may be a good thing… unless
you are unfortunate enough to live
there).5
1 Introduction
The Citadel library of Oldtown holds
some ancient manuscripts in its
collections that provide observa-
tional evidence for the climate of10
theworld ofthe Game of Thrones. Here I
first summarise some of this evi-
dence. There are several manuscripts
that tell of the severity of au-
tumn storms: “Winter storms are15
worse, but autumn’s are more fre-
quent” (Martin, 1998a, p245); “Autumn is a
badseasonforstorms” (Martin,2011a,
p590); “The seas are dangerous, and never
more so than in autumn” (Martin, 2011b,20
p353); “Have the autumn storms begun
yet?” (Martin, 2000, p346). Hidden between
copies of “Battles I have won” by Jaime
Lannister and “A history of Tyrion’s
lovers” (the two largest books in25
the library), there are manuscripts
that tell tales of the daily temper-
ature cycles: “In Volantis, the nights
were almost as hot as the days” (Mar-
tin, 2011a, p101). Of course, there are30
also records of the severity and
extent of winters in Westeros:
“...this great summer done last. Ten
years, two turns, and sixteen days
it lasted” (Martin, 1998b, p5).35
There have also been several theo-
ries postulated for the causes of
the changing seasons. These include
winter being caused by reduced car-
bon dioxide concentration (Mera, 2014),40
increased volcanic activity (@Semy-
orka_, 2017), decreased sunspot activ-
ity (New York Post, 2016), decreased ocean
circulation strength (Farnsworth
and Stone, 2015), changes to the 45
planet’s orbit around the Sun (e.g.
Laughlin, 2013; Delcke, 2015), or just
plain magic (Martin, 2015). However, few
of these theories are consistent
with the observational evidence 50
highlighted above. In addition, the
carbon dioxide, volcanic, ocean circu-
lation, and sunspot theories all fail
to explain the fact that winters
correspond to shorter day length (Mar- 55
tin, 2011a, p531).
Therefore, in this paper I explore
more closely the climate of world
of Game of Thrones, focusing on the or-
bital theory. To do this, I make use 60
of a “Climate Model” that was installed
on a computing machine that I found
in the cellars of the Citadel (luck-
ily I learned how to code when I was
back in Horn Hill avoiding sword prac- 65
tice). Furthermore, I make some compar-
isons with a fictional planet called
the ‘real’ Earth, whose climate is
described in detail in manuscripts
that Gilly discovered in the Citadel 70
library (IPCC, 2013).
The aims of this paper are:
– To demonstrate the flexibility
of climate models, arising from
their basis in fundamental sci- 75
ence.
– To explain a theory for the ex-
tended seasons, and discuss the
resulting climate and its impli-
cations in the context of the 80
world of Game of Thrones.
– To assessthe sensitivity ofthe
world of Game of Thrones to a dou-
Phil. Trans. R. Soc. of King’s Landing: Volume 1, Issue 1 3
bling of carbon dioxide in the at-
mosphere, and some ofthe potential
impacts of such an increase.
2 Methodology5
Climate models are computer programs
that are designed to simulate the
weather and climate. They are based
on the fundamental equations of
“fluid mechanics” (the movement of10
fluids such as air and water). Cli-
mate models solve these equations
by breaking the atmosphere and ocean
up into a network of “gridboxes”,
somewhat like lego blocks, that15
cover the planet and extend up into
the atmosphere and down inthe ocean. A
climate model calculates the flows
of heat and “momentum” (speed and mass)
between these gridboxes, stepping20
forward in time as they go. The size
of the gridboxes is termed the
“resolution” of the model; smaller
gridboxes give more detail (higher
resolution), and larger gridboxes25
give less detail (lower resolu-
tion). The available computing power
determines how small the grid-
boxes can be made. However, some
climate processes (such as clouds,30
downdraughts in thunderstorms,
and small circulations in the ocean)
occur on scales smaller than the
size of a typical model gridbox.
These processes have to be approxi-35
mated in the model, often based on
observations of their average
behaviour in the real world. Differ-
ent climate models give different
results to each other primarily40
because these approximations, or
“parameterisations”, can be repre-
sented in several different ways.
For my experiments, I used the “CitCM3”
model (Citadel Coupled Model version 3, 45
Valdes et al., 2017). It has a resolu-
tion of 3.75◦in longitude by 2.5
◦
in latitude, equivalent to about
400×275 km at the equator. On the
computing machine in the cellars of 50
the Citadel (www.bristol.ac.uk/acrc),
the CitCM3 model can simulate about 200
years of climate per ‘real’ day.
Because climate models are based
on fundamental scientific principles, 55
they can be used to simulate any
planet (real or imagined). However,
there aresome important character-
istics of a planet and its solar sys-
tem that the model cannot predict 60
itself, but need to be provided by
the programmer. These characteris-
tics are called “boundary conditions”,
and include aspects such as the posi-
tions of the continents, the depth 65
ofthe ocean, the height and positions
of mountains, the concentration of
atmospheric greenhouse gases such
as carbon dioxide, the strength of
the sun, and the characteristics of 70
the planet’s orbit around its sun.
For my climate model simulations,
I created many of these boundary
conditions using a map of the Known
World (Martin, 2012) that Gilly found 75
in the Citadel library (inside a long-
lost copy of Littlefinger’s accounts).
It is well known from legend that
the city of Qarth is “the center of
the world, the gate between north 80
and south, the bridge between east
and west…” (Martin, 1998b, p383), so I placed
Qarth at the center of the planet,
traced the continental outlines and
mountains and hills, and invented con- 85

4 Phil. Trans. R. Soc. of King’s Landing: Volume 1, Issue 1
1
Figure 1. The map of the Known World (Mar-
tin, 2012), overlain with my tracing of
continental outline (black lines), moun-
tains (red regions) and hills (blue re-
gions). Qarth is placed at the centre (Mar-
tin, 1998b, p383); the vertical and horizon-
tal black lines show the resulting ex-
tent of the globe. Outside of the Known
World the continents are of my own in-
vention.
tinents outside the Known World (Fig-
ure 1).
I then converted this into a dig-
ital form that can be input to the
climate model, as a series of grid-
boxes of resolution 0.5◦longitude5
by 0.5◦latitude. I assumed that
mountains had an average height of
2000m, hills an average height of 1000m,
coastal regions a height of 20m, and
all other land an average height of10
100m. I then added a random height of
1000m, 500m, 10m, and 90m respectively to
each box. I also assumed that the
ocean depth increased with distance
from the coast, to a maximum depth15
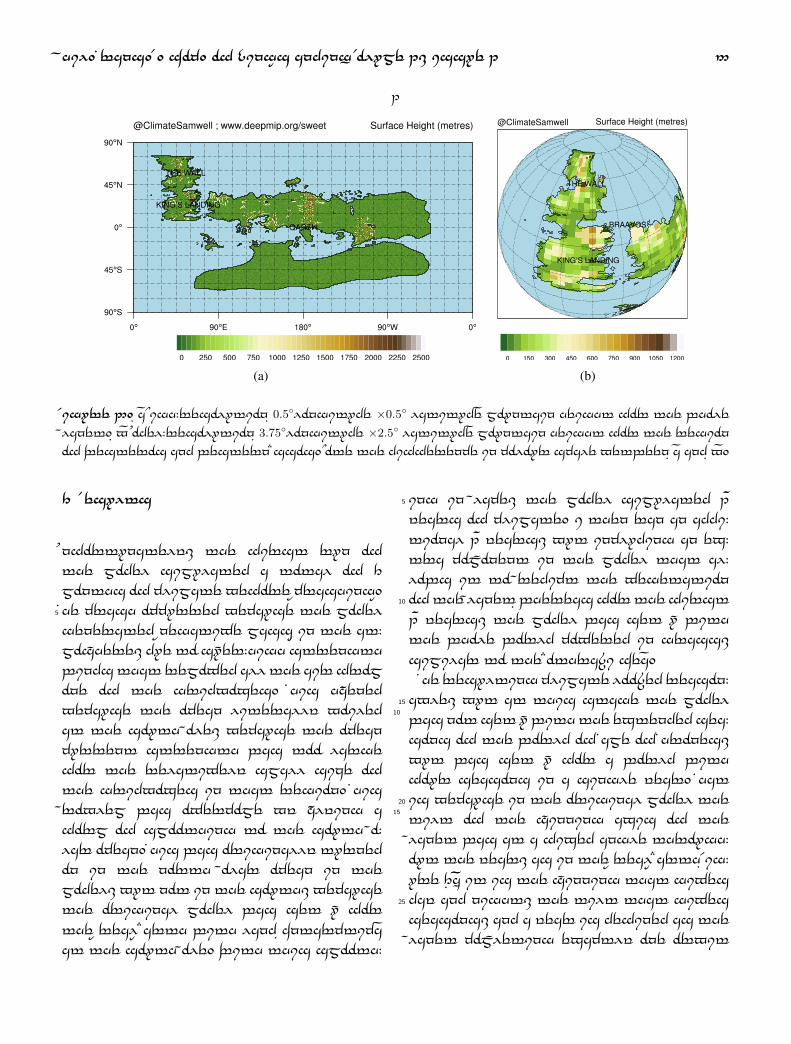
of 4000m. The resulting map, or “digital
elevation model” is shown in Figure
2(a). This then has to be “interpolated”
to the same resolution as the cli-
mate model; resulting finally in the20
boundary condition shown in Figure
2(b). Note that some information is
lost in going from the high resolu-
tion to the low resolution. However,
some ofthe high-resolution informa- 25
tion is retained by the model for
use in the representation of “grav-
ity waves” in the upper atmosphere,
without which the model would not
give a good representation of atmo- 30
spheric flow.
The model was originally set up with
values of the planet radius, rota-
tion rate, incoming sunlight, and
orbit around the Sun, appropriate for 35
the ‘real’ Earth (some of these were
then modified later, see Section 3).
The model requires “initialisation”
from a starting point. The atmo-
spheric initialisation is fairly 40
unimportant in this case, as the
atmosphere adjusts to the bound-
ary conditions very quickly, on the
order of months. However, the ocean
initial condition is important be- 45
cause the ocean takes much longer to
adjust, typically longer than can be
simulated even on a supercomputing
machine. Here, I chose to initialise
the model ocean in the same way as 50
some previous work investigat-
ing the ‘real’ Earth under past climate
conditions (Lunt et al., 2016), with rel-
atively warm ocean temperatures in
the equatorial and polar regions of 55
32◦C and 11
◦C respectively. Note that
the experimental design is very
similar to that of Brown (2013).
The first model simulation was
started with the boundary and ini- 60
tial conditions described above, and
set to run for 100 years.
Phil. Trans. R. Soc. of King’s Landing: Volume 1, Issue 1 5
1
(a) (b)
Figure 2. (a) High-resolution (0.5◦longitude ×0.5◦ latitude) mountain height for the whole
planet. (b) Model-resolution (3.75◦longitude ×2.5◦ latitude) mountain height for the region
of Westeros and western Essos. Note the difference in colour scale between (a) and (b).
3 Results
Unfortunately, the first run of
the model simulated a total of 3
months of climate before “crashing”.
The crash occurred because the model5
generated “negative mass” in the at-
mosphere, due to super-high strength
windsthatremoved allthe airfrom
one of the gridboxes. This happened
because the ocean literally boiled 10
at the south pole, because the ocean
current strength was too large
for the relatively small size of
the gridboxes in that region. This
problem was overcome by applying a 15
form of smoothing to the south po-
lar ocean. This was originally turned
on in the north polar ocean in the
model, but not in the south, because
the original model was set up for
the ‘real’ Earth with land (Antarctica)
at the south pole. With this smooth-
ing in place, the model simulated 1005
years of climate. I then ran an addi-
tional 100 years, but including an ex-
tra component in the model that al-
lows it to predict the vegetation
ofthe planet (whereasforthefirst10
100 years, the model was set up with
the whole world covered in grass,
similar to the Dothraki Sea).
The resulting climate lookedreason-
able, but at this stage the model15
was notset up withthe extendedsea-
sons of the world of Game of Thrones,
but was set up for a world with
four seasons in a single year. That
is because in the original model the20
tilt of the spinning axis of the
planet was at a fixed angle through-
out the year, as in the ‘real’ Earth (Fig-
ure 3(a)); it is the spinning that gives
day and night, the tilt that gives25
seasons, and a year is defined as the
planet completing exactly one orbit

6 Phil. Trans. R. Soc. of King’s Landing: Volume 1, Issue 1
1
Northern Hemisphere
winterNorthern Hemisphere
summer
365 days to orbit
around the Sun
(a)
Northern Hemisphere
winter
Northern Hemisphere
winter
365 days to orbit
around the Sun
(b)
Figure 3. Configuration of Earth’s orbit for (a) the ‘real’ Earth, in which the angle of
tilt of the spinning axis of the Earth stays constant through the year, and (b) the
world of the Game of Thrones, in which the tilt “tumbles” as the planet rotates round
the Sun, such that the angle of tilt changes, so that the same Hemisphere always
faces the Sun, giving a permanent season (permanent Northern Hemisphere winter for
the case illustrated in (b)).
around the Sun. As a result, the sea-
sons changethroughthe year. One way
that seasons can be made to last30
longer is to allow this tilt of the
spinning axis to change throughout
the year, so thatthe Earth ‘tumbles’
on its spin axis, a bit like a spinning
top. If the Earth ‘tumbles’ exactly35
once in a single year, then the spin
axis always points towards (or away)
fromtheSun, andthewinter (orsum-
mer) is then permanent (Figure 3(b)). This
extended winter or summer would40
come to an end if the tilt flipped such
that the opposite hemisphere pointed
towards the sun.
Therefore, I set up an experiment
(initialised from the end of the 45
200 years already simulated) with
the planet tumbling on its axis
in this way, to give a permanent
Northern Hemisphere winter and a per-
manent Southern Hemisphere summer. 50
This time, the model simulated 3
years and then crashed. This was be-
cause the model developed a super-warm
Southern Hemisphere and a super-cold
Northern Hemisphere (Figure 4), which led 55
to such intense winds that, as be-
1
Figure 4. Near-surface air temperature
[◦C] and 70mbar winds [m/s] in an experiment
with permanent Northern Hemisphere sum-
mer, 3 years into the simulation, just
before it crashed. Note that the temper-
ature is close to the boiling point of wa-
ter in the Southern Hemisphere. In this
simulation,the angle oftilt ofthespin-
ning axis (the “obliquity”) is 23.5◦. The leg-
end shows the length of a wind arrow
corresponding to 50 m/s.
fore, negative masswas produced. In
an attemptto overcomethis issue, I
shortened the time period overwhich

Phil. Trans. R. Soc. of King’s Landing: Volume 1, Issue 1 7
the model steps forward in time (I 60
“reduced the timestep”), allowing the
model to simulate stronger winds
without crashing. This enabled the
model to run an extra few months,
but it then crashed again as the5
winds intensified even further.
1
Large tilt –
strong seasons
Smaller tilt –
weaker seasons
@ClimateSamwell
Figure 5. Near-surface air temperature,
3 years into the simulation with perma-
nent Northern Hemisphere winter, with an
angle of tilt of rotation of (left) 23.5◦
as in the ’real’ Earth, and (right) 10◦. The tem-
peratures in the leftfigure are identi-
cal to those in Figure 4.
In orderto reduce the temperature
difference between the winter and
summer hemisphere, I then decreased
the tilt of the spinning axis of the10
planet (the “obliquity”) from 23.5◦(the
value in the ‘real’ Earth) to 10◦. This
had the desired effect, giving a
less extreme winter in the North-
ern Hemisphere and less extreme sum-15
mer in the Southern Hemisphere, and
themodelran happily for 10 years (Figure
5).
I then set up an equivalent simu-
lation but with permanent Northern20
Hemisphere summer. These two simula-
tionsrepresentmyfinalbest esti-
mate of the climate of the world of
Game of Thrones. This is illustrated in
terms of temperature, rainfall and 25
snowfall (“precipitation”), and surface
pressure/winds in Figure 6.
In terms of temperature, in win-
ter (Figure 6(a)) much of the North is
below freezing, but Dorne remains 30
relatively warm, up to 30◦C. There is
also a westto east change in temper-
ature such that the east of West-
eros is coolerthan thewest. This is
likely due to the ocean circulation, 35
which is strong to the west of
Westeros in the wide Sunset Sea,
allowing transport of equatorial
heattowardsthe polarregions,but
is weak to the east of Westeros 40
through the Narrow Sea, resulting
in cooler temperatures to the east.
In summer (Figure 6(d)), only the high al-
titude Frostfangsbeyond The Wallre-
main below freezing (a potential hi- 45
bernation zone for the White Walk-
ers in summer - must remember to
let the Lord Commander know), and the
rest of Westeros is very warm,
particularly The Reach and King’s Landing. 50
Interms ofrainfall and snowfall,
in winter (Figure 6(b)) the southern
half ofWesteros isvery dry,with
little rain or snowfall. The north
receives more precipitation, primar- 55
ily in the form of snow, in particu-
lar on the western coastal regions
near Stony Shore and The Rills. This is
caused by intense storm tracks in
the Sunset Sea in winter, that re- 60
sult in high precipitation when they
make landfall, in particular over the
hilly regions southwest of Win-
terfell. In summer (Figure 6(e)), the
southern regions of Westeros re- 65

8 Phil. Trans. R. Soc. of King’s Landing: Volume 1, Issue 1
1
(a) (b) (c)
(d) (e) (f)
Figure 6. The Northern Hemisphere winter (top row (a,b,c)) and summer (bottom row (d,e,f))
modelled climate, in terms of surface temperature (◦C; left column (a,d)) precipitation
(mm/day; middle column; (b,e)) and surface pressure and winds (mbar; right column (c,f)).
ceive intense precipitation, as they
sit under the “Intertropical Conver-
gence zone”. As such, The Reach is charac-
terised by a strong monsoonal cli-
mate, as is this beautiful city
of Oldtown (maybe explaining why this5
is a centre for climate studies).
Dorne, however, remains very dry in
both winter and summer. Beyond The
Wall, there is intense precipitation
in summer, associatedwiththe high10
mountain ranges of the Frostfangs
leading to ascent of air masses,
and condensation of water droplets
in the cooler air above.
In terms of surface pressure and 15
winds, in winter (Figure 6(c)) there
is a region of intense low pres-
sure to the west of northern Wes-
teros, and high pressure to the
west of central Westeros. Associ- 20
ated with this are strong winds

Phil. Trans. R. Soc. of King’s Landing: Volume 1, Issue 1 9
that blow onshore in central Wes-
teros, including in the Iron Is-
lands; it is no wonder that the
Ironborn are such famed sailors,
having to contend with storms of
such severity. To the east of Wes-5
teros, there are strong wester-
lies that blow across the Narrow
Sea towards Braavos, but further
souththesituation isreversed. In
summer (Figure 6(f)) this whole system10
is reversed, with winds blowing
from Braavos to The Vale of Arryn but
from Dorne to Pentos. This may explain
the seasonal dependence of the complex
trade routes across the Narrow Sea15
between the cities of Westeros
and the Free Cities of Essos. It also
means that any attack on Westeros
(whether by dragons, or ships, or
both), may comevia Dorne orStorm’s End20
in winter, butvia the Vale of Arryn,
or even direct to King’s Landing, in
summer. Also in summer there is an
intense low pressure northern polar
cell, with associated strong cir-25
cumpolar westerlies in the North.
In terms of the transition be-
tween the two seasons, my assump-
tion is that the planet is fixed
in a permanent season over several30
years due to the tumbling of the
tilt of itsspinning axis, butthat
the tilt flips every few years to
give the opposite season. The reason
for this flip is unclear, but may be35
a passing comet, or just the magic
of the Seven (or magic of the red Lord
of Light if your name is Melisandre).
It is of interest to compare the
climate of the world of Game of40
Thrones with that of the ‘real’ Earth.
Following the methodology of Brown
(2013), here I identify those places in
the ‘real’ Earth that have similar
winter or summer climates to fa- 45
miliar landmarks in Westeros. For
the purposes of this work, I consider
a ‘similar’ climate to be one that
is within 3.5◦C in terms of seasonal
temperature, and within about 0.4 50
mm/day in terms of seasonal rain-
fall/snowfall. This analysis (see Fig-
ure 7) shows that The Wall in winter
has a similar climate to several
regions in the ‘real’ Earth, including 55
parts of Alaska (including Fairbanks),
Canada, western Greenland, and Russia.
In addition, there is a small region
in northern Sweden and Finland, en-
compassing parts of Lapland, that also 60
has a similar winter climate to
that of the Wall (I always suspected
that Maester St.Nicholas was a mem-
ber of the Night’s Watch). In a sim-
ilar way, the analysis shows that 65
climate of Casterly Rock (The Lannister’s
stronghold) is similar to that of
the Sahel and eastern China (including
Changsha). There is also a small region
very close to Houston, Texas, that 70
shares a similar climate.
4 Discussion
The theory presented above is con-
sistent with much of the obser-
vational evidence available in the 75
Citadel library. However, there
are some indications in the ancient
manuscripts that navigators have
used the stars as a guide; “The blue
star in the dragon’s eye pointed the 80
way north” (Martin, 2000, p331). With the
proposed ‘tumbling orbit’, the North
Star and Southern Star would vary

10 Phil. Trans. R. Soc. of King’s Landing: Volume 1, Issue 1
1
(a) (b) (c)
(d) (e) (f)
Figure 7. (a,b,c) Blue regions show where on the ‘real’ Earth is most like The Wall in terms
of winter rainfall/snowfall; Green regions show where on the ‘real’ Earth is most like
The Wall in terms of winter temperature; and Red regions show where on the ‘real’ Earth
is most like The Wall in terms of winter rainfall/snowfall and temperature. (c,d,e) The
same as (a,b,c), but for Casterly Rock in summer instead of The Wall in winter.
throughout a calendar year. For the
‘real’ Earth, a similar tumble but
on much longer timescales of 20,000
years results in changes to the pole
star, and in substantial changes
to climate. These observations5
could be reconciled by postulating
that the entire heavens are also
rotating at the same rate as the
planet tumbles (again, likely due to
magic).10
As with any prediction from a sin-
gle climate model, there are un-
certainties associated with this
work. As stated in the introduc-
tion, different climate models can15
give differing results due primar-
ily to their differing represen-
tation of small-scale climate fea-
tures. To assess the robustness
of these results, other models 20
would have to repeat similar experi-
ments. This is common practice in cli-
mate science, and in particular the
“Coupled Model Intercomparison Project”
(Eyring et al., 2016) defines many cli- 25
mate modelling experiments that
are carried out by multiple groups.
The spread of model results in these
experiments provides an assessment
of the uncertainty in a prediction, 30
and when many models agree on a re-
sult, we have high confidence in
their predictions. This form of un-
certainty assessment is a criti-
cal component of the reports of the 35
Intergovernmental Panel on Climate

Phil. Trans. R. Soc. of King’s Landing: Volume 1, Issue 1 11
Change (Houghton et al., 2001; Solomon
et al., 2007; IPCC, 2013).
1
Figure 8. Temperature change [◦C] given a dou-
bling of atmospheric carbon dioxide, i.e.
the Climate Sensitivity of the world of
Game of Thrones.
There have been several recent
worrying reports from monitoring
stations on the island of Lys that
the concentrations of methane and
carbon dioxide in the atmosphere are5
increasing. This is likely due to
the recent increase in dragon popula-
tion in Essos, the deforestation of
many regions associated with the
increase in ship-building throughout10
Westeros and Essos, and the exces-
sive use of wildfire. It has been
suggested that increases in such
greenhouse gases could lead to sub-
stantial warming, and possible im-15
pacts on society and ecosystems.
Here, I usethe climatemodelto carry
out an additional simulation with
a doubling of atmospheric carbon
dioxide. The resulting temperature 20
changegiventhis doubling in carbon
dioxide is shown in Figure 8. It can be
seen that the greatest warming
is in the polar regions - this is be-
causethewarmingthere is amplified 25
due to seaice and snow melt, which
decreases the reflectivity of the
planet surface, leading to additional
warming, and hence more melting (a
“positive feedback”). Outside of the po- 30
lar regions, warming is in general
greater on land than over ocean, due
in part to the lower heat capacity of
land that allowsthe land surfaceto
warm faster, and in part due to the 35
factthatthe land surface has a lim-
ited abilityto coolby evaporation in
the warmer climate.
“Climate Sensitivity” is the global
average warming given a doubling 40
of atmospheric carbon dioxide, and
is a commonly-used metric to as-
sess climate change. The value of cli-
mate sensitivity for the world
of Game of Thrones (i.e. the global 45
average of Figure 8) is 2.1◦C. This
is within the range of 1.5-4.5◦C
as assessed by the Intergovern-
mental Panel on Climate Change for
the ‘real’ Earth (IPCC, 2013), albeit at 50
the lower end of that range. How-
ever, the relatively short length
(100 years) of my doubled carbon diox-
ide simulation means that my re-
sults need to be treated with cau- 55
tion, as a longersimulation may have
resulted in greater warming. The
warming for a doubling of carbon

12 Phil. Trans. R. Soc. of King’s Landing: Volume 1, Issue 1
dioxide could also have implications
for sea-level, due to expansion of 60
the warmer oceans, and melting of
glaciers (and, Mother forbid, The Wall).
Predicting future sea-level change
is highly complex, but a very approx-
imate long-term prediction can be5
made by consideringthat duringthe
Pliocene period of the ‘real’ Earth, 3 mil-
lion years ago, temperatures were
about 3◦C warmer than today and sea
level was around 15 metres higher10
than today (IPCC, 2013), due to melting
of the Greenland and west Antarc-
tic ice sheets. This suggests that
my modelled 2.1◦C increase in tempera-
ture for a doubling of carbon diox-15
ide could result in a sea level rise
of about 10 metres in the long term,
surely enough to inundate parts of
coastal cities (including King’s Land-
ing), towns and villages, with re-20
sulting social unrest and instabil-
ity, and possibly (even more) wars
and deaths. As such, as a climate
scientist I strongly encourage all
the Kingdoms of our planet to reduce25
their emissions of carbon dioxide,
and seek alternative ‘renewable’ en-
ergy (such as windmills).
5 Conclusions and Future Work
In this paper, I have shown that:30
– Climate models, because they are
based on fundamental physical prin-
ciples and not ‘tuned’ to a particu-
lar climate state, can be used to
simulate planets other than the35
‘real’ Earth.
– A ‘tumbling’ orbit of the planet
around the Sun, combined with an
angle of tilt of about 10◦, re-
sults in permanent seasons and a40
modelled climate in broad agree-
ment with the observational
data as documented in the Citadel
library.
– The modelled climate can be used to 45
explain the likely attack plans of
invading dragon hordes from Es-
sos, the dominance of the seas
by the Iron Fleet, the hiberna-
tion zones of White Walkers in 50
summer, and the trading routes
between Westeros and the Free
cities across the Narrow Sea.
– The winter temperature and precipi-
tation in the region of The Wall 55
resembles very closely that
of Lapland in Sweden/Finland, and Fair-
banks, Alaska; the climate of Cast-
erly Rock resembles that of Chang-
sha in China, and Houston, Texas. 60
– The climate sensitivity of the
world of Game of Thrones is 2.1◦C;
this amount of warming could re-
sult in sea level rise of about
10m in the long term. 65
Future work could include carry-
ing out similar simulations with
different climate models, as sug-
gested above, perhaps in the frame-
work of a formal “Model Intercompari- 70
son Project”, e.g. ‘GoTMIP’. In particular,
higher resolution models with
smaller gridboxes could better
resolve geographical features
that could influence atmospheric 75
circulation (such as the Frostfangs
north of The Wall, the Eyrie and even
The Wall itself). I have assumed that
the radius, rotation rate, and in-
coming sunlight of the planet is 80
the same as the ‘real’ Earth, and this
Phil. Trans. R. Soc. of King’s Landing: Volume 1, Issue 1 13
could also be further explored. Fur-
ther analysis of the atmospheric
circulation, for example the “Hadley
Cells” that transport air and energy
from the tropical regions towards
the poles could be carried out, and5
similarly for the ocean circulation
(for example the transport of energy
thoughthe NarrowSeas). The autumn and
spring transitional seasons also
need to investigated, in particular10
whether the model can reproduce the
evidence documented in the Citadel
library of the severity of autumn
storms. I am sure that this will
keep me and others busy for years to15
come!
Acknowledgements. Of course, I thank
George R.R. Martin for inspiration. This work
forms part of the ‘Pathways to Impact’ of
NERC grant ‘SWEET:Super-Warm Early Eocene Tempera-20
tures and climate: understanding the
response of the Earth to high CO2 through
integrated modelling and data’, NE/P01903X/1,
but the work was unfunded, and the sim-
ulations were set up in my spare time.25
The modelling work was carried out us-
ing the computational facilities of the
Advanced Computing Research Centre, Univer-
sity of Bristol, www.bris.ac.uk/acrc.
Huge thanks to Gilly, who carried out30
much of the research in the Citadel li-
brary and helped set up the model (I offered
her a co-authorship but she declined, say-
ing that she did not want to be associ-
ated with a journal edited by Kneelers).35
Many thanks to CHL and GLF for their useful com-
ments on the manuscript, and their sup-
port through my investigations. Thanks
to GJLT for the Dothraki and High Valyrian
translations. Thanks to all the follow-40
ers of @ClimateSamwell for your support
and Retweets - I’ll keep you updated with any
further developments!
References
Brown, R.: The Climate of Middle Earth, J. Hobbit- 45
lore, 1, 1–8, 2013.
Delcke, D.: Theory of orbits for seasons of
Game of Thrones(2), goo.gl/QVBsME, 2015.
Eyring, V., Bony, S., Meehl, G. A., Senior,
C. A., Stevens, B., Stouffer, R. J., and 50
Taylor, K. E.: Overview of the Coupled Model
Intercomparison Project Phase 6 (CMIP6) ex-
perimental design and organization,
Geoscientific Model Development, 9, 1937–
1958, doi:10.5194/gmd-9-1937-2016, https: 55
//www.geosci-model-dev.net/9/1937/2016/,
2016.
Farnsworth, A. and Stone, E.: Weathermen
of Westeros: does the climate in Game
of Thrones make sense?, The Conversation, 60
goo.gl/o6yFrh, 2015.
Houghton, J. T., Ding, Y., Griggs, D. J., Noguer,
M., van der Linden, P. J., Dai, X., Maskell,
K., and Johnson, C. A.: Climate Change 2001: The
Scientific Basis, Cambridge University 65
Press, 2001.
IPCC: Climate Change 2013: The Physical Sci-
ence Basis, Cambridge University
Press, http://www.climatechange2013.
org/images/uploads/WGIAR5_WGI-12Doc2b_ 70
FinalDraft_All.pdf, 2013.
Laughlin, G.: Theory of orbits for seasons
of Game of Thrones(1), https://www.space.com/
20433-game-of-thrones-seasons-science.
html, 2013. 75
Lunt, D. J., Farnsworth, A., Loptson, C., Foster,
G. L., Markwick, P., O’Brien, C. L., Pancost, R. D.,
Robinson, S. A., and Wrobel, N.: Palaeogeo-
graphic controls on climate and proxy in-
terpretation, Climate of the Past, 12, 80
1181–1198, 2016.
Martin, G. R. R.: A Feast for Crows, Harper Voy-
ager, 1998a.
Martin, G. R. R.: A Clash of Kings, Harper Voyager,
1998b. 85
Martin, G. R. R.: A Storm of Swords. 1: Steel
and Snow, Harper Voyager, 2000.
Martin, G. R. R.: A Dance with Dragons. 1: Dreams
and Dust, Harper Voyager, 2011a.
14 Phil. Trans. R. Soc. of King’s Landing: Volume 1, Issue 1
Martin, G. R. R.: A Dance with Dragons. 2: After
the Feast, Harper Voyager, 2011b.
Martin, G. R. R.: The Lands of Ice and Fire, Harper
Voyager, 2012.
Martin, G. R. R.: Theory of magic for seasons5
of Game of Thrones, https://www.reddit.
com/r/asoiaf/comments/45qy0z/spoilers_
everything_irregular_seasons_and_
their/, 2015.
Mera, R.: Theory of carbon dioxide for10
seasons of Game of Thrones, https:
//blog.ucsusa.org/roberto-mera/
climate-change-game-of-thrones-559,
2014.
New York Post: Theory of sunspots for sea-15
sons of Game of Thrones, https://goo.gl/
4g5NpT, 2016.
@Semyorka_: Theory of igneous provinces
for seasons of Game of Thrones,
https://twitter.com/Semyorka_/status/20
935791177684660224, 2017.
Solomon, S., Qin, D., Manning, M., Chen, Z., Mar-
quis, M., and Averyt, K. B.: Climate Change2007:
The Physical Science Basis. Contribution
of Working Group I to the Fourth Assess-25
ment Report of the Intergovernmental
Panel on Climate Change, Cambridge Univer-
sity Press, 2007.
Valdes, P. J., Armstrong, E., Badger, M. P. S.,
Bradshaw, C. D., Bragg, F., Crucifix, M.,
Davies-Barnard, T., Day, J. J., Farnsworth, A.,
Gordon, C., Hopcroft, P. O., Kennedy, A. T., Lord,
N. S., Lunt, D. J., Marzocchi, A., Parry, L. M., Pope,
V., Roberts, W. H. G., Stone, E. J., Tourte, G. 835
J. L., and Williams, J. H. T.: The BRIDGE HadCM3 family of
climate models: HadCM3@Bristol v1.0, Geosci-
entific Model Development, 10, 3715–3743,
doi:10.5194/gmd-10-3715-2017, 2017.