the youth risk behavior surveillance system (yrbss): 2009 the youth risk behavior surveillance...
TRANSCRIPT

The Youth Risk Behavior The Youth Risk Behavior Surveillance System (YRBSS):Surveillance System (YRBSS):
2009 2009
National, State, and Local DataNational, State, and Local Data

2009 YRBS ResultsTobacco Use

Percentage of High School Students Who Ever Smoked Cigarettes,* by Sex and Race/Ethnicity,† 2009
46.3 46.1 46.3 46.1 43.5
51.0
0
20
40
60
80
100
Total Female Male White Black Hispanic
Perc
ent
National Youth Risk Behavior Survey, 2009
* Ever tried cigarette smoking, even one or two puffs.† H > B

Percentage of High School Students Who Ever Smoked Cigarettes,* 1991 – 2009†
70.1 69.5 71.3 70.2 70.463.9
58.454.3
50.346.3
0
20
40
60
80
100
1991 1993 1995 1997 1999 2001 2003 2005 2007 2009
Perc
ent
* Ever tried cigarette smoking, even one or two puffs. † No change 1991–1999, decreased 1999–2009, p < 0.05.
National Youth Risk Behavior Surveys, 1991–2009

Range and Median Percentage of High School Students Who Ever Smoked Cigarettes,* Across 35 States and 18 Cities, 2009
23.5
35.0
59.0
51.048.842.9
0
20
40
60
80
100
States Cities
Perc
ent
State and Local Youth Risk Behavior Surveys, 2009
* Ever tried cigarette smoking, even one or two puffs.

Percentage of High School Students Who Ever Smoked Cigarettes,* 2009
* Ever tried cigarette smoking, even one or two puffs.
23.5% - 43.5%
43.6% - 48.7%
48.8% - 52.7%
52.8% - 59.0%
No Data
State Youth Risk Behavior Surveys, 2009

PhiladelphiaSan Francisco
* Ever tried cigarette smoking, even one or two puffs.
New York City
Percentage of High School Students Who Ever Smoked Cigarettes,* 2009
35.0% - 37.6%
37.7% - 42.8%
42.9% - 46.6%
46.7% - 51.0%
No Data
Local Youth Risk Behavior Surveys, 2009
Miami-Dade County
Palm Beach County
Broward County
Orange CountyDuval CountyDallas
MemphisCharlotte-
MecklenburgCounty
BostonMilwaukee
DetroitChicago
Clark County
Seattle
San BernardinoLos Angeles
San Diego

Percentage of High School Students Who Ever Smoked Cigarettes Daily,* by Sex and Race/Ethnicity,† 2009
11.2 10.6 11.7 13.7
4.38.6
0
20
40
60
80
100
Total Female Male White Black Hispanic
Perc
ent
National Youth Risk Behavior Survey, 2009
* Ever smoked at least one cigarette every day for 30 days. † W > H > B
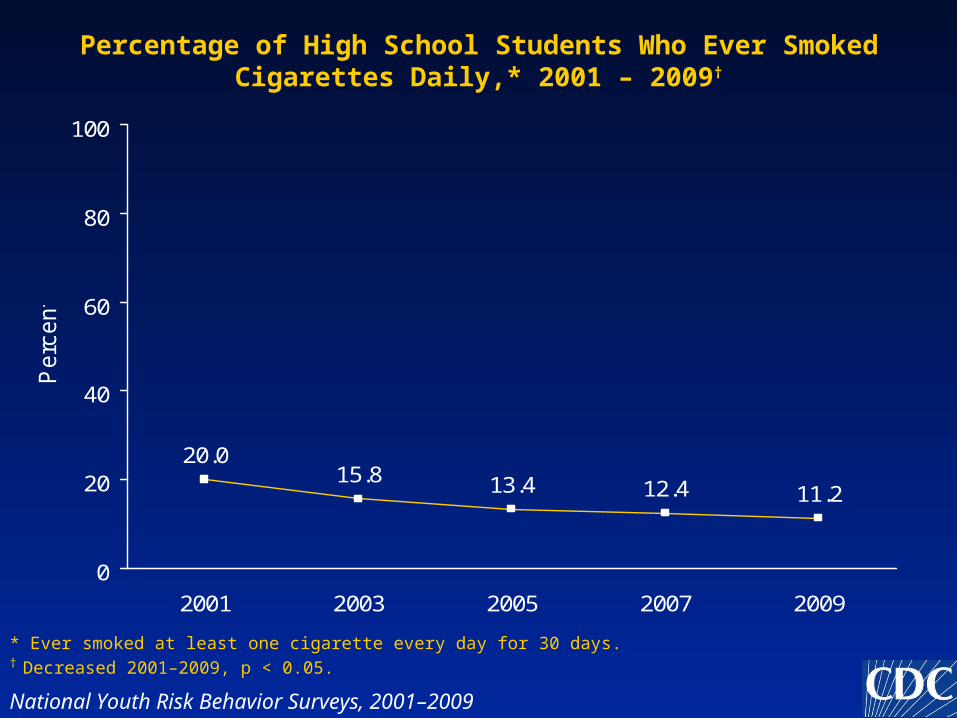
Percentage of High School Students Who Ever Smoked Cigarettes Daily,* 2001 – 2009†
20.015.8 13.4 12.4 11.2
0
20
40
60
80
100
2001 2003 2005 2007 2009
Perc
ent
* Ever smoked at least one cigarette every day for 30 days. † Decreased 2001–2009, p < 0.05.
National Youth Risk Behavior Surveys, 2001–2009

Range and Median Percentage of High School Students Who Ever Smoked Cigarettes Daily,* Across 31 States and 18 Cities, 2009
5.0
3.3
20.0
9.3
11.5
5.9
0
5
10
15
20
25
States Cities
Perc
ent
State and Local Youth Risk Behavior Surveys, 2009
* Ever smoked at least one cigarette every day for 30 days.

Percentage of High School Students Who Ever Smoked Cigarettes Daily,* 2009
* Ever smoked at least one cigarette every day for 30 days.
5.0% - 10.2%
10.3% - 11.4%
11.5% - 13.6%
13.7% - 20.0%
No Data
State Youth Risk Behavior Surveys, 2009

PhiladelphiaSan Francisco
* Ever smoked at least one cigarette every day for 30 days.
New York City
Percentage of High School Students Who Ever Smoked Cigarettes Daily,* 2009
3.3% - 4.8%
4.9% - 5.9%
6.0% - 7.5%
7.6% - 9.3%
No Data
Local Youth Risk Behavior Surveys, 2009
Miami-Dade County
Palm Beach County
Broward County
Orange CountyDuval CountyDallas
MemphisCharlotte-
MecklenburgCounty
BostonMilwaukee
DetroitChicago
Clark County
Seattle
San BernardinoLos Angeles
San Diego

Percentage of High School Students Who Reported Current Cigarette Use,* by Sex and Race/Ethnicity,† 2009
19.5 19.1 19.8 22.5
9.5
18.0
0
20
40
60
80
100
Total Female Male White Black Hispanic
Perc
ent
National Youth Risk Behavior Survey, 2009
* Smoked cigarettes on at least 1 day during the 30 days before the survey. † W > H > B
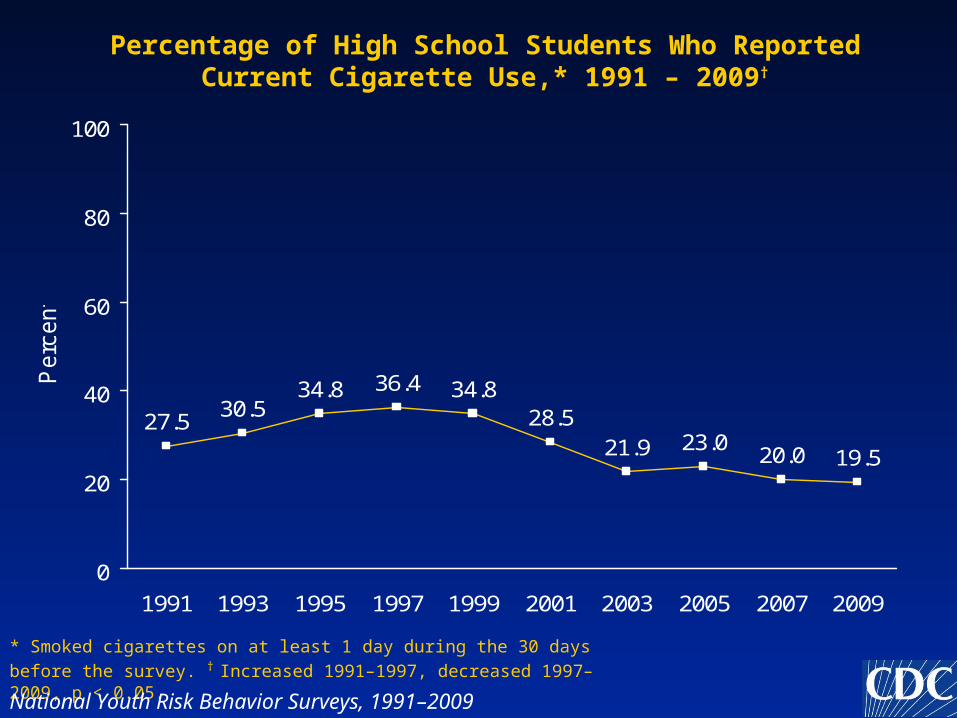
Percentage of High School Students Who Reported Current Cigarette Use,* 1991 – 2009†
27.530.5
34.8 36.4 34.828.5
21.9 23.020.0 19.5
0
20
40
60
80
100
1991 1993 1995 1997 1999 2001 2003 2005 2007 2009
Perc
ent
* Smoked cigarettes on at least 1 day during the 30 days before the survey. †
Increased 1991–1997, decreased 1997–2009, p < 0.05.
National Youth Risk Behavior Surveys, 1991–2009

Range and Median Percentage of High School Students Who Reported Current Cigarette Use,* Across 42 States and 20 Cities, 2009
8.55.9
26.1
15.418.2
11.5
0
10
20
30
40
50
States Cities
Perc
ent
State and Local Youth Risk Behavior Surveys, 2009
* Smoked cigarettes on at least 1 day during the 30 days before the survey.

Percentage of High School Students Who Reported Current Cigarette Use,* 2009
* Smoked cigarettes on at least 1 day during the 30 days before the survey.
8.5% - 16.8%
16.9% - 18.2%
18.3% - 20.7%
20.8% - 26.1%
No Data
State Youth Risk Behavior Surveys, 2009

PhiladelphiaSan Francisco
* Smoked cigarettes on at least 1 day during the 30 days before the survey.
New York City
Percentage of High School Students Who Reported Current Cigarette Use,* 2009
5.9% - 10.4%
10.5% - 11.5%
11.6% - 14.4%
14.5% - 15.4%
No Data
Local Youth Risk Behavior Surveys, 2009
Miami-Dade County
Palm Beach County
Broward County
Orange CountyDuval CountyDallas
MemphisCharlotte-
MecklenburgCounty
BostonMilwaukee
DetroitChicago
Clark County
Seattle
San BernardinoLos Angeles
San Diego

Percentage of High School Students Who Reported Current Frequent Cigarette Use,* by Sex† and Race/Ethnicity,‡ 2009
7.3 6.4 8.0 9.5
2.1 4.2
0
20
40
60
80
100
Total Female Male White Black Hispanic
Perc
ent
National Youth Risk Behavior Survey, 2009
* Smoked cigarettes on 20 or more days during the 30 days before the survey.† M > F‡ W > H > B

Percentage of High School Students Who Reported Current Frequent Cigarette Use,* 1991 – 2009†
12.7 13.8 16.1 16.7 16.813.8
9.7 9.4 8.1 7.3
0
20
40
60
80
100
1991 1993 1995 1997 1999 2001 2003 2005 2007 2009
Perc
ent
* Smoked cigarettes on 20 or more days during the 30 days before the survey.† Increased 1991–1999, decreased 1999–2009, p < 0.05.
National Youth Risk Behavior Surveys, 1991–2009

Range and Median Percentage of High School Students Who Reported Current Frequent Cigarette Use,* Across 42 States and
20 Cities, 2009
2.61.5
12.0
6.47.4
3.4
0
5
10
15
20
25
States Cities
Perc
ent
State and Local Youth Risk Behavior Surveys, 2009
* Smoked cigarettes on 20 or more days during the 30 days before the survey.

Percentage of High School Students Who Reported Current Frequent Cigarette Use,* 2009
* Smoked cigarettes on 20 or more days during the 30 days before the survey.
2.6% - 6.1%
6.2% - 7.3%
7.4% - 8.5%
8.6% - 12.0%
No Data
State Youth Risk Behavior Surveys, 2009

PhiladelphiaSan Francisco
* Smoked cigarettes on 20 or more days during the 30 days before the survey.
New York City
Percentage of High School Students Who Reported Current Frequent Cigarette Use,* 2009
1.5% - 2.5%
2.6% - 3.4%
3.5% - 4.5%
4.6% - 6.4%
No Data
Local Youth Risk Behavior Surveys, 2009
Miami-Dade County
Palm Beach County
Broward County
Orange CountyDuval CountyDallas
MemphisCharlotte-
MecklenburgCounty
BostonMilwaukee
DetroitChicago
Clark County
Seattle
San BernardinoLos Angeles
San Diego
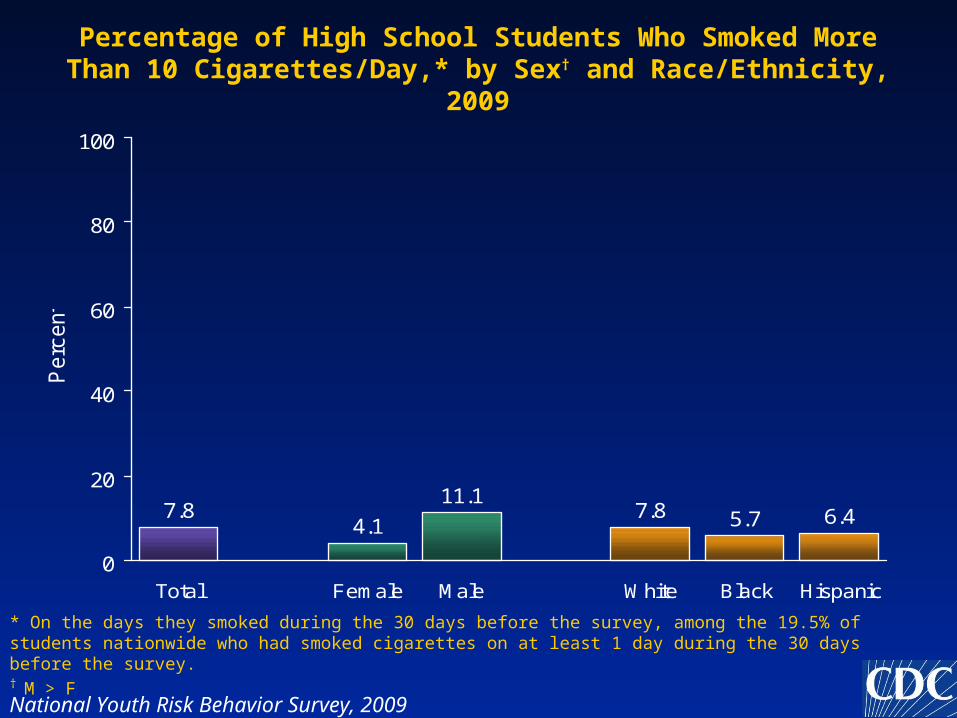
Percentage of High School Students Who Smoked More Than 10 Cigarettes/Day,* by Sex† and Race/Ethnicity, 2009
7.84.1
11.17.8 5.7 6.4
0
20
40
60
80
100
Total Female Male White Black Hispanic
Perc
ent
National Youth Risk Behavior Survey, 2009
* On the days they smoked during the 30 days before the survey, among the 19.5% of students nationwide who had smoked cigarettes on at least 1 day during the 30 days before the survey.† M > F

Percentage of High School Students Who Smoked More Than 10 Cigarettes/Day,* 1991 – 2009†
18.015.1 16.2 13.8 14.9 14.4 13.7
10.7 10.77.8
0
20
40
60
80
100
1991 1993 1995 1997 1999 2001 2003 2005 2007 2009
Perc
ent
National Youth Risk Behavior Surveys, 1991–2009
* On the days they smoked during the 30 days before the survey, among students who had smoked cigarettes on at least 1 day during the 30 days before the survey.† Decreased 1991–2009, p < 0.05
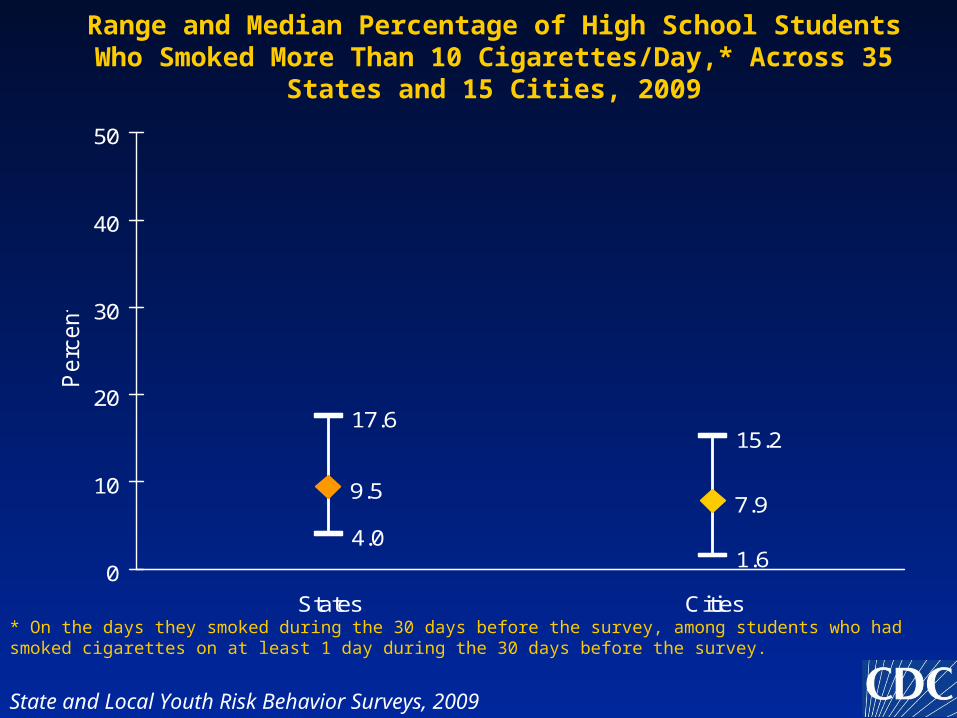
Range and Median Percentage of High School Students Who Smoked More Than 10 Cigarettes/Day,* Across 35 States and 15
Cities, 2009
4.01.6
17.615.2
9.57.9
0
10
20
30
40
50
States Cities
Perc
ent
State and Local Youth Risk Behavior Surveys, 2009
* On the days they smoked during the 30 days before the survey, among students who had smoked cigarettes on at least 1 day during the 30 days before the survey.

Percentage of High School Students Who Smoked More Than 10 Cigarettes/Day,* 2009
* On the days they smoked during the 30 days before the survey, among students who had smoked cigarettes on at least 1 day during the 30 days before the survey.
4.0% - 6.1%
6.2% - 9.4%
9.5% - 11.3%
11.4% - 17.6%
No Data
State Youth Risk Behavior Surveys, 2009

PhiladelphiaSan Francisco
* On the days they smoked during the 30 days before the survey, among students who had smoked cigarettes on at least 1 day during the 30 days before the survey.
New York City
Percentage of High School Students Who Smoked More Than 10 Cigarettes/Day,* 2009
1.6% - 5.0%
5.1% - 7.8%
7.9% - 8.8%
8.9% - 15.2%
No Data
Local Youth Risk Behavior Surveys, 2009
Miami-Dade County
Palm Beach County
Broward County
Orange CountyDuval CountyDallas
MemphisCharlotte-
MecklenburgCounty
BostonMilwaukee
DetroitChicago
Clark County
Seattle
San BernardinoLos Angeles
San Diego

Percentage of High School Students Who Tried to Quit Smoking Cigarettes,* by Sex† and Race/Ethnicity, 2009
50.854.2
48.0 49.945.2
53.3
0
20
40
60
80
100
Total Female Male White Black Hispanic
Perc
ent
National Youth Risk Behavior Survey, 2009
* During the 12 months before the survey, among the 19.5 of students nationwide who had smoked cigarettes on at least 1 day during the 30 days before the survey.† F > M

Percentage of High School Students Who Tried to Quit Smoking Cigarettes,* 2001 – 2009†
57.453.8 54.6
49.7 50.8
0
20
40
60
80
100
2001 2003 2005 2007 2009
Perc
ent
* During the 12 months before the survey, among students who had smoked cigarettes on at least 1 day during the 30 days before the survey.† Decreased 2001–2009, p < 0.05.
National Youth Risk Behavior Surveys, 2001–2009

Range and Median Percentage of High School Students Who Tried to Quit Smoking Cigarettes,* Across 36 States and 17 Cities, 2009
38.8 36.9
67.4 65.0
53.2 51.5
0
20
40
60
80
100
States Cities
Perc
ent
State and Local Youth Risk Behavior Surveys, 2009
* During the 12 months before the survey, among students who had smoked cigarettes on at least 1 day during the 30 days before the survey.

Percentage of High School Students Who Tried to Quit Smoking Cigarettes,* 2009
* During the 12 months before the survey, among students who had smoked cigarettes on at least 1 day during the 30 days before the survey.
38.8% - 48.4%
48.5% - 53.1%
53.2% - 57.1%
57.2% - 67.4%
No Data
State Youth Risk Behavior Surveys, 2009
PhiladelphiaSan Francisco
* During the 12 months before the survey, among students who had smoked cigarettes on at least 1 day during the 30 days before the survey.
New York City
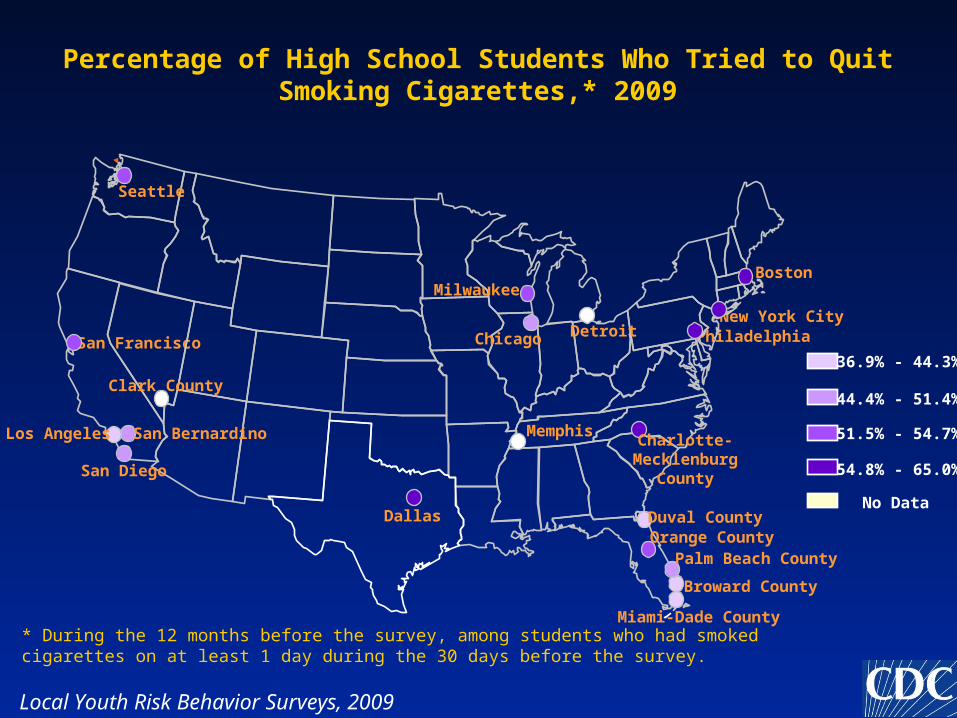
Percentage of High School Students Who Tried to Quit Smoking Cigarettes,* 2009
36.9% - 44.3%
44.4% - 51.4%
51.5% - 54.7%
54.8% - 65.0%
No Data
Local Youth Risk Behavior Surveys, 2009
Miami-Dade County
Palm Beach County
Broward County
Orange CountyDuval CountyDallas
MemphisCharlotte-
MecklenburgCounty
BostonMilwaukee
DetroitChicago
Clark County
Seattle
San BernardinoLos Angeles
San Diego

Percentage of High School Students Who Usually Obtained Their Own Cigarettes by Buying Them in a Store or Gas Station,*
by Sex† and Race/Ethnicity, 2009
14.19.6
18.314.1
19.713.3
0
20
40
60
80
100
Total Female Male White Black Hispanic
Perc
ent
National Youth Risk Behavior Survey, 2009
* During the 30 days before the survey, among the 15.7% of students who were aged < 18 years and had smoked cigarettes on at least 1 day during the 30 days before the survey.† M > F

Percentage of High School Students Who Usually Obtained Their Own Cigarettes by Buying Them in a Store or Gas Station,*
2001 – 2009†
19.0 18.815.2 16.0 14.1
0
20
40
60
80
100
2001 2003 2005 2007 2009
Perc
ent
National Youth Risk Behavior Surveys, 2001–2009
* During the 30 days before the survey, among students who were aged < 18 years and had smoked cigarettes on at least 1 day during the 30 days before the survey.† Decreased 2001–2009, p < 0.05
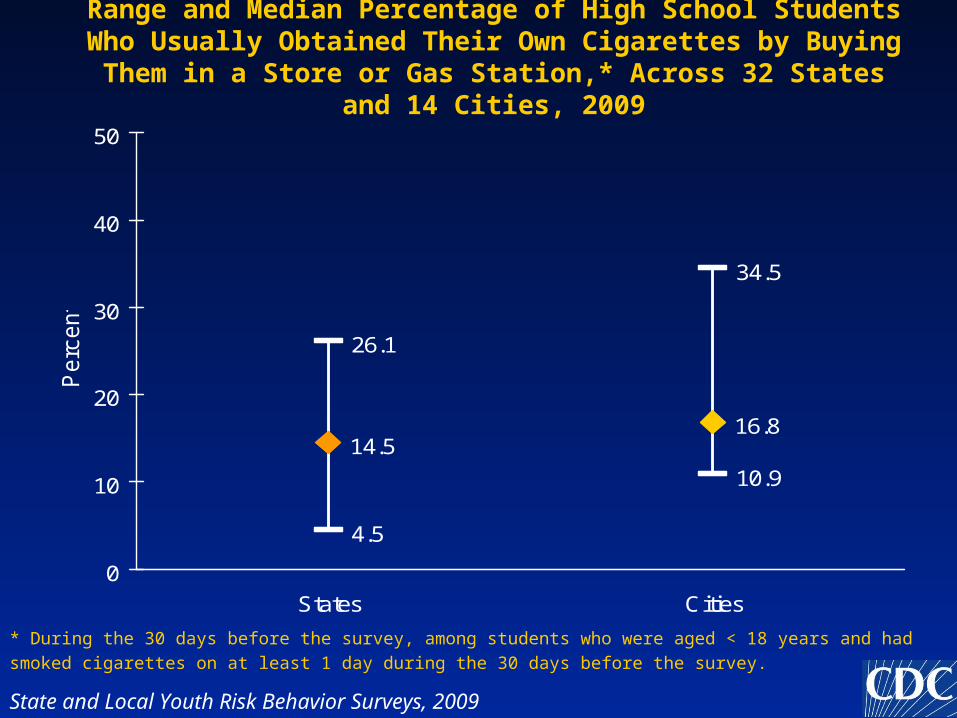
Range and Median Percentage of High School Students Who Usually Obtained Their Own Cigarettes by Buying Them in a Store
or Gas Station,* Across 32 States and 14 Cities, 2009
4.5
10.9
26.1
34.5
14.516.8
0
10
20
30
40
50
States Cities
Perc
ent
State and Local Youth Risk Behavior Surveys, 2009
* During the 30 days before the survey, among students who were aged < 18 years and had smoked cigarettes on at least
1 day during the 30 days before the survey.

Percentage of High School Students Who Usually Obtained Their Own Cigarettes by Buying Them in a Store or Gas Station,* 2009
* During the 30 days before the survey, among students who were aged < 18 years and had smoked cigarettes on at least 1 day during the 30 days before the survey.
4.5% - 10.8%
10.9% - 14.4%
14.5% - 18.6%
18.7% - 26.1%
No Data
State Youth Risk Behavior Surveys, 2009
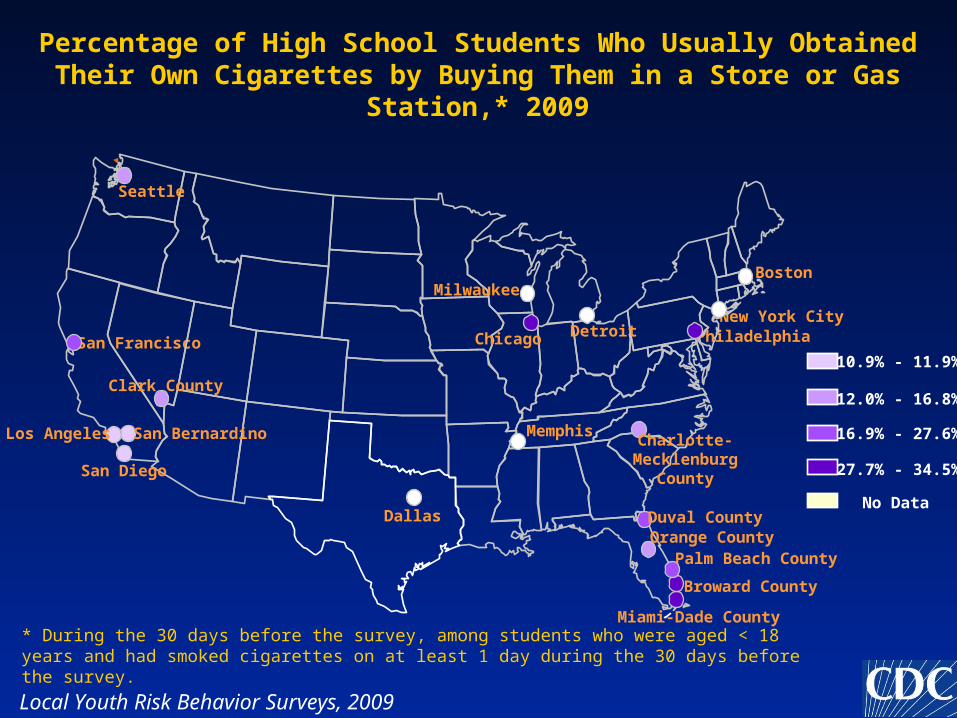
PhiladelphiaSan Francisco
* During the 30 days before the survey, among students who were aged < 18 years and had smoked cigarettes on at least 1 day during the 30 days before the survey.
New York City
Percentage of High School Students Who Usually Obtained Their Own Cigarettes by Buying Them in a Store or Gas Station,* 2009
10.9% - 11.9%
12.0% - 16.8%
16.9% - 27.6%
27.7% - 34.5%
No Data
Local Youth Risk Behavior Surveys, 2009
Miami-Dade County
Palm Beach County
Broward County
Orange CountyDuval CountyDallas
MemphisCharlotte-
MecklenburgCounty
BostonMilwaukee
DetroitChicago
Clark County
Seattle
San BernardinoLos Angeles
San Diego

Percentage of High School Students Who Currently Used Smokeless Tobacco,* by Sex† and Race/Ethnicity,‡ 2009
8.92.2
15.011.9
3.3 5.1
0
20
40
60
80
100
Total Female Male White Black Hispanic
Perc
ent
National Youth Risk Behavior Survey, 2009
* Used chewing tobacco, snuff, or dip on at least 1 day during the 30 days before the survey.† M > F‡ W > H > B

Percentage of High School Students Who Currently Used Smokeless Tobacco,* 1995 – 2009†
11.4 9.3 7.8 8.2 6.7 8.0 7.9 8.9
0
20
40
60
80
100
1995 1997 1999 2001 2003 2005 2007 2009
Perc
ent
* Used chewing tobacco, snuff, or dip on at least 1 day during the 30 days before the survey.† Decreased 1995–2003, no change 2003–2009, p < 0.05.
National Youth Risk Behavior Surveys, 1995–2009

Range and Median Percentage of High School Students Who Currently Used Smokeless Tobacco,* Across 39 States and 19 Cities, 2009
4.9
2.4
16.2
9.29.1
3.8
0
5
10
15
20
25
States Cities
Perc
ent
State and Local Youth Risk Behavior Surveys, 2009
* Used chewing tobacco, snuff, or dip on at least 1 day during the 30 days before the survey.
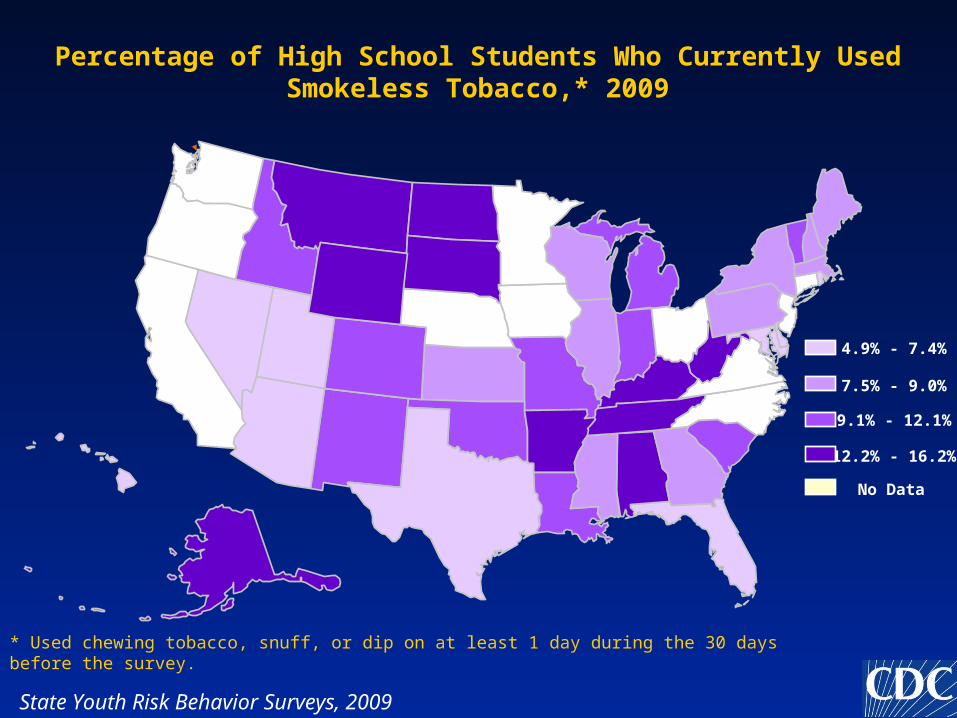
Percentage of High School Students Who Currently Used Smokeless Tobacco,* 2009
* Used chewing tobacco, snuff, or dip on at least 1 day during the 30 days before the survey.
4.9% - 7.4%
7.5% - 9.0%
9.1% - 12.1%
12.2% - 16.2%
No Data
State Youth Risk Behavior Surveys, 2009

PhiladelphiaSan Francisco
* Used chewing tobacco, snuff, or dip on at least 1 day during the 30 days before the survey.
New York City
Percentage of High School Students Who Currently Used Smokeless Tobacco,* 2009
2.4% - 3.0%
3.1% - 3.7%
3.8% - 5.1%
5.2% - 9.2%
No Data
Local Youth Risk Behavior Surveys, 2009
Miami-Dade County
Palm Beach County
Broward County
Orange CountyDuval CountyDallas
MemphisCharlotte-
MecklenburgCounty
BostonMilwaukee
DetroitChicago
Clark County
Seattle
San BernardinoLos Angeles
San Diego
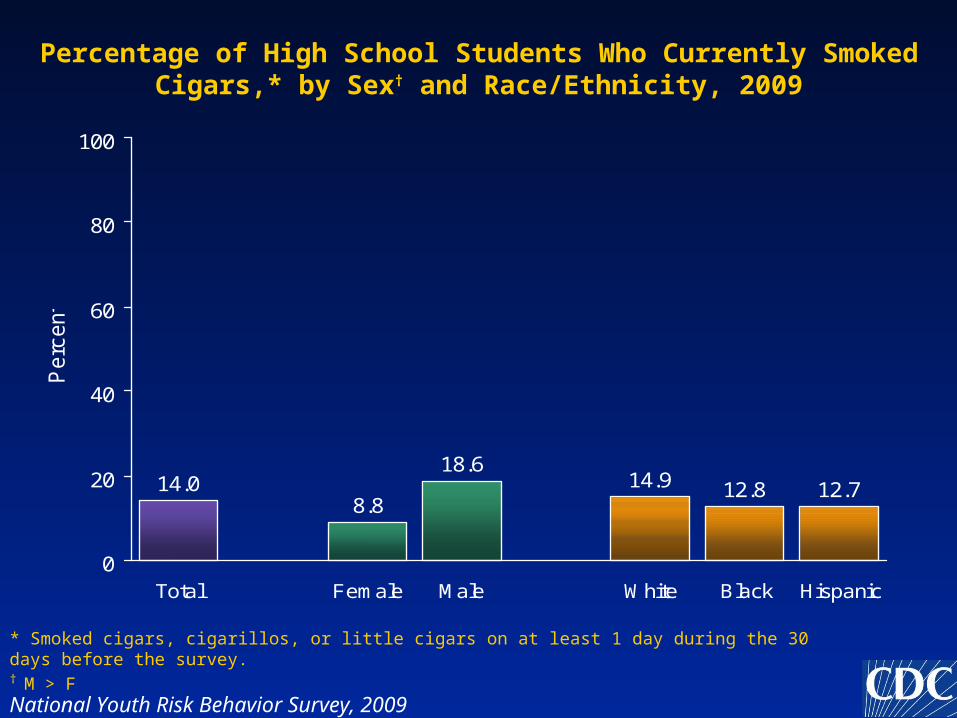
Percentage of High School Students Who Currently Smoked Cigars,* by Sex† and Race/Ethnicity, 2009
14.08.8
18.614.9 12.8 12.7
0
20
40
60
80
100
Total Female Male White Black Hispanic
Perc
ent
National Youth Risk Behavior Survey, 2009
* Smoked cigars, cigarillos, or little cigars on at least 1 day during the 30 days before the survey.† M > F

Percentage of High School Students Who Currently Smoked Cigars,* 1997 – 2009†
22.017.7 15.2 14.8 14.0 13.6 14.0
0
20
40
60
80
100
1997 1999 2001 2003 2005 2007 2009
Perc
ent
National Youth Risk Behavior Surveys, 1997–2009
* Smoked cigars, cigarillos, or little cigars on at least 1 day during the 30 days before the survey.† Decreased 1997–2005, no change 2005–2009, p < 0.05
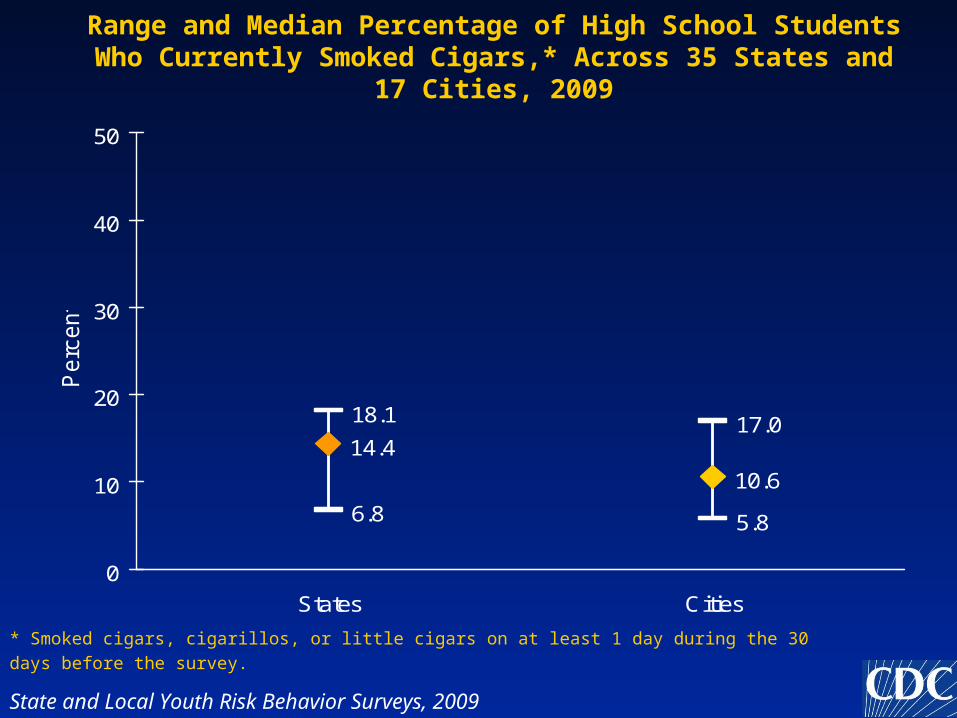
Range and Median Percentage of High School Students Who Currently Smoked Cigars,* Across 35 States and 17 Cities, 2009
6.8 5.8
18.1 17.014.4
10.6
0
10
20
30
40
50
States Cities
Perc
ent
State and Local Youth Risk Behavior Surveys, 2009
* Smoked cigars, cigarillos, or little cigars on at least 1 day during the 30 days before the survey.
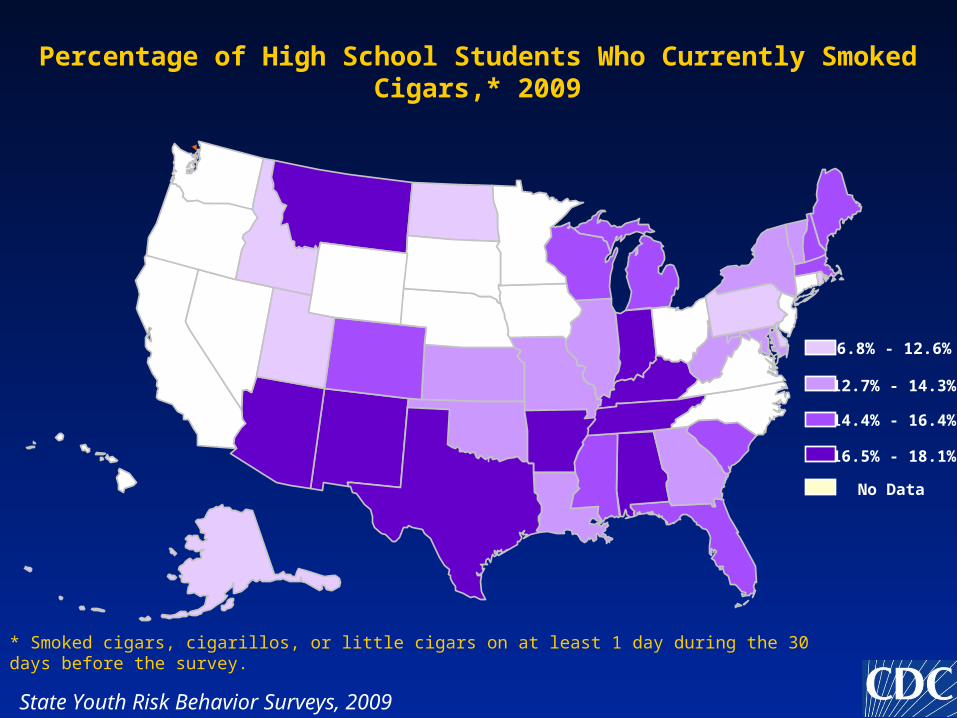
Percentage of High School Students Who Currently Smoked Cigars,* 2009
* Smoked cigars, cigarillos, or little cigars on at least 1 day during the 30 days before the survey.
6.8% - 12.6%
12.7% - 14.3%
14.4% - 16.4%
16.5% - 18.1%
No Data
State Youth Risk Behavior Surveys, 2009
PhiladelphiaSan Francisco
* Smoked cigars, cigarillos, or little cigars on at least 1 day during the 30 days before the survey.
New York City
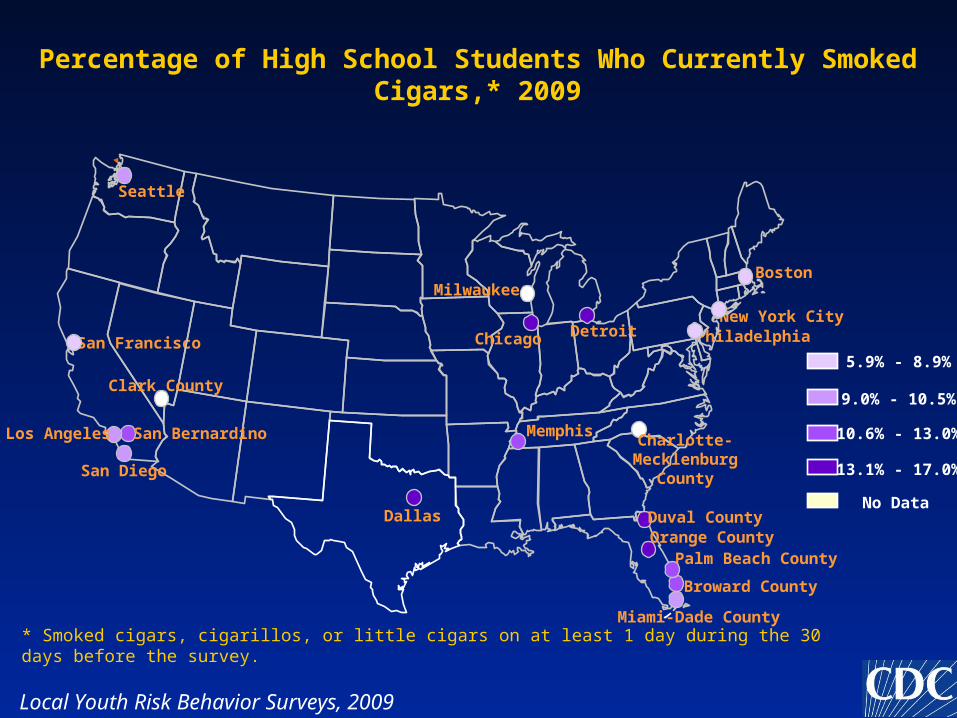
Percentage of High School Students Who Currently Smoked Cigars,* 2009
5.9% - 8.9%
9.0% - 10.5%
10.6% - 13.0%
13.1% - 17.0%
No Data
Local Youth Risk Behavior Surveys, 2009
Miami-Dade County
Palm Beach County
Broward County
Orange CountyDuval CountyDallas
MemphisCharlotte-
MecklenburgCounty
BostonMilwaukee
DetroitChicago
Clark County
Seattle
San BernardinoLos Angeles
San Diego

Percentage of High School Students Who Currently Used Tobacco,* by Sex† and Race/Ethnicity,‡ 2009
26.021.8
29.8 30.3
16.220.8
0
20
40
60
80
100
Total Female Male White Black Hispanic
Perc
ent
National Youth Risk Behavior Survey, 2009
* Smoked cigarettes; smoked cigars, cigarillos, or little cigars; or used chewing tobacco, snuff, or dip on at least 1 day during the 30 days before the survey.† M > F‡ W > H > B

Percentage of High School Students Who Currently Used Tobacco,* 1997 – 2009†
43.440.2
33.927.5 28.4
25.7 26.0
0
20
40
60
80
100
1997 1999 2001 2003 2005 2007 2009
Perc
ent
National Youth Risk Behavior Surveys, 1997–2009
* Smoked cigarettes; smoked cigars, cigarillos, or little cigars; or used chewing tobacco, snuff, or dip on at least 1 day during the 30 days before the survey.† Decreased 1997–2003, no change 2003-2009, p < 0.05.

Range and Median Percentage of High School Students Who Currently Used Tobacco,* Across 35 States and 17 Cities, 2009
10.7 10.2
33.5
21.8
25.3
15.5
0
10
20
30
40
50
States Cities
Perc
ent
State and Local Youth Risk Behavior Surveys, 2009
* Smoked cigarettes; smoked cigars, cigarillos, or little cigars; or used chewing tobacco, snuff, or dip on at least 1 day during the 30 days before the survey.

Percentage of High School Students Who Currently Used Tobacco,* 2009
* Smoked cigarettes; smoked cigars, cigarillos, or little cigars; or used chewing tobacco, snuff, or dip on at least 1 day during the 30 days before the survey.
10.7% - 22.7%
22.8% - 25.2%
25.3% - 28.8%
28.9% - 33.5%
No Data
State Youth Risk Behavior Surveys, 2009

PhiladelphiaSan Francisco
* Smoked cigarettes; smoked cigars, cigarillos, or little cigars; or used chewing tobacco, snuff, or dip on at least 1 day during the 30 days before the survey.
New York City
Percentage of High School Students Who Currently Used Tobacco,* 2009
10.2% - 13.0%
13.1% - 15.4%
15.5% - 17.1%
17.2% - 21.8%
No Data
Local Youth Risk Behavior Surveys, 2009
Miami-Dade County
Palm Beach County
Broward County
Orange CountyDuval CountyDallas
MemphisCharlotte-
MecklenburgCounty
BostonMilwaukee
DetroitChicago
Clark County
Seattle
San BernardinoLos Angeles
San Diego

2009 YRBS ResultsAlcohol and Other Drug Use

Percentage of High School Students Who Ever Drank Alcohol,* by Sex† and Race/Ethnicity,‡ 2009
72.5 74.270.8
73.867.6
76.6
0
20
40
60
80
100
Total Female Male White Black Hispanic
Perc
ent
National Youth Risk Behavior Survey, 2009
* Had at least one drink of alcohol on at least 1 day during their life.† F > M‡ W, H > B

Percentage of High School Students Who Ever Drank Alcohol,* 1991 – 2009†
81.6 80.9 80.4 79.1 81.078.2
74.9 74.3 75.0 72.5
0
20
40
60
80
100
1991 1993 1995 1997 1999 2001 2003 2005 2007 2009
Perc
ent
* Had at least one drink of alcohol on at least 1 day during their life.† Decreased 1991–2009, p < 0.05.
National Youth Risk Behavior Surveys, 1991–2009

Range and Median Percentage of High School Students Who Ever Drank Alcohol,* Across 35 States and 17 Cities, 2009
38.6
54.5
76.273.170.3 68.2
0
20
40
60
80
100
States Cities
Perc
ent
* Had at least one drink of alcohol on at least 1 day during their life.
State and Local Youth Risk Behavior Surveys, 2009

Percentage of High School Students Who Ever Drank Alcohol,* 2009
* Had at least one drink of alcohol on at least 1 day during their life.
38.6% - 67.8%
67.9% - 70.2%
70.3% - 72.3%
72.4% - 76.2%
No Data
State Youth Risk Behavior Surveys, 2009

PhiladelphiaSan Francisco
* Had at least one drink of alcohol on at least 1 day during their life.
New York City
Percentage of High School Students Who Ever Drank Alcohol,* 2009
54.5% - 66.9%
67.0% - 68.1%
68.2% - 69.8%
69.9% - 73.1%
No Data
Local Youth Risk Behavior Surveys, 2009
Miami-Dade County
Palm Beach County
Broward County
Orange CountyDuval CountyDallas
MemphisCharlotte-
MecklenburgCounty
BostonMilwaukee
DetroitChicago
Clark County
Seattle
San BernardinoLos Angeles
San Diego

Percentage of High School Students Who Reported Current Alcohol Use,* by Sex and Race/Ethnicity,† 2009
41.8 42.9 40.844.7
33.4
42.9
0
20
40
60
80
100
Total Female Male White Black Hispanic
Perc
ent
National Youth Risk Behavior Survey, 2009
* Had at least one drink of alcohol on at least 1 day during the 30 days before the survey.† W, H > B

Percentage of High School Students Who Reported Current Alcohol Use,* 1991 – 2009†
50.848.0
51.6 50.8 50.047.1 44.9 43.3 44.7
41.8
0
20
40
60
80
100
1991 1993 1995 1997 1999 2001 2003 2005 2007 2009
Perc
ent
* Had at least one drink of alcohol on at least 1 day during the 30 days before the survey.† No change 1991–1999, decreased 1999–2009, p < 0.05.
National Youth Risk Behavior Surveys, 1991–2009

Range and Median Percentage of High School Students Who Reported Current Alcohol Use,* Across 42 States and 20 Cities,
2009
18.223.6
47.544.2
39.336.4
0
20
40
60
80
100
States Cities
Perc
ent
State and Local Youth Risk Behavior Surveys, 2009
* Had at least one drink of alcohol on at least 1 day during the 30 days before the survey.
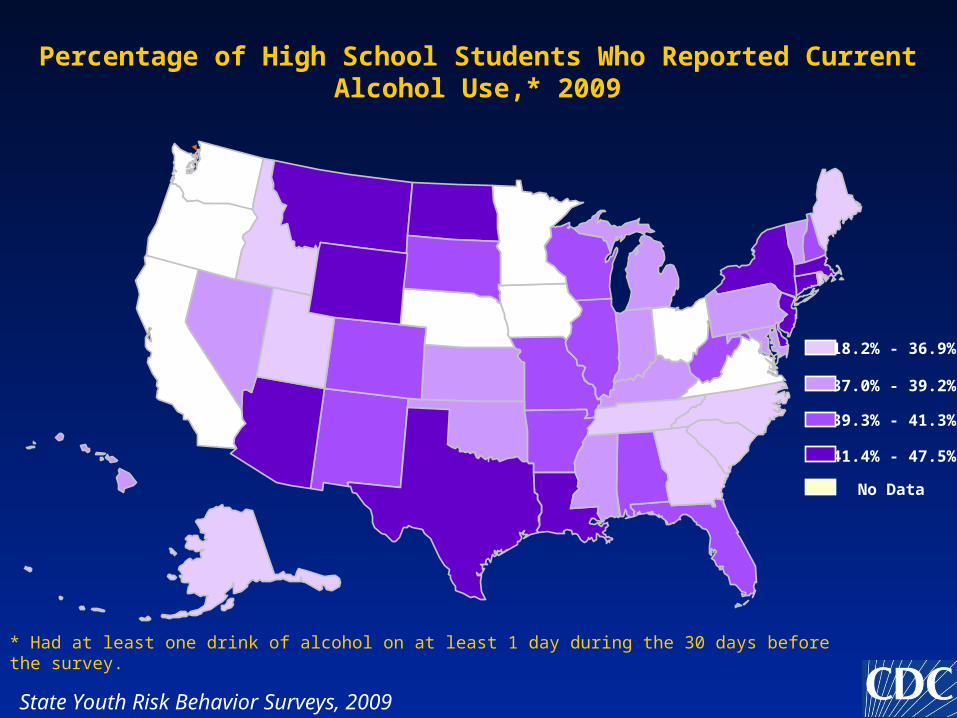
Percentage of High School Students Who Reported Current Alcohol Use,* 2009
* Had at least one drink of alcohol on at least 1 day during the 30 days before the survey.
18.2% - 36.9%
37.0% - 39.2%
39.3% - 41.3%
41.4% - 47.5%
No Data
State Youth Risk Behavior Surveys, 2009

PhiladelphiaSan Francisco
* Had at least one drink of alcohol on at least 1 day during the 30 days before the survey.
New York City
Percentage of High School Students Who Reported Current Alcohol Use,* 2009
23.6% - 31.9%
32.0% - 36.4%
36.5% - 39.2%
39.3% - 44.2%
No Data
Local Youth Risk Behavior Surveys, 2009
Miami-Dade County
Palm Beach County
Broward County
Orange CountyDuval CountyDallas
MemphisCharlotte-
MecklenburgCounty
BostonMilwaukee
DetroitChicago
Clark County
Seattle
San BernardinoLos Angeles
San Diego
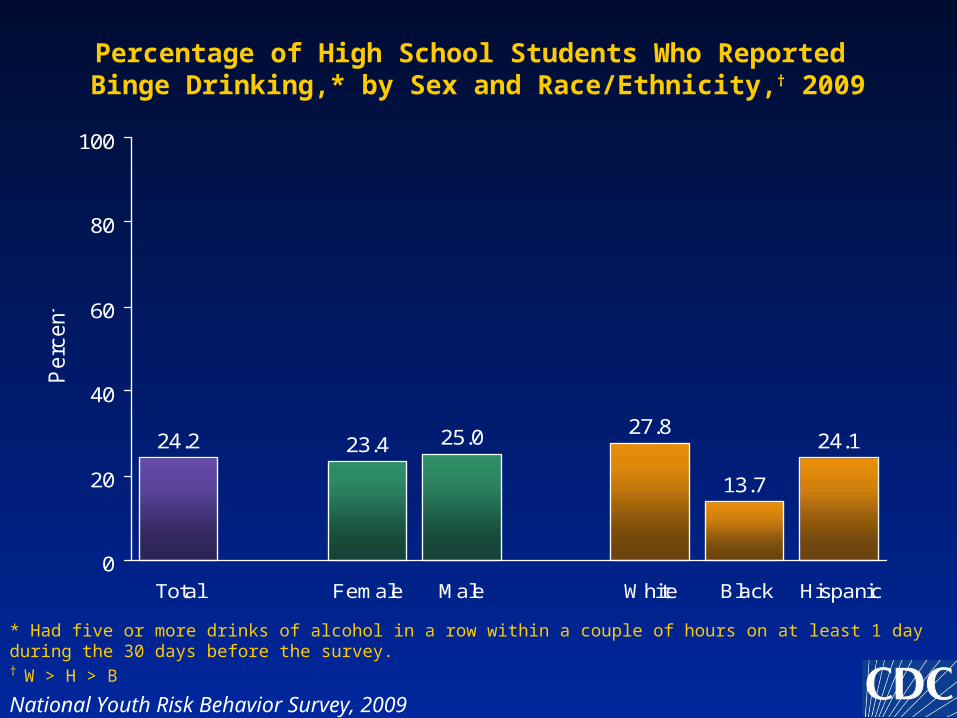
Percentage of High School Students Who Reported Binge Drinking,* by Sex and Race/Ethnicity,† 2009
24.2 23.4 25.0 27.8
13.7
24.1
0
20
40
60
80
100
Total Female Male White Black Hispanic
Perc
ent
National Youth Risk Behavior Survey, 2009
* Had five or more drinks of alcohol in a row within a couple of hours on at least 1 day during the 30 days before the survey.† W > H > B

Percentage of High School Students Who Reported Binge Drinking,* 1991 – 2009†
31.3 30.0 32.6 33.4 31.5 29.9 28.3 25.5 26.0 24.2
0
20
40
60
80
100
1991 1993 1995 1997 1999 2001 2003 2005 2007 2009
Perc
ent
National Youth Risk Behavior Surveys, 1991–2009
* Had five or more drinks of alcohol in a row within a couple of hours on at least 1 day during the 30 days before the survey.† No change 1991–1997, decreased 1997–2009, p < 0.05

Range and Median Percentage of High School Students Who Reported Binge Drinking,* Across 41 States and 20 Cities, 2009
11.5
7.4
30.7
23.924.0
18.5
0
10
20
30
40
50
States Cities
Perc
ent
State and Local Youth Risk Behavior Surveys, 2009
* Had five or more drinks of alcohol in a row within a couple of hours on at least 1 day during the 30 days before the survey.
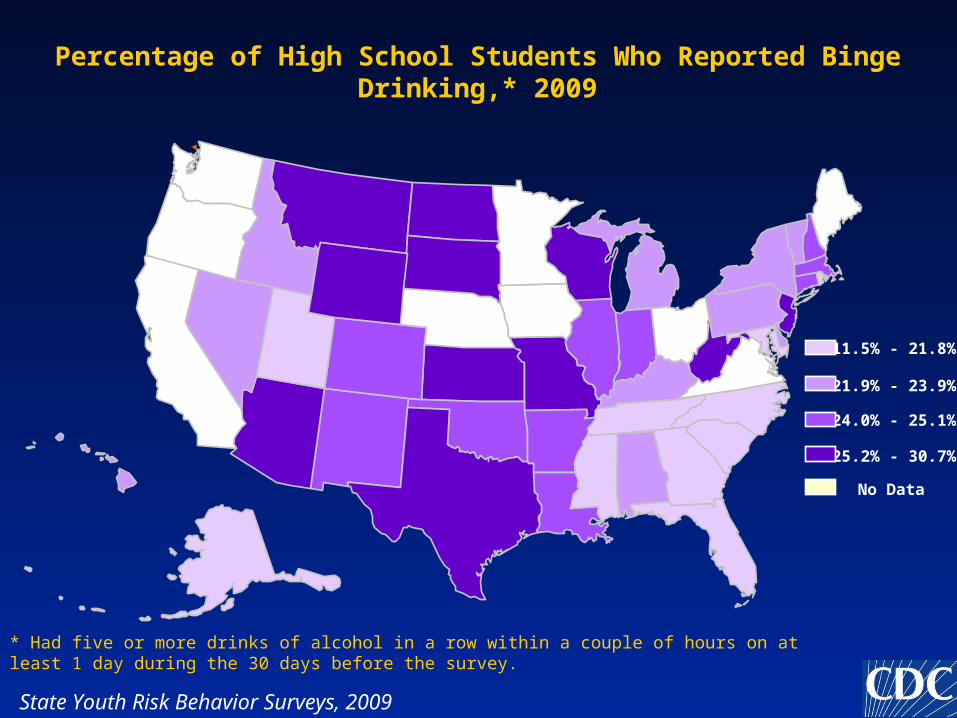
Percentage of High School Students Who Reported Binge Drinking,* 2009
* Had five or more drinks of alcohol in a row within a couple of hours on at least 1 day during the 30 days before the survey.
11.5% - 21.8%
21.9% - 23.9%
24.0% - 25.1%
25.2% - 30.7%
No Data
State Youth Risk Behavior Surveys, 2009
PhiladelphiaSan Francisco
* Had five or more drinks of alcohol in a row within a couple of hours on at least 1 day during the 30 days before the survey.
New York City
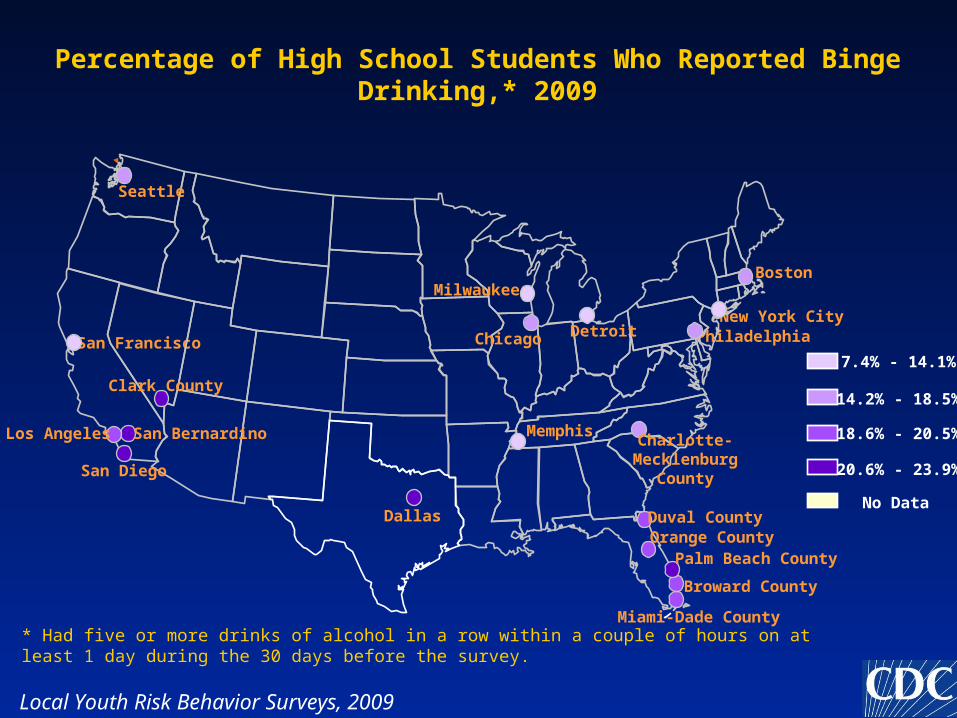
Percentage of High School Students Who Reported Binge Drinking,* 2009
7.4% - 14.1%
14.2% - 18.5%
18.6% - 20.5%
20.6% - 23.9%
No Data
Local Youth Risk Behavior Surveys, 2009
Miami-Dade County
Palm Beach County
Broward County
Orange CountyDuval CountyDallas
MemphisCharlotte-
MecklenburgCounty
BostonMilwaukee
DetroitChicago
Clark County
Seattle
San BernardinoLos Angeles
San Diego
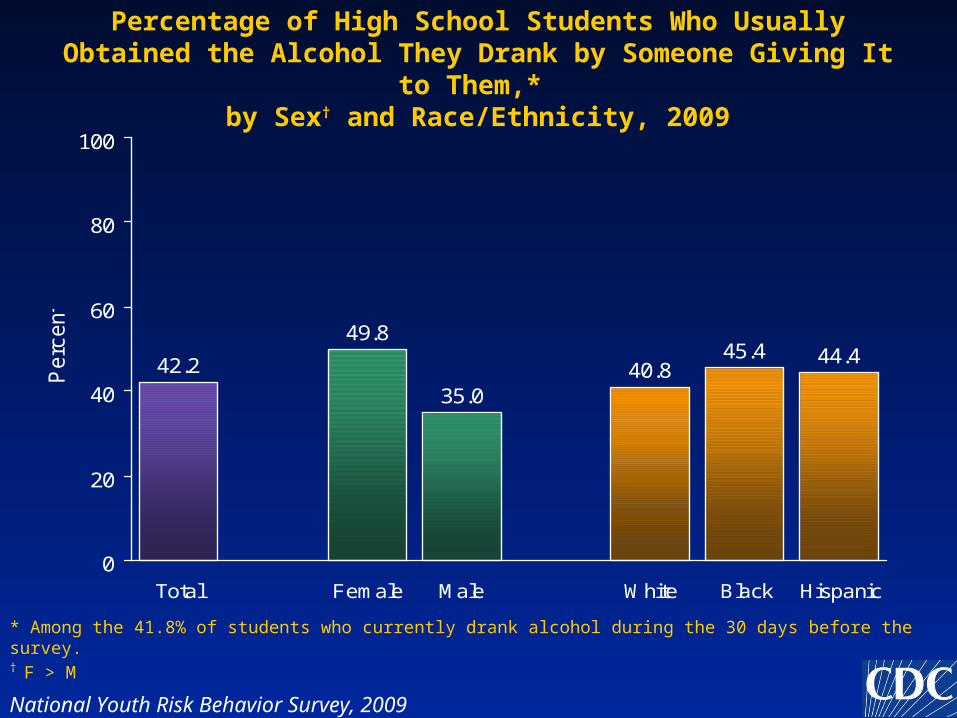
Percentage of High School Students Who Usually Obtained the Alcohol They Drank by Someone Giving It to Them,*
by Sex† and Race/Ethnicity, 2009
42.2
49.8
35.040.8
45.4 44.4
0
20
40
60
80
100
Total Female Male White Black Hispanic
Perc
ent
National Youth Risk Behavior Survey, 2009
* Among the 41.8% of students who currently drank alcohol during the 30 days before the survey.† F > M

Percentage of High School Students Who Usually Obtained the Alcohol They Drank by Someone Giving It to Them,* 2007 – 2009†
41.7 42.2
0
20
40
60
80
100
2007 2009
Perc
ent
National Youth Risk Behavior Surveys, 2007–2009
* Among students who currently drank alcohol during the 30 days before the survey.† No change 2007-2009, p < 0.05

Range and Median Percentage of High School Students Who Usually Obtained the Alcohol They Drank by Someone Giving It to Them,*
Across 37 States and 20 Cities, 2009
31.1 33.2
47.2 49.2
38.6 38.1
0
20
40
60
80
100
States Cities
Perc
ent
State and Local Youth Risk Behavior Surveys, 2009
* Among students who currently drank alcohol during the 30 days before the survey.

Percentage of High School Students Who Usually Obtained the Alcohol They Drank by Someone Giving It to Them,* 2009
* Among students who currently drank alcohol during the 30 days before the survey.
31.1% - 35.9%
36.0% - 38.5%
38.6% - 41.7%
41.8% - 47.2%
No Data
State Youth Risk Behavior Surveys, 2009

PhiladelphiaSan Francisco
* Among students who currently drank alcohol during the 30 days before the survey.
New York City
Percentage of High School Students Who Usually Obtained the Alcohol They Drank by Someone Giving It to Them,* 2009
33.2% - 35.6%
35.7% - 38.1%
38.2% - 39.8%
39.9% - 49.2%
No Data
Local Youth Risk Behavior Surveys, 2009
Miami-Dade County
Palm Beach County
Broward County
Orange CountyDuval CountyDallas
MemphisCharlotte-
MecklenburgCounty
BostonMilwaukee
DetroitChicago
Clark County
Seattle
San BernardinoLos Angeles
San Diego
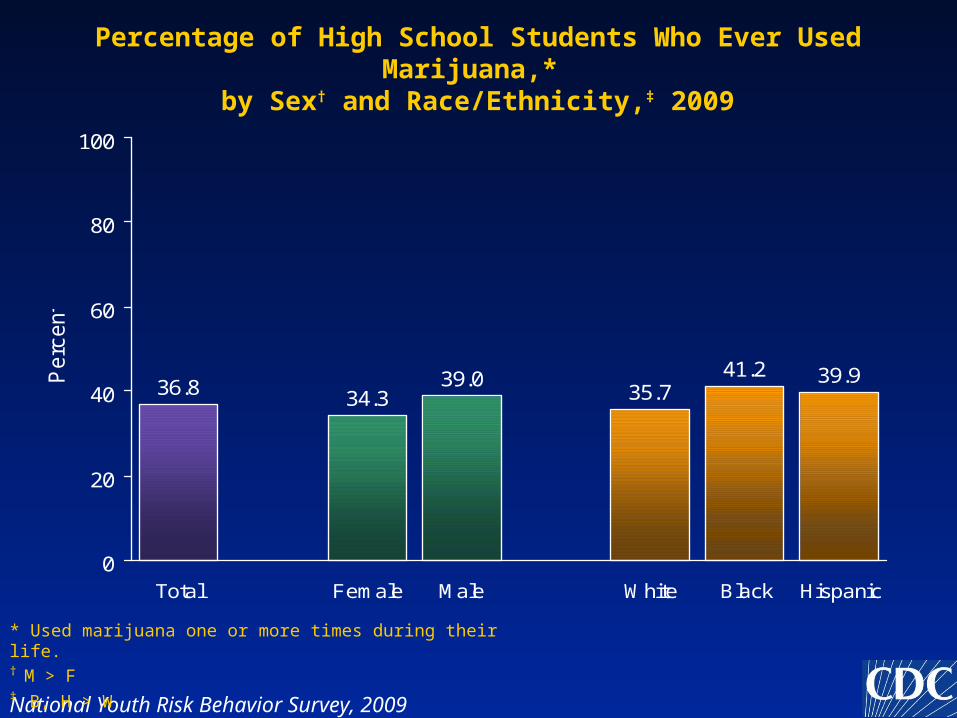
Percentage of High School Students Who Ever Used Marijuana,* by Sex† and Race/Ethnicity,‡ 2009
36.8 34.339.0
35.741.2 39.9
0
20
40
60
80
100
Total Female Male White Black Hispanic
Perc
ent
National Youth Risk Behavior Survey, 2009
* Used marijuana one or more times during their life. † M > F‡ B, H > W

Percentage of High School Students Who Ever Used Marijuana,* 1991 – 2009†
31.3 32.8
42.447.1 47.2
42.4 40.2 38.4 38.1 36.8
0
20
40
60
80
100
1991 1993 1995 1997 1999 2001 2003 2005 2007 2009
Perc
ent
* Used marijuana one or more times during their life.† Increased 1991–1999, decreased 1999–2009, p < 0.05.
National Youth Risk Behavior Surveys, 1991–2009

Range and Median Percentage of High School Students Who Ever Used Marijuana,* Across 40 States and 20 Cities, 2009
20.626.5
44.5
51.9
36.5 37.6
0
20
40
60
80
100
States Cities
Perc
ent
* Used marijuana one or more times during their life.
State and Local Youth Risk Behavior Surveys, 2009

Percentage of High School Students Who Ever Used Marijuana,* 2009
* Used marijuana one or more times during their life.
20.6% - 34.4%
34.5% - 36.5%
36.6% - 39.2%
39.3% - 44.5%
No Data
State Youth Risk Behavior Surveys, 2009

PhiladelphiaSan Francisco
* Used marijuana one or more times during their life.
New York City
Percentage of High School Students Who Ever Used Marijuana,* 2009
26.5% - 36.2%
36.3% - 37.6%
37.7% - 39.3%
39.4% - 51.9%
No Data
Local Youth Risk Behavior Surveys, 2009
Miami-Dade County
Palm Beach County
Broward County
Orange CountyDuval CountyDallas
MemphisCharlotte-
MecklenburgCounty
BostonMilwaukee
DetroitChicago
Clark County
Seattle
San BernardinoLos Angeles
San Diego

Percentage of High School Students Who Reported Current Marijuana Use,* by Sex† and Race/Ethnicity, 2009
20.817.9
23.4 20.7 22.2 21.6
0
20
40
60
80
100
Total Female Male White Black Hispanic
Perc
ent
National Youth Risk Behavior Survey, 2009
* Used marijuana one or more times during the 30 days before the survey.† M > F

Percentage of High School Students Who Reported Current Marijuana Use,* 1991 – 2009†
14.717.7
25.3 26.2 26.723.9 22.4 20.2 19.7 20.8
0
20
40
60
80
100
1991 1993 1995 1997 1999 2001 2003 2005 2007 2009
Perc
ent
* Used marijuana one or more times during the 30 days before the survey.† Increased 1991–1999, decreased 1999–2009, p < 0.05.
National Youth Risk Behavior Surveys, 1991–2009

Range and Median Percentage of High School Students Who Reported Current Marijuana Use,* Across 42 States and 20 Cities, 2009
10.0
15.0
28.0 28.5
20.3 21.1
0
10
20
30
40
50
States Cities
Perc
ent
State and Local Youth Risk Behavior Surveys, 2009
* Used marijuana one or more times during the 30 days before the survey.
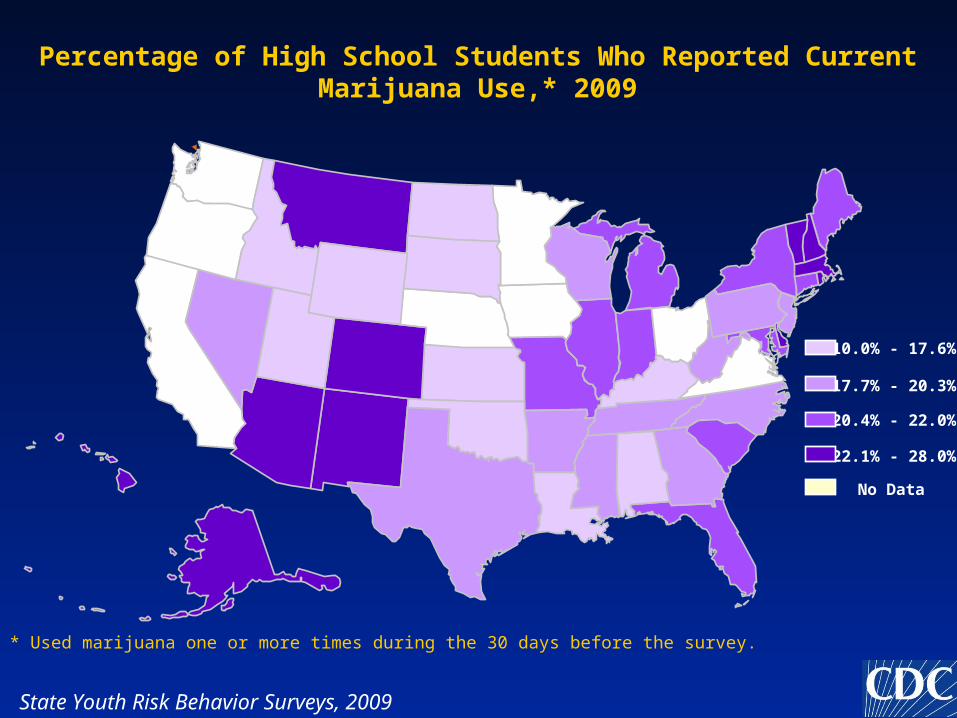
Percentage of High School Students Who Reported Current Marijuana Use,* 2009
* Used marijuana one or more times during the 30 days before the survey.
10.0% - 17.6%
17.7% - 20.3%
20.4% - 22.0%
22.1% - 28.0%
No Data
State Youth Risk Behavior Surveys, 2009

PhiladelphiaSan Francisco
* Used marijuana one or more times during the 30 days before the survey.
New York City
Percentage of High School Students Who Reported Current Marijuana Use,* 2009
15.0% - 18.9%
19.0% - 21.0%
21.1% - 22.1%
22.2% - 28.5%
No Data
Local Youth Risk Behavior Surveys, 2009
Miami-Dade County
Palm Beach County
Broward County
Orange CountyDuval CountyDallas
MemphisCharlotte-
MecklenburgCounty
BostonMilwaukee
DetroitChicago
Clark County
Seattle
San BernardinoLos Angeles
San Diego

Percentage of High School Students Who Ever Used Cocaine,* by Sex† and Race/Ethnicity,‡ 2009
6.4 5.3 7.3 6.32.9
9.4
0
20
40
60
80
100
Total Female Male White Black Hispanic
Perc
ent
National Youth Risk Behavior Survey, 2009
* Used any form of cocaine, (e.g., powder, crack, or freebase) one or more times during their life.† M > F‡ H > W > B

Percentage of High School Students Who Ever Used Cocaine,* 1991 – 2009†
5.9 4.9 7.0 8.2 9.5 9.4 8.7 7.6 7.2 6.4
0
20
40
60
80
100
1991 1993 1995 1997 1999 2001 2003 2005 2007 2009
Perc
ent
* Used any form of cocaine (e.g., powder, crack, or freebase) one or more times during their life.† Increased 1991–1999, decreased 1999–2009, p < 0.05.
National Youth Risk Behavior Surveys, 1991–2009

Range and Median Percentage of High School Students Who Ever Used Cocaine,* Across 39 States and 20 Cities, 2009
3.82.1
12.8
10.0
6.3 6.0
0
5
10
15
20
25
States Cities
Perc
ent
State and Local Youth Risk Behavior Surveys, 2009
* Used any form of cocaine, (e.g., powder, crack, or freebase) one or more times during their life.

Percentage of High School Students Who Ever Used Cocaine,* 2009
* Used any form of cocaine (e.g., powder, crack, or freebase) one or more times during their life.
3.8% - 5.4%
5.5% - 6.2%
6.3% - 7.3%
7.4% - 12.8%
No Data
State Youth Risk Behavior Surveys, 2009

PhiladelphiaSan Francisco
* Used any form of cocaine (e.g., powder, crack, or freebase) one or more times during their life.
New York City
Percentage of High School Students Who Ever Used Cocaine,* 2009
2.1% - 4.5%
4.6% - 6.0%
6.1% - 7.6%
7.7% - 10.0%
No Data
Local Youth Risk Behavior Surveys, 2009
Miami-Dade County
Palm Beach County
Broward County
Orange CountyDuval CountyDallas
MemphisCharlotte-
MecklenburgCounty
BostonMilwaukee
DetroitChicago
Clark County
Seattle
San BernardinoLos Angeles
San Diego
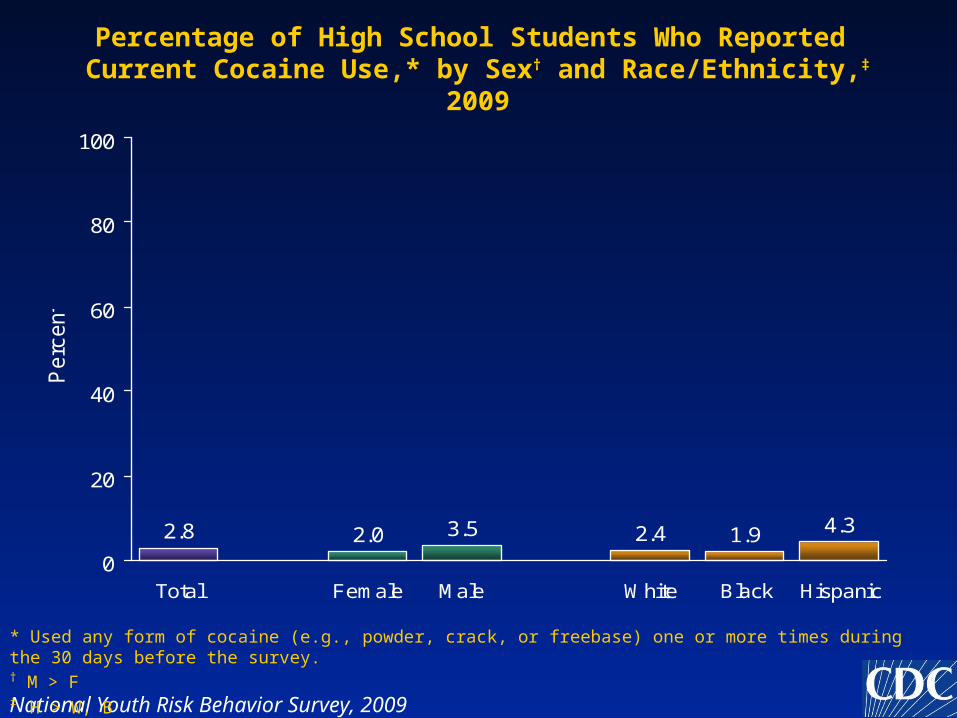
Percentage of High School Students Who Reported Current Cocaine Use,* by Sex† and Race/Ethnicity,‡ 2009
2.8 2.0 3.5 2.4 1.9 4.3
0
20
40
60
80
100
Total Female Male White Black Hispanic
Perc
ent
National Youth Risk Behavior Survey, 2009
* Used any form of cocaine (e.g., powder, crack, or freebase) one or more times during the 30 days before the survey.† M > F‡ H > W, B

Percentage of High School Students Who Reported Current Cocaine Use,* 1991 – 2009†
1.7 1.9 3.1 3.3 4.0 4.2 4.1 3.4 3.3 2.8
0
20
40
60
80
100
1991 1993 1995 1997 1999 2001 2003 2005 2007 2009
Perc
ent
* Used any form of cocaine (e.g., powder, crack, or freebase) one or more times during the 30 days before the survey.† Increased 1991–2001, decreased 2001–2009, p < 0.05.
National Youth Risk Behavior Surveys, 1991–2009

Range and Median Percentage of High School Students Who Reported Current Cocaine Use,* Across 33 States and 17 Cities, 2009
1.70.9
5.64.4
2.8 3.1
0
5
10
15
20
States Cities
Perc
ent
State and Local Youth Risk Behavior Surveys, 2009
* Used any form of cocaine (e.g., powder, crack, or freebase) one or more times during the 30 days before the survey.

Percentage of High School Students Who Reported Current Cocaine Use,* 2009
* Used any form of cocaine (e.g., powder, crack, or freebase) one or more times during the 30 days before the survey.
1.7% - 2.3%
2.4% - 2.7%
2.8% - 3.2%
3.3% - 5.6%
No Data
State Youth Risk Behavior Surveys, 2009
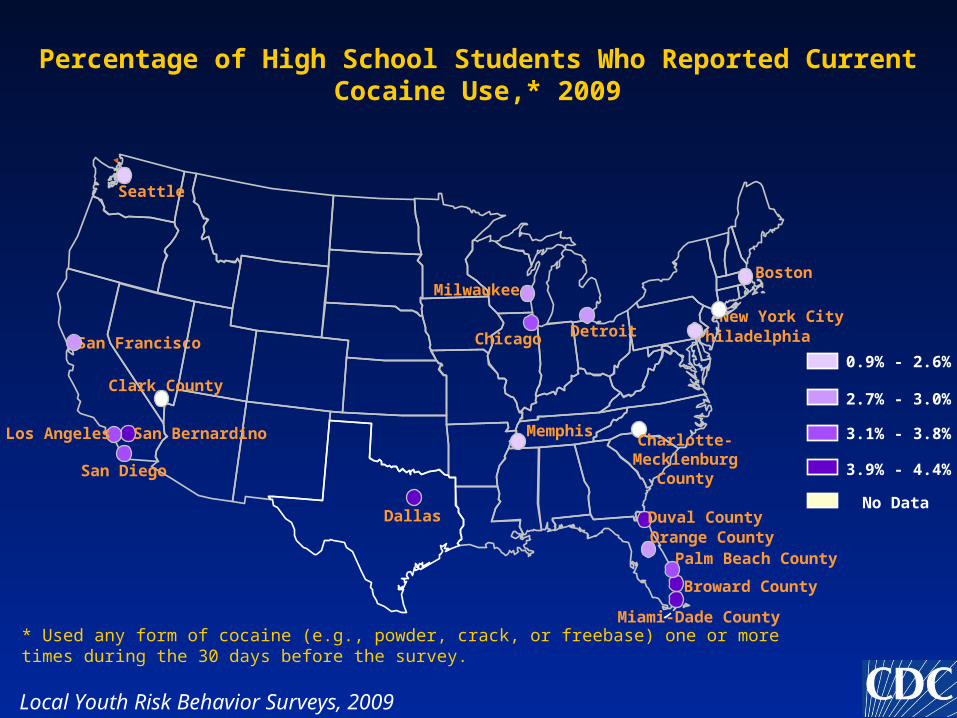
PhiladelphiaSan Francisco
* Used any form of cocaine (e.g., powder, crack, or freebase) one or more times during the 30 days before the survey.
New York City
Percentage of High School Students Who Reported Current Cocaine Use,* 2009
0.9% - 2.6%
2.7% - 3.0%
3.1% - 3.8%
3.9% - 4.4%
No Data
Local Youth Risk Behavior Surveys, 2009
Miami-Dade County
Palm Beach County
Broward County
Orange CountyDuval CountyDallas
MemphisCharlotte-
MecklenburgCounty
BostonMilwaukee
DetroitChicago
Clark County
Seattle
San BernardinoLos Angeles
San Diego

Percentage of High School Students Who Ever Used Inhalants,* by Sex† and Race/Ethnicity,‡ 2009
11.7 12.9 10.6 11.58.2
14.0
0
20
40
60
80
100
Total Female Male White Black Hispanic
Perc
ent
National Youth Risk Behavior Survey, 2009
* Sniffed glue, breathed the contents of aerosol spray cans, or inhaled any paints or sprays to get high one or more times during their life.† F > M‡ H > W > B

Percentage of High School Students Who Ever Used Inhalants,* 1995 – 2009†
20.316.0 14.6 14.7 12.1 12.4 13.3 11.7
0
20
40
60
80
100
1995 1997 1999 2001 2003 2005 2007 2009
Perc
ent
* Sniffed glue, breathed the contents of aerosol spray cans, or inhaled any paints or sprays to get high one or more times during their life.† Decreased 1995–2003, no change 2003–2009, p < 0.05.
National Youth Risk Behavior Surveys, 1995–2009

Range and Median Percentage of High School Students Who Ever Used Inhalants,* Across 38 States and 20 Cities, 2009
8.76.0
16.818.9
11.69.9
0
10
20
30
40
50
States Cities
Perc
ent
State and Local Youth Risk Behavior Surveys, 2009
* Sniffed glue, breathed the contents of aerosol spray cans, or inhaled any paints or sprays to get high one or more times during their life.

Percentage of High School Students Who Ever Used Inhalants,* 2009
* Sniffed glue, breathed the contents of aerosol spray cans, or inhaled any paints or sprays to get high one or more times during their life.
8.7% - 10.2%
10.3% - 11.5%
11.6% - 12.7%
12.8% - 16.8%
No Data
State Youth Risk Behavior Surveys, 2009

PhiladelphiaSan Francisco
* Sniffed glue, breathed the contents of aerosol spray cans, or inhaled any paints or sprays to get high one or more times during their life.
New York City
Percentage of High School Students Who Ever Used Inhalants,* 2009
6.0% - 8.9%
9.0% - 9.9%
10.0% - 11.4%
11.5% - 18.9%
No Data
Local Youth Risk Behavior Surveys, 2009
Miami-Dade County
Palm Beach County
Broward County
Orange CountyDuval CountyDallas
MemphisCharlotte-
MecklenburgCounty
BostonMilwaukee
DetroitChicago
Clark County
Seattle
San BernardinoLos Angeles
San Diego
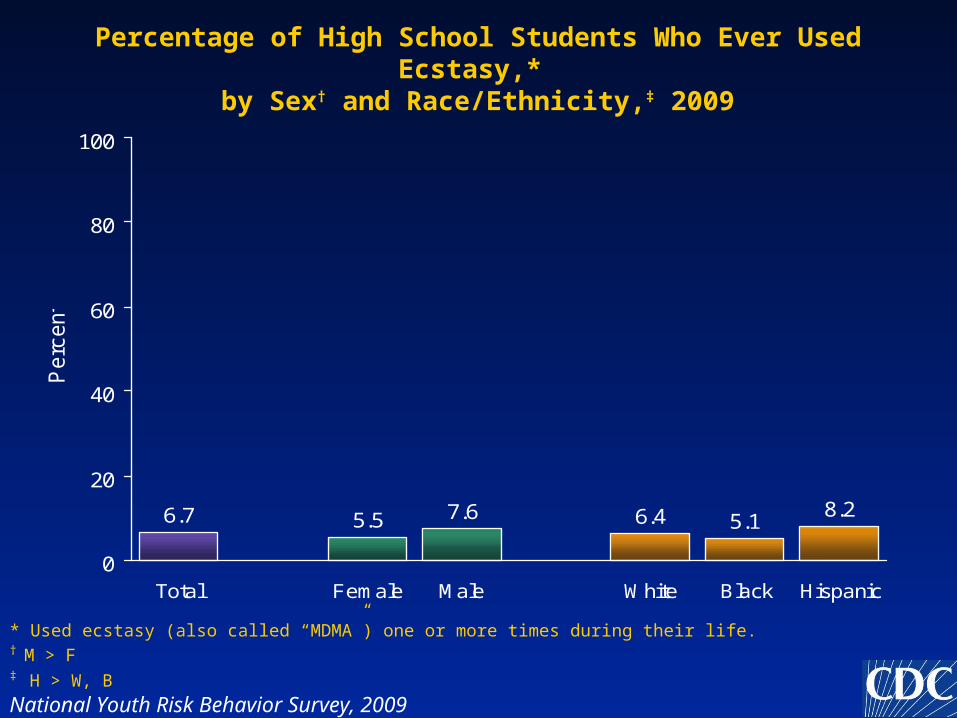
Percentage of High School Students Who Ever Used Ecstasy,* by Sex† and Race/Ethnicity,‡ 2009
6.7 5.5 7.6 6.4 5.18.2
0
20
40
60
80
100
Total Female Male White Black Hispanic
Perc
ent
National Youth Risk Behavior Survey, 2009
* Used ecstasy (also called “MDMA”) one or more times during their life.† M > F‡ H > W, B

Percentage of High School Students Who Ever Used Ecstasy,* 2001 – 2009†
11.1 11.16.3 5.8 6.7
0
20
40
60
80
100
2001 2003 2005 2007 2009
Perc
ent
* Used ecstasy (also called “MDMA”) one or more times during their life.† Decreased 2001–2009, p < 0.05.
National Youth Risk Behavior Surveys, 2001–2009

Range and Median Percentage of High School Students Who Ever Used Ecstasy,* Across 36 States and 18 Cities, 2009
4.9
3.0
14.112.6
6.88.0
0
5
10
15
20
25
States Cities
Perc
ent
* Used ecstasy (also called “MDMA”) one or more times during their life.
State and Local Youth Risk Behavior Surveys, 2009

Percentage of High School Students Who Ever Used Ecstasy,* 2009
* Used ecstasy (also called "MDMA") one or more times during their life.
4.9% - 5.7%
5.8% - 6.7%
6.8% - 7.8%
7.9% - 14.1%
No Data
State Youth Risk Behavior Surveys, 2009

PhiladelphiaSan Francisco
* Used ecstasy (also called "MDMA") one or more times during their life.
New York City
Percentage of High School Students Who Ever Used Ecstasy,* 2009
3.0% - 5.5%
5.6% - 7.9%
8.0% - 10.1%
10.2% - 12.6%
No Data
Local Youth Risk Behavior Surveys, 2009
Miami-Dade County
Palm Beach County
Broward County
Orange CountyDuval CountyDallas
MemphisCharlotte-
MecklenburgCounty
BostonMilwaukee
DetroitChicago
Clark County
Seattle
San BernardinoLos Angeles
San Diego

Percentage of High School Students Who Ever Used Heroin,* by Sex† and Race/Ethnicity,‡ 2009
2.5 1.7 3.2 2.2 2.2 3.3
0
20
40
60
80
100
Total Female Male White Black Hispanic
Perc
ent
National Youth Risk Behavior Survey, 2009
* Used heroin (also called “smack,” “junk,” or “China White”) one or more times during their life.† M > F‡ H > W

Percentage of High School Students Who Ever Used Heroin,* 1999 – 2009†
2.4 3.1 3.3 2.4 2.3 2.5
0
20
40
60
80
100
1999 2001 2003 2005 2007 2009
Perc
ent
* Used heroin (also called “smack,” “junk,” or “China White”) one or more times during their life.† No change 1999–2009, p < 0.05.
National Youth Risk Behavior Surveys, 1999–2009

Range and Median Percentage of High School Students Who Ever Used Heroin,* Across 35 States and 17 Cities, 2009
1.9 1.7
6.4
11.1
3.0 3.4
0
5
10
15
20
25
States Cities
Perc
ent
State and Local Youth Risk Behavior Surveys, 2009
* Used heroin (also called “smack,” “junk,” or “China White”) one or more times during their life.

Percentage of High School Students Who Ever Used Heroin,* 2009
* Used heroin (also called "smack," "junk," or "China White") one or more times during their life.
1.9% - 2.4%
2.5% - 2.9%
3.0% - 3.7%
3.8% - 6.4%
No Data
State Youth Risk Behavior Surveys, 2009

PhiladelphiaSan Francisco
* Used heroin (also called "smack," "junk," or "China White") one or more times during their life.
New York City
Percentage of High School Students Who Ever Used Heroin,* 2009
1.7% - 2.5%
2.6% - 3.3%
3.4% - 3.8%
3.9% - 11.1%
No Data
Local Youth Risk Behavior Surveys, 2009
Miami-Dade County
Palm Beach County
Broward County
Orange CountyDuval CountyDallas
MemphisCharlotte-
MecklenburgCounty
BostonMilwaukee
DetroitChicago
Clark County
Seattle
San BernardinoLos Angeles
San Diego

Percentage of High School Students Who Ever Used Methamphetamines,* by Sex† and Race/Ethnicity,‡ 2009
4.1 3.3 4.7 3.7 2.75.7
0
20
40
60
80
100
Total Female Male White Black Hispanic
Perc
ent
National Youth Risk Behavior Survey, 2009
* Used methamphetamines (also called “speed,” “crystal,” “crank,” or “ice”) one or more times during their life.† M > F‡ H > W, B

Percentage of High School Students Who Ever Used Methamphetamines,* 1999 – 2009†
9.1 9.8 7.6 6.2 4.4 4.1
0
20
40
60
80
100
1999 2001 2003 2005 2007 2009
Perc
ent
* Used methamphetamines (also called “speed,” “crystal,” “crank,” or “ice”) one or more times during their life.† No change 1999–2001, decreased 2001–2009, p < 0.05.
National Youth Risk Behavior Surveys, 1999–2009
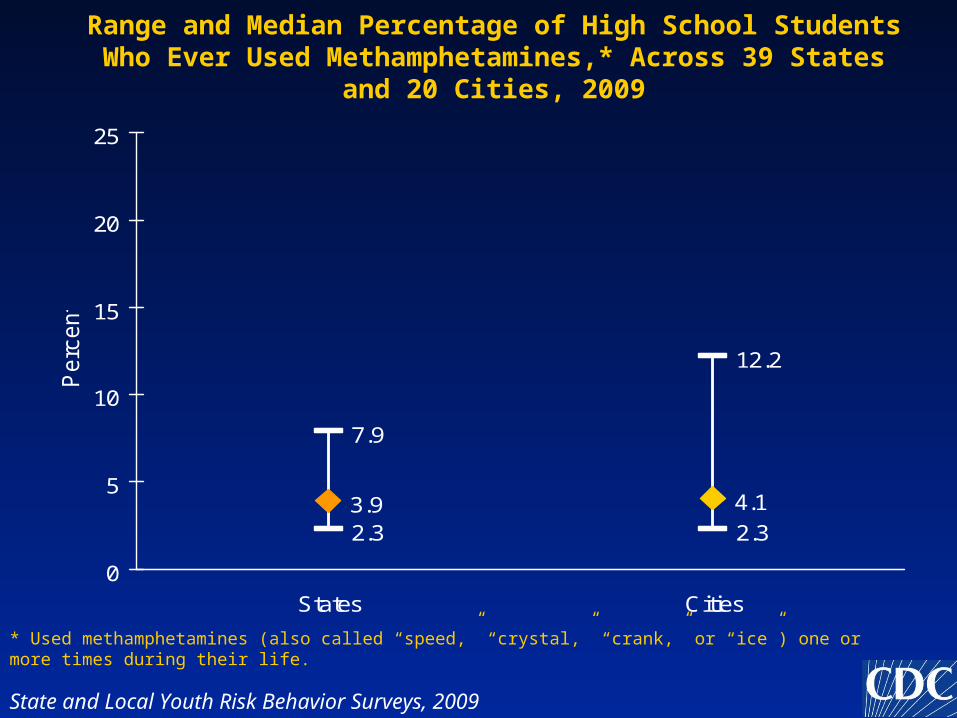
Range and Median Percentage of High School Students Who Ever Used Methamphetamines,* Across 39 States and 20 Cities, 2009
2.3 2.3
7.9
12.2
3.9 4.1
0
5
10
15
20
25
States Cities
Perc
ent
State and Local Youth Risk Behavior Surveys, 2009
* Used methamphetamines (also called “speed,” “crystal,” “crank,” or “ice”) one or more times during their life.
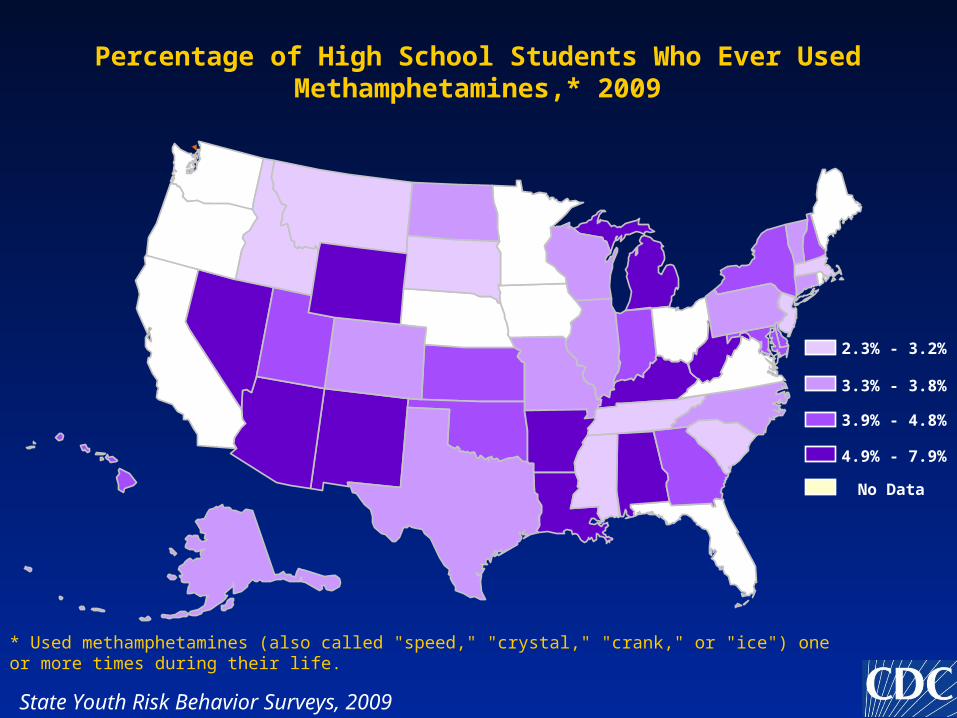
Percentage of High School Students Who Ever Used Methamphetamines,* 2009
* Used methamphetamines (also called "speed," "crystal," "crank," or "ice") one or more times during their life.
2.3% - 3.2%
3.3% - 3.8%
3.9% - 4.8%
4.9% - 7.9%
No Data
State Youth Risk Behavior Surveys, 2009
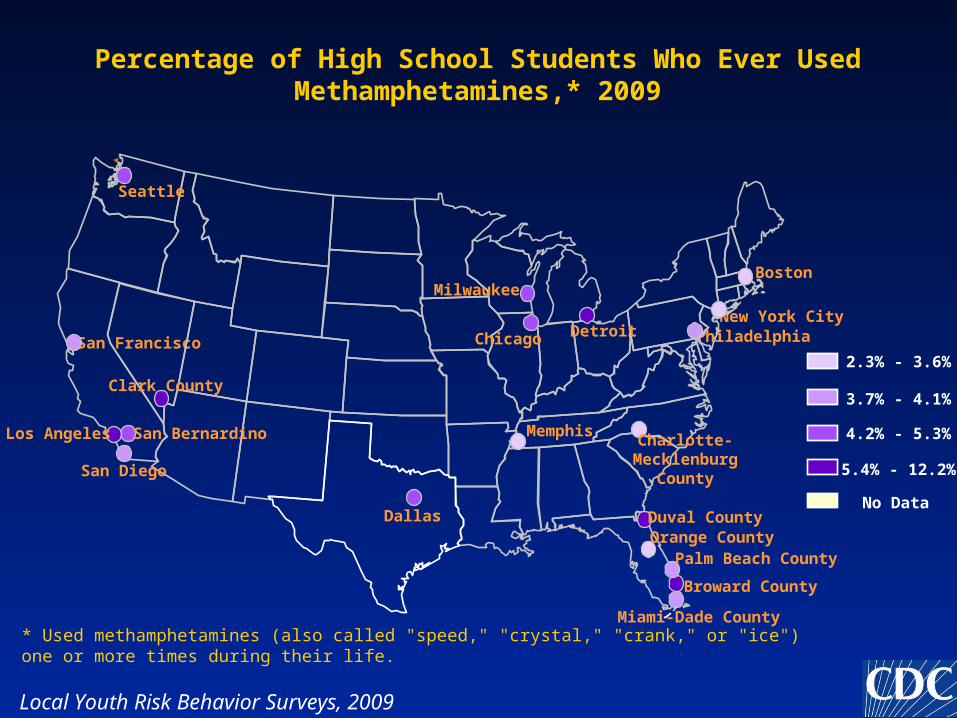
PhiladelphiaSan Francisco
* Used methamphetamines (also called "speed," "crystal," "crank," or "ice") one or more times during their life.
New York City
Percentage of High School Students Who Ever Used Methamphetamines,* 2009
2.3% - 3.6%
3.7% - 4.1%
4.2% - 5.3%
5.4% - 12.2%
No Data
Local Youth Risk Behavior Surveys, 2009
Miami-Dade County
Palm Beach County
Broward County
Orange CountyDuval CountyDallas
MemphisCharlotte-
MecklenburgCounty
BostonMilwaukee
DetroitChicago
Clark County
Seattle
San BernardinoLos Angeles
San Diego

Percentage of High School Students Who Ever Took Steroids Without a Doctor’s Prescription,* by Sex† and Race/Ethnicity, 2009
3.3 2.2 4.3 3.1 2.8 3.9
0
20
40
60
80
100
Total Female Male White Black Hispanic
Perc
ent
National Youth Risk Behavior Survey, 2009
* Took steroid pills or shots without a doctor’s prescription one or more times during their life.† M > F

Percentage of High School Students Who Ever Took Steroids Without a Doctor’s Prescription,* 1991 – 2009†
2.7 2.2 3.7 3.1 3.7 5.0 6.1 4.0 3.9 3.3
0
20
40
60
80
100
1991 1993 1995 1997 1999 2001 2003 2005 2007 2009
Perc
ent
* Took steroid pills or shots without a doctor’s prescription one or more times during their life.† Increased 1991–2003, decreased 2003–2009, p < 0.05.
National Youth Risk Behavior Surveys, 1991–2009

Range and Median Percentage of High School Students Who Ever Took Steroids Without a Doctor’s Prescription,*
Across 36 States and 18 Cities, 2009
2.1 2.3
7.2 7.3
3.6 3.3
0
5
10
15
20
States Cities
Perc
ent
State and Local Youth Risk Behavior Surveys, 2009
* Took steroid pills or shots without a doctor’s prescription one or more times during their life.

Percentage of High School Students Who Ever Took Steroids Without a Doctor’s Prescription,* 2009
* Took steroid pills or shots without a doctor’s prescription one or more times during their life.
2.1% - 3.0%
3.1% - 3.6%
3.7% - 4.1%
4.2% - 7.2%
No Data
State Youth Risk Behavior Surveys, 2009

PhiladelphiaSan Francisco
* Took steroid pills or shots without a doctor’s prescription one or more times during their life.
New York City
Percentage of High School Students Who Ever Took Steroids Without a Doctor’s Prescription,* 2009
2.3% - 2.9%
3.0% - 3.3%
3.4% - 3.7%
3.8% - 7.3%
No Data
Local Youth Risk Behavior Surveys, 2009
Miami-Dade County
Palm Beach County
Broward County
Orange CountyDuval CountyDallas
MemphisCharlotte-
MecklenburgCounty
BostonMilwaukee
DetroitChicago
Clark County
Seattle
San BernardinoLos Angeles
San Diego

Percentage of High School Students Who Ever Injected Any Illegal Drug,* by Sex† and Race/Ethnicity,‡ 2009
2.1 1.4 2.7 1.6 2.4 3.1
0
20
40
60
80
100
Total Female Male White Black Hispanic
Perc
ent
National Youth Risk Behavior Survey, 2009
* Used a needle to inject any illegal drug into their body one or more times during their life.† M > F‡ H > W
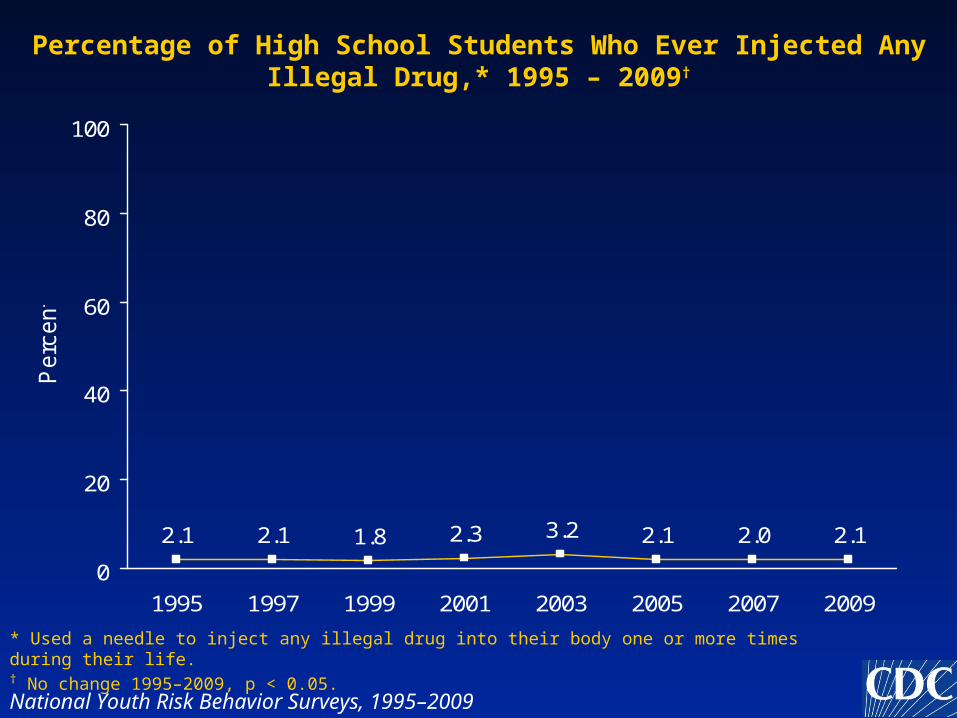
Percentage of High School Students Who Ever Injected Any Illegal Drug,* 1995 – 2009†
2.1 2.1 1.8 2.3 3.2 2.1 2.0 2.1
0
20
40
60
80
100
1995 1997 1999 2001 2003 2005 2007 2009
Perc
ent
* Used a needle to inject any illegal drug into their body one or more times during their life.† No change 1995–2009, p < 0.05.
National Youth Risk Behavior Surveys, 1995–2009

Range and Median Percentage of High School Students Who Ever Injected Any Illegal Drug,* Across 37 States and 19 Cities, 2009
1.7 1.5
5.4 5.3
2.5 2.7
0
5
10
15
20
States Cities
Perc
ent
State and Local Youth Risk Behavior Surveys, 2009
* Used a needle to inject any illegal drug into their body one or more times during their life.

Percentage of High School Students Who Ever Injected Any Illegal Drug,* 2009
* Used a needle to inject any illegal drug into their body one or more times during their life.
1.7% - 2.1%
2.2% - 2.4%
2.5% - 3.4%
3.5% - 5.4%
No Data
State Youth Risk Behavior Surveys, 2009

PhiladelphiaSan Francisco
* Used a needle to inject any illegal drug into their body one or more times during their life.
New York City
Percentage of High School Students Who Ever Injected Any Illegal Drug,* 2009
1.5% - 1.7%
1.8% - 2.7%
2.8% - 3.7%
3.8% - 5.3%
No Data
Local Youth Risk Behavior Surveys, 2009
Miami-Dade County
Palm Beach County
Broward County
Orange CountyDuval CountyDallas
MemphisCharlotte-
MecklenburgCounty
BostonMilwaukee
DetroitChicago
Clark County
Seattle
San BernardinoLos Angeles
San Diego

Percentage of High School Students Who Ever Used Hallucinogenic Drugs,* by Sex† and Race/Ethnicity,‡ 2009
8.0 5.510.2 9.0
3.37.9
0
20
40
60
80
100
Total Female Male White Black Hispanic
Perc
ent
National Youth Risk Behavior Survey, 2009
* Used hallucinogenic drugs (e.g., LSD, acid, PCP, angel dust, mescaline, or mushrooms) one or more times during their life.† M > F‡ W, H > B

Percentage of High School Students Who Ever Used Hallucinogenic Drugs,* 2001 – 2009†
13.310.6 8.5 7.8 8.0
0
20
40
60
80
100
2001 2003 2005 2007 2009
Perc
ent
* Used hallucinogenic drugs (e.g., LSD, acid, PCP, angel dust, mescaline, or mushrooms) one or more times during their life.† Decreased 2001–2007, no change 2007-2009, p < 0.05.
National Youth Risk Behavior Surveys, 2001–2009

Percentage of High School Students Who Ever Took Prescription Drugs Without a Doctor’s Prescription,*
by Sex and Race/Ethnicity,† 2009
20.2 19.8 20.4 23.0
11.817.2
0
20
40
60
80
100
Total Female Male White Black Hispanic
Perc
ent
National Youth Risk Behavior Survey, 2009
* Took prescription drugs (e.g., Oxycontin, Percocet, Vicodin, Adderall, Ritalin, or Xanax) without a doctor’s prescription one or more times during their life.† W > H > B
2009 YRBS ResultsAge of Initiation of Risk Behaviors

Percentage of High School Students Who Smoked a Whole Cigarette for the First Time Before Age 13 Years,
by Sex* and Race/Ethnicity,† 2009
10.7 9.4 11.8 10.3 9.112.6
0
20
40
60
80
100
Total Female Male White Black Hispanic
Perc
ent
National Youth Risk Behavior Survey, 2009
* M > F† H > B

Percentage of High School Students Who Smoked a Whole Cigarette for the First Time Before Age 13 Years, 1991 – 2009*
23.826.9 24.9 24.8 24.7 22.1
18.3 16.0 14.210.7
0
20
40
60
80
100
1991 1993 1995 1997 1999 2001 2003 2005 2007 2009
Perc
ent
* Increased 1991–1993, decreased 1993–2009, p < 0.05.
National Youth Risk Behavior Surveys, 1991–2009

Range and Median Percentage of High School Students Who Smoked a Whole Cigarette for the First Time Before Age 13 Years,
Across 40 States and 20 Cities, 2009
5.9 6.0
19.3
14.012.1
9.5
0
10
20
30
40
50
States Cities
Perc
ent
State and Local Youth Risk Behavior Surveys, 2009

Percentage of High School Students Who Smoked a Whole Cigarette for the First Time Before Age 13 Years, 2009
5.9% - 10.1%
10.2% - 12.0%
12.1% - 13.7%
13.8% - 19.3%
No Data
State Youth Risk Behavior Surveys, 2009

PhiladelphiaSan Francisco
New York City
Percentage of High School Students Who Smoked a Whole Cigarette for the First Time Before Age 13 Years, 2009
6.0% - 8.3%
8.4% - 9.4%
9.5% - 11.6%
11.7% - 14.0%
No Data
Local Youth Risk Behavior Surveys, 2009
Miami-Dade County
Palm Beach County
Broward County
Orange CountyDuval CountyDallas
MemphisCharlotte-
MecklenburgCounty
BostonMilwaukee
DetroitChicago
Clark County
Seattle
San BernardinoLos Angeles
San Diego

Percentage of High School Students Who Drank Alcohol for the First Time Before Age 13 Years,* by Sex† and Race/Ethnicity,‡ 2009
21.118.1
23.718.1
24.9 27.1
0
20
40
60
80
100
Total Female Male White Black Hispanic
Perc
ent
National Youth Risk Behavior Survey, 2009
* Other than a few sips. † M > F‡ B, H > W
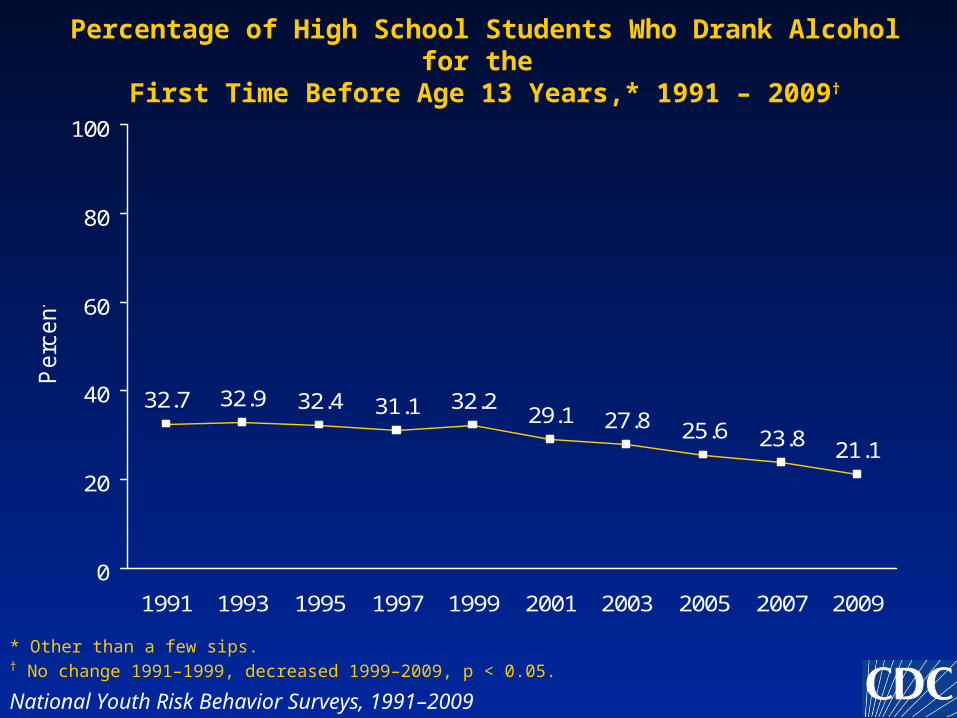
Percentage of High School Students Who Drank Alcohol for the First Time Before Age 13 Years,* 1991 – 2009†
32.7 32.9 32.4 31.1 32.229.1 27.8 25.6 23.8 21.1
0
20
40
60
80
100
1991 1993 1995 1997 1999 2001 2003 2005 2007 2009
Perc
ent
* Other than a few sips. † No change 1991–1999, decreased 1999–2009, p < 0.05.
National Youth Risk Behavior Surveys, 1991–2009

Range and Median Percentage of High School Students Who Drank Alcohol for the First Time Before Age 13 Years,*
Across 42 States and 20 Cities, 2009
11.517.0
29.4 29.2
20.523.9
0
20
40
60
80
100
States Cities
Perc
ent
* Other than a few sips.
State and Local Youth Risk Behavior Surveys, 2009

Percentage of High School Students Who Drank Alcohol for the First Time Before Age 13 Years,* 2009
* Other than a few sips.
11.5% - 18.9%
19.0% - 20.5%
20.6% - 23.5%
23.6% - 29.4%
No Data
State Youth Risk Behavior Surveys, 2009

PhiladelphiaSan Francisco
* Other than a few sips.
New York City
Percentage of High School Students Who Drank Alcohol for the First Time Before Age 13 Years,* 2009
17.0% - 22.0%
22.1% - 23.8%
23.9% - 25.3%
25.4% - 29.2%
No Data
Local Youth Risk Behavior Surveys, 2009
Miami-Dade County
Palm Beach County
Broward County
Orange CountyDuval CountyDallas
MemphisCharlotte-
MecklenburgCounty
BostonMilwaukee
DetroitChicago
Clark County
Seattle
San BernardinoLos Angeles
San Diego

Percentage of High School Students Who Tried Marijuana for the First Time Before Age 13 Years, by Sex* and Race/Ethnicity,† 2009
7.5 5.09.7
5.710.2 10.3
0
20
40
60
80
100
Total Female Male White Black Hispanic
Perc
ent
National Youth Risk Behavior Survey, 2009
* M > F† B, H > W
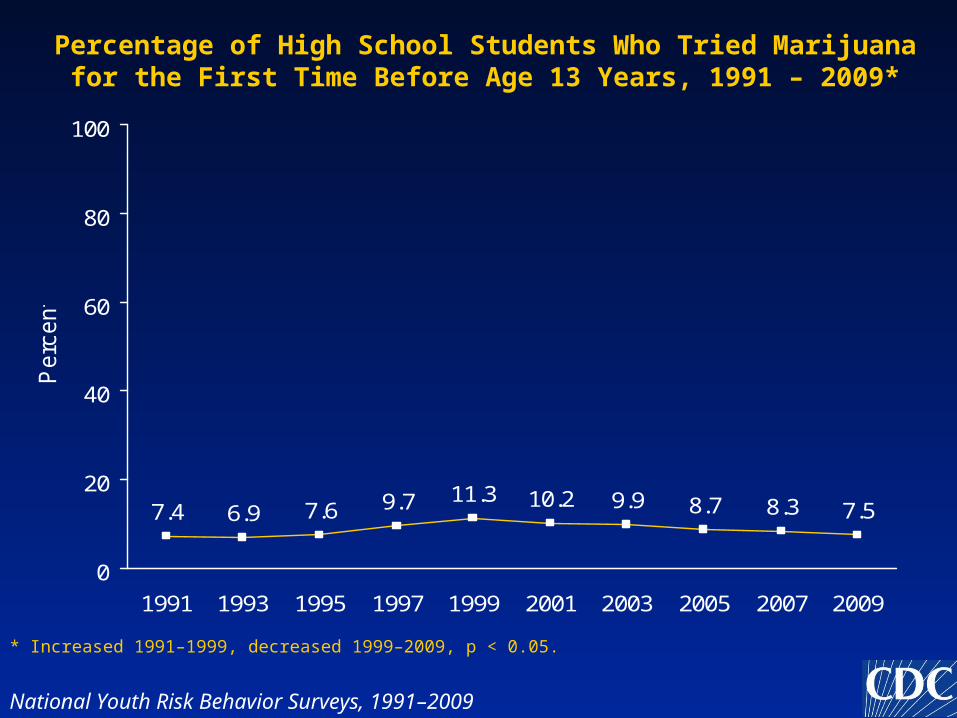
Percentage of High School Students Who Tried Marijuana for the First Time Before Age 13 Years, 1991 – 2009*
7.4 6.9 7.6 9.7 11.3 10.2 9.9 8.7 8.3 7.5
0
20
40
60
80
100
1991 1993 1995 1997 1999 2001 2003 2005 2007 2009
Perc
ent
* Increased 1991–1999, decreased 1999–2009, p < 0.05.
National Youth Risk Behavior Surveys, 1991–2009

Range and Median Percentage of High School Students Who Tried Marijuana for the First Time Before Age 13 Years,
Across 42 States and 20 Cities, 2009
4.16.3
18.415.4
8.3 9.2
0
10
20
30
40
50
States Cities
Perc
ent
State and Local Youth Risk Behavior Surveys, 2009

Percentage of High School Students Who Tried Marijuana for the First Time Before Age 13 Years, 2009
4.1% - 7.2%
7.3% - 8.2%
8.3% - 9.2%
9.3% - 18.4%
No Data
State Youth Risk Behavior Surveys, 2009
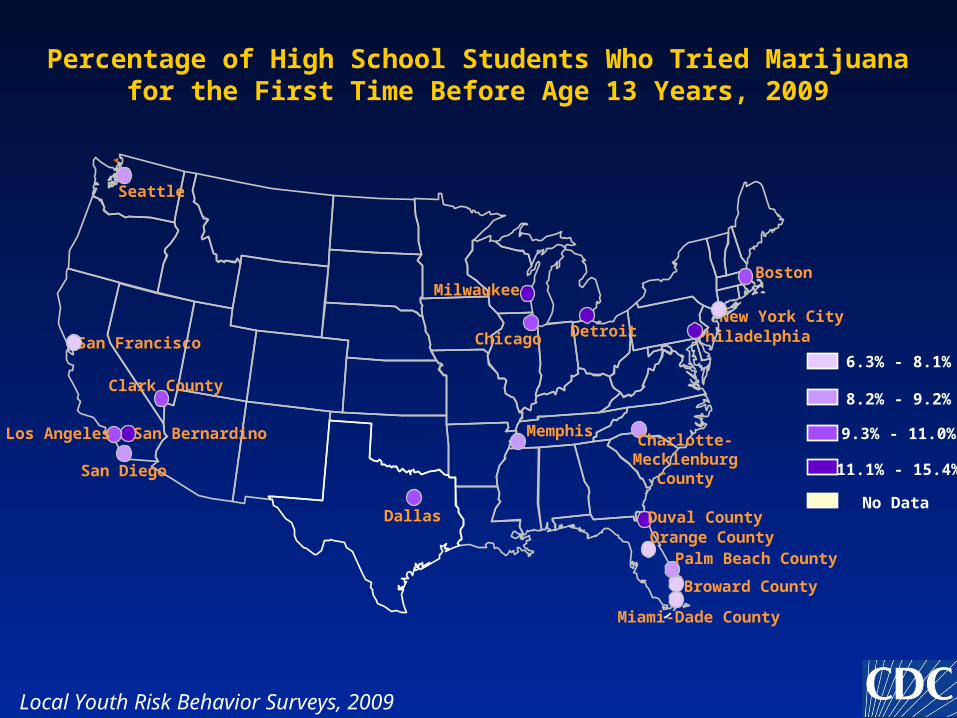
PhiladelphiaSan Francisco
New York City
Percentage of High School Students Who Tried Marijuana for the First Time Before Age 13 Years, 2009
6.3% - 8.1%
8.2% - 9.2%
9.3% - 11.0%
11.1% - 15.4%
No Data
Local Youth Risk Behavior Surveys, 2009
Miami-Dade County
Palm Beach County
Broward County
Orange CountyDuval CountyDallas
MemphisCharlotte-
MecklenburgCounty
BostonMilwaukee
DetroitChicago
Clark County
Seattle
San BernardinoLos Angeles
San Diego

2009 YRBS ResultsTobacco, Alcohol, and Other Drug Use
on School Property

Percentage of High School Students Who Smoked Cigarettes on School Property,* by Sex† and Race/Ethnicity,‡ 2009
5.1 4.0 6.2 5.82.6 4.8
0
20
40
60
80
100
Total Female Male White Black Hispanic
Perc
ent
National Youth Risk Behavior Survey, 2009
* On at least 1 day during the 30 days before the survey.† M > F‡ W, H > B

Percentage of High School Students Who Smoked Cigarettes on School Property,* 1993 – 2009†
13.216.0 14.6 14.0
9.9 8.0 6.8 5.7 5.1
0
20
40
60
80
100
1993 1995 1997 1999 2001 2003 2005 2007 2009
Perc
ent
* On at least 1 day during the 30 days before the survey.† No change 1993–1995, decreased 1995–2009, p < 0.05.
National Youth Risk Behavior Surveys, 1993–2009
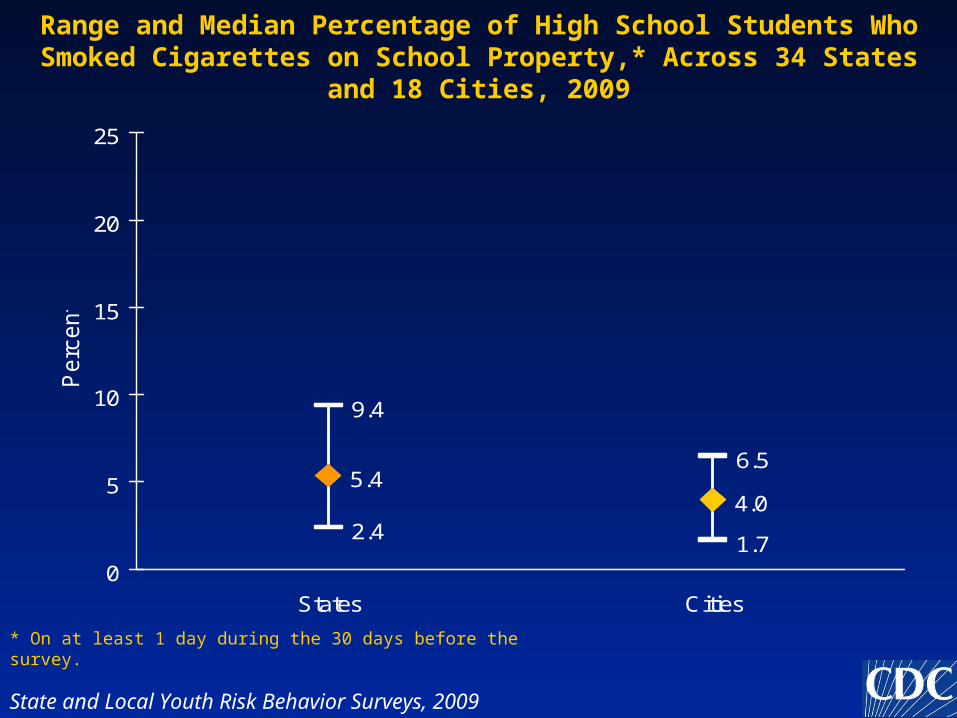
Range and Median Percentage of High School Students Who Smoked Cigarettes on School Property,* Across 34 States and 18 Cities, 2009
2.41.7
9.4
6.55.4
4.0
0
5
10
15
20
25
States Cities
Perc
ent
State and Local Youth Risk Behavior Surveys, 2009
* On at least 1 day during the 30 days before the survey.
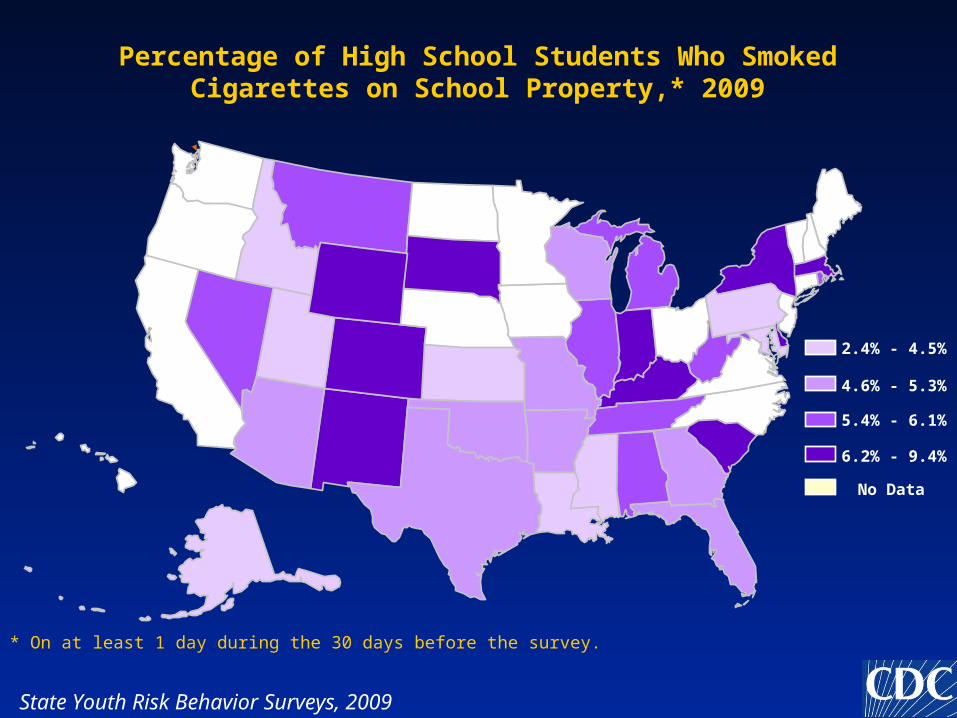
Percentage of High School Students Who Smoked Cigarettes on School Property,* 2009
* On at least 1 day during the 30 days before the survey.
2.4% - 4.5%
4.6% - 5.3%
5.4% - 6.1%
6.2% - 9.4%
No Data
State Youth Risk Behavior Surveys, 2009

PhiladelphiaSan Francisco
* On at least 1 day during the 30 days before the survey.
New York City
Percentage of High School Students Who Smoked Cigarettes on School Property,* 2009
1.7% - 3.0%
3.1% - 4.0%
4.1% - 5.0%
5.1% - 6.5%
No Data
Local Youth Risk Behavior Surveys, 2009
Miami-Dade County
Palm Beach County
Broward County
Orange CountyDuval CountyDallas
MemphisCharlotte-
MecklenburgCounty
BostonMilwaukee
DetroitChicago
Clark County
Seattle
San BernardinoLos Angeles
San Diego
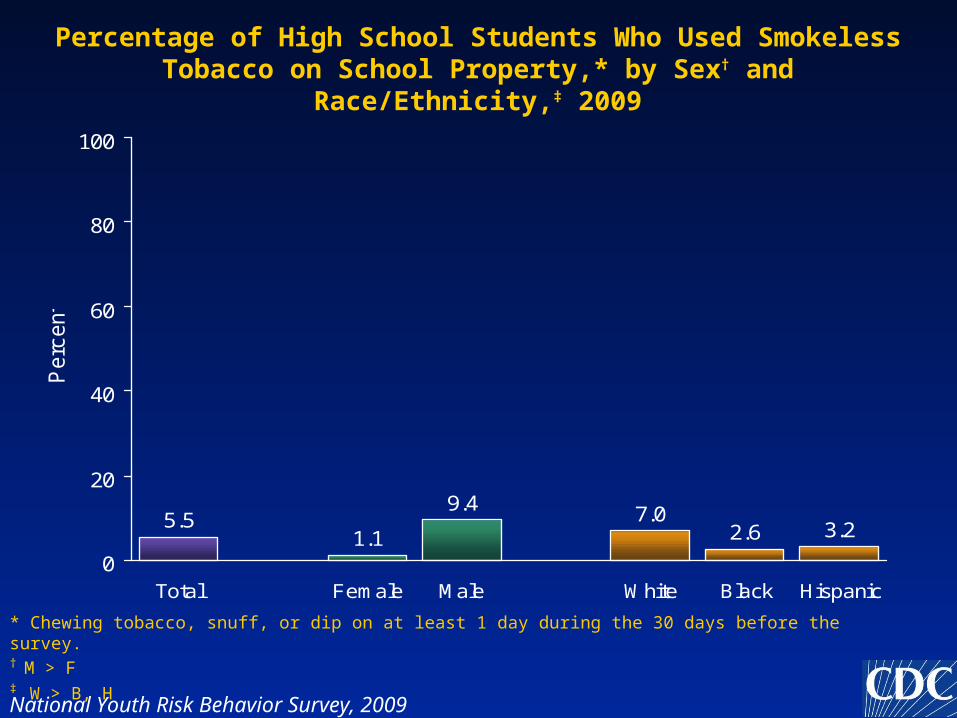
Percentage of High School Students Who Used Smokeless Tobacco on School Property,* by Sex† and Race/Ethnicity,‡ 2009
5.51.1
9.4 7.02.6 3.2
0
20
40
60
80
100
Total Female Male White Black Hispanic
Perc
ent
National Youth Risk Behavior Survey, 2009
* Chewing tobacco, snuff, or dip on at least 1 day during the 30 days before the survey.† M > F‡ W > B, H

Percentage of High School Students Who Used Smokeless Tobacco on School Property,* 1995 – 2009†
6.3 5.1 4.2 5.0 5.9 5.0 4.9 5.5
0
20
40
60
80
100
1995 1997 1999 2001 2003 2005 2007 2009
Perc
ent
* Chewing tobacco, snuff, or dip on at least 1 day during the 30 days before the survey.† No change 1995–2009, p < 0.05.
National Youth Risk Behavior Surveys, 1995–2009

Range and Median Percentage of High School Students Who Used Smokeless Tobacco on School Property,* Across 27 States and 15
Cities, 2009
2.8
1.0
10.3
4.1
5.5
2.2
0
5
10
15
20
States Cities
Perc
ent
State and Local Youth Risk Behavior Surveys, 2009
* Chewing tobacco, snuff, or dip on at least 1 day during the 30 days before the survey.

Percentage of High School Students Who Used Smokeless Tobacco on School Property,* 2009
* Used chewing tobacco, snuff, or dip on at least 1 day during the 30 days before the survey.
2.8% - 3.9%
4.0% - 5.4%
5.5% - 7.4%
7.5% - 10.3%
No Data
State Youth Risk Behavior Surveys, 2009

PhiladelphiaSan Francisco
* Used chewing tobacco, snuff, or dip on at least 1 day during the 30 days before the survey.
New York City
Percentage of High School Students Who Used Smokeless Tobacco on School Property,* 2009
1.0% - 1.6%
1.7% - 2.1%
2.2% - 2.6%
2.7% - 4.1%
No Data
Local Youth Risk Behavior Surveys, 2009
Miami-Dade County
Palm Beach County
Broward County
Orange CountyDuval CountyDallas
MemphisCharlotte-
MecklenburgCounty
BostonMilwaukee
DetroitChicago
Clark County
Seattle
San BernardinoLos Angeles
San Diego
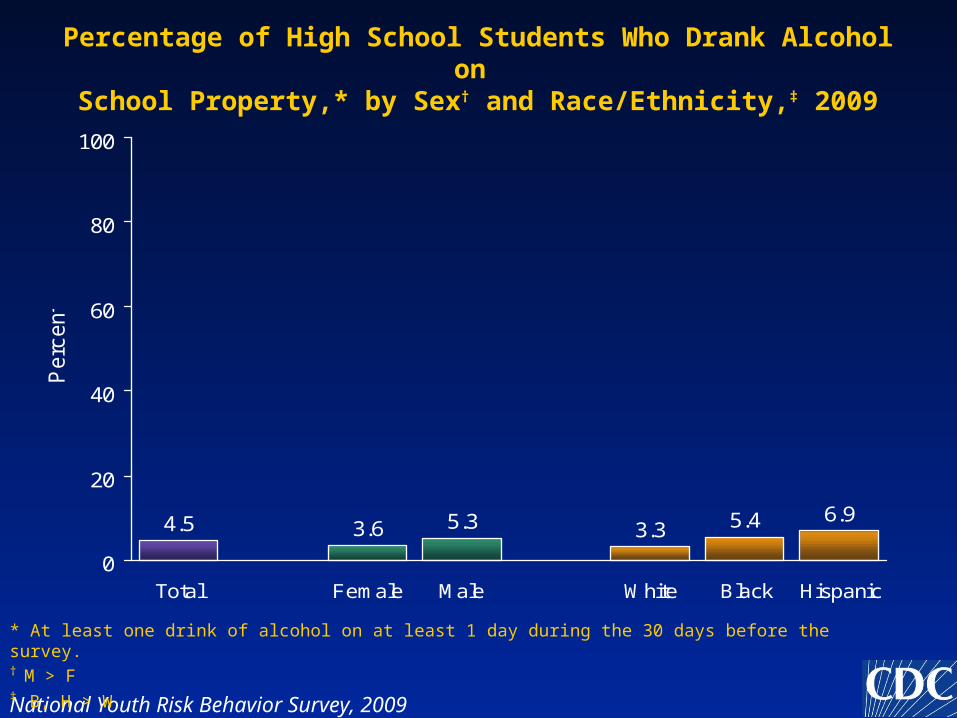
Percentage of High School Students Who Drank Alcohol on School Property,* by Sex† and Race/Ethnicity,‡ 2009
4.5 3.6 5.3 3.3 5.4 6.9
0
20
40
60
80
100
Total Female Male White Black Hispanic
Perc
ent
National Youth Risk Behavior Survey, 2009
* At least one drink of alcohol on at least 1 day during the 30 days before the survey.† M > F‡ B, H > W

Percentage of High School Students Who Drank Alcohol on School Property,* 1993 – 2009†
5.2 6.3 5.6 4.9 4.9 5.2 4.3 4.1 4.5
0
20
40
60
80
100
1993 1995 1997 1999 2001 2003 2005 2007 2009
Perc
ent
* At least one drink of alcohol on at least 1 day during the 30 days before the survey.† Decreased 1993–2009, p < 0.05.
National Youth Risk Behavior Surveys, 1993–2009
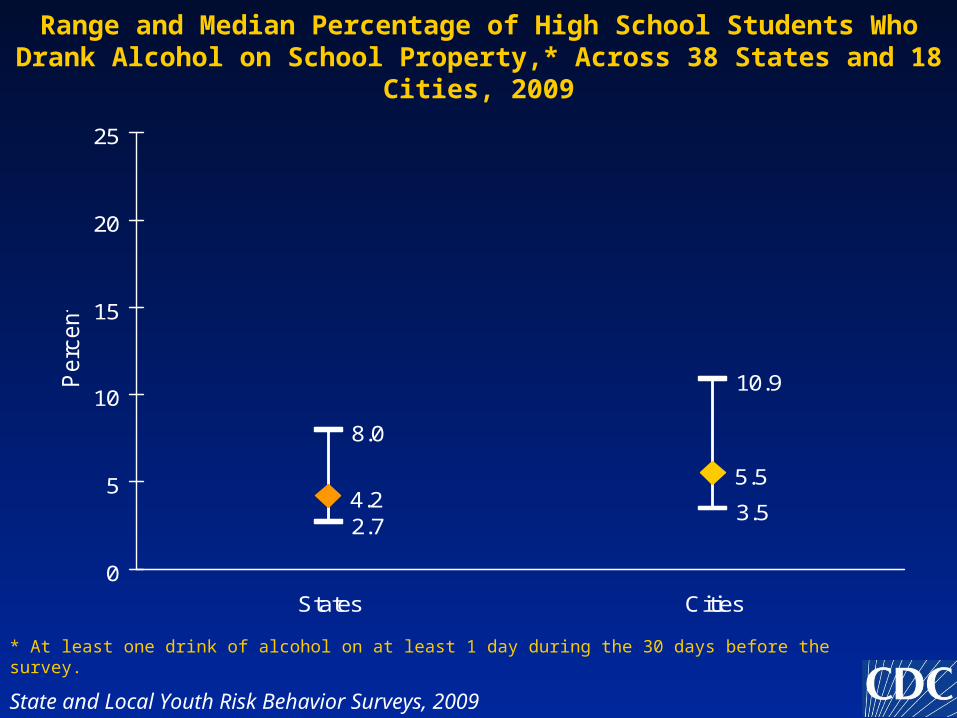
Range and Median Percentage of High School Students Who Drank Alcohol on School Property,* Across 38 States and 18 Cities, 2009
2.73.5
8.0
10.9
4.25.5
0
5
10
15
20
25
States Cities
Perc
ent
* At least one drink of alcohol on at least 1 day during the 30 days before the survey.
State and Local Youth Risk Behavior Surveys, 2009

Percentage of High School Students Who Drank Alcohol on School Property,* 2009
* At least one drink of alcohol on at least 1 day during the 30 days before the survey.
2.7% - 3.4%
3.5% - 4.2%
4.3% - 5.0%
5.1% - 8.0%
No Data
State Youth Risk Behavior Surveys, 2009
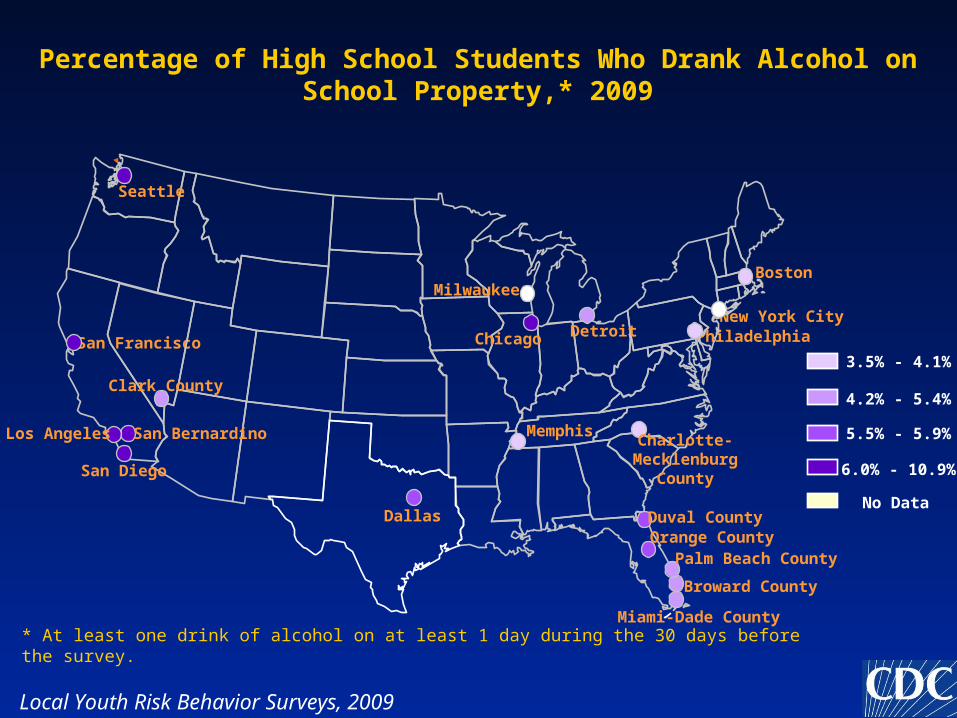
PhiladelphiaSan Francisco
* At least one drink of alcohol on at least 1 day during the 30 days before the survey.
New York City
Percentage of High School Students Who Drank Alcohol on School Property,* 2009
3.5% - 4.1%
4.2% - 5.4%
5.5% - 5.9%
6.0% - 10.9%
No Data
Local Youth Risk Behavior Surveys, 2009
Miami-Dade County
Palm Beach County
Broward County
Orange CountyDuval CountyDallas
MemphisCharlotte-
MecklenburgCounty
BostonMilwaukee
DetroitChicago
Clark County
Seattle
San BernardinoLos Angeles
San Diego

Percentage of High School Students Who Used Marijuana on School Property,* by Sex† and Race/Ethnicity,‡ 2009
4.6 2.86.3 3.8 5.6 6.5
0
20
40
60
80
100
Total Female Male White Black Hispanic
Perc
ent
National Youth Risk Behavior Survey, 2009
* One or more times during the 30 days before the survey.† M > F‡ B, H > W

Percentage of High School Students Who Used Marijuana on School Property,* 1993 – 2009†
5.68.8 7.0 7.2 5.4 5.8 4.5 4.5 4.6
0
20
40
60
80
100
1993 1995 1997 1999 2001 2003 2005 2007 2009
Perc
ent
* One or more times during the 30 days before the survey.† Increased 1993–1995, decreased 1995–2009, p < 0.05.
National Youth Risk Behavior Surveys, 1993–2009

Range and Median Percentage of High School Students Who Used Marijuana on School Property,* Across 38 States and 18 Cities, 2009
2.5
4.4
9.710.8
4.6
6.5
0
5
10
15
20
25
States Cities
Perc
ent
* One or more times during the 30 days before the survey.
State and Local Youth Risk Behavior Surveys, 2009

Percentage of High School Students Who Used Marijuana on School Property,* 2009
* One or more times during the 30 days before the survey.
2.5% - 3.4%
3.5% - 4.5%
4.6% - 5.7%
5.8% - 9.7%
No Data
State Youth Risk Behavior Surveys, 2009

PhiladelphiaSan Francisco
* One or more times during the 30 days before the survey.
New York City
Percentage of High School Students Who Used Marijuana on School Property,* 2009
4.4% - 5.4%
5.5% - 6.4%
6.5% - 6.8%
6.9% - 10.8%
No Data
Local Youth Risk Behavior Surveys, 2009
Miami-Dade County
Palm Beach County
Broward County
Orange CountyDuval CountyDallas
MemphisCharlotte-
MecklenburgCounty
BostonMilwaukee
DetroitChicago
Clark County
Seattle
San BernardinoLos Angeles
San Diego

Percentage of High School Students Who Were Offered, Sold, or Given an Illegal Drug by Someone on School Property,*
by Sex† and Race/Ethnicity,‡ 2009
22.719.3
25.919.8 22.2
31.2
0
20
40
60
80
100
Total Female Male White Black Hispanic
Perc
ent
National Youth Risk Behavior Survey, 2009
* During the 12 months before the survey.† M > F‡ H > W, B

Percentage of High School Students Who Were Offered, Sold, or Given an Illegal Drug by Someone on School Property,* 1993 – 2009†
24.0
32.1 31.7 30.2 28.5 28.725.4
22.3 22.7
0
20
40
60
80
100
1993 1995 1997 1999 2001 2003 2005 2007 2009
Perc
ent
* During the 12 months before the survey.† Increased 1993–1995, decreased 1995–2009, p < 0.05.
National Youth Risk Behavior Surveys, 1993–2009
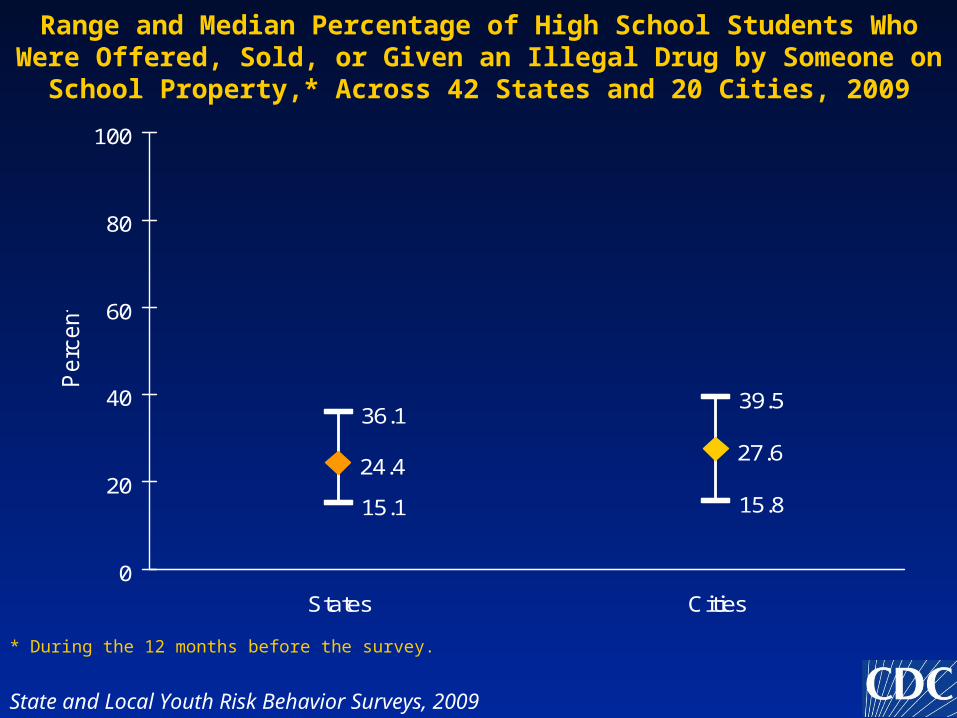
Range and Median Percentage of High School Students Who Were Offered, Sold, or Given an Illegal Drug by Someone on School Property,*
Across 42 States and 20 Cities, 2009
15.1 15.8
36.139.5
24.427.6
0
20
40
60
80
100
States Cities
Perc
ent
* During the 12 months before the survey.
State and Local Youth Risk Behavior Surveys, 2009

Percentage of High School Students Who Were Offered, Sold, or Given an Illegal Drug by Someone on School Property,* 2009
* During the 12 months before the survey.
15.1% - 20.6%
20.7% - 24.3%
24.4% - 28.8%
28.9% - 36.1%
No Data
State Youth Risk Behavior Surveys, 2009

PhiladelphiaSan Francisco
* During the 12 months before the survey.
New York City
Percentage of High School Students Who Were Offered, Sold, or Given an Illegal Drug by Someone on School Property,* 2009
15.8% - 23.2%
23.3% - 27.6%
27.7% - 35.4%
35.5% - 39.5%
No Data
Local Youth Risk Behavior Surveys, 2009
Miami-Dade County
Palm Beach County
Broward County
Orange CountyDuval CountyDallas
MemphisCharlotte-
MecklenburgCounty
BostonMilwaukee
DetroitChicago
Clark County
Seattle
San BernardinoLos Angeles
San Diego