the ymca’s contribution to well-being in the gta
TRANSCRIPT

The YMCA’s Contribution to Well-Being in the GTA

2
The YMCA’s Contribution to Well-Being in the GTA
Michael H. Hall1
Heather Alinsangan
Sarah Earl
Gobi Sriranganathan
Cheyne Singh
Heather Krause
Sathya Amirthavasagam
© 2018, YMCA of Greater Toronto
This work is licensed under the Creative Commons Attribution-NonCommercial-NoDerivatives 4.0 International License. To view a copy of this license, visit http://creativecommons.org/licenses/by-nc-nd/4.0/ or send a letter to Creative Commons, PO Box 1866, Mountain View, CA 94042, USA.
ISBN 978-0-9694789-7-3
1All authors are affiliated with the YMCA of Greater Toronto with the exception of Heather Krause who is affiliated with Datassist.

3
AcknowledgementsThis publication is the result of the combined efforts of many individuals. We would like to thank Laura Barcena, Nora Gorman, Todd Harrison, and Chris Meyer at the YMCA of Greater Toronto. Thanks also to Blend Creative Studio Inc., who provided graphic design, and Emma Doran, who provided editorial support. We would like to acknowledge Forum Research for the role it played in the collection of the survey data.
Finally, we are grateful to the 8,270 residents of the Greater Toronto Area (GTA) and the 12,332 YMCA members and clients, who so generously contributed their time to participate in our study.

4

5
Table of Contents
Executive Summary ..................................................................................................................................................................................... 6
Introduction .................................................................................................................................................................................................... 7
The YMCA in the GTA ..........................................................................................................................................................................8
Impact Measurement and Evaluation at the YMCA .............................................................................................................. 10
Why Focus on Well-Being? ..............................................................................................................................................................11
Overall Research Approach: Data Sources and Measures ................................................................................................... 12
The Impact of the YMCA of Greater Toronto on Individual Well-Being ...........................................................................15
Methodology ...................................................................................................................................................................................... 18
Results .................................................................................................................................................................................................... 19
The YMCA of Greater Toronto’s Contribution to Neighbourhood Well-Being .............................................................20
Methodology ...................................................................................................................................................................................... 20
Results .................................................................................................................................................................................................... 21
Conclusion ......................................................................................................................................................................................................22

6
Executive Summary
The YMCA of Greater Toronto provides an array of programs and services to help promote well-being in the GTA. In this report, we evaluate the contribution that the YMCA of Greater Toronto makes to both individual well-being and the well-being of the neighbourhoods it serves. In particular, we set out to understand whether people who use YMCA services and programs (Y members) have greater well-being than non-members, and if the presence of YMCA services within a neighbourhood contributes to the well-being of all of its residents, regardless of whether or not they are Y members.
We rely on data from two surveys for our analysis:
• a telephone survey of 8,270 residents in the Greater Toronto Area, ages 16 and older
• an online survey of 12,332 YMCA members, ages 16 and older
Propensity score analyses were conducted to assess the contribution that YMCA programs and services make to the well-being of YMCA members and clients, while multi-level hierarchical statistical models were employed to assess the contributon of YMCA services to the well-being of the neighbourhoods in which they are located. These analyses show that use of YMCA programs and services is connected to better outcomes in terms of well-being, health, and sense of belonging. Moreover, the presence of YMCA centres within a neighbourhood is associated with better outcomes for all residents, not just for those who directly use the YMCA’s services and facilities. These findings support the YMCA’s current strategy of bringing more YMCA programs to more people in the GTA as the region continues to grow.

7
Introduction
The YMCA of Greater Toronto has a history of more than 160 years of service to communities in the GTA. With the launch of our Strong Start, Great Future strategic plan in 2010, we began the process of bringing more Y programs to more people and launched a capital expansion program to bring new YMCA Centres of Community to the GTA.
At the same time, we began to build our capacity to demonstrate, measure and improve the impact we have on people’s well-being. This report presents the results of a benchmark evaluation that assesses the contribution that the YMCA makes to the well-being of those who are direct beneficiaries of our programs and services, and to the well-being of the neighbourhoods in which we are located.
This report highlights research that addresses two fundamental questions:1
• Do people who use YMCA programs and services in the GTA (Y members) have greater well-being and health than those who do not?
• Does the presence of YMCA services within a neighbourhood contribute to the well-being of its residents more generally?
Before presenting our findings, we first provide an overview of the YMCA’s programs and services and their locations across the GTA and briefly outline the YMCA’s approach to impact measurement and evaluation. We then discuss the value of assessing the YMCA’s contribution through the lens of well-being.
1 Details about the statistical analyses that provide the basis for the discussion that follows are provided in an accompanying technical report available at: www.ymcagta.org/ymcacontributions

8
The YMCA in the GTA
The YMCA of Greater Toronto serves the population of the GTA with 440 locations that provide a variety of services to promote well-being (see Figure 1 for locations and numbers of people served).2 These include services for:
• Children – to learn and grow in our Child Care and Camp programs
• Children, teens, families and adults – to improve their health at our Health & Fitness centres
• Youth – to find safe housing and engage in a wide range of leadership opportunities
• Job seekers – to find support at our Employment Centres
• Newcomers to Canada – to make vital connections through our Immigrant Services
2 The YMCA of Greater Toronto serves all of the GTA except Oakville and Burlington.

9
Figu
re 1
: YM
CA o
f Gre
ater
Tor
onto
Pro
gram
s &
Loc
atio
ns: 2
017/
18
440
loca
tion
s ac
ross
the
Gre
ater
Tor
onto
Are
a
Clar
ingt
on
Dur
ham
Reg
ion
Osh
awa
Port
Per
ry
Whi
tby
Aja
x
Pick
erin
g
Scar
boro
ugh
Mar
kham
New
mar
ket
Aur
ora
Rich
mon
d H
ill
Vaug
han To
ront
oTo
ront
o Re
gion
Peel
Reg
ion
Mis
siss
auga
Hal
ton
Regi
on
Milt
on
Hal
ton
Hill
s
Geo
rget
own
Bram
pton
Cale
don
Ora
ngev
ille
Shel
burn
e
Duff
erin
g Re
gion
York
Reg
ion
582,
256
com
mun
ity
conn
ecti
ons
• 58,
698
Cam
ping
& O
utdo
or E
duca
tion
• 148
,682
Chi
ld C
are
& F
amily
Ser
vice
s• 1
,897
Edu
catio
n an
d Tr
aini
ng
• 3
1,37
5 Em
ploy
men
t Ser
vice
s• 1
55,7
74 H
ealth
& F
itnes
s
• 1
7,65
3 G
loba
l Ini
tiativ
es• 7
0,97
6 Im
mig
rant
Ser
vice
s
• 88,
771
Yout
h Se
rvic
es• 1
,391
You
th L
eade
rshi
p
• 7
,039
Tee
n N
ight
™ M
embe
rs
Child
Car
e
Cam
ps &
Out
door
Edu
catio
n
Hea
lth &
Fitn
ess
Educ
atio
n &
Em
ploy
men
t
Com
mun
ity
Initi
ativ
es
Yout
h Le
ader
ship
YMCA
Cam
p Pi
necr
est
Clea
r Lak
e M
usko
ka
Nor
th
10
Impact Measurement and Evaluation at the YMCAThe YMCA of Greater Toronto has developed a systematic approach to measuring its social impact that focuses both on understanding our impact and learning how to improve it. Using a broad lens of organizational effectiveness, we are gathering evidence about the impact of the Y at multiple levels (e.g., individual programs, centres, neighbourhoods). Our overall strategy for assessing performance at each level is to establish initial benchmarks and then monitor changes over time to identify opportunities for improvement. Below is a brief summary of some of our current key initiatives.
The Impact of Specific YMCA Programs. We are building our capacity to measure and improve our impact at the individual program level for our key youth programs (e.g., Youth Leadership, Camp, Employment, Sports and The Academy [alternative high school]). In 2018, these programs will reach approximately 14,000 GTA youth.
These program evaluations focus on answering key questions about who participates, how well programs are delivered, and what impacts are achieved. Our approach is rooted in YMCA values that, among other things, emphasize the value of participatory approaches involving program participants, volunteers and staff in our processes. Whenever possible, we employ program outcome measures that have established linkages to long-term impacts on well-being.
We are building a growing body of evidence that indicates that our youth programs support a variety of positive changes, including:
• Improved health: greater life satisfaction, less life stress, stronger social ties
• Increased leadership skills: better teamwork, communication, decision making, conflict resolution, and problem solving
• Development of healthy habits: levels of physical activity, positive changes in practicing safe sex, drug/alcohol use, and responsible gambling
• Greater community service: increased levels of volunteering
The YMCA’s Contribution to Members. As highlighted in this report, we employ surveys of the GTA public and YMCA members to better understand who is thriving and who is not. These surveys allow us to assess community needs for YMCA services and the overall effectiveness of the Y’s efforts to improve the well-being of its members and clients.
The YMCA’s Contribution to Neighbourhoods.We are also gathering evidence to assess whether Y services contribute to the well-being of the neighbourhoods we serve, including those residents who are not direct beneficiaries of the Y’s programs and services. In addition to research presented here, we are also conducting pre and post studies into the well-being of neighbourhoods where we are building new YMCA Centres of Community.
The YMCA of Greater Toronto – Wellesley Institute Well-Being Monitor. The final element of our evaluation strategy involves the deployment of an ongoing monitoring tool that incorporates 41 indicators to assess well-being across the GTA and identify trends at a neighbourhood level. The GTA Well-Being Monitor provided the basis for our recent report Life in the GTA: A Window on Well-Being which highlights the disparities in well-being among groups that often face social and economic exclusion (e.g., low income populations, the unemployed, racialized groups).3 It also provides important context for the planning of YMCA services.
3 Hall et al. (2018). Life in the GTA: A window on well-being. Toronto: YMCA of Greater Toronto
11
Why Focus on Well-Being?
Historically, the YMCA – with its recognizable Y triangle representing a healthy body, mind and spirit – has held a holistic view of health. Today, this holistic view embraces much of what has come to be described as “well-being.”
In simple terms, well-being can be described as “judging life positively and feeling good.”4 5 However, well-being depends not only on one’s personal circumstances but also on how one compares their circumstances to others. The World Health Organization considers well-being to be a function of an individual’s experience of their life (e.g., perceived health, psychological functioning, affective states) as well as their own comparison of their life circumstances (e.g., health, education, work, social relationships) with current social norms and values.6
There is a growing body of evidence about the importance of well-being.7 8 9 Research shows that higher levels of well-being are associated with:
• greater longevity — a high sense of well-being is estimated to add four to ten years to life compared to having low well-being
• decreased risk of disease, illness and injury
• better immune functioning and speedier recovery
• improved likelihood of contributing to communities such as volunteering and civic engagement
• improved future incomes and greater productivity at work
There is also evidence that having a low level of well-being is an issue that deserves greater attention in the GTA. Research conducted by the YMCA of Greater Toronto and the Wellesley Institute shows that the 20% of GTA neighbourhoods with the largest concentrations of people who report low levels of well-being have more than their fair share of challenges.10 For example, in these “low well-being” neighbourhoods, people lead shorter lives and more children are classified as being “at risk” of poor life outcomes.
4 Diener, E., Suh, E. M., & Oishi, S. (1997). Recent findings on subjective well-being. Indian journal of clinical psychology, 24, 25-41.5 Veenhoven R. Sociological theories of subjective well-being. In: M. Eid , R. J. Larsen (eds). The science of subjective well-being. New York: Guilford Press; 2008:44–61.6 Wismar, M., McKee, M., Ernst, K., Srivastava, D., Busse, R., & World Health Organization. (2013). Measurement of and target-setting for well-being: an initiative by the WHO Regional Office for Europe. Retreived from: http://www.euro.who.int/__data/assets/pdf_file/0008/98396/E91867.pdf7 This list is adapted from the Centre for Disease Control and Prevention (2016). Well-being concepts. Retrieved from https://www.cdc.gov/hrqol/wellbeing.htm8 De Never, J., Diener, E., Tay, Ll, Xuereb, C. (2013). The Objective Benefits of Subjective Well-Being. In J. Helliwell, R. Layard, J. Sachs (eds). World Happiness Report 2013. New York: UN Sustainable Development Solutions Network. Retrieved from: http://eureka.sbs.ox.ac.uk/5466/1/SSRN-id2306651.pdf9 Diener, E., and Chan, M.Y. (2011). Happy People Live Longer: Subjective Well-Being Contributes to Health and Longevity. Applied Psychology: Health And Well-Being, 2011, 3 (1), 1–43. Retrieved from: http://labs.psychology.illinois.edu/~ediener/Documents/Diener-Chan_2011.pdf10 Hall et al. (2018). Life in the GTA: A window on well-being. Toronto: YMCA of Greater Toronto
12
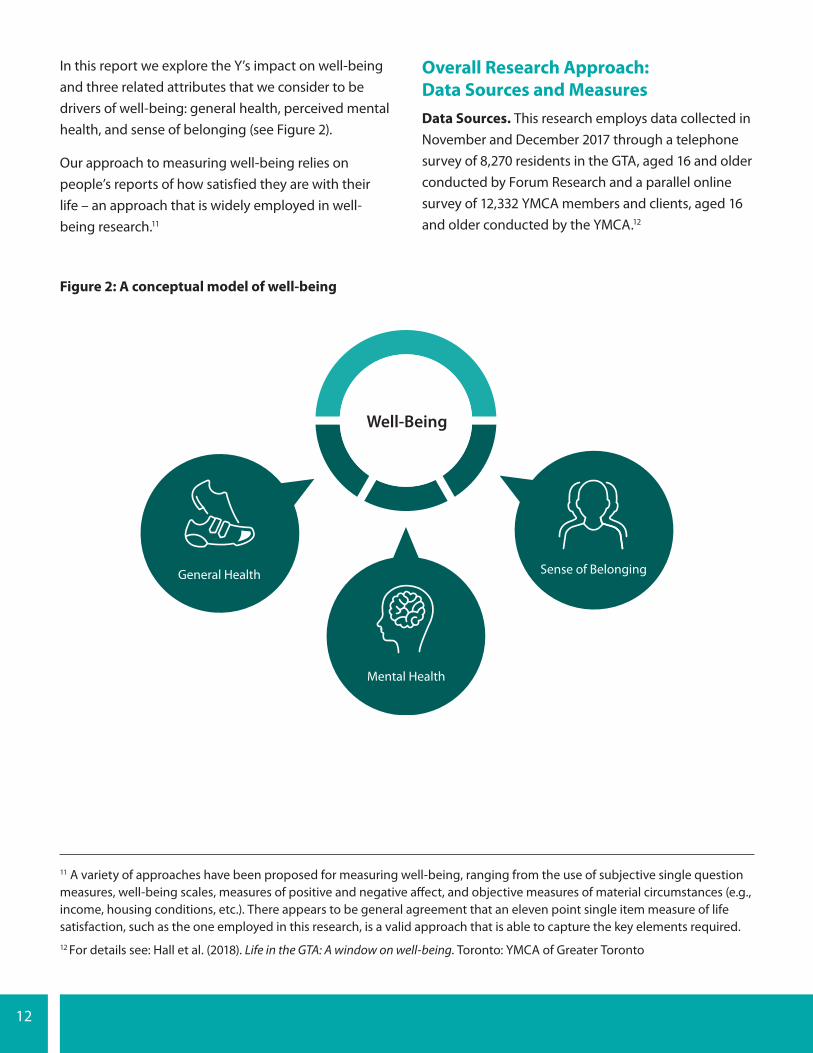
In this report we explore the Y’s impact on well-being and three related attributes that we consider to be drivers of well-being: general health, perceived mental health, and sense of belonging (see Figure 2).
Our approach to measuring well-being relies on people’s reports of how satisfied they are with their life – an approach that is widely employed in well-being research.11
Overall Research Approach: Data Sources and MeasuresData Sources. This research employs data collected in November and December 2017 through a telephone survey of 8,270 residents in the GTA, aged 16 and older conducted by Forum Research and a parallel online survey of 12,332 YMCA members and clients, aged 16 and older conducted by the YMCA.12
Figure 2: A conceptual model of well-being
Well-Being
General Health
Mental Health
Sense of Belonging
11 A variety of approaches have been proposed for measuring well-being, ranging from the use of subjective single question measures, well-being scales, measures of positive and negative affect, and objective measures of material circumstances (e.g., income, housing conditions, etc.). There appears to be general agreement that an eleven point single item measure of life satisfaction, such as the one employed in this research, is a valid approach that is able to capture the key elements required. 12 For details see: Hall et al. (2018). Life in the GTA: A window on well-being. Toronto: YMCA of Greater Toronto

13
We consider well-being (as measured by life satisfaction) to be largely influenced by a person’s general and mental health, and their sense of belonging to their local community.
Measures of Well-Being, Health and Belonging. The survey asked respondents to report on their life satisfaction (well-being), general health, mental health, and sense of belonging.13 It also collected information about respondents’ social and economic characteristics (e.g., age, gender, ethnicity, household income).
As noted earlier, we use people’s reports of how satisfied they are with their life as our measure of well-being. For analysis purposes, we have categorized participants into either a high life satisfaction or a low life satisfaction category based on their responses:
• The high life satisfaction group consists of the 66% of survey respondents who rated their life satisfaction at a level 8 or more
• The low life satisfaction group is comprised of the 34% of participants who rated their life satisfaction at a level of 7 or below
We created similar categorizations for our other outcome variables:
• The high general health category includes the 52% of participants who reported that their general health was “excellent” or “very good.”
• The low general health category includes the 48% of respondents who reported that their general health was “good”, “fair,” or “poor.”
• The high mental health category includes the 64% of participants who reported that their mental health was “excellent” or “very good.”
• The low mental health category includes the 35% who reported that their mental health was “good”, “fair,” or “poor.”
• The high belonging category includes the 72% of participants who reported that their sense of belonging was “very strong” or “somewhat strong.”
• The low belonging category includes the 28% of participants who reported that their sense of belonging was “somewhat weak” or “very weak”
Next, we discuss our findings about the contribution that the YMCA has on the well-being of it members. We then turn our attention to the contribution the Y makes to the health of all the residents of the neighbourhoods it serves.
13 The following questions were used:
• Well-being was measured by responses to the following question: “Using a scale of 0 to 10, where 0 means very dissatisfied and 10 means very satisfied, how do you feel about your life as a whole right now?”
• General Health was measured by responses to the following question: “In general, would you say your health is excellent, very good, good, fair, or poor?”
• Mental Health was measured by responses to the question: “In general, would you say that your mental health is: excellent, very good, good, fair, or poor?”
• Sense of Belonging was measured by responses to the question: “How would you describe your sense of belonging to your local community? Very strong, somewhat strong, somewhat weak, or very weak?”

14

15
The Impact of the YMCA of Greater Toronto on Individual Well-Being
Our program evaluations provide evidence that individual YMCA programs support the types of short-term outcomes among participants that are related to their long-term well-being. However, they do not directly compare the well-being of Y members to the well-being of non-Y members, which makes it difficult to attribute changes in well-being to their YMCA program participation.14
In this section of the report, we draw on data that directly compares Y members to non-Y members to answer the question, “Do Y members (GTA residents who use YMCA programs and services) have better well-being than those who are not Y members?”
Table 1 shows that, in the GTA, Y members are more likely than non-members to report high life
satisfaction, general health and mental health. They are slightly lower than non-members in their sense of belonging.
However, it is important to recognize that Y members also differ on individual characteristics such as education, job status and ethnicity (see Table 2), which could explain why they demonstrate better health and well-being.15
In order to assess the extent to which better well-being is due to the use of YMCA programs and services, we employed propensity score matching, a statistical analysis that controls for potential confounding differences in characteristics between Y members and others.16
Table 1: Percentage of YMCA members and non-members in high well-being, health and social ties categories
High Life
SatisfactionHigh General
HealthHigh Mental
HealthHigh
Belonging
YMCA Members 72% 54% 71% 73%
Non-Members 62% 52% 62% 75%
14 While Y members may show positive changes in our programs, it is possible that such changes could have occurred despite their program participation or because the types of people who join the Y are more likely than others to benefit from our programs.15 Previous research shows that well-being and other health/social outcomes have a strong relationship with these types of individual characteristics. For example, higher levels of life satisfaction are associated with higher levels of income, job status and ethnicity (see, for example, Hall et al. (2018). Life in the GTA: A window on well-being. Toronto: YMCA of Greater Toronto).16 Details about the statistical analyses that were employed are available in a technical report that is available at: www.ymcagta.org/ymcacontributions
16
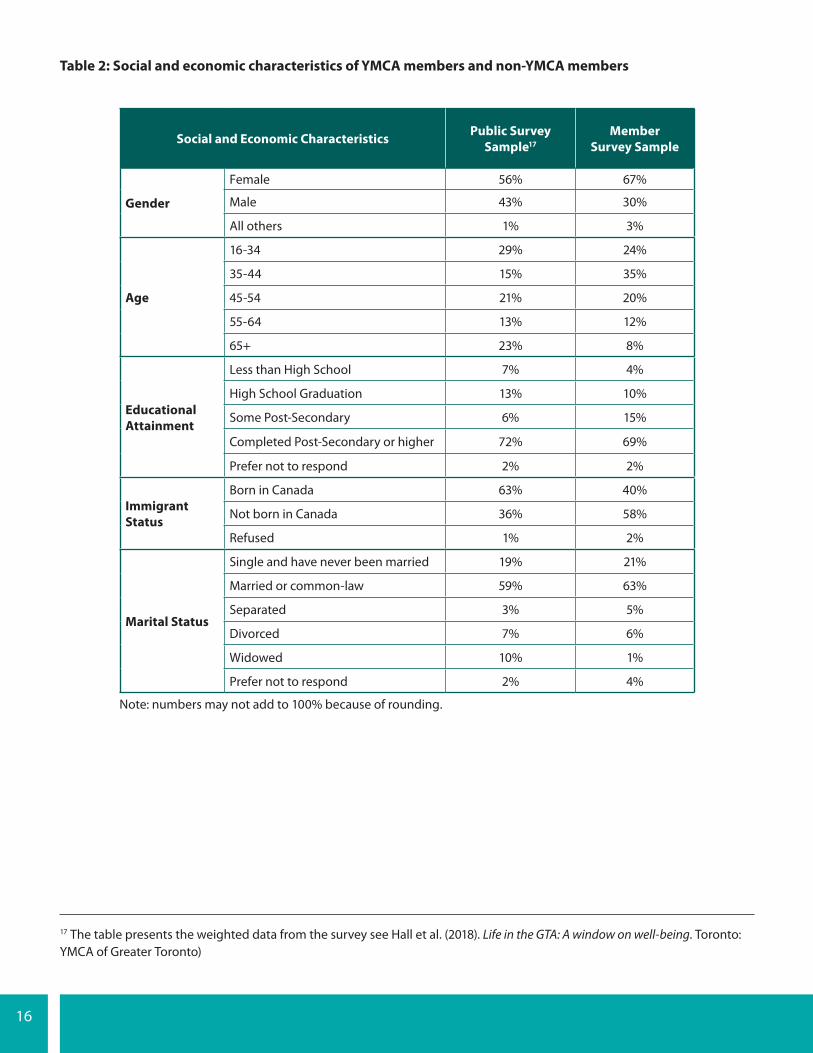
Table 2: Social and economic characteristics of YMCA members and non-YMCA members
Social and Economic Characteristics Public Survey Sample17
Member Survey Sample
Gender
Female 56% 67%
Male 43% 30%
All others 1% 3%
Age
16-34 29% 24%
35-44 15% 35%
45-54 21% 20%
55-64 13% 12%
65+ 23% 8%
Educational Attainment
Less than High School 7% 4%
High School Graduation 13% 10%
Some Post-Secondary 6% 15%
Completed Post-Secondary or higher 72% 69%
Prefer not to respond 2% 2%
Immigrant Status
Born in Canada 63% 40%
Not born in Canada 36% 58%
Refused 1% 2%
Marital Status
Single and have never been married 19% 21%
Married or common-law 59% 63%
Separated 3% 5%
Divorced 7% 6%
Widowed 10% 1%
Prefer not to respond 2% 4%
Note: numbers may not add to 100% because of rounding.
17 The table presents the weighted data from the survey see Hall et al. (2018). Life in the GTA: A window on well-being. Toronto: YMCA of Greater Toronto)

17
Table 2 (Continued): Social and economic characteristics of YMCA members and non-YMCA members
Social and Economic Characteristics Public Survey Sample
Member Survey Sample
Ethnicity
Western European 46% 39%
North American (not Indigenous) 18% 16%
South Asian 7% 9%
East Asian 6% 9%
Eastern European 5% 7%
Black 5% 7%
West Asian 3% 8%
Latin American 2% 1%
Indigenous 1% 1%
All others 7% 2%
Employment Status
Self-employed 11% 9%
Employed full-time 30% 44%
Employed part-time 7% 11%
Currently unemployed 6% 13%
Retired 39% 8%
Homemaker 3% 3%
Student 2% 6%
Prefer not to respond 2% 4%
Sexual Orientation
Heterosexual 85% 63%
Gay 2% 3%
Bisexual 2% 6%
Lesbian 0.03% 1%
Queer 0.01% 1%
Two-Spirit 0.01% 0.1%
All others 1% 4%
Prefer not to respond 7% 21%
Don’t know 3% 3%
Note: numbers may not add to 100% because of rounding.

18
MethodologyWe assessed the contribution of the YMCA to health of members by using statistical analyses that employed general linear models and propensity scoring.
In these analyses, a propensity score is the estimated probability that an individual might be a Y member, as estimated using their observed characteristics. The propensity scores are then used to approximate a random experiment by creating a comparison group that does not participate in Y programs, but who otherwise share the same characteristics as those who have participated.18 19
We included the following covariates to develop propensity scores for our analysis:
• Gender
• Age
• Educational Attainment
• Immigrant Status
• Marital Status
• Ethnic Self-Identity
• Employment Status
• Sexual Orientation
Propensity scores were used to match similar people and estimate statistical differences in well-being, health and belonging measures between YMCA members and non-members, controlling for the covariates identified above. We then employed a series of generalized linear models and Wald tests to check for significant differences between YMCA members and non-members. These tests provided an estimate of the of the role that YMCA membership plays in individual well-being.
18 See https://www.betterevaluation.org/en/evaluation-options/propensity_scores19 The advantages of using propensity scores is that they are one of few methods used to assess impact or contribution without a random experiment. A random experiment in our research is not feasible, since we cannot randomly assign people to either receive or be denied YMCA membership. It should be noted that propensity score analysis is not a perfect substitute for a pure experiment and causal claims cannot be established with pure statistical accuracy.

19
ResultsOur results show that participating in YMCA programs and services is connected to better outcomes in well-being, health and belonging. YMCA members
perform better on each of the outcomes we assessed. Compared to non-members, YMCA members are:20
19%
19% more likely to have High Life Satisfaction
7%
7% more likely to have High Mental Health
2%
2% more likely to have High General Health
2%
2% more likely to have High Belonging
20 The percentages presented are point estimates from the statistical models employed. Further details about ranges and confidence intervals are presented in our technical report. For example, the percentage improvement in life satisfaction can be expected to vary from 15% to 22% in the population, based on a 95% confidence interval.

20
The YMCA of Greater Toronto’s Contribution to Neighbourhood Well-Being
Next, we examine the YMCA’s overall contribution to neighbourhood well-being by incorporating information about where YMCA services are located in the GTA to conduct a spatial analysis that answers the question:
• Does the presence of YMCA programs and services in a neighbourhood contribute to the well-being of its residents, regardless of whether or not they are Y members or participants?
MethodologyThe spatial analyses employed data from the surveys of the public and YMCA members, YMCA administrative data on the locations of YMCA facilities, and data from the 2016 Census.21 The analyses employed multi-level mixed-effects models that assessed the relationship of the number of YMCA locations in a neighbourhood to well-being, health, and belonging, controlling for the average household
income of the neighbourhood to account for the possible role that neighbourhood income plays in the placement of YMCA locations.22
In these analyses, we employ neighborhood classifications that were developed for the YMCA of Greater Toronto - Wellesley Institute Well-Being Monitor.23 These classifications correspond, where possible, to other neighbourhood classifications that have been developed by the GTA’s various regional and municipal level governments (e.g., the City of Toronto’s 140 neighbourhoods, Peel Region’s 77 Service Delivery Areas). In those instances where regions or cities have not developed formal neighbourhood boundaries we utilized wards or boundaries that were developed for previous research initiatives (e.g., we employed neighourhoods in York Region that were developed for reporting results from the Early Development Instrument).
21 YMCA administrative data was used to establish the number of YMCA locations within each neighbourhood and to count YMCA services. Proximity was calculated using the mean centre and standard distance from the nearest YMCA location. The analyses used mixed-effects models with spatial autocorrelations as random effects. Further details are provided in an accompanying technical report, see: www.ymcagta.org/ymcacontributions22 Including income in the model controls for some of this influence and allows us to more clearly estimate the contribution effect of YMCA locations in neighbourhoods. An interaction effect between these two independent variables was tested and found to be insignificant. The models treated the independent variables as fixed effects and the spatial autocorrelation as random effects.23 For a description of the GTA Well-Being Monitor and the neighbourhood classifications, see Hall et al. (2018). Life in the GTA: A window on well-being. Toronto: YMCA of Greater Toronto.

21
ResultsOur findings show that the presence of YMCA centres in a neighbourhood is associated with better outcomes for all residents, not just for YMCA members and clients. Neighbourhoods with at least one or two YMCAs, compared to those that do not have a YMCA, have:
As we noted previously, Y membership is associated with higher levels of well-being. Further analyses were conducted to explore the possibility that the relationship between the presence of a Y in a neighbourhood and better well-being could simply reflect the fact that neighbourhoods with Y programs have more Y members than other neighourhoods. The results showed that there is a positive relationship between having a Y in a neighbourhood and well-being even when Y members are removed from the analysis and the focus is placed exclusively on non-Y members. The presence of Y programs and facilities in a neighbourhood therefore appears to have a broad relationship with well-being that extends beyond the participants of these programs.
More research is needed to determine the underlying mechanisms through which having a YMCA facility in one’s neighbourhood is related to better well-being among all members of the community and not just those who are Y members. For example, these findings may be due to the presence of former Y members in such neighbourhoods who have previously been postively impacted by their Y memberships or they could be due to the ripple effect of having family members, friends, and neighours who are Y members.
3%
3% more people with High Life Satisfaction
3%
3% more people with High General Health
4%
4% more people with High Mental Health
2%
2% more people with High Belonging

22
Conclusion
The evaluation findings indicate the YMCA is making a substantial contribution to the well-being of people in the GTA. There is evidence that participation in YMCA programs and services has a strong relationship to well-being (as measured by life satisfaction) and is also associated with better general health, mental health and a stronger sense of belonging. The results also show that having a Y program or facility in a neighbourhood provides a modest but important lift to the well-being of its residents, regardless of whether or not they actually use the Y’s programs and services.
Our research shows that membership in the YMCA is associated with a 19% increase in the likelihood of having high life satisfaction. Based on the research linkages we noted earlier, we can therefore expect that Y members, compared to others, are also likely to have greater longevity, reduced risks of disease and illness, and better future incomes and productivity. Similar but more modest outcomes can be expected from simply having a YMCA located in one’s neighbourhood.
While our findings demonstrate the value that the YMCA delivers to communities in the GTA, they also provide us with benchmarks that will allow us to assess the success of our efforts to improve well-being as we go forward. At the Y, we are committed to continuous learning and improvement and are building our capacity to improve our social impact through a variety of impact measurement and evaluation activities. These include:
• continued expansion of impact measurement and improvement at the program level
• ongoing monitoring of neighbourhood trends in well-being through the YMCA of Greater Toronto-Wellesley Institute Well-Being Monitor
• ongoing assessments of the impact of the introduction of major YMCA Centres of Community on the health of the neighbourhoods in which they are located. The YMCA is building a number of new centres across the GTA that will serve as hubs for a variety of YMCA programs and services (e.g., health/fitness, employment, child care). Each provides an opportunity for a “natural experiment” to assess changes in the health of residents that occur after a new YMCA is established in their neighbourhood
At the YMCA, we often hear testimonials from our members about the positive role the Y has played in their lives. The research findings we report here provide empirical evidence that the Y’s impact extends beyond these individual cases to include our broader membership and even those who live in the neighbourhoods we serve who don’t directly participate in our programs and services.
This research provides encouraging evidence that the YMCA is on the right path to supporting the well-being of the people of the GTA through its programs, services, and facilities. The YMCA’s continuing focus on bringing more YMCA programs to more people appears to be as relevant today as it has been at any time during its more than 160 years of service to the community.

23

2200 Yonge St., Unit 300, Toronto Ontario M4S 2C6416.928.9622 or 1.800.223.8024 | [email protected]