the wyeth biotech campus at grange castle · 2014-12-16 · accomplishes best practice in the area...
TRANSCRIPT

WYETH BIOTECH CAMPUS 2008 ANNUAL ENVIRONMENTAL REPORT
i
TThhee WWyyeetthh BBiiootteecchh CCaammppuuss aatt GGrraannggee CCaassttllee
AAnnnnuuaall EEnnvviirroonnmmeennttaall RReeppoorrtt 22000088

WYETH BIOTECH CAMPUS 2008 ANNUAL ENVIRONMENTAL REPORT
i
EXECUTIVE SUMMARY 2008 was another excellent year regarding environmental compliance at the Wyeth Grange Castle Campus. A 100% compliance rate was achieved against the stipulated Emission Limit Values within the Integrated Pollution Prevention Control (IPPC) Licence for the Campus. There were no environmental non-compliances during the year. In line with the Environment, Health and Safety policy for the Campus, an Environmental Management System (EMS) is maintained. This EMS ensures that the Campus accomplishes best practice in the area of environmental management and compliance. Certification to I.S EN ISO 14001: 2004 was maintained during 2008. In 2008 Wyeth continued to implement projects and initiatives to improve environmental performance at the Campus. This report presents details on all these projects and outlines the many environmental benefits that have accrued. Highlighted projects include a 41% reduction in non hazardous waste compared to 2007, with less than 20 tonnes of non hazardous waste going to landfill each month and a non hazardous waste recycling rate of greater than 80% achieved at the end of 2008. Sustaining hazardous waste reduced by 23% in 2008 compared to 2007 and over 5,500 plastic containers were diverted from hazardous waste disposal through the introduction of the triple rinse drum washer. Water conservation measures implemented over the previous 3 years continue to provide savings and water use reduction again in 2008. The energy management system has provided energy savings in 2008. There was only slight increase in natural gas consumption despite a greater number of heating days in 2008 compared to 2007. There was also a reduction in electricity consumption compared to 2007. The Campus was recognised for good environmental performance by being shortlisted in the Large Manufacturer Category in the 2008 Green Awards.

WYETH BIOTECH CAMPUS 2008 ANNUAL ENVIRONMENTAL REPORT
ii
TABLE OF CONTENTS EXECTUTIVE SUMMARY………………………………………………………………………………………………I TABLE OF CONTENTS………………………………………………………………………………………………..II LIST OF APPENDICES……………………………………………………………………………………………….IV LIST OF TABLES………………………………………………………………………………………………………IV LIST OF ENVIRONMENTAL MANAGEMENT PROGRAMME (EMP) TABLES…………………………………V LIST OF FIGURES………………………………………………………………………………………………….....VI ABBREVIATIONS……………………………………………………………………………………………………...VI 1.0 INTRODUCTION …………………………………………………………………………………………….1
1.1 Report Overview…………………………………………………………………………………...1 1.2 Description of Activities……………………………………………………………………………1 1.3 Environmental Management System Overview………………………………………………...3
1.3.1 ISO 14001:2004…………………………………………………………………………3 1.3.2 Key Environmental Compliance Developments in 2008…………………………....4 1.3.3 Key Environmental Management Developments in 2008…………………………..4 1.3.4 Environment , Health and Safety Policy………………………………………………5 1.3.5 Management of Environmental Affairs………………………………………………..5
2.0 SUMMARY INFORMATION…………………………………………………………………………………8 2.1 Emissions to Sewer………………………………………………………………………………..8
2.1.1 Emissions to Sewer Overview…………………………………………………………8 2.1.2 Interpretation of Emissions to Sewer Data……………………………………..…….8
2.2 Emissions to Surface Water …….…………………………………………………………….....9 2.2.1 Emissions to Surface Water Overview………………………………………………..9 2.2.2 Interpretation of Surface Water Data………………………………………………….9
2.3 Emission to Air……………………………………………………………………………………..9 2.3.1 Emission to Air Overview……………………………………………………………....9 2.3.2 Interpretation of Air Emission Data……………………………………………….. ..11
2.4 Waste Arisings……………………………………………………………………………………12 2.4.1 Waste Arisings Overview………………………………………………………….....12 2.4.2 Interpretation of Waste Data………………………………………………………….17
2.4.2.1 Non Hazardous Waste……………………………………………………..17 2.4.2.2 Hazardous Waste…………………………………………………………...19
2.5 Ground Water Monitoring ……………………………………………………………………….21 2.5.1 Ground Water Monitoring Overview and Results…………………………………..21 2.5.2 Description of Ground Water Monitoring Results…………………………………..24 2.5.3 Interpretation of Ground Water Monitoring Results………………………………..25
2.6 Noise Monitoring …………………………………………………………………………………26 2.6.1 Noise Monitoring Overview…………………………………………………………...26 2.6.2 Day Time Noise………………………………………………………………………..26 2.6.3 Night Time Noise ……………………………………………………………………...27 2.6.4 Tonal Noise…………………………………………………………………………….27 2.6.5 Interpretation of Noise Results……………………………………………………….27
2.7 Agency Monitoring and Enforcement…………………………………………………………..28 2.7.1 IPPC Licence…………………………………………………………………………..28 2.7.2 GMM(Genetic Modified Micro–organism) EPA Consent…………………………..28
2.8 Environmental Complaints………………………………………………………………………28 2.9 Environmental Incidents…………………………………………………………………………28 2.10 Energy Consumption ……………………………………………………………………………29 2.11 Water Consumption…………………………………………………………………………… 30
3.0 MANAGEMENT OF THE ACTIVITY……………………………………………………………………...31 3.1 Environmental Management Programme Report …………………………………………… 31
3.1.1 Environmental Management Programme Report 2008 Overview……………….31 3.1.2 Summary Data on EMP Achievement vs. Target…..……………………………. .31
3.2 Environmental Management Programme Proposal………………………………………… 43 3.2.1 Environmental Management Programme 2009…………………………………….43
3.3 European Pollution Release and Transfer Registry…………………………………………. 54 4.0 SPECIFIC REPORTS
4.1 Solvent Management Plan ……………………………………………………………………..55 4.1.1 Introduction…………………………………………………………………………….55

WYETH BIOTECH CAMPUS 2008 ANNUAL ENVIRONMENTAL REPORT
iii
4.1.2 Overview of Solvent Usage…………………………………………………………..56 4.1.3 Fugitive Emissions…………………………………………………………………….58 4.1.4 Ethanol-Inputs and Outputs…………………………………………………………..58 4.1.5 Glacial Acetic Acid- Inputs and Outputs…………………………………………….59 4.1.6 Isopropyl Alcohol (IPA)……………………………………………………………….60 4.1.7 SMP Conclusions……………………………………………………………………...62
4.2 Annual CO2 AND NOx Emissions ………….………………………………………………….64 4.2.1 CO2 AND NOx Emissions Overview ………………………………………………..64 4.2.2 Carbon Dioxide………………………………………………………………………...64 4.2.3 Nitrogen Oxides (as Nitrogen Dioxide)………………………………………………65 4.2.4 Interpretation of NOx and SOx……………………………………………………….65
4.3 Respirometry and Toxicity Testing……………………………………………………………..71 4.4 List I and II Substance Reductions……………………………………………………………..72 4.5 Testing of Underground Pipes and Tanks……………………………………………………..72
4.5.1 Foul Sewer……………………………………………………………………………..72 4.5.2 Spill Containment Pipe Work…………………………………………………………73 4.5.3 Spill Containment Tank……………………………………………………………….73 4.5.4 Trade Effluent………………………………………………………………………….74 4.5.5 Summary of testing on underground tanks and pipelines…………………………75
4.6 Bund Integrity Survey…………………………………………………………………………….75 4.7 Review of Residuals Management Plan……………………………………………………….75 4.8 Review of Environmental Liabilities Insurance Cover………………………………………..76 4.9 Water Conservation Report……………………………………………………………………..76
4.9.1 Water Use Overview…………………………………………………………………..76 4.9.2 Water Usage and Discharge Volumes (2008)……………………………………...77 4.9.3 Water Conservation Activities (2008)………………………………………………..79 4.9.4 Ongoing Water Conservation Measures…………………………………………….80
4.10 Efficient Use Of Raw Materials …………………………………………………………………81 4.11 Energy Management Report…………………………………………………………………….81
4.11.1 Energy Management Overview………………………………………………………81 4.11.2 Energy Use For 2008………………………………………………………………….82 4.11.3 Energy Saving 2008…………………………………………………………………...84
4.11.3.1 Chiller System Optimisation ……………………………………………….84 4.11.3.2 Monitoring and Measurement……………………………………………...85 4.11.3.3 Office Area HVAC Recommissioning……………………………………..85 4.11.3.4 Reduced De-Humidification ……………………………………………….85 4.11.3.5 Banking of Steam Boilers during low demand………………………..….86
5.0 Conclusion …………………………………………………………………………………………………..86
Appendix 1 – Groundwater Monitoring Locations………………………………………………………………………88 Appendix 2 – Previous Groundwater Monitoring Results……………………………………………………………….90 Appendix 3 – Noise Monitoring Locations……………………………………………………………………………. 98 Appendix 4 – Respirometry and Toxicity Report………………………………………………………………………100 Appendix 5 – Survey of Underground Pipes and Tanks………………………………………………………………..109 Appendix 6 – Bund Integrity Survey………………………………………………………………………… .. … … 135 Appendix 7 – Pollution Release and Transfer Register……………………………………………………………… ..176

WYETH BIOTECH CAMPUS 2008 ANNUAL ENVIRONMENTAL REPORT
iv
LIST OF APPENDICES Appendix 1 Groundwater Monitoring Locations
Appendix 2 Historical Groundwater Monitoring Results
Appendix 3 Noise Monitoring Locations
Appendix 4 Respirometry Report
Appendix 5 Survey of Underground Pipes and Tanks
Appendix 6
Appendix 7
Bund Integrity Survey
Pollution Release and Transfer Register
LIST OF TABLES Table 2.1 Results of monitoring emissions to sewer
Table 2.2 Results of surface water monitoring
Table 2.3 Results of air emissions monitoring
Table 2.4 Non-Hazardous waste generation
Table 2.5 Hazardous waste generation
Table 2.6 Mixed solvent waste analysis
Table 2.7 Waste contractors and final disposal/recovery sites used by Wyeth Grange Castle
Table 2.8 Hazardous Waste generation – Expired Waste
Table 2.9 Groundwater monitoring well location description
Table 2.10 Results of field measurements taken at each monitoring well
Table 2.11 Results of organics analysis of groundwater
Table 2.12 Results of inorganic chemical analysis of groundwater
Table 2.13 Results of metal analysis of groundwater
Table 2.14 Day time noise measurement results
Table 2.15 Night time noise measurement results
Table 2.16 Environmental Events 2008
Table 2.17 Natural gas usage
Table 2.18 Gas oil usage
Table 2.19 Electricity usage
Table 2.20 Water usage
Table 4.1 Ethanol usage
Table 4.2 Glacial acetic acid usage
Table 4.3 Isopropyl alcohol usage
Table 4.4 Ethanol summary calculations
Table 4.5 Glacial acetic acid summary calculations
Table 4.6 IPA summary calculations

WYETH BIOTECH CAMPUS 2008 ANNUAL ENVIRONMENTAL REPORT
v
Table 4.7 CO2 calculations
Table 4.8 NOx (as NO2) calculations
Table 4.9 Aquatic toxicological analytical results
Table 4.10 Comparing 2006 to 2008 monthly discharge average (m3/day)
LIST OF ENVIRONMENTAL MANAGEMENT PROGRAMME (EMP) TABLES 2008 Environmental Management Programme Review
Table 3.1.1 Environmental Aspect 1 – Emissions to Surface Water
Table 3.1.2 Environmental Aspect 2 – Emissions to Wastewater
Table 3.1.3 Environmental Aspect 3 – Noise Emissions
Table 3.1.4 Environmental Aspect 4 – Emissions to Atmosphere
Table 3.1.5 Environmental Aspect 5 – Fugitive Emissions to Atmosphere
Table 3.1.6 Environmental Aspect 6 – Hazardous waste generation and disposal
Table 3.1.7 Environmental Aspect 7 – Non-Hazardous waste generation – recovery/disposal
Table 3.1.8 Environmental Aspect 8 – Water usage and conservation
Table 3.1.9 Environmental Aspect 9 – Emissions to ground
Table 3.1.10 Environmental Aspect 10 – Raw Materials
Table 3.1.11 Environmental Aspect 11 – Energy
Table 3.1.12 Environmental Aspect 12 – Visual Impact
Table 3.1.13 Environmental Aspect 13 – Odour Emissions
Table 3.1.14 Environmental Aspect 14 – Hazardous materials
Table 3.1.15 Environmental Aspect 15 – Environmental management system
2009 Environmental Management Programme Proposal
Table 3.2.1 Environmental Aspect 1 – Emissions to Surface Water
Table 3.2.2 Environmental Aspect 2 – Emissions to Wastewater
Table 3.2.3 Environmental Aspect 3 – Noise Emissions
Table 3.2.4 Environmental Aspect 4 – Emissions to Atmosphere
Table 3.2.5 Environmental Aspect 5 – Fugitive Emissions to Atmosphere
Table 3.2.6 Environmental Aspect 6 – Hazardous waste generation and disposal
Table 3.2.7 Environmental Aspect 7 – Non-Hazardous waste generation – recovery/disposal
Table 3.2.8 Environmental Aspect 8 – Water usage and conservation
Table 3.2.9 Environmental Aspect 9 – Emissions to ground
Table 3.2.10 Environmental Aspect 10 – Raw Materials

WYETH BIOTECH CAMPUS 2008 ANNUAL ENVIRONMENTAL REPORT
vi
Table 3.2.11 Environmental Aspect 11 – Energy
Table 3.2.12 Environmental Aspect 12 – Visual Impact
Table 3.2.13 Environmental Aspect 13 – Odour Emissions
Table 3.2.14 Environmental Aspect 14 – Hazardous materials
Table 3.2.15 Environmental Aspect 15 – Environmental management system
LIST OF FIGURES Figure 1.1 Environment Health and Safety Policy
Figure 1.2 EHS & Site Services Department Organisational Chart
Figure 2.4.1 Waste disposed to landfill AUG07 – DEC08
Figure 2.4.2 Non-Hazardous waste recycling rate AUG07 - DEC08
Figure 4.9.1 Trade effluent volume flow JAN08 – DEC08
Figure 4.11.1 Natural Gas consumption 2007 & 2008
Figure 4.11.2 Electricity consumption 2007 & 2008
ABBREVIATIONS
AER Annual Environmental Report AHP American Home Products BATNEEC Best Available Technology Not Exceeding Excessive Cost BOD Biological Oxygen Demand BPEO Best Practicable Environmental Option C Celsius CCTV Closed Circuit Television cGMP current Good Manufacturing Practice CHP Combined Heat and Power CIP Cleaning In Place CO2 Carbon Dioxide COD Chemical Oxygen Demand CRC Chemical Resistant Coating CSR Corporate Social Responsibility CUB Central Utilities Building dB(A) A-Weighted Decibels DMSO Dimethyl Sulphoxide DO Dissolved Oxygen DP Drug Product DS Drug Substance EC European Commission EHS Environment, Health and Safety ELRA Environmental Liabilities Risk Assessment ELV Emission Limit Value EMP Environmental Management Programme EPA Environmental Protection Agency EtOH Ethanol EU European Union EWC European Waste Catalogue FDA Federal Drug Administration GC Gas Chromatography

WYETH BIOTECH CAMPUS 2008 ANNUAL ENVIRONMENTAL REPORT
vii
GHG Green House Gas GMM Genetically Modified Micro-organism GMP Good Manufacturing Practice HEPA High Efficiency Particulate Air HVAC Heating Ventilation Air Conditioning IPA Isopropyl alcohol IPPC Integrated Pollution Prevention Control IPPCL Integrated Pollution Prevention Control Licence ISO International Standards Organisation kg Kilogram km Kilometre kVA Kilovolt Amp LAeq Equivalent Continuous Noise Level l Litre M & E Mechanical and Electrical m Metre m3 Metre cubed mbpl Meters below stand pipe level MCS Manufacturing Control System MF Harvest Micro Filtration mV Milli Volt (measure of redox potential) MW Megawatts MWWTP Municipal Wastewater Treatment Plant Nm3 Normalised Cubic Metre N2 Atmospheric Nitrogen NO Nitric Oxide NOx Nitrogen Oxide OFG Oils, Fat and Grease PER Pollution Emissions Register pH Hydrogen Ion Concentration QA Quality Assurance QA/QC Quality Assurance and Quality Control Building QC Quality Control RA Rheumatoid Arthritis RMP Residuals Management Plan RO Reverse Osmosis S.I. Statutory Instrument SDCC South Dublin County Council SO2 Sulphur Dioxide SS Suspended Solids SVOCs Semi Volatile Organic Compounds t Tonne TDS Total Dissolved Solids Tj Terra joule TKjN Total Kjeldahl Nitrogen TOC Total organic content TPH Total Phosphorus TSS Total Saturated Solids USEPA United States Environmental Protection Agency VAV Variable Air Volume VOC Volatile Organic Compound WFI Water for Injection WWTP Wastewater Treatment Plant

WYETH BIOTECH CAMPUS 2008 ANNUAL ENVIRONMENTAL REPORT
1
1.0 INTRODUCTION
1.1 Report Overview This Annual Environmental Report (AER) for The Wyeth Biotech Campus at Grange Castle (the Campus) represents the fifth AER for the Campus and presents information for the period from 01 January 2008 to the 31 December 2008.
Integrated Pollution Prevention Control (IPPC) Licence Register Number: -
P0652-01
Name and Location of the Site: -
Wyeth Medica Ireland The Wyeth Biotech Campus at Grange Castle Grange Castle Business Park Clondalkin Dublin 22 Ireland
The report format follows Guidance Note for Annual Environmental Report issued by the Environmental Protection Agency (EPA). Section 1 presents a brief description of activities on Campus. It also presents information on the Environmental Management System in place. Section 2 presents summary information on self-monitoring data, energy and water consumption, environmental incidents and complaints. Section 3 presents further information on environmental management at the site including a review of progress on the Environmental Management Programme (EMP) for 2008, its update for 2009 and also the European Pollution Release and Transfer Register (E-PRTR) for the Campus. Section 4 details licence specific reports completed during the reporting period including water conservation, bund inspections, energy management and solvent management plan (SMP) reports.
1.2 Description of Activities Wyeth is one of the world’s largest research-driven pharmaceutical and health care products companies. A leader in discovery, development, manufacturing and marketing of pharmaceuticals, vaccines, biotechnology products and non-prescription medicines, Wyeth is committed to the delivery of products that improve the quality of life for people worldwide.

WYETH BIOTECH CAMPUS 2008 ANNUAL ENVIRONMENTAL REPORT
2
Wyeth is ranked #4 out of all global biotech companies in revenue and capacity and is one of the fastest-growing pharmaceutical companies - driven largely by biotech products.
The Campus at Grange Castle is one of the largest integrated biotech manufacturing facilities in the world, covering over 111,000 square meteres. The Campus produces a number of Wyeth’s most innovative and important products that are outlined below. The Campus now employs more than 1,200 people.
The products manufactured or in development at the Campus include: -
Enbrel: A Biologic used by more than 470,000 patients worldwide to treat moderate to severe rheumatoid arthritis and related conditions.
Prevenar: The first and only vaccine to help prevent serious, life threatening pneumococcal diseases including Meningitis in children under two years of age. Prevenar was added to Ireland’s National Immunisation Programme in 2008.
Tygacil: A new antibiotic that offers clinicians an alternative for hard-to-treat bacterial infections of the skin and digestive systems.
Relistor: (Methylnaltrexone) is a peripherally-acting mu-opiod antagonist in development for the treatment of opioid-induced constipation (OIC).

WYETH BIOTECH CAMPUS 2008 ANNUAL ENVIRONMENTAL REPORT
3
The Campus consists of six main buildings and a number of ancillary facilities. These main buildings are:
• Drug Substance Building • Development Facility • Manufacturing Suites Building • Central Utility Building • QA/QC - Administration Building • Warehouse
Commercial manufacture and supply of Enbrel began in 2005. The manufacture of this product occurs within the Drug Substance building. The Manufacturing Suites building contains 3 manufacturing suites. These suites have 3 distinct manufacturing activities, Prevenar is manufactured in Vaccines Conjugation (Suite 1) of the Manufacturing Suites building.
Within the Manufacturing Suites there are three distinct manufacturing units - Vaccine Conjugation, Vial Fill/Finish and Syringe Fill/Finish.
Tygacil activities occur within Vial Fill/Finish (Suite 2) of the Manufacturing Suites building. This activity was also coupled with the introduction of Methylantrexone (MNTX) to the site in 2006. In 2008, work continued on the validation of Tygacil and MNTX processes. In Syringe Fill/Finish (Suite 3), validation work on the filling of Prevenar in syringes commenced in 2008.
Given the early development of the Campus, 2008 can be described as a year where manufacturing output continued to increase. As such, the site has yet to reach the full range of commercial manufacture, development/research and support activity that is forecasted for the Campus.
1.3 Environmental Management System Overview
1.3.1 ISO14001:2004 In 2006 the Campus achieved certification to I.S EN ISO 14001: 2004 Environmental Management System. In 2008 Wyeth continued to develop the Environmental Management System, ensuring the environmental management programme was being implemented to guarantee compliance and continuous environmental improvement. The National Standards Authority of Ireland (NSAI) completed 3 days of surveillance auditing in 2008. Wyeth demonstrated that the Environmental Management System was functioning well and in compliance with the fundamental requirements of ISO 14001: 2004.

WYETH BIOTECH CAMPUS 2008 ANNUAL ENVIRONMENTAL REPORT
4
1.3.2 Key Environmental Compliance Developments in 2008 This section outlines some of the key developments in environmental compliance in 2008: -
• Maintained 100% compliance with the Integrated Pollution Prevention
Control (IPPC) Licence during 2008. • Maintained certification to I.S EN ISO 14001: 2004 Environmental
Management System after 3 days of surveillance auditing by the National Standards Authority of Ireland (NSAI).
• Completed a waste water feasibility study for the Campus. • Hosted an unannounced EPA inspection for IPPC (Register No.P0652-01),
and a scheduled EPA audit for Genetically Modified Microorganisms (GMM) (Register No. 142).
• Installed an odour abatement unit for the Waste Water Neutralisation Tanks that has removed the localised odour in the CUB yard.
• Requested modifications to waste management records at the site were approved by the Agency.
• Completed all required surveys of bunded areas and underground pipes and tanks.
1.3.3 Key Environmental Management Developments in 2008 This section outlines some of the key developments in environmental management in 2008: -
• Made the non hazardous waste compound in the CUB yard operational. • Increased the non hazardous waste recycling rate to greater than 80%. This
was achieved through greater segregation of waste and use of the facilities in the non hazardous waste compound.
• Publication of third edition of the internal environmental newsletter ‘The Green Link’ that highlighted the important link between employees’ jobs and the potential impacts upon the environment. This publication also promoted a diverse range of environmental topics such as wildlife on Campus, energy saving, water usage, ISO 14001, effective waste management & waste reduction and climate change.
• Developed an electronic waste tracking system for non hazardous waste which will be implemented in 2009.
• Reduced the amount of sustaining hazardous waste generated through waste reviews and installation of a triple rinse drum washer.
• Commenced a project to install a Combined Heat and Power (CHP) Plant for efficient energy production at the Campus.
• Continued to develop the energy management system and implemented a number of energy reduction projects.
• Wyeth Biotech was shortlisted in the Large Green Manufacturer category in the 2008 Green Awards.

WYETH BIOTECH CAMPUS 2008 ANNUAL ENVIRONMENTAL REPORT
5
1.3.4 Environment, Health and Safety Policy The Environment, Health and Safety (EHS) Policy for the Campus is presented below (Figure 1.1). This policy integrates the Campus commitment to reducing its environmental impact and maximising compliance within the overall values of Integrity, Teamwork, Quality, Leadership and Respect for People for the Campus.
1.3.5 Management of Environmental Affairs Environmental affairs at the Campus are directly managed within the Environment, Health and Safety (EHS) Department.
During 2008 there was a change in the senior management structure at the Campus. EHS is now managed by the Director of EHS & Site Services where previously EHS was managed by the Associate Director of EHS. The Director of EHS & Site Services has overall responsibility for management of environmental affairs, safety and occupational health and reports directly to the Managing Director for the Campus. The EHS team comprises of fourteen EHS professionals including occupational health, safety and environmental personnel. The function of environmental compliance lies within the EHS Progammes Group. Two environmental scientists work exclusively on environmental management including maintenance of the IPPC Licence, implementation and maintenance of the EMS to ISO:14001:2004, GMM Contained use licence, waste management, emissions trading and environmental monitoring/performance. The organisational chart for the EHS Department at The Wyeth Biotech Campus is presented within Figure 1.2.

WYETH BIOTECH CAMPUS 2008 ANNUAL ENVIRONMENTAL REPORT
6
Signed:______________________ Date: 03 Sep 07 Revision: 2Matt CorcoranManaging Director
The Wyeth Biotech Campus at Grange CastleEnvironment, Health and Safety Policy
We manufacture healthcare products that significantly improve lives and deliver outstanding value to our Customers and Shareholders. In keeping with the Wyeth Corporate Policy on Environment, Health & Safety (EHS) and our mission to be the most respected Biotech campus in the world, we incorporate the Organisations Values into the way we do business to implement this
policy for our site operations:
Only through living by our values, will we realise our
ultimate goal of zero incidents.
TeamworkWe will promote and maintain open, constructive dialogue and good working relationships with;Employees Suppliers Regulatory agencies Customers Subcontractors Interested partiesLocal communities
Our goal is to increase knowledge and enhance mutual understanding in matters of EHS. We will share information and openly communicate our EHS performance.
IntegrityWe are committed to complying with the spirit and letter of all legal and regulatory requirements relating to protection of;• The Employees, • The Public • The Environment.
We will implement best practice and lead in the development of;• Responsible laws• Regulations• Standards that safeguard the community, workplace and environment.
QualityWe are dedicated to the principle that all workplace incidents, illnesses and adverse environmental impacts are preventable.
By setting and achieving challenging EHS objectives, based on the principles of Risk Avoidance and the Pollution Prevention, we will demonstrate our commitment to continual improvement.
We will continue to drive down the EHS impact of our operations by improving process safety, minimising risk, reducing emissions, reducing waste, reducing discharges and increasing energy efficiency.
We are determined to incorporate best practice in the planning, design, construction and operation of new and existing processes.
LeadershipWorld class EHS performance depends on;• management leadership • employee co-operation • conformance to polices and practices. We will provide;• Workplace policies• Standards• Procedures• Training to ensure that employees can perform their jobs in a safe, healthy and environmentally responsible manner.
The organisation will ensure that our employees have the knowledge, resources and authority to implement this policy.
Respect for PeopleAll employees are encouraged to actively participate in EHS matters and work in partnership with management to assure compliance and support continual improvement.
We are all empowered to challenge any activity if there is an unacceptable risk of a safety or environmental incident.
Through individual objectives and targets all employees are encouraged to actively participate in promoting a positive EHS culture.
Figure 1.1: Environment, Health and Safety Policy

WYETH BIOTECH CAMPUS 2008 ANNUAL ENVIRONMENTAL REPORT
7
Figure 1.2: Organisational Chart for the EHS & Site Services Department at the
Wyeth Biotech Campus.

WYETH BIOTECH CAMPUS 2008 ANNUAL ENVIRONMENTAL REPORT
8
2.0 SUMMARY INFORMATION
The section presents summary information on environmental self-monitoring, water and energy consumption and incidents and complaints at the Campus for 2008. Interpretation of the summary information and data for all environmental self-monitoring is also presented.
2.1 Emissions to Sewer
2.1.1 Emissions to Sewer Overview
Emissions to sewer are monitored in accordance with Schedule 2(i) of the IPPC Licence. Monitoring is conducted on a continuous, weekly, monthly and annual basis. The results of the analysis and the annual quantities emitted to sewer are outlined in Table 2.1 below.
TABLE 2.1: RESULTS OF MONITORING EMISSIONS TO SEWER
Parameter Mean Concentration
(mg/l)Limit(mg/l)
Emissions (kg/year)
Limit (kg/year)
Flow (m3/day) 1,181 1,850 432,246 675,250 COD 261.6 4,000 113,029 2,708,400 BOD 43.6 2,000 18,838 1,354,200 Suspended Solids 98.2 700 42,429 473,970 Total Dissolved Solids 1,196.9 N/A 517,142 N/A Total Nitrogen (as N) 97.9 600 42,299 406,260 Phosphate 8.0 50 3,457 33,855 Cyanides 0.02 1 9 677.1 Total Phosphorous (as P) 9.5 100 4,105 67710 Sulphates (as SO4) 116.1 400 50,163 270,840 Detergents (MBAS) 0.1 100 43 67,710 Dimethyl Sulphoxide 5.6 N/A 2,420 N/A Oils, Fats & Greases 13.0 100 5,617 67,710
N/A - Not Applicable
2.1.2 Interpretation of Emissions to Sewer Data The emissions to sewer data indicate overall compliance with the IPPC Emission Limit Values (ELV’s). There were no non-compliances recorded during 2008. This is the third consecutive year of no non-compliances for the Campus.
There was a continued reduction in the volume of trade effluent discharged in 2008, with 10,113m3 less discharged compared to 2007. All other parameters in 2008 exhibited similar to trends shown in 2007.

WYETH BIOTECH CAMPUS 2008 ANNUAL ENVIRONMENTAL REPORT
9
It is expected that continued increases in manufacturing and development in 2009 will result in further increases to the organic and inorganic loading discharged from the Campus. However these increases are not expected to exceed ELV’s. The excellent level of compliance, with respect to emissions to sewer, is expected to be maintained in 2009.
2.2 Emissions to Surface Water
2.2.1 Emissions to Surface Water Overview
Emissions to surface water are monitored on a weekly basis, with TOC and pH monitored continuously. The results of the analysis are outlined in Table 2.2 below.
TABLE 2.2: RESULTS OF SURFACE WATER MONITORING
Parameter Mean Result
COD (mg/l) 31.0 pH (pH units) 7.9 TOC (mg/l) 5.7
Suspended Solids (mg/l) 29.7 Conductivity (µS/cm2) 1,323.6
2.2.2 Interpretation of Surface Water Data During 2008, the TOC analyser and pH meter provided continuous data, while the composite sampler provided samples for weekly analysis. This data, along with the daily visual inspections, indicates that there was no contamination of surface water in 2008.
2.3 Emissions to Air
2.3.1 Emissions to Air Overview Air emissions are monitored on a quarterly basis in accordance with the requirements of the IPPC Licence. A summary of the results obtained in 2008 is outlined in Table 2.3 below.

WYETH BIOTECH CAMPUS 2008 ANNUAL ENVIRONMENTAL REPORT
10
TABLE 2.3: RESULTS OF AIR EMISSIONS MONITORING
Quarter 1 Emission Point
Parameter Concentration (mg/Nm3)
Limit (mg/Nm3)
A1-1 Particulates <0.29 5 NOx (as NO2) 71 75 Q1'07 SO2 <1 35 A1-2 Particulates <0.30 5 NOx (as NO2) 71 75
SO2 <1 35 A1-3 Particulates 0.74 5 NOx (as NO2) 67 75
SO2 <1 35
A2-3 Particulates <0.40 5
NOx (as NO2) 74 75
SO2 <1 35 Quarter 2 Emission
Point Parameter Concentration
(mg/Nm3) Limit (mg/Nm3)
A1-1 Particulates <0.35 5 NOx (as NO2) 56 75 Q2'07 SO2 2 35 A1-2 Particulates <0.34 5
NOx (as NO2) 47 75 SO2 <1 35
A1-3 Particulates <0.32 5 NOx (as NO2) 53 75 SO2 2 35
A2-3 Particulates <2.13 5
NOx (as NO2) 60 75
SO2 3 35 Quarter 3 Emission
Point Parameter Concentration
(mg/Nm3) Limit (mg/Nm3)
A1-1 Particulates *- 5 NOx (as NO2) *55 75 Q3'07 SO2 *2 35 A1-2 Particulates 0.77 5
NOx (as NO2) 58 75 SO2 <1 35
A1-3 Particulates <0.52 5 NOx (as NO2) 58 75 SO2 <1 35
A2-3 Particulates 2.8 5
NOx (as NO2) 62 75
SO2 1.5 35

WYETH BIOTECH CAMPUS 2008 ANNUAL ENVIRONMENTAL REPORT
11
TABLE 2.3 (Continued): RESULTS OF AIR EMISSIONS MONITORING
Quarter 4 Emission Point
Parameter Concentration (mg/Nm3)
Limit (mg/Nm3)
A1-1 Particulates <0.31 5 NOx (as NO2) 55 75 SO2 <1 35 A1-2 Particulates <0.34 5
NOx (as NO2) 57 75 SO2 <1 35
Q4'07 A1-3 Particulates <0.33 5 NOx (as NO2) 58 75
SO2 <1 35 A2-3 Particulates <2.9 5 NOx (as NO2) 66 75
SO2 <1 35
*Q3 air monitoring was completed on 21 July 2008 by external monitoring company. Boiler A1-1 was under going annual maintenance and was off-line, therefore it could not be sampled. In-house monitoring results for combustion gases are therefore reported as previously agreed with the Agency. It should be noted that particulate sampling is not carried out in-house.
2.3.2 Interpretation of Air Emissions Data
The boilers installed at the Campus utilise natural gas as the primary combustion fuel. As such, the resultant combustion gas has extremely low sulphur content and produces negligible particulate matter. The boilers also have low NOx burners that emit a reduced amount of NOx that would otherwise be produced in conventional burners.
The external monitoring company carries out monitoring on a quarterly basis. The boilers are also monitored in-house by Wyeth on a monthly basis to ensure continued flue gas emissions compliance. Particulate or flow monitoring is not carried out as part of in-house monitoring.
Overall, the results of the air emissions monitoring demonstrated compliance with the IPPC Licence limits. All parameters were within the Emission Limit Values (ELV) for each quarter with particulates and sulphur dioxide results consistently below the limit of detection.
It is expected that the high level of compliance with the emissions to atmosphere ELVs will continue during 2009.

WYETH BIOTECH CAMPUS 2008 ANNUAL ENVIRONMENTAL REPORT
12
2.4 Waste Arisings This section presents details on waste arisings at the Campus. The section represents the waste management records for the site as prescribed under Condition 7.9 of the IPPC Licence.
2.4.1 Waste Arisings Overview Data on non hazardous waste and hazardous waste generation at the Campus, for the 2008 AER reporting period, is presented within Table 2.4 and Table 2.5 respectively.
TABLE 2.4: NON-HAZARDOUS WASTE GENERATION EWC Code Waste Type Quantity
(metric tonnes) 200301 General Waste 230.35 200101 Cardboard 104.55 200138 Timber 91.31 200139 Plastics 74.67 150106 Mixed packaging 187.26 200307 Mixed Commercial and Industrial Packaging 318.94 200140 Metal 63.72 200101 Paper 168.00 200102 Glass 26.46 170107 Construction and Demolition 212.09 200108 Canteen Waste for Composting 17.27 070514 Inactivated biohazardous waste 17.41 200125 Waste Cooking Oil 9.01
Total Non Hazardous Waste 1,521.04 Total Recycled 1,172.93 Total Disposed 348.11
% Recovered/Recycled 77.11

WYETH BIOTECH CAMPUS 2008 ANNUAL ENVIRONMENTAL REPORT
13
TABLE 2.5: HAZARDOUS WASTE GENERATION
EWC Code Waste Type Quantity (metric tonnes)
060106* Acidic Waste 9.59 060205* Basic Waste (caustic) 29.59 070501* Off-specification product material (Liquid/semi-liquid) 4.50 070503* Organic halogenated waste 2.15 070504* Organic solvent waste (non-halogenated) 13.57 070513* Contaminated Packaging 199.37 080111* Waste Paints 2.23 080317* Waste Printing Toner 0.42 130110* Mineral based non-chlorinated oils 0.56 130113* Hydraulic Oil 1.94 130701* Diesel Fuel Oils 0.42 150110* Contaminated Drums/Containers 23.05 150202* Contaminated wipes 5.39 160504* Waste Aerosols 1.64 160506* Lab Waste (containing mixtures of lab chemicals) 119.48 160507* Lab Waste (Discarded inorganic chemicals) 0.12 160508* Waste Glycol 0.53 160601* Lead Batteries 11.76 160602* Ni-Cd Batteries 0.98 170503* Contaminated Soil 3.62 180103* Laboratory Biohazardous waste 3.55 200121* Fluorescent tubes 1.33 200135* Mixed Waste Electrical WEEE 13.96
Total 449.75 In accordance with Schedule 3 (iii) Waste Analysis the results of analysis of mixed solvents waste is presented in Table 2.6. This analysis represents annual sampling and analysis of mixed solvents as agreed with the Agency (EPA Ref. M652/SI01MG).
TABLE 2.6: MIXED SOLVENT WASTE ANALYSIS Concentration (mg/l)
Parameter Mixed Solvent Drum (05May08)
Drum N (21May08)
Drum O (21May08)
Dichloromethane <0.01 30.6 0.08 Bromochloromethane <0.01 0.48 1.27 Chloroform <0.01 0.91 199 Benzene <0.01 <0.01 <0.01 1,2 Dichloroethane
<0.01 <0.01 <0.01 mp-Xylene <0.01 0.07 381 Ethyle Benzene <0.01 <0.01 9.80 o-Xylene <0.01 <0.01 6.60 Acetone 0.017 0.03 0.06 Methanol 60.98 25.56 62.62 Ethanol 25.22 18.86 78.04 Isopropanol 20.00 2.70 0.32 Acetonitrile 27.58 54.78 63.16 % Water 75.98 77.03 66.44

WYETH BIOTECH CAMPUS 2008 ANNUAL ENVIRONMENTAL REPORT
14
Table 2.7 presents summary information on the waste contractors used and the final disposal/recovery sites used for all the waste streams generated at the Campus. This table also presents permit details on each of the waste contractors listed.

WYETH BIOTECH CAMPUS 2008 ANNUAL ENVIRONMENTAL REPORT
15
TABLE: 2.7 WASTE CONTRACTORS AND FINAL DISPOSAL/RECOVERY SITES USED BY WYETH GRANGE CASTLE Waste Type Primary Waste Contractor Final Disposal/Recovery Sites Permit Details
General Waste (Non Hazardous) Greenstar (EPA Waste Licences W0188-1, W0183-1, W0015-1, W0053-3)
Knockharley Landfill, Co. Meath Ballynagran Landfill, Co. Wicklow KTK Landfill, Co. Kildare Arthurstown Landfill, Co. Kildare
W0146-1 (EPA) W0165-1 (EPA) W0081-3 (EPA) W0004-3 (EPA)
Cardboard Greenstar (EPA Waste Licences W0188-1, W0183-1, W0015-1, W0053-3)
SCA Recycling UK Ltd Bailey Waste Marwin Environmental Trading Ltd. International Recycling Ltd. Peute Papierecycling B.V.
EX0720014 (UK Env Agency) WPT94 (Fingal Co. Co.) 926 (Cork City Council) EX0920017 (UK EA) DO 02.2017 (Dordrecht)
Plastics Greenstar (EPA Waste Licences W0188-1, W0183-1, W0015-1, W0053-3)
Thorndale Recycling, Derry, NI Greenway Ireland Ltd. Armagh, NI International Recycling Ltd. Alternative Waste Solutions Ltd.
WDL 14 (Derry City Council) WML03/02 (Armagh City Council) EX09200317 (UK EA) EA/WML/73274 (UK EA)
Timber Greenstar EPA Waste Licences W0188-1, W0183-1, W0015-1, W0053-3)
Conroy Recycling Company Ltd WP-152-2006 (Westmeath Co. Co.)
Metal Greenstar EPA Waste Licences W0188-1, W0183-1, W0015-1, W0053-3)
Seaforde Metals Hammond Lane
ROC-57 (Dept of Env NI) WP 98107 (Dublin City Council)
Paper Greenstar EPA Waste Licences W0188-1, W0183-1, W0015-1, W0053-3)
Datastroy Ltd., Co. Meath WMP 2007/1 (Meath Co. Co.)
Glass Greenstar EPA Waste Licences W0188-1, W0183-1, W0015-1, W0053-3)
Glassco Recycling Ltd. 247/2006 (Kildare Co. Co.)
Construction and Demolition Greenstar EPA Waste Licence W0053-3)
Greenstar, Fassaroe Roadstone Hunstown Quarry
W0053-3 (EPA) WPT96 (Fingal Co. Co.)
Toner Cartridges Redeem Plc (Formerly Eurosource) Redeem Plc (Formerly Eurosource), WMP 2005/40 (Meath Co. Co.)

WYETH BIOTECH CAMPUS 2008 ANNUAL ENVIRONMENTAL REPORT
16
Other Non Hazardous Waste (Inactivated Biohazardous waste, waste process resins, mixed packaging)
Indaver Ireland (Waste Licence W0036-2)
AVG, Hamburg, Germany Indaver NV, Antwerp, Belgium
IB 2234/AVG-GENB-2 (City of Hamburg) MLVA1/9800000485/MV/bd (Province of Antwerp)
Cooking Oil Indaver Ireland Atlas Oil Ltd (ENVA), Co. Laois W0184-01 (EPA)
Mixed Waste Electrical WEEE Indaver Ireland AppaRec N.V., Antwerp, Belgium MLAV1/02-470/GVDA/fs (Province of Antwerp)
Fluorescent Tubes Indaver Ireland Irish Lamps Recycling Co. Ltd. 02/2000B (Kildare Co. Co.)
Batteries (Lead Acid and NiCd) Indaver Ireland Atlas Oil Ltd (ENVA), Co. Laois W0184-01 (EPA)
Laboratory Biohazardous Waste Eco-Safe Systems (Waste Licence W0052-2)
KTK Landfill, Co. Kildare (disposed as treated non-hazardous) W0031-3 (EPA)
Empty IBCs Indaver Ireland Rilta Ltd. W0192-1 (EPA)
ALL OTHER HAZARDOUS WASTE Indaver Ireland (Waste Licence W0036-2)
AVG, Hamburg, Germany Indaver NV, Antwerp, Belgium
IB 2234/AVG-GENB-2 (City of Hamburg) MLVA1/9800000485/MV/bd (Province of Antwerp)

WYETH BIOTECH CAMPUS 2008 ANNUAL ENVIRONMENTAL REPORT
17
2.4.2 Interpretation of Waste Data The waste data outlined in Tables 2.4 and 2.5 above represents all waste arisings for the AER reporting period. All off-site recovery and disposal routes used are approved with the Agency in accordance with Condition 7.2 of the IPPC Licence and are summarised in Table 2.7.
2.4.2.1 Non Hazardous Waste
Source segregation is practiced at the Campus for all major recyclable waste streams. The infrastructure to support source segregation is continually being developed on-site. In 2007 construction of a dedicated Non Hazardous Waste Compound was completed and the compound was made operational in March ’08. Waste collections are consolidated in the non hazardous waste compound with satellite collection points for non hazardous waste around the campus that are routed to the central compound. Current waste infrastructure on-site includes dedicated areas for segregation and disposal of non hazardous waste. These include dedicated skips for cardboard, timber, metal, plastic, glass and general waste for landfill. In addition, a cardboard baler was installed in 2008 which further optimises recycling potential of cardboard on-site. Waste reviews were carried out in all areas of the campus in 2008 to determine if there were opportunities for further segregation of waste and opportunities to recycle non hazardous waste. Segregation of non hazardous waste into two different streams, general waste and dry mixed recyclables, was completed in the Warehouse, QA/QC, Development, Drug Substance and Manufacturing Suites. Waste segregation was also completed in Café Grange where employees segregate waste into food waste, recyclables and general waste. The food waste is composted, the recyclables (plastic bottles, packaging) are sent for recycling and general waste is sent to landfill. This initiative has increased employee awareness of non hazardous waste segregation and has helped improve the 2008 non hazardous waste recycling rate. In 2008 Wyeth has worked up the supply chain with our suppliers to see if changes could be made to how raw materials and parts are packaged, thus reducing the amount of packaging waste that is required to be disposed of. A list of suppliers was reviewed and the largest suppliers were approached to work with us on this project. The project is on going but already there have been improvements. An example of such an improvement is 12 filters that were previously packed in individual cardboard packaging are now all packed in a single cardboard package. The overall quantity of non hazardous waste generated in 2008 was 1521.04 tonnes. This is a 42% reduction on the 2007 figure of 2,636.34 tonnes. The reduction in quantity is due to no large scale capital projects completed in 2008 as well as the waste reduction projects undertaken. There have been significant

WYETH BIOTECH CAMPUS 2008 ANNUAL ENVIRONMENTAL REPORT
18
reductions in timber, plastic, cardboard, metal, construction and demolition waste. The quantity of waste recovered in 2008 was 1,172.93 tonnes, compared to 1,626.34 tonnes recovered in 2007. This is a 28% decrease on the quantity recovered in 2007 and indicates that the overall recovery has improved despite the overall quantity of waste reducing. The waste segregation and recovery efforts have had a very positive impact on non hazardous waste with the quantity of waste that is disposed of to landfill decreasing considerable as outlined in Figure 2.4.1 below.
Landfilled Waste
0
10
20
30
40
50
60
Aug'07 Sep'07 Oct'07 Nov'07 Dec'07 Jan'08 Feb'08 Mar'08 Apr'08 May'08 Jun'08 Jul'08 Aug'08 Sep'08 Oct'08 Nov'08 Dec'08
Month
Tonn
es
Landfilled Waste Figure 2.4.1 – Trend of waste disposed of to landfill Aug’07 to Dec’08 The target in the 2008 EMP was to achieve a non hazardous waste recycling rate of 80% by the end of 2008. The overall recycling rate for the year was 77.11%. During 2008 a significant effort was made in improving the % recycling rate and as outlined in Figure 2.4.2 below the recycling rate exceeded the EMP objective for the last 6 months of 2008.

WYETH BIOTECH CAMPUS 2008 ANNUAL ENVIRONMENTAL REPORT
19
% Recycling Rate
0.00
10.00
20.00
30.00
40.00
50.00
60.00
70.00
80.00
90.00
100.00
Aug'07 Sep'07 Oct'07 Nov'07 Dec'07 Jan'08 Feb'08 Mar'08 Apr'08 May'08 Jun'08 Jul'08 Aug'08 Sep'08 Oct'08 Nov'08 Dec'08
Month
% R
ecyc
ling
% Recycling Rate Figure 2.4.1 – Non Hazardous Waste Recycling Rate Aug’07 to Dec’08
In 2009 the Environmental Management Plan has set a target of a non hazardous waste recycling rate of 90% by the end of 2009. In addition to increasing the non hazardous waste recycling rate a target has also been set to continue working with our suppliers to reduce packaging were possible.
2.4.2.2 Hazardous Waste
The approved hazardous waste contractor for the Campus, Indaver Ireland Ltd. (EPA Waste Licence Reg. No. 36-2), handles all hazardous waste generated on-site. This hazardous waste is primarily transferred to AVG Ltd for incineration under the authority of the Environment Agency of the City of Hamburg (permit No. E2310/AVG-GENB). Table 2.7 summarises the waste contractors and ultimate disposal/recovery sites for all hazardous wastes generated at the Campus. These sites are all permitted and fully appropriate to accept the consigned waste streams from the Campus. In accordance with internal procedures, documentation confirming acceptance and disposal/recovery of all hazardous waste streams transferred from the Campus are retained on-site for inspection. These procedures also allow for full reconciliation of hazardous waste loads leaving the site. No waste was consigned from the site for recovery abroad as a ‘Green List’ waste. There were no rejected waste consignments during 2008. There was no waste mixing as described in Condition 7.6 during 2008.

WYETH BIOTECH CAMPUS 2008 ANNUAL ENVIRONMENTAL REPORT
20
On-site treatment of biohazardous waste occurs in accordance with Condition 7.8 of the IPPC Licence and Condition 6 of the Consent Conditions for GMO Register No. 142. All Class 1 GMM solid waste material is inactivated on-site by verified autoclaves. This inactivated material is then classified as non-hazardous and at present is transferred to Germany for incineration. Other biohazardous waste generated in the laboratory areas of the site is occasionally transferred to Eco-Safe Systems Ltd (EPA Waste Licence No. 54-2) where it is shredded, autoclaved and subsequently landfilled to authorised disposal sites in Ireland. The total quantity of hazardous waste generated on-site in 2008 represents a 35% increase on the 2007 AER reporting period. The large increase is due to material that was either past its expiry date or material that was purchased for the Enbrel ISPHA manufacturing process and was no longer required. Table 2.8 below details the quantity of waste by EWC Code that was disposed of in this category.
TABLE 2.8: HAZARDOUS WASTE GENERATION – EXPIRED WASTE
EWC Code Waste Type Quantity (metric tonnes)
060106* Acidic Waste 4.84 060205* Basic Waste (caustic) 25.69 070504* Organic solvent waste (non-halogenated) 5.94 070513* Contaminated Packaging 57.60 160506* Lab Waste (containing mixtures of lab chemicals) 99.00
Total 193.07
If this expired waste was removed from the overall quantity of hazardous waste produced in 2008, the amount of sustaining waste created would have been 256.68 tonnes, which is 23% decease when compared to 2007. The creation of expired waste is a once off event and is unlikely to reoccur and therefore the 23% reduction compared to the 2007 figure is more reflective of the waste reduction work that was completed in 2008. In conjunction with the non hazardous waste reviews, reviews of hazardous waste generation activities were completed. This was a very successful process and it identified opportunities for reduction of hazardous waste. Reviews in the Warehouse and of site cleaning and sanitising activities revealed that non hazardous waste was being disposed of as hazardous. A series of area specific posters were created to provide people with greater guidance on waste disposal. This resulted in a significant reduction in the quantity of solid hazardous waste being generated. Reviews of raw material and finished product test in the QA/QC and Development laboratories indicated that the waste material from the testing assays were being disposed of as hazardous liquid waste. A series of area specific posters again were created to provide people with greater guidance on waste disposal. This resulted in a significant reduction in the quantity of liquid hazardous waste being generated by the laboratories.

WYETH BIOTECH CAMPUS 2008 ANNUAL ENVIRONMENTAL REPORT
21
Waste disposal posters were also created for Drug Substance, Manufacturing Suites and Engineering Areas. These also contributed to an overall reduction in hazardous waste generation. Empty but unclean plastic bottles and drums were identified as a significant waste stream. These containers were shipped off site as hazardous waste to Agency approved outlets. Some of these containers were required to be packed in UN approved steel drums as the orginial containers were not UN approved, this was a very inefficient means of disposing of this waste stream. The waste management procedure for the Campus allows these containers to be triple rinsed and Agency approval was obtained on the 21 Sep 05. A triple rinse drum washer was installed in the Warehouse Satellite Waste Location to triple rinse containers that previously contained caustic or acid material, to decontaminate them. It allows 4 containers between 4L and 25L to be triple rinsed. These containers can then be sent in the non hazardous plastic waste stream for recycling. The waste water is directed to the process waste neutralisation tank before being discharged to the Ringsend waste water treatment plant. This project has been very successful in 2008 with over 5,500 containers being diverted from the hazardous waste stream. An electronic waste tracking system for hazardous waste was reviewed in 2008. A system was chosen, process flows for each hazardous waste type were created, hardware (weighing scales, scanners, and computers) and software to allow the waste tracking system to work were installed. The system will be effective from Q2’09. More information on the process of achieving this objective is outlined in section 3.12.
2.5 Groundwater Monitoring
2.5.1 Groundwater Monitoring Overview and Results Annual monitoring of groundwater is required in accordance with Condition 9.3 of the IPPC Licence for the Campus. In 2008 groundwater monitoring was conducted on the seven groundwater monitoring wells at the Campus (refer to Table 2.9 below and Appendix 1 for locations) on two occasions (14FEB08 and 10SEP08). A Waterra inertial lift pump system was used to evacuate all of the monitoring wells. Separate tubing and foot valves were used at each monitoring well to eliminate the possibility of cross contamination. Field measurements were taken at the time of sampling and samples were taken for laboratory analysis (refer to Table 2.10 below).
The samples were analysed for a range of inorganic, organic and metal parameters. The results of monitoring and analysis for the 10SEP08 sampling event are presented in Tables 2.10 to 2.13 below. Refer to Appendix 2 for historical groundwater results at the site including those for February and September 2008.

WYETH BIOTECH CAMPUS 2008 ANNUAL ENVIRONMENTAL REPORT
22
TABLE 2.9: GROUNDWATER MONITORING WELL LOCATION DESCRIPTION Borehole ID Location Description Grid Reference Upgradient/Downgradient*
BH-1 North west boundary E304151, N231975 Downgradient BH-2 North east boundary E304164, N231960 Downgradient BH-3 Western boundary E304047, N231609 Cross gradient BH-4 Eastern boundary E304479, N231747 Cross gradient BH-5 South western boundary E304307, N231132 Up gradient BH-6 South eastern boundary E304611, N231212 Up gradient BH-7 Centre of site – CUB Yard E304272, N231675 Centre of site
Note: * Location of borehole with respect to dominant north – northwest groundwater flow direction.
TABLE 2.10: RESULTS OF FIELD MEASUREMENTS TAKEN AT EACH MONITORING WELL Borehole ID Total Depth
(mbpl)* Static Water Level (mbpl)*
Recharge Rate
(cm/min)
Temperature (°C)
DO (mg/l) Redox (mV)
Conductivity (mS/cm @25°C)
BH-1 10.48 3.77 <2 13.4 6.65 193 7.80 BH-2 10.24 3.2 Instant 13.0 5.64 253 3.34 BH-3 10.56 3.67 4 12.8 4.07 182 4.23 BH-4 9.64 4.2 Instant 12.2 2.34 212 2.89 BH-5 12.76 6.32 Instant 11.3 6.3 195 2.88 BH-6 10.56 3.52 Instant 12.0 7.26 250 2.12 BH-7 9.6 2.25 Instant 16.8 1.61 111 4.44
Note: * mbpl – meters below stand pipe level
TABLE 2.11: RESULTS OF ORGANICS ANALYSIS OF GROUNDWATER
Parameter BH-1 BH-2 BH-3 BH-4 BH-5 BH-6 BH-7 Interim Guideline Value
* (µg/l)
USEPA** (ug/l) <10 <10 <10 <10 <10 <10 <10 -
Methanol (mg/l) <0.5 <0.5 <0.5 <0.5 <0.5 <0.5 <0.5 -
Ethanol (mg/l) <0.5 <0.5 <0.5 <0.5 <0.5 <0.5 <0.5 -
Acetone (mg/l) <0.5 <0.5 <0.5 <0.5 <0.5 <0.5 <0.5 -
Acetonitrile (mg/l) <0.5 <0.5 <0.5 <0.5 <0.5 <0.5 <0.5 -
IPA (mg/l) <0.5 <0.5 <0.5 <0.5 <0.5 <0.5 <0.5 -
Note: * Interim Guideline value = Taken from “TOWARDS SETTING GUIDELINE VALUES FOR THE PROTECTION OF GROUNDWATER IN IRELAND” ** No compounds listed on the USEPA 542.2 list were detected at concentrations greater than 10µg/l.

WYETH BIOTECH CAMPUS 2008 ANNUAL ENVIRONMENTAL REPORT
23
TABLE 2.12: RESULTS OF INORGANIC CHEMICAL ANALYSIS OF GROUNDWATER Parameter BH-1 BH-2 BH-3 BH-4 BH-5 BH-6 BH-7 Interim
Guideline Value*
pH (pH units) 7.6 7.7 7.8 7.5 7.5 7.7 7.7 ≥6.5 and ≤9.5 Conductivity (µS/cm@25ºC) 3120 1516 1770 1399 1364 907 1661 1000µS/cm
COD (mg/l) <10 28 <10 13 <10 25 12 -
Ammonia as N (mg/l) <0.02 <0.02 <0.02 <0.02 <0.02 <0.02 1.97 0.13mg/l
Nitrate as N (mg/l) 3.21 2.34 0.37 0.52 <0.2 3.79 13 5.65mg/l
Nitrite as N (mg/l) <0.02 <0.02 <0.02 <0.02 <0.02 <0.02 <0.02 0.03mg/l Total Kjeldahl Nitrogen (mg/l) 3.3 2.6 <1.0 <1.0 <1.0 3.9 15 -
Total Alkalinity (CaCO3 mg/l) 158 241 189 270 325 213 199 -
Fluoride (mg/l) 0.22
0.25
0.28 0.16 0.25 0.14 0.62 1.0mg/l
Chloride (mg/l) 641 103 247 106 30 11 182 30mg/l
Sulphate (mg/l) 237 327 258 254 332 221 260 200mg/l
Phosphate as P (mg/l) <0.01 0.01 <0.01 <0.01 <0.01 <0.01 0.41 -
Sodium (mg/l) 313.5 85.2 154.8 34.9 21.5 11.2 170.7 150mg/l
Magnesium (mg/l) 14.87 10.59 12.67 23.92 25.63 7.15 11.98 50mg/l
Potassium (mg/l) 3.4 2.1 2.8 2.2 1.1 2.4 7.1 5mg/l
Calcium (mg/l) 246.5 199.1 163.5 198.3 224 153.9 138.9 200mg/l Note: * Interim Guideline value = Taken from “TOWARDS SETTING GUIDELINE VALUES FOR THE PROTECTION OF GROUNDWATER IN IRELAND”
TABLE 2.13: RESULTS OF METAL ANALYSIS OF GROUNDWATER
Parameter (µg/l) BH-1 BH-2 BH-3 BH-4 BH-5 BH-6 BH-7 Interim
Guideline Value* (µg/l)
Beryllium <1 <1 <1 <1 <1 <1 <1 -
Aluminium 11 <2 82 5 101 7 <2 200
Chromium 8 3 2 2 2 2 1 30
Manganese <1 2 <1 2 29 <1 23 50
Cobalt <1 <1 <1 <1 <1 <1 <1 -
Nickel 5 4 7 5 17 4 17 20
Copper 1 2 5 3 1 <1 4 30
Zinc <1 <1 19 1 9 <1 9 100
Arsenic <1 <1 <1 <1 <1 <1 2 10
Selenium 2 <1 <1 <1 <1 <1 2 -

WYETH BIOTECH CAMPUS 2008 ANNUAL ENVIRONMENTAL REPORT
24
Silver <2 <2 <2 <2 <2 <2 <2 -
Cadmium <0.4 <0.4 <0.4 <0.4 <0.4 <0.4 <0.4 5
Tin <1 <1 <1 <1 1 <1 <1 -
Antimony <1 <1 <1 <1 7 <1 <1 -
Barium 105 55 47 75 68 38 46 100
Lead <1 <1 <1 <1 <1 <1 <1 10
Iron (mg/l) <2 <2 <2 <2 <2 <2 <2 200
Mercury <0.05 <0.05 <0.05 <0.05 <0.05 <0.05 <0.05 1
Boron <3 11 37 <3 15 10 <3 1000 Note: * Interim Guideline value = Taken from “TOWARDS SETTING GUIDELINE VALUES FOR
THE PROTECTION OF GROUNDWATER IN IRELAND”
2.5.2 Description of Groundwater Monitoring Results Tables 2.9 – 2.13 present the groundwater field and analytical results for monitoring conducted on the 10SEP08. Appendix 2 presents historical results from Apr05, Oct05, Apr06, Oct06, Apr07, Sep07, Feb08 & Sep08 for the 7 No. boreholes (BH) installed at the site.
Field data collected at all locations (refer to Table 2.9) indicate aerobic groundwater conditions within all wells sampled. This is demonstrated by dissolved oxygen results of generally between 1.61 and 6.65 mg/l and redox potential results generally between +111mV Eh and +253mV Eh. Temperature readings from groundwater extracted from all wells varied between 12oC and 16.8oC.
Results for all monitoring events at all groundwater wells indicate samples were free from organic contamination. This was demonstrated by the less than detection limits recorded for the USEPA and GC-FID methods selected. In addition, all results were free from metal/heavy metal contamination.
The dominant groundwater flow direction for the site, inferred during initial site investigations, is between north and northwest.
BH-5 and BH-6 are located up-gradient of the dominant groundwater flow though the site. With respect to the EPA Interim Guideline values historic results for these boreholes indicate elevated concentrations of sulphate (range 145mg/l – 738mg/l) and conductivity (range 678 – 1881 µS/cm).
Cross gradient boreholes BH-3 and BH-4 are located at the western and eastern boundaries of the site respectively. Analytical results obtained from these locations since March 2004 indicate the presence of marginally elevated

WYETH BIOTECH CAMPUS 2008 ANNUAL ENVIRONMENTAL REPORT
25
concentrations of sulphate (range 164 mg/l – 520 mg/l), chloride (range 69 – 1073 mg/l) and conductivity (range 792 – 4260 µS/cm).
BH-7 is located within the Central Utility Building (CUB) yard on site. Elevated analyte concentrations at this location included conductivity (range 502 – 2194 µS/cm), sulphate (range 91 – 854mg/l), chloride (range 18 – 267 mg/l), ammonia-N (range 0.04 – 2 mg/l) and potassium (range 4 – 8.5 mg/l).
BH-1 and BH-2 are located in the northwest and northeast corners of the site respectively and are down-gradient of the dominant groundwater flow. With respect to the EPA Interim Guideline values historic results for these boreholes indicate marginally elevated concentrations for Conductivity (range 1115 – 3060 µS/cm), sulphate (range 262 – 660 mg/l) and chloride (range 37 – 712 mg/l).
2.5.3 Interpretation of Groundwater Monitoring Results
The description of groundwater results presented above indicates marginally elevated baseline concentrations for sulphate and chloride across the site in 2008. Down-gradient borehole locations particularly BH-7, BH-1 and BH-2 on occasion have demonstrated results for these parameters above those obtained for the up-gradient wells (i.e. BH-5 and BH-6). In addition BH-7 has indicated marginally elevated concentrations of ammonia-N.
The source of the elevated chloride, sulphate and manganese is unknown and may be attributed to natural geochemical conditions which may be subject to saline intrusion.
Importantly there is no supporting data from the results obtained to indicate any contamination load from site activities to the local groundwater resource. For example pH results have not fluctuated significantly (i.e. range 7.1 – 8.3 pH units) and groundwater samples extracted in the field have been aerobic (i.e. DO range 4 – 6 mg/l and + Eh potentials). This data and all inorganic analyte data does not support any subsurface geochemical or biogeochemical activity, mediated by contaminants, impacting redox distribution or oxygen zonation within the site.
In addition, there are no recorded site incidents that could potentially contribute to the marginally elevated results obtained. There have been no major spill events on site, tank/vessel ruptures or major underground line fractures. All tanks and bunds are subject to 3 yearly integrity testing. Underground trade and foul effluent lines have been inspected over the last three years following initial installation inspections. While minor fractures have been noted these are not considered environmentally significant.

WYETH BIOTECH CAMPUS 2008 ANNUAL ENVIRONMENTAL REPORT
26
Overall, the results of analysis conducted for the 7 No. groundwater samples extracted from the Campus indicate no impact to the underlying groundwater quality from on-site activities.
2.6 Noise Monitoring
2.6.1 Noise Monitoring Overview The Campus was visited by a Bord na Móna Environmental scientist on the 11
and 12 Oct 08, to conduct the annual noise survey for 2008. L(A)eq, L(A)10,, L(A)90
values and 1/3 Octave band analysis was determined at all six boundary monitoring locations (N1-N6) (refer to Appendix 3 for noise monitoring locations). The noise survey incorporated both daytime and nighttime measurements and results are presented in Tables 2.14 and 2.15, respectively.
TABLE 2.15: NIGHT TIME NOISE MEASUREMENT RESULTS
Location No.
Measurement Period (min.)
Sampling Time
Leq dB(A)
L10 dB(A)
L90 dB(A)
N1 15 22:41 50.2 53.1 46.5 N2 15 22:22 48.0 49.5 40.5 N3 15 22:02 46.0 47.7 44.0 N4 15 23:04 47.3 49.4 43.7 N5 15 23:24 46.6 48.3 43.3 N6 15 23:48 63.2 66.2 47.0
2.6.2 Day Time Noise The noise levels recorded at the six boundary locations (N1- N6) during the daytime noise survey ranged from 53.9dB(A) at N2 to 72.1dB(A) at N6. Elevated noise levels i.e. levels above 55dB(A) were recorded at locations N1, N4 and N6.
For Location N1 (Leq 56.2dB(A)) a refuse truck passed by the noise meter twice, this along with constant off site traffic are the main contributory noise sources. The noise levels recorded at location N4 (Leq64dB(A)) were due to a combination of traffic from the external Nangor Road and the Outer Ring Road and off-site construction noise in the distance. At location N6 (Leq 72.1dB(A)) constant heavy traffic from the Outer Ring Road and from within the Grange Castle Business Park were the main contributory noise sources.
However, given the fact that monitoring locations N1, N4 and N6 are not situated within 300m of any noise sensitive location (NSL), and that no audible noise was detected emanating from the Wyeth facility at these locations, the elevated levels
TABLE 2.14: DAY TIME NOISE MEASUREMENT RESULTS
Location No.
Measurement Period (Min.)
Sampling Time
Leq dB(A)
L10 dB(A)
L90 dB(A)
N1 15 10:12 56.2 56.4 46.9 N2 15 09:48 23.9 54.0 45.5 N3 15 10:35 54.2 56.7 43.9 N4 15 10:58 64.0 66.1 45.0 N5 15 11:18 47.3 50.0 43.1 N6 15 11:59 72.1 77.0 60.8

WYETH BIOTECH CAMPUS 2008 ANNUAL ENVIRONMENTAL REPORT
27
detected are unlikely to have impacted on any of the noise sensitive locations. It is also important to note that between locations N4 and N6 there is a six meter high berm located between the Wyeth facility and the outer ring road and the nearest noise sensitive receptor. At locations N2, N3 and N5, traffic from the main campus road and Outer Ring Road, lawnmowers operating in the area, and aircraft flying overhead were the main contributors to noise levels.
2.6.3 Night Time Noise The nighttime noise levels taken during the October survey ranged from 46.0dB(A) at N3 to 63.2dB(A) at N6. Elevated levels (>45dB(A)) were recorded at all locations (N1-N6). However, for all locations, passing traffic from around the Grange Castle Business Park and Outer Ring Road, along with aircraft flying over head were the main noise sources. At location N3 the air extraction fans and at location N5 the low humming from the Bord Gais AGI facility were also noise contributing sources.
As stated for the levels recorded for daytime noise, no audible noise was detected emanating from the Wyeth facility at these locations and so it is unlikely that these noise levels will impact upon any noise sensitive locations during nighttime hours in the vicinity of the Campus.
2.6.4 Tonal Noise Tonal noise was not detected at any location during the daytime noise monitoring. Tonal noise, at 25Hz, was observed at location N6 during the nighttime noise monitoring. On-site notes from the noise monitoring suggest that the source of the tonal noise was from a car engine left idle in the area for a number of minutes during the monitoring event.
2.6.5 Interpretation of Noise Results The noise-monitoring event demonstrated that noise sources from the Campus did not have any adverse impact on the surrounding environment. Site related traffic has the most potential to adversely affect the noise at nearest sensitive locations situated near the main Grange Castle Business Park entrance during the day. However, given the fact that the monitoring locations are not situated within 300 metres of any nearest noise sensitive location, it is unlikely to have any impact. The results of the 2008 survey are similar to previous monitoring results and there has been no determinable increase in noise levels.

WYETH BIOTECH CAMPUS 2008 ANNUAL ENVIRONMENTAL REPORT
28
2.7 Agency Monitoring and Enforcement
2.7.1 IPPC Licence On 09 May 2008 Euro Environmental Services on behalf of the Agency carried out monitoring of the air emissions from the Wyeth Campus. All results were in compliance with our Emission Limit Value (ELV’s) outlined in our IPPC Licence. An inspector from the Agency conducted an unannounced site inspection on the 18 August 08. The inspection consisted of a tour of the Campus, review of documentation and interviews with employees. There were no non-compliances observed as part of the inspection. The inspection report noted that the site has a good history of compliance with IPPC Licence conditions. The inspection report also noted several environmentally beneficial additions to the site since the last Agency inspection, i.e. Odour Abatement System, Non-Hazardous Waste Compound and the Triple Rinse Drum Washer. Four observations were documented as part of the inspection. These observations were not classified as non-compliances and were cited by the Agency as items to ensure compliance, improvements to performance and clarification on topics. Wyeth submitted responses to these observations to the Agency on 25 August 2008 and 12 December 2008.
2.7.2 GMM (Genetic Modified Microorganism) EPA Consent On 21 February 2008 the Agency conducted an inspection of the Campus for compliance against the GMO Registry No. 142. The inspection consisted of a tour of the Grange Castle Campus contained use areas, review of documentation and interviews with employees who interact with GMM. There were no non-compliances and no observations noted as part of the audit.
2.8 Environmental Complaints There were no environmental complaints received at the Campus for the period January to December 2008.
2.9 Environmental Incidents There were no IPPC Licence non-compliances at the Campus during the period January to December 2008.
There were 2 events reported to the Agency in 2008. Table 2.16 below provides summary details of the events, the root cause and corrective actions implemented to ensure that the events do not reoccur. Both events were considered to have negligible environmental significance and there were no environmental impacts.

WYETH BIOTECH CAMPUS 2008 ANNUAL ENVIRONMENTAL REPORT
29
TABLE 2.16: ENVIRONMENTAL EVENTS 2008
Date Event Root Cause Corrective Action Environmental Significance
01Jul08
Elevated pH in surface water discharge as a result of a leak of approximately 1L of a caustic based boiler water treatment chemical.
Leak from 6mm plastic tubing
• Repair of the plastic tubing.
• Review of the chemical storage tanks and replacement of the tanks for a more robust design.
Negligible
18Dec08
A leak of hydraulic oil in the CUB Yard from a non hazardous waste collection truck.
Failure of hydraulic hose.
• Spill cleaned Negligible
2.10 Energy Consumption Tables 2.17 to 2.19 detail the natural gas, gas oil and electricity consumed at the Campus for the period January to December 2008. Refer to Section 4.9 for an analysis of energy usage at the site in addition to details on various energy initiatives and energy reduction measures being undertaken.
TABLE 2.17: NATURAL GAS USAGE (MWh) Quarter Usage Points
Q1 Q2 Q3 Q4
Total
Boilers 35,867.8 31,861.9 27,410.2 35,368.9 130,508.8 Kitchen 14.23 14.87 14.95 15.92 59.98 Total 38,882 31,876.8 27,425.2 35,384.8 130,568.8
TABLE 2.18: CAMPUS GAS OIL USAGE (m3) Quarter
Q1 Q2 Q3 Q4
Total
25.6 9.9 13.5 10.1 59.1
TABLE 2.19 CAMPUS ELECTRICITY USAGE (MWh)
Quarter
Q1 Q2 Q3 Q4
Total
22,079.4 22,628.8 23,167.4 22,111.2 89,986.8

WYETH BIOTECH CAMPUS 2008 ANNUAL ENVIRONMENTAL REPORT
30
2.11 Water Consumption Table 2.20 details the water consumption at the Campus for 2008. The source of this total water consumption data is from an incoming flow meter to the site operated by South Dublin County Council. Section 4.8 presents a water conservation report for the Campus and details the progress made in minimising water demand and the volume of trade effluent discharge in 2008.
TABLE 2.20: WATER USAGE Water Usage (m3) Total
Campus Usage 618,729

WYETH BIOTECH CAMPUS 2008 ANNUAL ENVIRONMENTAL REPORT
31
3.0 MANAGEMENT OF THE ACTIVITY This section of the AER presents an update on work undertaken and work planned on Campus in achieving continual environmental improvement. Continual improvement at the Campus is managed through the Environmental Management Programme (EMP). The progress made in achieving the many objectives and targets set within the EMP for 2008 is presented within Section 3.1. In order to build on the successes achieved, Section 3.2 presents the EMP proposal for 2009.
3.1 Environmental Management Programme Report
3.1.1 Environmental Management Programme 2008 Overview In accordance with Condition 2.3.2 an Environmental Management Programme (EMP) report 2008 for the Campus is presented below. The information updates the progress achieved on each 2008 EMP action. The status column outlines if actions were completed or remain open or are in progress. Open actions refer to actions that have extended beyond the initial due date. In progress actions refer to action due dates extending beyond December 2008.
3.1.2 Summary Data on EMP Achievement vs. Target
The following summarises the number of objectives, targets and actions set for 2008. In addition, the number of actions completed against those actions not completed before the end of 2008 are outlined. Number of Objectives: 11 Number of Targets: 32 Number of Actions: 110

WYETH BIOTECH CAMPUS 2008 ANNUAL ENVIRONMENTAL REPORT
32
Table 3.1.1 Environmental Aspect 1: Emissions to Surface Water Aspect Score 05Feb08 - 360 Objective No.1 Target Action Update 2008 AER Status
1.1.1 Develop drill scenario for large scale spill with Input from EHS. 1.1.2 Run drill with the EO. 1.1.3 Observe the outcomes and decisions made during the drill. 1.1.4 Review drill and learnings.
To ensure in the event of a spill that there is an effective spill response to protect soil, surface water and groundwater.
1.1 Complete a large scale spill response drill
1.1.5 Implement corrective actions from learnings.
Drill completed for a biohazardous spill. The drill was successfully run over 4 shifts to ensure all ERT members covered. Learnings have been reviewed by the Emergency Organisation (EO) subcommittee for inclusion in training.
Complete
Table 3.1.2 Environmental Aspect 2: Emissions to Waste Water Aspect Score 05Feb08 - 612 Objective No.2 Target Action Update 2008 AER Status
2.1.1 Set the scope of the project. 2.1.2 Gather all supporting information 2.1.3 Determining what external resources are required 2.1.4 Obtain funding
To ensure that waste water treatment will not restrict future Campus expansion.
2.1 Complete a waste water treatment feasibility study
2.1.5 Complete report and summarise findings to the CLT
Completed waste water treatment feasibility study on current and future waste water treatment requirements. Presented the findings of the study to senior management.
Complete
Table 3.1.3 Environmental Aspect 3 : Noise Emissions Aspect Score 05Feb08 – 200 Objective No.3 Target Action Update 2008 AER Status No objectives – due to low score and no change to the score.

WYETH BIOTECH CAMPUS 2008 ANNUAL ENVIRONMENTAL REPORT
33
Table 3.1.4 Environmental Aspect 4: Emissions to Atmosphere Aspect Score 05Feb08 – 680 Objective No.4 Target Action Update 2008 AER Status
4.1 Ensure the CHP complies with all licence requirements.
4.1.1 Complete contract with CHP vendor. 4.1.2 Complete design review of the proposed CHP plant. 4.1.3 Ensure CHP unit is capable of meeting IPPC licence conditions. 4.1.4 Ensure emissions trading permit is updated and additional carbon credits requested. 4.1.5 Develop detailed construction and commissioning plan for the installation. 4.1.6 Submit a commissioning test programme for the CHP unit to the Agency. 4.1.7 Execute the construction and commissioning plan. 4.1.8 Submit the commissioning test results to the Agency. 4.1.9 Operate the CHP after receiving approval from the Agency. 4.1.10 Remove the temporary fourth boiler.
Contract signed with CHP vendor and detail design has been completed. Installation due to commence in Q1’09. The CHP is capable of meeting the limits set out in the IPPC Licence for air emissions. An application for additional carbon credits has been submitted to the EPA. The commissioning test programme will be submitted to the Agency and executed once approved by the Agency. The temporary fourth boiler will be removed once the CHP is operational.
In Progress To ensure that all proposed new equipment with significant air emissions comply with IPPC Licence and Emissions Trading Permit conditions.
4.2 Ensure the 4th emergency generator complies with all licence requirements.
4.2.1 Ensure emissions trading permit is updated. 4.2.2 Develop commissioning plan for the installation. 4.2.3 Execute the commissioning plan 4.2.4 Update EWIE for operating and testing the generators.
Emissions trading permit was updated and the emergency generator was installed and the procedure for operating and testing the generators was updated.
Complete

WYETH BIOTECH CAMPUS 2008 ANNUAL ENVIRONMENTAL REPORT
34
Table 3.1.5 Environmental Aspect 5: Fugitive Emissions to atmosphere Aspect Score 05Feb08 – 1071 Objective No.5 Target Action Update 2008 AER Status
5.1 Review the impact on fugitive emissions due to the introduction of pre-saturated IPA wipes for cleaning and sanitisation.
5.1.1 Review the quantity of pre-saturated wipes and spray bottles consumed. 5.1.2 Review the administrative controls implemented on the use of IPA spray bottles. 5.1.3 Develop a sampling programme to determine fugitive emissions of pre-saturated wipes and IPA spray bottles. 5.1.4 Document the findings as part of the Solvent Management Plan.
The quantity of pre saturated IPA wipes and spray bottles have been tracked over the year to see if the administrative controls detailing that pre saturated IPA wipes are to be used for certain tasks. Sampling programme was developed and executed to determine fugitive emissions. Findings documented in the Solvent Management Plan.
Complete To ensure that all opportunities for fugitive emissions reduction are reviewed and implemented if feasible
5.2 Review the impact on fugitive emissions due to the change in glacial acetic acid delivery.
5.2.1 Review glacial acetic acid vessel transfer vessel options. 5.2.2 Review the feasibility of getting glacial acetic acid delivered in larger containers that can be delivered straight to manufacturing without dispensing. 5.2.3 Calculate the fugitive emissions on the vessel or container transfer. 5.2.4 Document the findings as part of the Solvent Management Plan.
The glacial acetic acid vessel was not utilised. Larger dispenses container volumes were used (20L instead of 10L) , this reduced the dispense time from 6 hours to 2 hours with a reduction in fugitive emissions. These changes have been documented in the Solvent Management Plan.
Complete

WYETH BIOTECH CAMPUS 2008 ANNUAL ENVIRONMENTAL REPORT
35
Table 3.1.6 Environmental Aspect 6: Hazardous Waste generation and disposal Aspect Score 05Feb08 - 756 Objective No.6 Target Action Update 2008 AER Status
6.1 Investigate the implementation of a hazardous waste tracking and labelling system
6.1.1 Complete project charter for the feasibility of implementing the waste tracking system. 6.1.2 Complete process flows for the current waste process and update the process to reflect the waste tracking tool. 6.1.3 Present the proposed implementation plan to senior management to implement the project. 6.1.4 Based on management approval implement a pilot study/full scale roll out of the system.
Project charter completed and a basis of design for the electronic waste tracking system was created. Process flow for the process developed. Costing completed and proposal agreed by senior management. All hardware and software installed. System tested in Jan’09 – system to go live in April ’09.
In Progress
6.2 Review waste reduction opportunities in each PPU/area
6.2.1 Facilities Managers and Eng Site Services to liaise with the following areas to document waste reduction opportunities 6.2.1.1 Warehouse 6.2.1.2 QA/QC and Pilot Lab 6.2.1.3 Drug Substance 6.2.1.4 CUB and Engineering 6.2.1.5 Vaccines Conjugation, Vial Fill Finish and Syringe Fill Finish
Completed hazardous and non hazardous waste reviews of all areas on site and identified opportunities for waste reduction/minimisation.
Complete
To have a robust and efficient hazardous waste disposal process.
6.3 Implement the identified waste reduction opportunities
6.3.1 Develop a register of waste reduction opportunities based on the items documented in target 6.2. 6.3.2 Implement the waste reduction projects based on the best return on investment. 6.3.3 Audit waste produced to ensure that the correct disposal route is being used.
Register of opportunities developed and opportunities for waste reduction were implemented. As part of area EHS audits the disposal of waste was reviewed and actions required were issued and tracked.
Complete

WYETH BIOTECH CAMPUS 2008 ANNUAL ENVIRONMENTAL REPORT
36
6.4 Install and commission the drum wash system.
6.4.1 Install drum wash unit and connect utilities. 6.4.2 Commission the unit and develop operating parameters. 6.4.3 Operate the unit and track the waste diverted from hazardous to non hazardous waste.
Drum washer installed and connected to water supply, electricity and process waste. Unit commissioned and procedure developed for triple rinsing containers. Over 5,500 containers were triple rinsed and diverted from hazardous waste to non hazardous waste in 2008.
Complete
Table 3.1.7 Environmental Aspect 7: Non-Hazardous Waste generation – recovery/disposal Aspect Score 05Feb08 – 684 Objective No.7 Target Action Update 2008 AER Status
7.1 Make the non hazardous waste compound operational and make better use of compactors and balers – use non hazardous waste compound as central waste point and transport all waste to this central area.
7.1.1 Install equipment skips and bins in the compound. 7.1.2 Make all wheelie bins transportable over larger distances with larger wheels and obtain buggy to transport the wheelie bins.
Installed balers, compactors and skips in the non hazardous waste compound and made it operational. Wheelie bins were modified to allow them to be towed around the site. A tail lift van was introduced to allow all non hazardous waste to be centralized in the non hazardous waste compound.
Complete To achieve a non hazardous waste recycling rate of 80% by end of 2009.
7.2 Review waste reduction opportunities in each PPU/area.
7.2.1 Facilities Managers and Eng Site Services to liaise with the following areas to document waste reduction opportunities 7.2.1.1 Warehouse 7.2.1.2 QA/QC and Pilot Lab 7.2.1.3 Drug Substance 7.2.1.4 CUB and Engineering 7.2.1.5 Vaccines Conjugation, Vial Fill Finish and Syringe Fill Finish
Completed hazardous and non hazardous waste reviews of all areas on site and identified opportunities for waste reduction/minimisation.
Complete

WYETH BIOTECH CAMPUS 2008 ANNUAL ENVIRONMENTAL REPORT
37
7.3 Implement the identified waste reduction opportunities
7.3.1 Develop a register of waste reduction opportunities based on the items documented in target 7.2. 7.3.2 Implement the waste reduction projects based on the best return of investment. 7.3.3 Audit waste produced to ensure that the correct disposal route is being used.
Register of opportunities developed and opportunities for waste reduction were implemented. As part of area EHS audits the disposal of waste was reviewed and actions required were issued and tracked.
Complete
7.4 Look at opportunities to reduce packaging on incoming parts/consumables and raw materials.
7.4.1 Develop a project charter to investigate the opportunities for reducing packaging on incoming parts, consumables and raw materials.
Opportunities for reducing packaging were investigated with supply chain partners & vendors. Changes in how filters are packaged have been implemented that reduces the quantity of cardboard packaging supplied.
Complete
Table 3.1.8 Environmental Aspect 8: Water Usage and conservation Aspect Score 05Feb08 – 540 Objective No.8 Target Action Update 2008 AER Status
8.1 Install water meters and set up a reporting format to allow water use per area to be tracked and monitored.
8.1.1 Mechanical install of pipework and meters. 8.1.2 Data reporting system configuration development and implemented. 8.1.3 Communicate the application to the water users on the site.
Installation of the additional pipework and meters was completed and the meters were linked to the data reporting system called WAP. The application was communicated to users as part of the application training and EHS Week.
Complete To have a monitoring and measurement process to identify water saving opportunities
8.2 Develop Water Use Key Performance Indicators (KPIs) for each PPU/Support building.
8.2.1 Trend water usage using new metering and reporting format over a quarter. 8.2.2 Develop baseline water usage data for each meter. 8.2.3 Develop a process with building managers to monitor water trends and investigate elevated consumption.
Water usage is trended automatically on the system. The baseline water data is being completed and further work will be completed on this and the process for trending and reviewing consumption in ’09.
Complete

WYETH BIOTECH CAMPUS 2008 ANNUAL ENVIRONMENTAL REPORT
38
8.3 Identify areas for investigation for water reduction opportunities.
8.3.1 Based on water usage trends review the water saving opportunities. 8.3.2 Develop a list of projects to be implemented and obtain capital to implement the projects prioritised on return on investment.
One waste water stream has been identified approx. 40 m3 of Industrial Water will be reduced by the removal of a quench cooler as part of the ongoing upgrade works in Manufacturing Suites. Further investigation will be completed in ’09.
Complete
8.4 Create project plan to implement the reduction opportunities.
8.4.1 Develop project scope and implementation plan for the projects identified in the reduction opportunities.
Plan for implementing the Manufacturing Suites reduction project completed.
Complete
8.5 Reduce Water For Injection (WFI) flushing duration in Drug Substance.
8.5.1 Investigate the sampling failures. 8.5.2 Continue with the change control monitoring programme. 8.5.3 Review the results of the water sampling and monitoring programme. 8.5.4 Decide if the flushing time can be reduced 8.5.5 Calculate the water and energy savings as a result of change.
Sampling failures were investigated and change control monitoring programme was completed. Additional resources are required to validate the system. Projects will be transferred to the 2009 EMP.
In Progress
8.6 Reduce soften water used in the QA/QC Clean Steam System.
8.6.1 Complete trial on the increased conductivity set points on the clean steam system. 8.6.2 Review results and determine if the conductivity can be increased. 8.6.3 Implement change if feasible and quantify the water savings.
Soften water has been reduced by 50% by reducing blow down frequency, increasing the conductivity setpoint and the decreasing the volume of quench water required on the drain cooler.
Complete

WYETH BIOTECH CAMPUS 2008 ANNUAL ENVIRONMENTAL REPORT
39
Table 3.1.9 Environmental Aspect 9: Emissions to Ground Aspect Score 05Feb08 – 98 Objective No.9 Target Action Update 2008 AER Status
9.1 Repair one minor crack to foul sewer line observed as part of 2007 survey.
9.1.1 Appoint repair vendor to repair minor fault. 9.1.2 Reline the pipe with a glass fibre reinforced liner. 9.1.3 Check that the repair has been effective as part of the annual foul sewer survey.
Vendor appointed to repair the minor crack in the foul sewer. Repairs using glass fibre reinforced liner completed and 2008 survey indicated repairs were effective.
Complete
9.2 Complete 3rd party inspection of all bunded areas on site.
9.2.1 Select a vendor to carry out the structural inspection of the bunded areas on site. 9.2.2 Develop a schedule of bunds to be reviewed. 9.2.3 Complete and document bund survey. 9.2.4 Review findings and implement corrective actions. 9.2.5 Report the findings of the bund inspection in the 2008 AER
Vendor selected to carry out the bund survey. Survey completed and list of findings issued. Remediation work scheduled and completed. Review completed on the repairs and final report issued. Section 4.6 of this AER provides more details on the survey.
Complete
To ensure the integrity of all contained chemical storage areas and underground pipes.
9.3 Complete CCTV survey of foul sewer, trade effluent and spill containment pipelines.
9.3.1 Select a vendor to carry out the survey of the pipelines. 9.3.2 Develop a schedule of pipeline survey. 9.3.3 Complete and document pipeline survey. 9.3.4 Review findings and implement corrective actions. 9.3.5 Report the findings of the pipe survey in the 2008 AER.
Vendor selected and CCTV surveys were completed on the foul sewer, trade effluent and spill containment pipes. The finding of the surveys is reported in section 4.5 of this AER.
Complete
Table 3.1.10 Environmental Aspect 10: Raw Materials Aspect Score 05Feb08 – 459 Objective No.10 Target Action Update 2008 AER Status No objective as no opportunities available as present

WYETH BIOTECH CAMPUS 2008 ANNUAL ENVIRONMENTAL REPORT
40
Table 3.1.11 Environmental Aspect 11: Energy Aspect Score 05Feb08 – 1520 Objective No.11 Target Action Update 2008 AER Status
11.1 Continue to develop the energy management system.
11.1.1 Investigate joining the SEI Large Energy Network and signing an agreement with SEI to obtain IS393.
Decision made to continue to develop the energy management system but not sign an SEI energy agreement.
Complete
11.2 Install additional meters and set up a reporting format to allow energy use per area to be tracked and monitored
11.2.1 Specify the meters to be installed on the steam and electrical system. 11.2.2 Obtain capital for the meter installation. 11.2.3 Install the meters once capital is approved. 11.2.4 Complete baseline metering of continuously operating constantly loaded electrical equipment. 11.2.5 Develop a reporting system for steam and gas usage.
All required electrical meters have been installed. The five largest steam users on this system have been identified as the LPHW (Low Pressure Hot Water) skids in the MS, DS, QAQC, Warehouse & CUB buildings. Meters have been purchased to individually monitor these units and feed back energy to both BMS & PCAT. These meters will be installed during periods of low heating requirements in late spring 2009.
In Progress
11.3 Develop Energy Performance Indicators (EPIs) for each PPU/Support building
11.3.1 Based on the data available from reporting system set an appropriate EPI for each area. 11.3.2 Develop a process for investigating energy usage above the EPIs.
Based line data being gathered for electricity. When the steam meters are connected baseline monitoring will be completed. This target will be transferred to the ’09 EMP.
In Progress
To implement an effective energy management system that ensures energy is used efficiently and reduction opportunities are implemented.
11.4 Investigation and implementation of energy reduction opportunities.
11.4.1 Continue to add projects to the Register of Opportunities. 11.4.2 Determine the projects to be implemented 11.4.3 Obtain capital for the project and implement once capital is approved.
Section 4.11 of the 2008 AER details the work completed on energy saving projects.
Complete

WYETH BIOTECH CAMPUS 2008 ANNUAL ENVIRONMENTAL REPORT
41
Table 3.1.12 Environmental Aspect 12: Visual Impact Aspect Score - 100 Objective No.12 Target Action Update 2008 AER Status No objective due to low score and no opportunity for improvement
Table 3.1.13 Environmental Aspect 13: Odour Emissions Aspect Score – 325 Objective No.13 Target Action Update 2008 AER Status To ensure no malodours from the waste water neutralisation system in the CUB yard.
13.1 Install and commission the odour abatement system.
13.1.1 Complete civil and mechanical installation. 13.1.2 Install the abatement unit. 13.1.3 Complete electrical and automation installation. 13.1.4 Complete commissioning and testing of the unit.
Odour abatement system installed and commissioned. The unit has been effective in removal of localised odour in the CUB Yard area.
Complete
Table 3.1.14 Environmental Aspect 14: Hazardous Materials Aspect Score – 480 Objective No.14 Target Action Update 2008 AER Status No objective as no opportunities currently exit for improvement
Table 3.1.15 Environmental Aspect 15: Environmental Management System Aspect Score - 100 Objective No.15 Target Action Update 2008 AER Status
15.1 Maintain certification to ISO 14001:2004.
15.1.1 Host successful surveillance audits by accreditation body.
Completed 3 days of successful surveillance auditing and maintained accreditation to ISO 14001
Complete To ensure the Environmental Management System is functioning and delivering continuous improvement.
15.2 Complete all scheduled EMS audits as per the defined schedule with input from the PPUs.
15.2.1 Develop schedule of EMS audits on the EHS eRoom. 15.2.2 Complete audits and track the audit actions on the corrective action log.
Schedule of internal EMS audits completed and 69 audits were completed and all actions closed.
Complete

WYETH BIOTECH CAMPUS 2008 ANNUAL ENVIRONMENTAL REPORT
42
15.3 Create awareness on energy, water and waste through an environmental awareness campaign.
15.3.1 Complete an awareness campaign around simple changes that can positively impact on energy, water use and waste generation. 15.3.2 Complete the 3rd edition of the Green Link magazine.
An awareness campaign that focused on energy, water, waste. Had a Green Week where the focus was on waste reduction that was complete in 2008, change.ie and the Dublin Transportation Office had stands providing information on climate change and alternative transport to work. Also issued the 3rd edition of the Green Link that provided information on the environmental improvement work completed in 2008.
Complete
15.4 Continue to develop Corporate Social Responsibility (CSR) projects.
15.4.1 Partner with 2 local national schools to achieve Green Flag status. 15.4.2 National Spring Clean – get involved in a local area clean up. 15.4.3 Run a competition with local schools to develop an art installation made from recyclable material.
Continued the relationship with the 2 national schools. Supported national spring clean and ran a competition with local schools on creating art from waste.
Complete

WYETH BIOTECH CAMPUS 2008 ANNUAL ENVIRONMENTAL REPORT
43
3.2 Environmental Management Programme Proposal
3.2.1 Environmental Management Programme 2009 Overview
In accordance with Condition 2.3 an Environmental Management Programme (EMP) proposal for 2009 for the Campus is presented below. The EMP includes Objectives and Targets prepared in accordance with Condition 2.2. The EMP for the Campus derives from the preparation of Environmental Aspects conducted in accordance with ISO: 14001:2004. 15 Environmental Aspects were identified and evaluated in accordance with a standard procedure adopted for development of the Environmental Management System (EMS) for the Campus. The Aspects identified and evaluated are outlined as follows: - Aspect 1: Emissions to Surface water Aspect 2: Emissions to Waste water Aspect 3: Noise Emissions Aspect 4: Emissions to Atmospheric Aspect 5: Fugitive Emissions to Atmosphere Aspect 6: Hazardous Waste Generation and Disposal Aspect 7: Non-Hazardous Waste Generation and Recovery/Disposal Aspect 8: Water Usage and Conservation Aspect 9: Emissions to Ground Aspect 10: Raw Materials Aspect 11: Energy Aspect 12: Visual Impact Aspect 13: Odour Emissions Aspect 14: Hazardous Materials Aspect 15: Environmental Management Aspects are evaluated and scored according to: - • Frequency of Event • Likelihood of loss of Control • Consequence • Legislative and Regulatory Control • Community/Employee Sensitivity • Impact on Air, Land and Water • Cost Benefit • Incidents and Emergency Situations • Potential Resource Depletion The EMP for 2009 has been generated on the basis of the Aspects scored. The environmental aspects were reviewed in January 2009 and changes to aspect scores were applied where compliance performance changed during 2008 or where improved control/procedural measures were implemented. The objectives and targets to be achieved within the EMP are outlined below and include the

WYETH BIOTECH CAMPUS 2008 ANNUAL ENVIRONMENTAL REPORT
44
means and timeframe by which they will be achieved and responsibilities for implementation. All the major environmental aspects on site have long-term programmes associated with them. These include Energy, Water Conservation and Waste Reduction. The 2009 EMP presents many of the shorter-term actions required to achieve continued improvement with the intent that these actions will lead to follow on actions over the next 5 years. Energy, as the highest scored environmental aspect again in 2009, will form the major environmental improvement focus. The approach taken in the EMP proposal and as outlined in Section 4.11 of this AER is to drive energy reduction and conservation through an energy management system. Similar to the 2007 & 2008 EMP Aspect 15 ‘Environmental Management System’ (EMS) has been included in order to track progress on maintaining and improving on the EMS (accredited to ISO 14001:2004) at the site.

WYETH BIOTECH CAMPUS 2008 ANNUAL ENVIRONMENTAL REPORT
45
Table 3.2.1 Environmental Aspect 1: Emissions to Surface Water Aspect Score 07Jan09 - 190 Objective No.1 Target Action Due Date Responsibility Resources
1.1.1 Develop drill scenarios for various spill events. Jun’09 1.1.2 Run the table top drill with the EO. Sep’09 1.1.3 Observe the outcomes and decisions made during the drill.
Sep’09
1.1.4 Review drill and learnings. Sep’09
To ensure in the event of a spill that there is an effective spill response to protect soil, surface water and groundwater.
1.1 Complete a spill response table top exercise
1.1.5 Implement corrective actions from learnings. Oct’09
EO Subcommittee
EO Sub committee
Table 3.2.2 Environmental Aspect 2: Emissions to Waste Water Aspect Score 07Jan09 - 459 Objective No.2 Target Action Due Date Responsibility Resources No objectives as no opportunities currently exist for improvement
Table 3.2.3 Environmental Aspect 3: Noise Emissions Aspect Score 07Jan09 - 108 Objective No.3 Target Action Due Date Responsibility Resources No objective due to low score and no opportunity for improvement.

WYETH BIOTECH CAMPUS 2008 ANNUAL ENVIRONMENTAL REPORT
46
Table 3.2.4 Environmental Aspect 4: Emissions to Atmosphere Aspect Score 07Jan09 - 480 Objective No.4 Target Action Due Date Responsibility Resources To ensure that the CHP plant complies with IPPC Licence and Emissions Trading Permit conditions.
4.1 Ensure the CHP complies with all licence requirements.
4.1.1 Ensure emissions trading permit is updated and additional carbon credits requested. 4.1.2 Develop detailed construction and commissioning plan for the installation. 4.1.3 Submit a commissioning test programme for the CHP unit to the Agency 4.1.4 Execute the construction and commissioning plan. 4.1.5 Submit the commissioning test results to the Agency. 4.1.6. Operate the CHP after receiving approval from the Agency.
Nov’09
Mar’09
May’09
Oct’09
Nov’09
Nov’09
EHS Specialist/ Projects
Engineering Projects
EHS
Table 3.2.5 Environmental Aspect 5: Fugitive Emissions to atmosphere Aspect Score 07Jan09 - 640 Objective No.5 Target Action Due Date Responsibility Resources To ensure that all opportunities for fugitive emissions reduction are reviewed and implemented if feasible
5.1 Continue to monitor the introduction of pre-saturated IPA wipes and ensure that the administrative controls are effective.
5.1.1 Review the quantity of pre-saturated wipes and spray bottles consumed on a quarterly basis. 5.1.2 Review the administrative controls implemented on the use of IPA spray bottles through auditing. 5.1.3 Develop an improvement plan (if necessary) to assist in the reduction of fugitive emissions. 5.1.4 Document the findings as part of the Solvent Management Plan.
Jan‘10
Jan’10
Apr’09
Feb’10
EHS Specialist
Supply Chain Quality PPUs EHS

WYETH BIOTECH CAMPUS 2008 ANNUAL ENVIRONMENTAL REPORT
47
Table 3.2.6 Environmental Aspect 6: Hazardous Waste generation and disposal Aspect Score 07Jan09 - 640 Objective No.6 Target Action Due Date Responsibility Resources
6.1 Implement the hazardous waste tracking and labelling system
6.1.1 Install the scales, computer, printer and scanners for the electronic waste tracking system. 6.1.2 Complete testing of the process flows to ensure that they are robust and effective. 6.1.3 Revise the Waste Management Procedure for the Campus to allow the electronic waste tracking system to be implemented. 6.1.4 Roll out the system across the Campus.
Feb’09
Mar’09
Apr’09
May’09
EHS Specialist/ Site Services
6.2 Review waste reduction opportunities in each PPU/area
6.2.1 Complete waste reviews of all areas as part of internal environmental audits. 6.2.2 Ensure that waste reduction practices that have been identified are being implemented. 6.2.3 Use the data from the electronic waste tracking system to help identify waste reduction projects for further investigation. 6.2.4 Use the electronic waste tracking system to set waste reduction targets for each area. 6.2.5 Ensure that the raw materials stocking policy does not result in the generation of waste.
Dec’09
Dec’09
Aug’09
Dec’09
Dec’09
EHS Specialist/ Site Services
BSMS
To have a robust and efficient hazardous waste disposal process.
6.3 Install and commission the drum compactor.
6.3.1 Install drum packer unit and connect utilities. 6.3.2 Commission the unit and develop operating parameters. 6.3.3 Operate the unit and measure the reduction in the number of drums required to package solid hazardous waste.
Mar’09 Apr’09
Apr’09
Projects Projects
Site Services
PPUs Site Services
Projects EHS
GCOL

WYETH BIOTECH CAMPUS 2008 ANNUAL ENVIRONMENTAL REPORT
48
Table 3.2.7 Environmental Aspect 7: Non-Hazardous Waste generation – recovery/disposal Aspect Score 07Jan09 - 456 Objective No.7 Target Action Due Date Responsibility Resources
7.1 Ensure that all infrastructure is in place to ensure that all non hazardous waste is properly segregated at source.
7.1.1Install a cardboard baler in the Warehouse to allow cardboard to be baled at the point of generation. 7.1.2 Install a Dry Mixed Recyclables (DMR) compactor with a loading arm to avoid daily DMR wheelie bin collections. 7.1.3 Review the provision of waste collections services in the Contractors Compound to ensure improved segregation of non hazardous waste. 7.1.4 Review Office Satellite Waste Locations to determine if improvements can be made. Pilot improvements and roll out successful aspects across the Campus.
Mar’09
Mar’09
Mar’09
Aug’09
Site Services
7.2 Review waste reduction opportunities in each PPU/area
7.2.1 Complete waste reviews of all areas as part of internal environmental audits. 7.2.2 Ensure that waste reduction practices that have been identified are being implemented. 7.2.3 Use the data from the audits to help identify waste reduction projects for further investigation.
Dec’09
Dec’09
Aug’09
EHS Specialist/ Site Services
To achieve a non hazardous waste recycling rate of 90% by end of 2009.
7.3 Look at opportunities to reduce packaging on incoming parts/consumables and raw materials
7.3.1 Work with the vendors to investigate the opportunities for reducing packaging on incoming parts, consumables and raw materials.
Dec’09 Supply Chain
Engineering Projects
EHS Supply Chain
PPUs

WYETH BIOTECH CAMPUS 2008 ANNUAL ENVIRONMENTAL REPORT
49
Table 3.2.8 Environmental Aspect 8: Water Usage and conservation Aspect Score 07Jan09 - 513 Objective No.8 Target Action Due Date Responsibility Resources
8.1 Develop Water Use Key Performance Indicators (KPIs) for each PPU/Support building
8.1.1 Trend water usage and develop baseline water usage for each meter using new metering and reporting format. 8.1.2 Develop process to monitor water trends and investigate elevated consumption.
Oct’09
Dec’09
8.2 Identify areas for investigation for water reduction opportunities.
8.2.1 Based on water usage trends review water saving opportunities. 8.2.2 Develop a list of projects that can be implemented and obtain capital to implement the projects prioritised on return on investment. 8.2.3 Develop project scope and implementation plan for the projects identified as reduction opportunities.
Oct’09
Nov’09
Jan’10
To have a monitoring and measurement process to identify water saving opportunities
8.3 Reduce Water For Injection (WFI) flushing duration in Drug Substance
8.3.1 Investigate a method to revalidate the WFI flushing in DS that will not result in water sampling failures. 8.3.2 Calculate the water and energy savings as a result of change.
Dec’09
Dec’09
Projects Automation Eng Tech Services
Eng Tech Services
Engineering Projects
EHS

WYETH BIOTECH CAMPUS 2008 ANNUAL ENVIRONMENTAL REPORT
50
Table 3.2.9 Environmental Aspect 9: Emissions to Ground Aspect Score 07Jan09 - 84 Objective No.9 Target Action Due Date Responsibility Resources
9.1 Repair one minor crack to foul sewer line observed as part of 2008 survey
9.1.1 Appoint repair vendor to repair minor fault. 9.1.2 Reline the pipe with a glass fibre reinforced liner. 9.1.3 Check that the repair has been effective as part of the annual foul sewer survey
May’09 Jul’09
Dec’09
Site Services Engineer
To ensure the integrity all underground pipes.
9.2 Complete CCTV survey of foul sewer.
9.2.1 Select a vendor to carry out the survey of the pipelines. 9.2.2 Develop a schedule of pipeline survey. 9.2.3 Complete and document pipeline survey. 9.2.4 Review findings and implement corrective actions. 9.2.5 Report the findings of the pipe survey in the 2009 AER.
Apr’09
May’09 Aug’09 Sep’09
Feb’10
Site Services Engineer
Engineering Projects
EHS
Table 3.2.10 Environmental Aspect 10: Raw Materials Aspect Score 07Jan09 - 312 Objective No.10 Target Action Due Date Responsibility Resources Stocking of raw materials is being tracked as part of the hazardous waste reduction objective (6.2.5).

WYETH BIOTECH CAMPUS 2008 ANNUAL ENVIRONMENTAL REPORT
51
Table 3.2.11 Environmental Aspect 11: Energy Aspect Score 07Jan09 - 1520 Objective No.11 Target Action Due Date Responsibility Resources
11.1 Continue to develop the energy management system.
11.1.1 Review the energy management programme including: • Analysis of energy use • Identification of efficiencies • Training and awareness • Internal area energy audits
Dec’09
Energy Manager
11.2 Install additional meters on the steam systems and set up a reporting format to allow steam use per area to be tracked and monitored
11.2.1 Obtain window when the steam systems can be shutdown to allow installation of the steam meters. 11.2.2 Link the steam meters to the energy metering and reporting system.
Jun’09 Energy Manager
11.3 Develop Energy Performance Indicators (EPIs) for each PPU/Support building
11.3.1 Based on the data available from reporting system set an appropriate EPIs. 11.3.2 Develop a process for investigating energy usage above the EPIs.
Dec’09 Energy Manager
To implement 2.5% decrease in Electricity and Gas kWh’s compared to 2008 and ensure that energy is used efficiently and reduction opportunities are implemented.
11.4 Investigation and implementation of energy reduction opportunities.
11.4.1 Continue to investigate energy reduction projects:
• Rationalisation of compressed air plant • Efficient use of MS glycol chillers • Humidification control in HVAC • Air change rate set back in cleanrooms and
laboratories • Removal of HVAC heat/cool conflict • Waste heat recovery in MS and QA/QC
11.4.2 Obtain capital/resources for implementation of the projects and implement once capital/resources are approved.
Dec’09
Energy Manager
EHS Projects
Engineering PPUs

WYETH BIOTECH CAMPUS 2008 ANNUAL ENVIRONMENTAL REPORT
52
Table 3.2.12 Environmental Aspect 12: Visual Impact Aspect Score 07Jan09 - 18 Objective No.12 Target Action Due Date Responsibility Resources No objective due to low score and no opportunity for improvement.
Table 3.2.13 Environmental Aspect 13: Odour Emissions Aspect Score 07Jan09 - 360 Objective No.13 Target Action Due Date Responsibility Resources No objective as no opportunities currently exit for improvement.
Table 3.2.14 Environmental Aspect 14: Hazardous Materials Aspect Score 07Jan09 - 420 Objective No.14 Target Action Due Date Responsibility Resources No objective as no opportunities currently exit for improvement.

WYETH BIOTECH CAMPUS 2008 ANNUAL ENVIRONMENTAL REPORT
53
Table 3.2.15 Environmental Aspect 15: Environmental Management System Aspect Score – N/a Objective No.15 Target Action Due Date Responsibility Resources
15.1 Maintain certification to ISO 14001:2004
15.1.1 Host successful 3 year recertification audit by accreditation body.
Dec’09 EHS Specialist
15.2 Complete all scheduled EMS audits as per the defined schedule with input from the PPUs.
15.2.1 Develop schedule of EMS audits on EHS eRoom. 15.2.2 Complete audits and track the audit actions on the corrective action log.
Jan’09
Dec’09
EHS Specialist
15.3 Create awareness on energy, water and waste through an environmental awareness campaign.
15.3.1 Complete an awareness campaign around simple changes that can positively impact on energy, water use and waste generation. 15.3.2 Complete the 4th edition of the Green Link magazine
Dec’09
Nov’09
EHS Specialist/
Energy Manager
15.4 Continue to develop Corporate Social Responsibility (CSR) projects.
15.4.1 Sponsor the ‘Trees for Schools’ campaign and working with local schools to get involved in the programme. 15.4.2 Work with Clondalkin Partnership to identify an environment project within the local community that Wyeth can help. 15.4.3 Continue to promote Wyeth’s continuous environmental improvement through external awards and case study reports.
Dec’09
Communications
Specialist/EHS Specialist
To ensure the Environmental Management System is functioning and delivering continuous improvement
15.5 Develop the Mobility Management Plan for the Campus
15.5.1 Working with the One Small Steps Campaign to develop the mobility management plan for the campus and encourage sustainable transportation.
Dec’09 EHS & Site Services
HR
EHS Green Working
Group Engineering
Communications PPUs

WYETH BIOTECH CAMPUS 2008 ANNUAL ENVIRONMENTAL REPORT
54
3.3 European Pollution Release and Transfer Register
See Appendix 7 attached – 2008 Pollution Release and Transfer Register (PRTR).

WYETH BIOTECH CAMPUS 2008 ANNUAL ENVIRONMENTAL REPORT
55
4.0 Specific Reports
This section presents IPPC Licence specific reports. These reports present detailed information on key environmental activities on Campus. The reports include the following;
• Solvent Management Plan • Carbon Dioxide and Nitrogen Oxides Emissions calculations • Respirometry and Toxicity Testing • List I and II Substance Reductions • Testing of Underground Pipes and Tanks • Review of Residual Management Plan • Review of Environmental Liabilities Insurance Cover • Water Conservation Report • Energy Management Report • Review of Efficient Use of Raw Materials
4.1 Solvent Management Plan
4.1.1 Introduction This Solvent Management Plan (SMP) is prepared in accordance with Condition 5.10 of the IPPC Licence (Register No. P0652-0) for the Campus.
Condition 5.10 states:
‘The licensee shall prepare a solvent management plan in accordance with any relevant guidelines in Annex III of Council Directive 1999/13/EC or as may be issued by the Agency from time to time. The solvent management plan shall be used to demonstrate compliance with the fugitive emission limit value. The SMP shall be submitted as part of the AER’.
Condition 5.9 stipulates that fugitive emissions shall not exceed 5% of solvent input on an annual basis.
As required this SMP follows the specific guidance within Annex III of Council Directive 1999/13/EC ‘on the limitation of emissions of volatile organic compounds due to the use of organic solvents in certain activities and installations’.
The following section presents an overview of solvent usage at the Campus including details on storage, containment and disposal of the principal solvents used on site. Section 4.1.7 presents the calculations of fugitive emissions.

WYETH BIOTECH CAMPUS 2008 ANNUAL ENVIRONMENTAL REPORT
56
4.1.2 Overview of Solvent Use The principal solvents (i.e. organic compound having at 293.15K a vapour pressure of 0.01kPa or more) in use at the site include: -
• Ethanol • Glacial Acetic Acid • Isopropyl alcohol
Tables 4.1, 4.2 and 4.3 present’s usage details for these solvents onsite including principal use, storage and consumption volumes, potential for fugitive emissions, fugitive emission controls and primary disposal routes.
TABLE 4.1: ETHANOL USAGE
Vapour pressure 5.81 kPa @ 20oC
Principal use In Vaccines Conjugation in the Manufacturing Suites ethanol is used to complete a process called shell freezing where the conjugate material is frozen.
Ethanol is also used for chromatography column storage in the Enbrel Process in Drug Substance.
Primary Storage 1 – 3.785 L bottles.
Average quantity stored 200 L
Annual consumption (2008) 1,464.3L – Bottles/Containers (1,171.4Kg)
Potential for fugitive emissions Low
Fugitive emissions controls • All containers remain unopened until transferred to the liquid dispensary area.
• All containers are sealed for the transfer of material from the warehouse to the manufacturing areas.
• All manufacturing production and support vessels are sealed when in operation.
Disposal Ethanol used in the shell freezing process is disposed of as hazardous waste.

WYETH BIOTECH CAMPUS 2008 ANNUAL ENVIRONMENTAL REPORT
57
TABLE 4.2: GLACIAL ACETIC ACID USAGE
Vapour pressure 1.52 kPa @ 20oC
Principal use Glacial Acetic Acid is used in the preparation of Protein A Regeneration buffer and Protein A Elution buffer in the Protein A Chromatography System.
Primary Storage 20L Containers
Average quantity stored 5,000L
Annual consumption (2008) 17,130L (17,986.5Kg)
Potential for fugitive emissions Low
Fugitive emissions controls • All containers remain unopened until transferred to the liquid dispensary area.
• All containers are sealed for the transfer of material from the warehouse to the manufacturing areas.
• All manufacturing production and support vessels are sealed when in operation.
Disposal Protein A regeneration buffer and Protein A elution buffer are discharged to the process effluent line and onto the wastewater neutralisation tank in the CUB yard.
TABLE 4.3: ISOPROPYL ALCOHOL USAGE
Vapour pressure 4.40 kPa @ 20oC
Principal use Isopropyl alcohol (IPA) is primarily used on site for sterilisation within qualified/clean room areas. It is applied in low volumes via spray bottles, directly onto wipes or is brought onto site as IPA saturated low lint wipes.
Primary Storage 70% IPA is stored in 1L bottles and the two types of 70% pre-saturated wipes are stored in dispensing containers.
Average quantity stored 1000L
Annual consumption (2008) 18,991.1 L of IPA spray and wipes (17,096.0Kg)
Potential for fugitive emissions High
Fugitive emissions controls • All IPA spray containers are sealed until used. • IPA containers have a rubber seal in the neck of the bottle. • All IPA wipe packets/containers are sealed. • All IPA wipes are stored in dedicated IPA wipe bins. • All waste IPA bags are sealed with a cable tie when full.
Disposal All waste IPA wipes are disposed of as hazardous waste. All waste containers of IPA are disposed of as hazardous waste.

WYETH BIOTECH CAMPUS 2008 ANNUAL ENVIRONMENTAL REPORT
58
4.1.3 Fugitive Emissions Condition 5.9 stipulates that fugitive emissions shall not exceed 5% of solvent input on an annual basis.
"Fugitive emissions" are defined under Council Directive 1999/13/EC as any emissions, not in waste gases, of volatile organic compounds into air, soil and water as well as, unless otherwise stated in Annex IIA, solvents contained in any products. They include un-captured emissions released to the outside environment via windows, doors, vents and similar openings. In accordance with this definition calculations of the fugitive emissions for the individual volatile organic compounds are detailed below.
4.1.4 Ethanol – Inputs and Output ETHANOL INPUTS
Ethanol is used in Vaccines Conjugation in the Manufacturing Suites to complete a process called shell freezing where the conjugate material is frozen. Ethanol is also used for chromatography column storage in the Enbrel Process in Drug Substance. Ethanol is supplied in containers and bottles. The ethanol used has a high concentration (96%) and therefore the vapour pressure is high at 5.81 kPa @ 20oC.
Ethanol containers are stored in a dedicated flammable storage area in the East Drum Store. The containers are unopened while in storage and as such there are no fugitive emissions.
For the ethanol required by Vaccines Conjugation in Manufacturing Suite 1 the containers are brought to the warehouse where the liquid is dispensed to the required volume into a mobile vessel under cGMP (current Good Manufacturing Practices) conditions. The dispensing area in the warehouse is vented to two emission points and therefore the ethanol emission is not classified as fugitive emissions. The mobile vessel is transferred to the manufacturing suite and connected to the shell freezer and from there the ethanol is pumped into the freezer. There are some fugitive emissions from the transfer activity but due to the low temperatures, 5ºC in the mobile vessel and -70 ºC in the freezer, it is considered to be <0.01% of the ethanol input (i.e. approximately 0.08kg for 2008).
The ethanol used in Drug Substance is transferred directly to the manufacturing area so there is no dispensing activity. There is some transfer of ethanol in the manufacturing area and it has been estimated that 0.1% of the ethanol will be lost as fugitive emissions in this transfer. The result is approximately 0.32kg for 2008.

WYETH BIOTECH CAMPUS 2008 ANNUAL ENVIRONMENTAL REPORT
59
ETHANOL OUTPUTS
The majority of ethanol from Drug Substance is discharged to waste water. The concentration of ethanol in the final effluent is calculated to be very low. For 2008 this figure is calculated at <0.00009%. Therefore, with such low concentrations, fugitive emissions from the wastewater system on site is estimated to be very low at <0.01%. This corresponds to 0.3 kg for 2008, which is considered a conservative estimate.
The other ethanol output is the waste ethanol from the shell freezers. This is collected in waste containers and disposed of as hazardous waste. The waste containers are sealed and disposed of as hazardous waste or they are triple rinsed with water and disposed of as non hazardous waste. The containers typically contain a very slight heal but it is not considered a significant contribution to fugitive emissions. Refer to Table 4.4 for ethanol summary calculations.
Table 4.4: Ethanol Summary Calculations Ethanol Input Kg Organic Solvent Input Bulk Ethanol 0 I1Bulk Ethanol
Non Bulk Ethanol 1,171.4 I1Non-bulk Ethanol
Ethanol Output Kg Organic Solvent Output Emissions to Atmosphere - Non Fugitive 0 O1Ethanol
Waste Water Discharge 1,171.1 O6Ethanol
Fugitive Emission 0.36 FEthanol
4.1.5 Glacial acetic Acid – Inputs and Outputs GLACIAL ACETIC ACID INPUTS
Glacial acetic acid used at the Campus is a high concentration (99-100%), high purity acid with a vapour pressure of 1.52 kPa @ 20oC. Acetic acid is stored in 20 litre containers in a dedicated flammable storage area in the East Drum Store. The containers are unopened and there are no fugitive emissions from the storage area.
The containers are brought to the warehouse where the liquid is dispensed into the required volumes under cGMP (current Good Manufacturing Practices) conditions. The area where they are dispensed is vented to two emission points and therefore this emission is not classified as fugitive emissions. In 2008 the time required to complete a dispense was reduced from 6 hours to 2 hours, this which has reduced the associated air emissions from this activity.

WYETH BIOTECH CAMPUS 2008 ANNUAL ENVIRONMENTAL REPORT
60
The containers are then sealed and transferred to the manufacturing area. There they are opened and dispensed into the appropriate vessel. There are some fugitive emissions from this activity but due to the low frequency and the small volume per batch it is considered to be <0.1% of glacial acetic acid input. This equates to approximately 0.02kg for 2008. While in the reaction vessels, venting may occur through licenced emission points A3-69 to A3-8, these are not considered to be fugitive emissions.
GLACIAL ACETIC ACID OUTPUTS
The majority of glacial acetic acid is discharged to waste water. The concentration of glacial acetic acid in the final effluent is calculated to be very low and for 2008 is <0.004%. Therefore with such low concentrations, fugitive emissions from the wastewater system are estimated to be very low, <0.1% which corresponds to an estimated 1.71kg for 2008 (note this is considered a conservative estimate).
The other output is waste containers. The waste containers are sealed and disposed of as hazardous waste or they are triple rinsed with water and disposed of as non hazardous waste. The containers typically contain just a very slight heal and it is not considered to be a significant contribution to fugitive emissions. Refer to Table 4.5 for Glacial Acetic Acid summary calculations.
Table 4.5: Glacial Acetic Acid Summary Calculations Glacial Acetic Acid Input Kg Organic Solvent Input Glacial Acetic 17,986.5 I1Glacial Acetic Acid
Glacial Acetic Acid Output Kg Organic Solvent Output Emissions to Atmosphere – Non Fugitive 4 O1 Glacial Acetic Acid
Waste Water Discharge 17,980.8 O6Glacial Acetic Acid Fugitive Emission 1.73 FGlacial Acetic Acid
4.1.6 Isopropyl Alcohol (IPA) – Inputs and Outputs IPA INPUTS The main sources of Isopropanol are;
• 70% IPA/30% water 1L spray bottles. • 70% IPA/30% water pre-saturated wipes. The IPA spray and wipes are used across the site to sanitise work surfaces, external surfaces of production vessels, gowning areas and equipment brought into production areas.

WYETH BIOTECH CAMPUS 2008 ANNUAL ENVIRONMENTAL REPORT
61
The significant input of IPA to the site comes from 70% IPA 1 litre spray bottles. The spray bottles are stored with the nozzle of the spray bottle kept closed until the spray is required so there are no fugitive emissions from the storage of the bottles. In addition the spray bottles have a rubber insert in the neck that prevents fugitive emissions from any breathing losses. All IPA pre-saturated wipe containers are sealed and are stored in dedicated IPA wipe bins. Therefore there are no fugitive emissions from the storage of the IPA wipes.
IPA is used in fume hoods and biological safety cabinets to spray the area and any equipment introduced into the area. The spray is used in addition with dry wipes to wipe down areas. Pre-saturated IPA wipes are also used across the site. IPA pre-saturated wipes were introduced in late 2007 to replace the usage of 70% IPA spray bottles for cleaning and sanitising activities. This has greatly reduced the exposure of IPA vapours to personel and led to a reduction in IPA fugitive emissions. During 2007 a project was completed to review the potential to reduce filter integrity testing. This had the knock on effect of reducing IPA usage. In 2008 further investigations led to the replacement of IPA with water for filter integrity testing which led to further reductions in IPA usage.
As part of the analysis, the quantity of IPA dispensed per spray was measured as well as the quantity of IPA required to saturate the dry wipe. Similarly to the pre-saturated wipes measurements, the dry wipe was saturated with IPA and the wipes were used to wipe down a known area. The weight of the wipe was taken before and after. This data allowed for the calculation of total IPA input to the site from IPA spray bottles (in addition to IPA emitted to atmosphere and generated as waste). The calculations indicate that there were approximately 17,146 bottles of IPA spray used in 2008 and this represents 12,002 litres of pure IPA (excludes 30% of the makeup which is water). This is equivalent to 10,322kg of IPA. The data also allowed for the calculation of IPA inputted to the site from IPA pre-saturated wipes (in addition to IPA emitted to atmosphere and generated as waste). The calculations indicate that there was approximately 692,750 IPA wipes used in 2008 and this represents 1,845.1 litres of pure IPA which is equivalent to 2,350.5kg of IPA.
IPA OUTPUTS
Investigations were conducted in 2005 to allow calculation of the quantity of IPA emitted as fugitive emissions from the site. Additional similar investigations were carried out in 2008 to allow for the calculation of the quantity of IPA emitted from IPA pre-saturated wipes as fugitive emissions from the site. These investigations were focused on many of the work activities on Campus and included;
• Wiping work areas with pre-saturated wipes • IPA usage by the main cleaning contractor in cGMP areas • QC Microbiology testing

WYETH BIOTECH CAMPUS 2008 ANNUAL ENVIRONMENTAL REPORT
62
• In process and utility sampling activities
The results of these investigations remain fully valid for 2008. The methodologies for conducting IPA output calculations and explanation of results are detailed in full within the 2005 SMP report presented within the 2005 AER. Refer to Table 4.6 for the 2008 IPA summary calculations.
Table 4.6: IPA Summary Calculations IPA Input Kg Organic Solvent Input 70% IPA Pre-Saturated Wipes 2,350.5 I1IPA Pre-Sat
70% IPA Spray Bottles 1,0321.9 I1IPA Spray
70% IPA Bottles 0.0 I1IPA 70% bottles 30% IPA Bottles 0.0 I1IPA 30% bottles IPA Output Kg Organic Solvent Output Emissions to Atmosphere - Non Fugitive 6,193.1 O1IPA
IPA Waste 2151.1 O6IPA
Fugitive Emission 4,328.08 FIPA
4.1.7 SMP Conclusions
The total fugitive emission is calculated based on the following equation:
FTotal = FEthanol + FGlacial Acetic Acid + FIPA
FTotal = 0.36 + 1.73 + 4,328.08
FTotal = 4,330.16 kg
The fugitive emissions as a percentage of solvent input are based on the following equation:
= FTotal / I1Ethanol + I1Glacial Acetic Acid + I1IPA * 100
= (4,330.16 kg / 1,171.4 kg + 17,986.5 kg + 12,672.3) * 100
= 4,330.16 kg/ 31,830.2 kg * 100
= 13.6%

WYETH BIOTECH CAMPUS 2008 ANNUAL ENVIRONMENTAL REPORT
63
The total solvent usage for 2008 (31,830.2 kg) shows a slight increase from the 2007 (29,172 kg) usage. The total solvent usage for 2008 and 2007 shows significant reductions compared to the 2006 total solvent usage (62,874.6 kg). The reasons for these significant reductions have been highlighted in the 2007 AER e.g. Bulk ethanol no longer used, removal of IPA from the filter integrity testing process and the introduction of IPA pre-saturated wipes. • There has been an increase in ethanol (1,171.44 kg) usage compared with
the 2007 (499.6 kg) usage. This increase is primarily due to the significant increased usage of bottled ethanol in Manufacturing Suite 1 reflecting increased production activities.
• There was an increase in the quantity of glacial acetic acid used compared to
2007. This is an 11% increase on the 2007 quantity. The reason for the increase is the continued increase in Enbrel manufacturing in Drug Substance.
• The quantity of IPA usage for 2008 (12,672.3 kg) shows a slight increase
compared to 2007 (12,484 kg) usage. The IPA usage for 2008 and 2007 show significant reductions compared to the 2006 (13,922 kg) usage. This is largely due to the replacement of IPA with water in the filter integrity testing process. The quantity of IPA used for cleaning and sanitisation of qualified areas has remained similar to the 2007 figures. However, there has been a significant increase in the use of IPA pre-saturated wipes (7 kg in 2007 compared to 2,350.5 kg in 2008) and a significant reduction in use of IPA spray (18%).
Fugitive emissions in terms of absolute emissions i.e. fugitive solvent loading to atmosphere has decreased slightly from 2007. The 2008 solvent fugitive loading is calculated at 4,328.1 kg. This represents a 1% decrease on the 2007 solvent fugitive loading calculated at 4366.6 kg. The overall fugitive emissions, as a percentage of total solvent input, have decreased from 15% in 2007 to 13.6% in 2008. The total solvent input for 2008 (31,830.3 kg) is well below the solvent consumption threshold for manufacturing of pharmaceutical products outlined in the VOC directive (i.e. 50,000 Kg). The changes from ethanol to benzyl alcohol in 2007, the replacement of IPA with water in the filter integrity testing and the introduction of IPA pre-saturated wipes in 2008 have been very positive changes. These changes have reduced the overall VOC solvent usage as well as reducing the risk of a fire or accident due to the highly flammable nature of ethanol and also reducing the exposure to IPA. Wyeth believes that the VOC directive and the 5% fugitive emission value as a percentage of solvent input as outlined in Condition 5.9 of the IPPC Licence is not applicable as total solvent input is well below the solvent consumption threshold for manufacturing of pharmaceutical products of 50,000kg. Glacial acetic acid and ethanol are very tightly controlled with low fugitive emissions. IPA is the largest contributor to fugitive emissions, it accounts for 99.9% of overall fugitive emissions. Given the widespread use and method of application used to

WYETH BIOTECH CAMPUS 2008 ANNUAL ENVIRONMENTAL REPORT
64
ensure that all areas are sanitised to achieve cGMP conditions, it would not be feasible to achieve fugitive emissions of 5% based on total solvent input of less than 50,000 kg. The 2009 EMP will continue to review potential IPA related reduction opportunities and the impact of these will be reviewed in the 2009 SMP.
Carcinogens, Mutagens, Toxic to Reproduction and Halogenated Volatile Organic Compounds (VOCs) There are no VOCs with the R-phrases R45, R46, R49, R60, R61 or R40 used, therefore Article 5 paragraphs 6, 7 and 8 of Council Directive 199/19/EC do not apply.
4.2 Annual CO2 and NOx Emissions
4.2.1 CO2 and NOx Emissions Overview Condition 5.11 states that “the Licensee shall submit to the Agency as part of the AER, total annual emissions of CO2 and total annual emissions of Nitrogen oxides (as Nitrogen dioxide).” On 29SEP04 Wyeth submitted to the Agency the methodology to be used to acquire the data. A summary of that information is included along with the calculations for 2008.
4.2.2 Carbon Dioxide Carbon dioxide (CO2) is produced from all combustion activities involving a fossil fuel. On Campus the sources of CO2 are combustion of natural gas in the boilers and kitchen. Diesel (gas oil) is combusted in emergency generators as back up fuel for the boilers and for the diesel firewater pump. Propane is used as a source of fuel for the pilot light when the boilers are operating on diesel.
Wyeth Medica Ireland, The Wyeth Biotech Campus at Grange Castle is included in the EU Emissions Trading scheme as defined in the European Directive (Directive 2003/87/EC) and has an emissions trading permit GHG-026. The Agency has approved the Monitoring and Reporting proposal as required by Condition 3.1 of the Greenhouse Gas Emissions Permit.
The formulas for the calculation of CO2 are outlined below.
Activity Data = > Energy Content of the Fuel Consumed (TJ) = Fuel Consumed (t or m3) x Net Calorific Value of Fuel (TJ/t or TJ/m3)
CO2 Emissions (tCO2) = Activity data (TJ) x Emission Factor (tCO2/TJ) x Oxidation Factor

WYETH BIOTECH CAMPUS 2008 ANNUAL ENVIRONMENTAL REPORT
65
The following emission factors that have been used for natural gas, fuel oil and propane are 56.832 tCO2/TJ, 73.30 tCO2/TJ, 47.16 tCO2/TJ respectively. The oxidation factor is 1 for all three fuels.
In the case of natural gas the annual gas volume consumed is converted to standardised gas volume (Nm3) and the net calorific value of the fuel in TJ/Nm3 is calculated for reporting purposes.
All calculations are outlined in Table 4.7 below.
4.2.3 Nitrogen Oxides (as Nitrogen Dioxide) Unlike carbon dioxide, nitrogen oxides are not only related to nitrogen from the fuel source. Nitrogen oxides are formed during the combustion of fuel in the presence of air. At elevated temperatures, nitrogen from the air and the fuel reacts with oxygen to form nitrogen oxides. Approximately 90 to 95% of the nitrogen oxides generated in combustion processes are in the form of nitric oxide (NO). Once in the atmosphere NO reacts in a variety of photochemical and thermal reactions to form NO2. Accordingly, the total mass emissions of nitrogen oxides from the unit are expressed in the form of NO2.
Nitrogen oxides are formed from two different sources: • Atmospheric nitrogen (N2) entering the combustion zone as part of the
combustion air. • Nitrogen present in the fuel. The nitrogen oxides generated from atmospheric nitrogen are often termed thermal NOx because they are formed in the high temperature areas around burner flames in combustion chambers. Nitrogen oxides generated from the fuel are termed fuel NOx. Therefore, it was necessary to determine emission factors for each source of NOx and for each fuel type being combusted by carrying out on site measurements. Onsite monitoring was carried out and following review of the data the emission factors in Table 4.8 were calculated.
4.2.4 Interpretation of CO2 and NOx Emissions There was a small increase in carbon dioxide emissions from 23,979 tonnes in 2007 to 24,278 tonnes in 2008. This was from all combustion sources on Campus. The increase in carbon dioxide emissions reflects the increase in fuel usage. This is mainly natural gas usage which is used by the boilers to provide heat and steam to meet and maintain environmental conditions within manufacturing areas as outlined in section 2.10.

WYETH BIOTECH CAMPUS 2008 ANNUAL ENVIRONMENTAL REPORT
66
Nitrogen oxides (as nitrogen dioxide) emissions for 2008 were 5,658 tonnes. This represented a 7% increase from 2007 (5,270 tonnes). With the introduction of CHP scheduled for late 2009 it is likely that there will be an increase in the quantity of carbon dioxide and nitrogen oxides emitted from the site but this will be off set by the reduction of carbon dioxide and nitrogen oxides emitted at the electricity generating station so overall it is a very positive development. Also as manufacturing rates increase on Campus the amount of carbon dioxide and nitrogen oxides will increase as the site requirement for steam increases. The quantities of carbon dioxide and nitrogen oxides are not just dependent on production activities but also the external temperature and the heating requirements of the incoming air. Therefore, a cooler winter will mean a high heat demand and consequently an increase in carbon dioxide and nitrogen oxides.

WYETH BIOTECH CAMPUS 2008 ANNUAL ENVIRONMENTAL REPORT
67
Table 4.7: CO2 Calculations Jan Feb Mar Apr May Jun Jul Aug Sep Oct Nov Dec Natural Gas (Boilers) MWh 12196.39 10716.95 12954.44 11866.39 10569.72 9425.84 9338.89 9139.67 8931.67 10524.73 11493 13351.11 Natural Gas (Kitchen) MWh 4.75 4.44 5.04 4.85 4.88 5.15 5.00 4.95 5.00 5.90 4.53 5.49 Total MWh 12201.14 10721.39 12959.48 11871.24 10574.60 9430.98 9343.89 9144.62 8936.67 10530.63 11497.59 13356.6 Convert to Net Calorific Value 0.9028 Convert to TJ 0.0036 Emission Factor (t CO2/TJ) 56.832 Oxidation Factor 1 CO2 Emissions (t CO2) 2253.65 1980.33 2393.73 2192.72 1953.22 1741.98 1725.90 1689.09 1650.68 1945.10 2123.70 2467.08 Jan Feb Mar Apr May Jun Jul Aug Sep Oct Nov Dec Gas Oil (Emergency Generators) m3 3.471 0.558 3.790 1.482 0.738 1.446 2.140 1.965 1.419 1.213 1.362 1.217 Gas Oil (Boilers) m3 7.724 2.908 6.908 3.775 0.000 2.312 3.606 2.276 1.776 0.875 3.968 1.305 Gas Oil (Fire Water Pump) m3 0.275 0.000 0.000 0.143 0.000 0.000 0.000 0.000 0.283 0.000 0.137 0.000 Total m3 11.470 3.466 10.698 5.400 0.738 3.758 5.746 4.241 3.478 2.088 5.467 2.522 Convert from m3 to kilotonnes 0.000855 Net CV (TJ/kt) 43.31 Emission Factor (t CO2/TJ) 73.3 Oxidation Factor 1 CO2 Emissions (t CO2) 31.133 9.408 29.038 14.657 2.003 10.200 15.596 11.511 9.440 5.667 14.839 6.845

WYETH BIOTECH CAMPUS 2008 ANNUAL ENVIRONMENTAL REPORT
68
Table 4.7: CO2 Calculations (continued)
Jan Feb Mar Apr May Jun Jul Aug Sep Oct Nov Dec Propane (Boilers on Oil) kg 0.000 0.000 0.000 0.000 0.000 0.000 0.000 0.000 0.000 0.000 0.000 34.000 Convert from kg to kilo tonnes 0.000001 Net CV (TJ/kt) 47.16 Emission Factor (t CO2/TJ) 63.7 Oxidation Factor 1 CO2 Emissions (t CO2) 0.000 0.000 0.000 0.000 0.000 0.000 0.000 0.000 0.000 0.000 0.000 0.102 Jan Feb Mar Apr May Jun Jul Aug Sep Oct Nov Dec Total CO2 per month (t CO2) 2284.79 1989.74 2422.76 2207.38 1955.22 1752.18 1741.49 1700.60 1660.12 1950.77 2138.54 2473.01 Cumulative CO2 Emissions (t CO2) 2284.79 4274.53 6697.29 8904.67 10859.89 12612.07 14353.57 16054.17 17714.29 19665.05 21803.59 24277.62

WYETH BIOTECH CAMPUS 2008 ANNUAL ENVIRONMENTAL REPORT
69
Table 4.7: CO2 Calculations (continued)
Jan Feb Mar Apr May Jun Jul Aug Sep Oct Nov Dec Natural Gas (Boilers) M3 1103699 969739 1172832 1076400 957859 858335 839353 821529 807711 952044 1038010 1198772 Natural Gas (Kitchen) M3 416 390 442 427 428 454 436 431 437 518 397 477 Total M3 1104115 970129 1173274 1076827 958287 858789 839789 821960 808148 952562 1038407 1199249 273K (0o C) 273 288K (15oC) 288 Std Gas Volume (Nm3) 1046609 919602 1112166 1020742 908376 814060 796050 779150 766057 902949 984323 1136821 2008 Total Std Gas Volume (Nm3) 11186421 Natural Gas (Boilers) MWh 12196.39 10716.95 12954.44 11866.39 10569.72 9425.84 9338.89 9139.67 8931.67 10524.73 11493 13351.11 Natural Gas (Kitchen) MWh 4.75 4.44 5.04 4.85 4.88 5.15 5.00 4.95 5.00 5.90 4.53 5.49 Total MWh 12201.14 10721.39 12959.48 11871.24 10574.60 9430.98 9343.89 9144.62 8936.67 10530.63 11497.59 13356.6 Convert to Net Calorific Value 0.9028 Convert to TJ 0.0036 TJ 39.65 34.85 42.12 38.58 34.37 30.65 30.37 29.72 29.04 34.23 37.37 43.41 2008 Total TJ 424.36 Annual TJ/Nm3 3.79326E-05

WYETH BIOTECH CAMPUS 2008 ANNUAL ENVIRONMENTAL REPORT
70
Table 4.8: NOx (as NO2) Calculations
Natural Gas (m3) Q1 Q2 Q3 Q4 2008 NOx Calculations
Boilers 3,246,271 2,892,593 2,468,593 3,188,826 11,796,283
Boiler NOx Conversion Natural Gas 0.00042
Kg NOx/m3
Kitchen 1,248 1,309 1,304 1,392 5,253
Boiler NOx Conversion Fuel Oil 0.946Kg NOx/m3
Total 3,247,519 2,893,902 2,469,897 3,190,218 11,801,536
Generators NOx Conversion Fuel Oil 40.72
Kg NOx/m3
Fuel Oil (m3) Q1 Q2 Q3 Q4 2008 Boilers 17.54 6.087 7.658 6.148 37.433 Generators 7.819 3.666 5.524 3.792 20.801 Diesel Fire Pump 0.275 0.143 0.283 0.137 0.838 Total 25.634 9.896 13.465 10.077 59.072 NOx (Kg of NOx (as NO2)) Q1 Q2 Q3 Q4 2008 Boilers (Gas) 1363 1215 1037 1339 4954 Kitchen (Gas) 0.52 0.55 0.55 0.58 2.21 Boilers (Fuel Oil) 16.59 5.76 5.23 5.82 33 Generators (Fuel Oil) 318 149 12 154 634 Diesel Fire Water Pump (Fuel Oil) 11 6 12 6 34 Total 1710 1376 1066 1506 5658

WYETH BIOTECH CAMPUS 2008 ANNUAL ENVIRONMENTAL REPORT
71
4.3 Respirometry and Toxicity Testing In accordance with the requirements of the IPPC Licence for the Campus respirometry and aquatic toxicity assessments on the final trade effluent from the site is conducted on an annual basis. In accordance with Conditions 6.6 and 6.7 of the licence it was determined that 5, 15 min EC50 to Vibrio fischeri and mixed microbial culture (respirometry) were the two most sensitive species. Accordingly, it is these species that are assessed annually. Analysis was conducted on a 24-hour composite trade effluent sample extracted from emission point TE1 on 10 June 2008 in accordance with Condition 6.8. The acute toxicity of undiluted effluent was conducted by standardised and internationally accepted procedures at the Shannon Aquatic Toxicity Laboratory, Enterprise Ireland, Shannon Town Centre, Co. Clare. The targeted species were:
Bacteria: 5, 15 min EC50 to Vibrio fischeri The second test was Respirometry - inhibition of oxygen consumption by activated sludge conducted in accordance with standardised methods at the Enterprise Environmental, Celbridge, Co. Kildare. The targeted species were: Mixed microbial culture: Respirometry In addition, sub-samples were extracted for further analysis including anions, cations, metals and organic parameters. Analysis was conducted by Bord na Móna Environmental Limited in accordance with standard methods.
Table 4.9 below presents the summary results for the toxicological analysis completed.
Table 4.9: Aquatic Toxicological Analytical Results Test Species Test Parameter Test Result No. of Toxic Units Vibrio fischeri 5 min EC50 > 45% vol/vol <2.2 Vibrio fischeri 15 min EC50 > 45% vol/vol <2.2 Respirometry 180 min EC50 > 50 % vol/vol <2.0
The results of the toxicological analysis indicate that the trade effluent samples did not exhibit any inhibitory effects on the selected test organisms. Importantly the sample did not inhibit oxygen consumption within activated sludge collected from the Ringsend Wastewater Treatment Plant by the test laboratory. It is noted that trade effluent from the Campus is discharged for treatment to the Ringsend plant.
Overall, the analytical results targeting anions, cations, metals and organic parameters did not indicate any elevated concentrations, further supporting lack of inhibitory effects demonstrated in the toxicological test organisms.

WYETH BIOTECH CAMPUS 2008 ANNUAL ENVIRONMENTAL REPORT
72
Results demonstrated that there was no inhibition of the activated sludge from the test sample. A copy of the reports is available in Appendix 4.
4.4 List I and II Substance Reductions List I and List II substances prescribed within Council Directive 76/464/EEC on pollution caused by certain dangerous substances discharged into the aquatic environment of the Community identifies substances selected mainly on the basis of their toxicity, persistence and bioaccumulation, which have a high pollution potential within the aquatic environment. The purpose of the Directive is to eliminate pollution from List I substances and to reduce pollution from List II substances.
The only substance used within the manufacturing process at the Campus appearing on this list is cyanide. Within Council Directive 76/464/EEC the cyanide family of substances is identified as a List II substance. Specifically sodium cyanoborohydride is used to initiate both aqueous and DMSO conjugation reactions for vaccine conjugation within the Manufacturing Suite 1 building. The 10g mass of this compound used per batch is extremely small and is the cGMP qualified material for this purpose. There are no proposals to substitute and/or reduce mass of this material on site.
4.5 Testing of Underground Pipes and Tanks Condition 9.4.6 states that “the licensee shall undertake a programme of testing and inspection of active underground tanks and pipelines to ensure that all such structures are tested at least once every year. Underground double contained tanks and pipelines shall be tested and inspected once every three years. A report on such tests shall be included in the AER.” During 2008 a survey of the single contained foul sewer pipeline, double contained spill containment system and trade effluent pipelines was undertaken.
4.5.1 Foul Sewer A survey of the foul sewer line was undertaken during August 2008. Prior to the survey taking place all foul sewer lines were jetted using a high-pressure water jet to remove any material from the foul sewer line that would obstruct the visual detection of any faults or obstruct the movement of the CCTV camera. Once the lines were jetted a CCTV camera was placed down each foul sewer section and the information was recorded and reviewed. A total of 1977.8 metres of foul sewer were surveyed. The survey found two minor faults, a crack in a pipe connection with no infiltration at F1.09A to F1.09B and F1.09B to F1.09C. These minor faults will be repaired as part of the 2009 EMP and reviewed as part of the 2009 survey.
A damaged section discovered in the 2007 survey was repaired in June 2008. The defective section of pipework was relined. The methodology employed inserted an inner reinforced fibreglass liner, which effectively sealed the inner

WYETH BIOTECH CAMPUS 2008 ANNUAL ENVIRONMENTAL REPORT
73
pipe. This repair was reviewed as part of the 2008 site foul sewer survey and found to be of good integrity. A copy of the survey is included within Appendix 5.
4.5.2 Spill Containment Pipe Work The spill containment system is the area on-site where chemical transfer and loading/unloading occurs. To reduce the risk of spillages to surface water a drainage system was installed that under normal conditions will discharge to surface water but in the event of chemical transfer or a fire event will divert spill or fire water material to the spill containment tank. The pipes are double contained. The inner pipe contains the liquid material and the outer pipe is designed to capture any leaks from the inner pipe. The outer pipe then links to inspection chambers that have leak detection within the chamber in the event that the inner pipe leaks. This will alarm to the CUB operations control room in the event of a leak. A survey of the Spill Containment pipework was completed during March 2008. The same survey methodology as the foul sewer was employed. Prior to the survey taking place all spill containment lines were jetted using a high-pressure water jet to remove any material from the foul sewer line that would obstruct the visual detection of any faults or obstruct the movement of the CCTV camera. Once the lines were jetted a CCTV camera was placed down each pipe section and the information was recorded and reviewed. A total of 330.2 metres of spill containment pipe lines were surveyed. No faults were detected during the survey.
4.5.3 Spill Containment Tank The spill containment tank is a 150m3 tank in situ in the event of a firewater or spill event in the tank farm area of the CUB (Central Utilities Building) yard. The tank is constructed of concrete and lined with a chemical resistant coating (CRC). The spill containment tank is used to collect any spillages that may occur during the loading/unloading of chemicals. The tank can also collect firewater run-off in the event of a fire in the tank farm.
To demonstrate the integrity of the tank, a water holding test is carried out annually. The test was carried out during July 2008. It was completed when there were no chemical deliveries scheduled. To reduce the impact to the chemical delivery schedule and to reduce the period of time when there would be no containment in the CUB yard, the duration of the test was approximately 12 hours. This was deemed to be a reasonable period of time for the test, as it would be representative of the duration that the tank would be full in the event of a spill or fire before the tank would be pumped to the wastewater neutralisation tank or tankered off site for disposal. A successful test would yield no drop in the level of the tank for the period of the test.
The tank was filled with utility water over a period of 3 hours until the level transmitter in the tank reached 100% full. The tank was allowed to settle for 15 minutes and after this period the water holding test began. The MCS

WYETH BIOTECH CAMPUS 2008 ANNUAL ENVIRONMENTAL REPORT
74
(Manufacturing Control System) was reviewed on an hourly basis to see if there was any drop in the reading of the level transmitter for the spill containment tank. The level transmitter remained at 100% for the duration of the test. The test was completed after approximately 12 hours holding time.
The trend of the level transmitter in the spill containment tank is outlined in the graph in Appendix 5. The level of the tank remained at 100% for the duration of the test. In addition, in August 2008 a CCTV survey of the Spill containment tank was also carried out. The tanks was surveyed using a Perpoint 900 camera and while two operatives were in the tank. No faults were observed. A copy of the CCTV Survey is included in Appendix 5.
Overall, the water holding test and the CCTV survey of the spill containment tank were successfully completed and demonstrated that the tank is capable of retaining liquids and has good structural integrity.
4.5.4 Trade Effluent All underground trade effluent pipework is doubled contained. The inner pipe contains the liquid trade effluent and the outer pipe is designed to capture any leaks from the inner pipe. All outer pipes are linked to inspection chambers, which house leak detection devices within the chambers. In the event of a leak to the outer piping these detection devices will alarm to the CUB operations control room. A survey of the Trade Effluent pipework was completed during September 2008. The same survey methodology utilised for the foul sewer was employed for the trade effluent double contained pipe network. Once the lines were jetted a CCTV camera was placed down each section of pipe and the information was recorded and reviewed. A total of 272.8 metres of Trade Effluent pipework was surveyed. No faults were detected in the structural integrity of the pipework.
It is noted that it was not possible to survey one section of the double contained trade effluent pipework on site. This is due to the absence of manholes to allow CCTV camera access. This section forms the discharge line from the North Lift Station to North-South Link. An alternative integrity test method was employed for this section of pipe work. A pressure test of the outer pipe work was completed during March 2008. The pressure test conducted indicates no loss of pressure over the length of the pipe work tested. This result demonstrates that the outer and inner lines are defect free, given that any cracks in the outer or inner pipes would result in a loss of pressure.
A copy of the CCTV Survey is included in Appendix 5.

WYETH BIOTECH CAMPUS 2008 ANNUAL ENVIRONMENTAL REPORT
75
4.5.5 Summary of testing on underground pipes and tanks In 2008 the following repairs were conducted at the Campus;
• Relining of minor crack to foul sewer pipelines detected during 2007 survey
In 2008 the following integrity testing on underground pipework and tanks was conducted at the Campus; • Annual CCTV survey of entire foul sewer pipe work (2 minor faults). • 3 yearly CCTV survey, incorporating pressure testing on one section, of the
underground trade effluent pipe work (no defects recorded). • 3 yearly CCTV survey of the underground spill containment pipe work (no
defects recorded). • Annual water holding test on spill containment tank + CCTV survey of spill
containment tank (no defects were recorded).
4.6 Bund Integrity Testing IPPC Licence Condition 9.4.1 requires that all bunds be tested at least once every 3 years. A visual integrity survey was carried out in September 2008. A competent chartered civil engineer was retained to complete the visual inspection of the bund structure and of any lining where applied in order to certify the integrity of the existing bunds on-site. The bunds were examined internally and externally and floor channels were inspected from ground level. Overall the bunds were in good condition. There were some hairline cracks observed on some of the bund walls. These cracks have been repaired and have been visually inspected by a competent civil engineer and deemed to be satisfactory. A copy of the report is attached in Appendix 6.
4.7 Review of Residuals Management Plan IPPC Licence Condition 14.2.1 requires that a fully detailed and costed plan for the decommissioning or closure of the site or part of shall be prepared. Accordingly Wyeth submitted a Residuals Management Plan (RMP) to the Agency on the 29SEP04.
The RMP prepared on behalf of Wyeth by Arup Menzies Consulting Engineers addressed the key issues, which would occur in an orderly shutdown of all or part of the site activities i.e. well planned and well financed. The basis of the plan is to ensure that, upon implementation, the facility would be in a suitable state for future industrial use and its condition would not pose a risk to human health and safety or environmental contamination. No factors were identified that would indicate an unusual liability for the site in comparison with other process industry sites. The total costs estimated to be required to execute the residuals management plan at 2004 values was in the region of €11 million.

WYETH BIOTECH CAMPUS 2008 ANNUAL ENVIRONMENTAL REPORT
76
In accordance with Condition 14.2.2 the RMP should be reviewed annually and proposed amendments detailed within the AER for agreement with the Agency. Following a review of the SEP04 RMP for the purposes of the 2008 AER, Wyeth concludes, that no modifications/alterations has occurred at the site that requires amendments to RMP.
4.8 Review of Environmental Liabilities Insurance Cover IPPC Licence Condition 15.3.1 requires the completion of a fully costed Environmental Liabilities Risk Assessment (ELRA). Accordingly Wyeth submitted an ELRA to the Agency on the 29SEP04.
The ELRA was prepared by Arup Menzies Consulting Engineers and followed the format of a risk assessment. The ELRA concluded that the area in the vicinity of the Wyeth site is not considered to be environmentally sensitive. Mitigation measures have been incorporated into the design of the plant to minimise the potential for environmental impacts. During normal operations the facility is not expected to have any significant environmental liability. As with any industrial process, during abnormal operations it is possible for environmental liabilities to occur. In general, the risk associated with abnormal activities on site is considered to be acceptable and therefore the environmental liability costs would be covered by Wyeth’s public liability insurance. In accordance with Condition 15.3.3 the amount of indemnity shall be reviewed and revised as necessary on an annual basis. The conclusion of the SEP04 ELRA is that the risk associated with abnormal activities on site is considered to be acceptable and that environmental liability costs are covered by Wyeth’s public liability insurance remains unchanged.
4.9 Water Conservation Report
4.9.1 Water Use Overview The purpose of this section of the AER is to report on the efforts taken on Campus to reduce water demand and the volume of wastewater discharged to sewer. This report is prepared in accordance with Condition 10.3 of the IPPC Licence.
2008 was reflective of the significant time and financial investments made over the last 5 years in reducing, reusing and recovering water. The successes of the water conservation programme at the Campus will be outlined in this report. In addition the ongoing activities to further reduce the quantity of water use and dependence will be presented.
Firstly, it is important to highlight the significant role that water and clean water supplies play in the manufacture and delivery of important medicines at the Campus.

WYETH BIOTECH CAMPUS 2008 ANNUAL ENVIRONMENTAL REPORT
77
All products manufactured at the site involve the use of water as a raw material within the manufacturing process. In particular, the Drug Substance operation for the manufacture of Enbrel, used for the treatment of moderate to severely active rheumatoid arthritis (RA) in adult and juvenile patients, incorporates significant quantities of water in make up vessels for preparation of media and buffers to support manufacturing. All sterile prescription products call for the highest level of cleanliness and good manufacturing practice (GMP) in the pharmaceutical industry.
Clean water systems are therefore a critical aspect of operations at the Grange Castle facility. A key engineering requirement is to provide and maintain a system, which generates and delivers water meeting all pharmaceutical regulatory specifications for use in manufacturing operations. In addition to in-process demand there is also a high demand for water during cleaning and sterilisation activities on-site. Coupled to this is water use within utility systems including utility water for clean and plant steam systems, domestic hot water and heating/ventilation systems.
The following section outlines data on water usage and associated discharge volumes in 2008.
4.9.2 Water Usage and Discharge Volumes (2008) The largest manufacturing area on Campus, Drug Substance has seen sustained high-level manufacturing throughout 2008. There was also a high level of activity across the other manufacturing areas including Vaccines Conjugation, Vial Fill/Finish and the start of validation activities in Syringe Fill/Finish.
The Emission Limit Value (ELV) for the volume of trade effluent to be discharged from the Grange Castle site is 1850m3/day. This value was not exceeded on any occasion during the 2008 AER reporting period. This represents a similar level of sustained performance in the previous 3 years.
The total volume of water supplied to the site from the local authority mains water supply during 2008 was 618,729 m3. This was a 22% decrease on 2007 (795,024 m3).
The total volume of trade effluent discharged from the site (at IPPC Licence emission point TE-1) during the AER reporting period was 432,246 m3. This total volumetric discharge represents a 3% decrease from 2007 (442,359m3). This is a significant reduction considering the Campus ramped up and continued to have a high level of activity in 2008.

WYETH BIOTECH CAMPUS 2008 ANNUAL ENVIRONMENTAL REPORT
78
The apparent discrepancy between a 22% decrease in water intake and a 2% decrease in volume discharged can be explained as follows. The difference between incoming and outgoing water volumes can be accounted for through;
a) Water directed to the foul water system and b) Drain down of the utility & fire water storage tanks for inspection. Neither of these water users on-site discharge through the trade effluent system. c) Water used for make up of cooling tower water supply (which is subsequently
lost to atmosphere through vapour losses). Less water was used in the cooling towers in 2008 as the summer period was cooler than normal.
d) In addition there was a shutdown in Drug Substance in Q1’08 that would have resulted in reduced water consumption.
Table 4.10 below compares the average monthly waste water discharge values for 2007 and 2006. It can been seen that there has been either a continued reduction or stabilisation of waste water discharge each month throughout 2008 compared to 2007 and 2006.
Figure 4.9.1 below graphically represents data on trade effluent volumetric flow from the site from the period JAN08 to DEC08.
Table 4.10: Comparing 2006 to 2008 Monthly Discharge Averages (m3/day)
MONTH 2008 DAILY AVERAGE (m3)
2007 DAILY AVERAGE (m3)
2006 DAILY AVERAGE (m3)
January 1007 1220 1487
February 893 1099 1427
March 1045 1262 1471
April 1212 1163 1651
May 1148 1144 1605
June 1184 1187 1627
July 1321 1258 1650
August 1260 1359 1531
September 1119 1214 1327
October 1258 1191 1384
November 1354 1269 1400
December 1347 1160 1379

WYETH BIOTECH CAMPUS 2008 ANNUAL ENVIRONMENTAL REPORT
79
Trade Effleunt Volume Flow (01Jan08 - 31Dec08)
0
200
400
600
800
1000
1200
1400
1600
1800
2000
08/01/01 08/01/31 08/03/01 08/03/31 08/04/30 08/05/30 08/06/29 08/07/29 08/08/28 08/09/27 08/10/27 08/11/26 08/12/26
Date
Volu
me
(m3/
day)
Daily Discharge IPPC Limit

WYETH BIOTECH CAMPUS 2008 ANNUAL ENVIRONMENTAL REPORT
80
4.9.3 Water Conservation Activities (2008) In 2004 a cross discipline team was set up to analyse the water usage on site and predict future flow rates based on additional production coming on line and the site fully ramping up. This led to a multi-phase approach being undertaken to reduce/ reuse water on site. Phase 1 led to a series of projects to reuse water on site most notably to eliminate the use of utility water as a cooling medium. The 2005 and 2006 AER outlined the key water conservation projects referred to as Phase 1 projects undertaken in 2005 and 2006.
The next phase of the overall site plan for water usage reduction was the recycling of wastewater. The main focus for water conservation on Campus in 2006 was the Implementation of the Phase 2 water project. This project incurred a significant financial investment at the Campus (€750,000). This project also incorporated a significant level of engineering expertise in the design and execution of a solution to capture the reject Reverse Osmosis (RO) water and treat it so it could be used as usable water feed at the Campus.
Phase 1 and 2 water reduction projects have been successfully completed. The opportunities for further water reduction projects are not immediately obvious therefore the water reduction team deemed it necessary to proceed to the next phase of the water reduction project.
Phase 3 focused on water measuring and monitoring and providing real time data on water so unusual trends in water usage could be investigated and corrective action taken promptly. The water mass balance for the Campus was reviewed to see which streams were metered and if the data was recorded on one of the Building Management Systems (BMS). A gap analysis was completed to determine what meters and automation would be required to ensure that all streams could be measured and any unusual trends flagged for investigation. The project cost of phase 3 is in the order of €700,000. The additional meters were installed and connected to the automation system. A web based reporting format called Water Analysis Project (WAP) was also developed and that gathers all water usage information from the different automation systems providing the data in one location. This project will help sustain the water savings achieved to date and identify water reduction projects going forward. The application has already identified a saving of approximately 40 m3 a day by removing a quench cooler from the Manufacturing Suites, implementation of this project has been included in the scope of work for the ACC-001 project.
4.9.4 Ongoing Water Conservation Measures Overall the water conservation projects implemented since 2004 have been successful in optimising, reducing and recovering water use on-site. This has been evident in the continued reduction in discharge volumes in 2008.

WYETH BIOTECH CAMPUS 2008 ANNUAL ENVIRONMENTAL REPORT
81
The focus for 2009 will be on measuring and monitoring water consumption and associated water discharge. It is envisaged that this measuring and monitoring of water will aid in sustaining the excellent work completed to date and help identify further water reduction projects.
4.10 Efficient Use of Raw Materials Raw materials are used directly in the manufacture of pharmaceutical and biopharmaceutical products and also indirectly in the use of raw materials in the activities that support manufacturing.
The environmental aspects for raw materials usage were assessed at the Campus and it was identified that raw materials are strictly controlled in order to comply with cGMP (Current Good Manufacturing Practice) requirements. In addition, the raw materials used have a high cost due to the specialised nature of the raw materials and the requirement to have very high purity. Therefore, a specific objective and target has not been set for efficient use of raw materials as efficiencies are currently maximised due to design, cGMP and high costs.
As outlined in section 2.4.2 a significant proportion of hazardous waste generated in 2008 was material that has exceeded the cGMP expiry date or material that was purchased for a manufacturing process that was no longer operational. This quantity of waste is regarded as a once off event as the change over from one manufacturing process to another for the same product is an unusual event. In addition a review of the cGMP expiry dates and quantities ordered for the large quantity raw materials have been reviewed and revised by the Supply Chain Group to ensure that large quantities of raw material does not expire.
4.11 Energy Management Report
4.11.1 Energy Management Overview This energy management report presents details on the approach adopted by the Campus in reducing energy usage across the site. It is noted that the Campus is a participant in the EU Greenhouse Gas Emissions Trading Scheme (EPA Permit Register No. GHG-026).
The Campus is a typical pharmaceutical plant in the sense that there is very little incremental energy use associated with an additional unit of output. The largest energy use is for maintaining pharmaceutical-quality conditions throughout the plant. Specifications for “pharmaceutical quality” include tight temperature and humidity conditions and prescribed air quality. Because of these requirements, pharmaceutical-manufacturing plants must consume a great deal of energy regardless of the quantity of output. Generally, these prescribed conditions and to

WYETH BIOTECH CAMPUS 2008 ANNUAL ENVIRONMENTAL REPORT
82
a lesser extent, weather, are the leading drivers of energy use in a pharmaceutical manufacturing plant.
Wyeth’s commitment to energy efficiency is also reflected through the appointment of a dedicated Energy Manager in 2008. The development of the system was on a phased basis, as set out in the Energy MAP process. In the Commitment phase a Project Sponsor and Energy Manager were appointed and an Energy Policy was drafted by the Energy Team. In the Identification Phase an overview of the total energy use was determined along with the key factors that influence gas and electricity usage. The significant users of steam and electricity were also determined. Savings have been maximised by focusing on the largest energy users as identified by this analysis. In the Planning Phase energy reduction projects were identified and project plans implemented to complete the projects. Section 4.9.3 outlines these projects in more detail. In the Action Phase the Energy Policy was communicated as part of the Site Wide email. As part of the Green Link Magazine a summary update on the energy saving project was detailed as well as ways in which employees could reduce energy. A register of energy saving opportunities was also developed. In the Review Phase the current measuring and monitoring capabilities were reviewed and the gaps identified. A web based electrical monitoring system was developed to augment the existing site utility and water monitoring system (WAP). Additional metering for the steam system has been purchased and will be installed in late spring 2009 when access is available to the targeted heating systems. Wyeth is committed to developing the energy management system further over the next few years and this will be tracked as part of the Environmental Management Programme.
4.11.2 Energy Use for 2008 Tables 2.17, 2.18 and 2.19 present data on natural gas, fuel oil and electricity usage for 2008. There has been a 1.7% increase in overall consumption of natural gas compared to 2007. In 2007 the quantity of gas consumed was 128,438 MWh which, in 2008 this increased to 130,586 MWh. This increase occurred during a year which had a longer heating season than the previous. In 2008 there were 2292 degree days below 10°C, compared with 2026 for 2007 (ref Met Eireann Data – Casement). The use of fuel oil reduced in 2008 (59.1 m3 versus 96.5 m3 consumed in 2007). Fuel oil is used as a back up to natural gas in the boilers and as the primary fuel for the emergency generators. The emergency generators and boilers are routinely tested on oil to ensure they will operate if the need arises. There were

WYETH BIOTECH CAMPUS 2008 ANNUAL ENVIRONMENTAL REPORT
83
no interruptions to electricity or natural gas supply during 2008 which ensured oil use was confined to routine testing. There was a 1.8% decrease in the consumption of electricity in 2008 compared to 2007. In 2007 the quantity consumed was 91,609 MWh. In 2008 this figure decreased to 89,986 MWh. The HVAC cooling season for 2008 was shorter in 2008 compared to 2007 with 723 degree days above 10°C compared with 792 for 2007. Figures 4.11.1 & 4.11.2 below compare the natural gas and electricity trends for 2007& 2008.
Figure 4.11.1 – Natural Gas Consumption 2007 & 2008
Gas Consumption 2007-2008
0
2,000,000
4,000,000
6,000,000
8,000,000
10,000,000
12,000,000
14,000,000
16,000,000
Jan Feb Mar Apr May Jun Jul Aug Sep Oct Nov Dec
Month
KW
hr 20082007

WYETH BIOTECH CAMPUS 2008 ANNUAL ENVIRONMENTAL REPORT
84
Electricity Consumption 2007-2008
6,000,000
6,500,000
7,000,000
7,500,000
8,000,000
8,500,000
Jan Feb Mar Apr May Jun Jul Aug Sep Oct Nov Dec
Month
KW
hr 20082007
Figure 4.11.2 – Electricity Consumption 2007 & 2008
4.11.3 Energy Saving Projects 2008 There was a number of energy saving projects instigated in 2008. This section provides a brief description of the projects and the estimated savings that the projects yielded.
4.11.3.1 Chiller System Optimisation The purpose of this project was to improve the demand site efficiency of the HVAC chilled water system. This project was intended to augment efficiency work carried out on the chilled water generation system in 2007. The chilled water system provides a cooling medium for the sites HVAC system. The project work involved a full review of the entire chilled water distribution on a building by building basis. Particular attention was given to short circuiting of the utility, supply balancing and heat-cool conflicts. A major component of the project was a full re-balance of the Drug Substance chilled water distribution. The overall result of the project was a reduction in the total chilled water flow volume to the site, with an increase in the “delta T” (difference between supply & return temperatures). This change increased the heat rejection capacity per unit of chilled water resulting in reduced pumping requirements and electricity savings.

WYETH BIOTECH CAMPUS 2008 ANNUAL ENVIRONMENTAL REPORT
85
In addition to the reduced pumping requirements the increase in “delta T” of the system allowed for an improvement in the COP (coefficient of performance) of the chiller system. The coefficient of performance of a refrigeration system is the ratio of energy extracted to the amount of energy put into the system. During 2008, the average COP of the Grange Castle chilled water system improved from 4.3 to 4.7. The actualised annual savings from this project are 900 MWhr of electricity.
4.11.3.2 Monitoring & Measurement
In 2007, a requirement to allow detailed energy consumption analysis was identified as a driver for future energy efficiency projects. Grange Castle already had an abundance of data regarding the operation of systems and equipment; however retrieval and analysis of the information proved difficult. In 2008, a web based system for amalgamating this information was developed. This system provides information from existing electricity meters, and virtual meters which are based on equipment information from the site’s other control systems such as the BMS (Building Management System) and MCS (Manufacturing Control System). This system will be used as the basis for reporting on 2009 energy programme.
4.11.3.3 Office Area HVAC Recommissioning
Office area HVAC systems were originally commissioned during the construction of the site in 2002-2003. Re-commissioning of systems in 2008 to match actual requirements rather than estimated design requirements allowed for reductions in electricity consumption by the AHU (air handling unit) fans. Analysis of actual performance of the systems also allowed for the introduction of a diversity factor to the systems operating set point. This ensures that the system operates at an optimum airflow set point, rather than a calculated set point based on the maximum capacity of the system. Actualised energy reductions of 190 MWhr per year were achieved.
4.11.3.4 Reduced De-humidification A change in environmental requirements in a classified manufacturing area (Grade A & B clean rooms) in the Manufacturing Suites Building allowed for a reduction in the requirement for dehumidification. The original room specification was for a low relative humidity of between 20 to 50%. The new room specification allowed for the de-commissioning of a de-humidification unit which incorporated a desiccant wheel, and utilised plant steam for regeneration. The actual annualised savings from the project were 245 MWhr (gas) and 15 MWhr (electricity).

WYETH BIOTECH CAMPUS 2008 ANNUAL ENVIRONMENTAL REPORT
86
4.11.3.5 Banking of Steam Boilers during low demand Grange Castle is currently served by 4 plant steam boilers giving a combined steam capacity of 62,000 kg per hour. Peak demand of the system requires that a minimum of 3 boilers are operating at any one time. The operation of additional boilers to the minimum required gives rise to low boiler loading with an associated reduction in efficiency. It is however necessary to have sufficient standby capacity in case of a duty boiler failing during operation. The use of banking pressure switches was introduced which ensures that the off duty boiler will operate at below the site pressure. This means, the boiler is retained in a “hot” standby state, without exporting steam to the site at low efficiency. The only firing requirement for the off duty boiler is to make up for standing (thermal) losses. Comparison of a boiler operating at an inefficient low firing rate to that of a boiler in banking mode demonstrates an improvement of 3,000 MWhr (gas) per year.
5.0 Conclusion
This Annual Environmental Report (AER) is presented for the Wyeth Biotech Campus at Grange Castle for 2008. It is clear that as the Campus develops and increases its manufacturing operations, environmental affairs on site continue to be prioritised. This is demonstrated by the Campus achieving 100% compliance with the IPPC Licence in 2008 along with maintaining certification to ISO 14001: 2004. The management of environmental affairs is being conducted in a systematic, transparent and continually improving manner. Section 2 of this report presents summary data on environmental self-monitoring at the Campus. Organic and nutrient emission loadings to sewer decreased in 2008 in line with the decrease in discharge volume and all results were well within Emission Limit Values (ELVs). With regard to emissions to atmosphere all results were in compliance with the ELVs. The quantity of sustaining hazardous waste decreased in 2008 as a result of waste reviews across the campus. In the area of non-hazardous waste, the Campus decreased the quantity of non hazardous waste produced compared to 2007 and continued to increase the portion of waste being recycled rather than being disposed to landfill. The recycling rate for 2008 was 77%. All monitoring of groundwater, surface water and noise at the Campus indicated no impact to these environmental media as a result of activities on site. EPA inspections (both announced and unannounced) at the Campus in 2008 did not report any non-compliance with the relevant areas being reviewed (i.e. IPPC and GMM). There were no environmental related complaints received. There were two minor environmental incidents at the Campus in 2008 and 100% compliance was achieved.

WYETH BIOTECH CAMPUS 2008 ANNUAL ENVIRONMENTAL REPORT
87
Section 3 presents details on the Environmental Management Programme (EMP) at the Campus. 2008 was a successful year with almost all objectives and targets set by Wyeth for the year being achieved which helped sustain continual environmental improvement. Actions are included for all the major environmental aspects at the site including hazardous and non-hazardous waste, water usage and energy. The European Pollution Release Transfer Register (E-PRTR) was completed and submitted to the Agency. Section 4 presents specific reports on many of the key environmental activities on Campus. The Solvent Management Plan (SMP) indicates that the overall fugitive emission rate as a percentage of the total solvent input was 13.6%. It is noted that this value is above the stipulated value of 5% detailed within the IPPC Licence. However the total solvent input, 31,830.2kg, is significantly below the 50,000kg threshold outlined in the VOC directive. Wyeth considers the environmental significance of this result to be negligible. The results of respirometry and acute toxicity results on trade effluent demonstrated no impact of the Wyeth discharge to the downstream treatment systems. The underground tank and pipeline inspection and repair programme at the Campus continued in 2008 with no significant issues noted. The bund survey was completed and all necessary repairs carried out. The water conservation report demonstrates that significant progress has been made reducing water demand. In the area of energy management the Campus continued to develop the energy management system that has helped identify energy reduction projects which have resulted in substantial electricity and natural gas savings. Overall, 2008 was a very good year for environmental performance. The Campus achieved 100% environmental compliance and continuous improvement through proper planning, effective programme implementation, successful management review and commitment inline with the environmental management system that maintained certification to I.S EN ISO 14001 in 2008. Wyeth considers that the drive towards continual improvement at the Campus will achieve similar levels of environmental success in 2009.

WYETH BIOTECH CAMPUS 2008 ANNUAL ENVIRONMENTAL REPORT
88
Appendix 1- Groundwater Monitoring Locations

WYETH BIOTECH CAMPUS 2008 ANNUAL ENVIRONMENTAL REPORT
89

WYETH BIOTECH CAMPUS 2008 ANNUAL ENVIRONMENTAL REPORT
90
Appendix 2 - Previous Groundwater Monitoring Results

WYETH BIOTECH CAMPUS 2008 ANNUAL ENVIRONMENTAL REPORT
91

WYETH BIOTECH CAMPUS 2008 ANNUAL ENVIRONMENTAL REPORT
92

WYETH BIOTECH CAMPUS 2008 ANNUAL ENVIRONMENTAL REPORT
93

WYETH BIOTECH CAMPUS 2008 ANNUAL ENVIRONMENTAL REPORT
94

WYETH BIOTECH CAMPUS 2008 ANNUAL ENVIRONMENTAL REPORT
95

WYETH BIOTECH CAMPUS 2008 ANNUAL ENVIRONMENTAL REPORT
96

WYETH BIOTECH CAMPUS 2008 ANNUAL ENVIRONMENTAL REPORT
97

WYETH BIOTECH CAMPUS 2008 ANNUAL ENVIRONMENTAL REPORT
98
Appendix 3 – Noise Monitoring Locations

WYETH BIOTECH CAMPUS 2008 ANNUAL ENVIRONMENTAL REPORT
99

WYETH BIOTECH CAMPUS 2008 ANNUAL ENVIRONMENTAL REPORT
100
Appendix 4 – Respirometry & Toxicity Report

WYETH BIOTECH CAMPUS 2008 ANNUAL ENVIRONMENTAL REPORT
101

WYETH BIOTECH CAMPUS 2008 ANNUAL ENVIRONMENTAL REPORT
102

WYETH BIOTECH CAMPUS 2008 ANNUAL ENVIRONMENTAL REPORT
103

WYETH BIOTECH CAMPUS 2008 ANNUAL ENVIRONMENTAL REPORT
104

WYETH BIOTECH CAMPUS 2008 ANNUAL ENVIRONMENTAL REPORT
105

WYETH BIOTECH CAMPUS 2008 ANNUAL ENVIRONMENTAL REPORT
106

WYETH BIOTECH CAMPUS 2008 ANNUAL ENVIRONMENTAL REPORT
107

WYETH BIOTECH CAMPUS 2008 ANNUAL ENVIRONMENTAL REPORT
108

WYETH BIOTECH CAMPUS 2008 ANNUAL ENVIRONMENTAL REPORT
109
Appendix 5 – Survey of Underground Pipes and Tanks

WYETH BIOTECH CAMPUS 2008 ANNUAL ENVIRONMENTAL REPORT
110
Foul Sewer Survey

WYETH BIOTECH CAMPUS 2008 ANNUAL ENVIRONMENTAL REPORT
111
CAMERA SURVEY REPORT
AT
GRANGE CASTLE,
CLONDALKIN,
DUBLIN 22.
CLIENT: Wyeth Medica Ltd CONTACT: Mr. Bryan Mulchinock DATE: August 2008.

WYETH BIOTECH CAMPUS 2008 ANNUAL ENVIRONMENTAL REPORT
112
August 20th, 2008. Ref No:- Wyeth008 F.A.O. Mr. Bryan Mulchinock Wyeth Medica, Wyeth Biopharma Campus, Clondalkin, Dublin 22.
CAMERA SURVEY REPORT Re: Wyeth Biopharma
Dear Mr. Mulchinock, Further to our recent visit to the above location, please find enclosed our report with regard to our findings. 1) Purpose: CCTV Survey of foul sewer drains. 2) Method: A) Hydro jetting of foul sewer. B) CCTV of the foul sewer using Pierpoint 900 camera. C) All footage recorded on DVD and VHS. D) Footage reviewed and report compiled. 3) Fault categories: 3 faults were noted and they are based on four categories: A) crack in pipe connections with no infiltration. B) crack in pipe connections with infiltration. C) crack in pipe with no infiltration. D) crack in pipe with infiltration. 4) Results: The survey found two lines with fault A, F1.09A t0 F1.09B and F1.09B to F1.09C. Recommendations: 1): lining of pipes by USA ltd. for three main faults. Yours sincerely, ALAN BYRNE CAMERA OPERTOR

WYETH BIOTECH CAMPUS 2008 ANNUAL ENVIRONMENTAL REPORT
113
FOUL WATER DRAINS Manhole No Observations Distance Total Distance F4.15 D-S F4.16 - 100mm Conn @ 12 O’ Clock 19.3m (225mm-Co) - F4.16 37.2m F4.15 U-S F4.14 - 100mm Conn @ 12 O’ Clock 27.9m (225mm-Co) - F4.14 50.8m F4.15 U-S F7.01 (225mm-Co) - F7.01 16.7m F9.01 U-S F9.02 (300mm-Co) - F9.02 22.6m F9.01 D-S F9.00 - F9.00 66.6m (300mm-Co) F9.03 U-S F9.02 - F9.03 8.3m (300mm-Co) F9.03 U-S FMC - FMC 5.2m (300mm-Co) F1.11 D-S F9.00 - F9.00 12.7m (300mm-Co) F1.11 U-S F1.10 - F1.10 36.5m (300mm-Co) F1.11 D-S F1.11A - F1.11 18.7m (300mm-Co) F1.09 U-S F1.10 - F1.10 48.7m (300mm-Co) F1.09 D-S F1.08 - F1.08 27.3m (300mm-Co) F1.08 D-S F1.07 - F1.07 45.4m (300mm-Co) F1.06A D-S F1.06B - F1.06B 48.5m (300mm-Co) F1.06B D-S F1.07 - F1.07 46.3m (300mm-Co) F1.06A U-S F1.06 - F1.06 44.2m (300mm-Co)

WYETH BIOTECH CAMPUS 2008 ANNUAL ENVIRONMENTAL REPORT
114
F1.05 D-S F1.06 - F1.06 15.1m (300mm-Co)
FOUL WATER DRAINS
Manhole No Observations Distance Total Distance F1.04 D-S F1.05 - F1.05 67.5m (300mm-Co) F1.04 D-S F1.03 - F1.03 33.8m (300mm-Co) F1.03 U-S F1.02 - F1.02 47.8m (300mm-Co) F1.12 D-S F1.12A - F1.12A 35.5m (300mm-Co) F1.13 U-S F1.12A - F1.12A 20.3m (300mm-Co) F1.13 U-S F10.00 - F10.00 5.4m (225mm-Co) F10.00 U-S F1.14 - F1.14 17.0m (225mm-Co) F2.07 U-S F2.08 - F2.08 11.3m (300mm-Co) F2.08 U-S F2.09 (300mm-Co) - 100m connection @ 2 O’ Clock 17.1m - F2.09 17.9m F2.05 U-S F2.07 - 150m connection @ 3 O’ Clock 22.5m (300mm-Co) - F2.07 42.1m F2.05 D-S F2.04 - 100m connection @ 10 O’ Clock 19.m (300mm-Co) - 100m connection @ 10 O’ Clock 48.5m - F2.04 50.2m F2.03 D-S F2.02 (300mm-Co) - F2.02 52.2m F2.02 D-S F1.02A - F1.02A 126.8m (375mm-Co) - F2.01 M/H 37.5m F2.02 U-S F3.01 - F3.01 64.6m (300mm-Co) F3.01 U-S F3.02 - F3.02 32.1m

WYETH BIOTECH CAMPUS 2008 ANNUAL ENVIRONMENTAL REPORT
115
(300mm-Co) F3.03 U-S F3.02 - F3.02 30.8m(300mm-Co)
Manhole No Observations Distance Total Distance F3.04 D-S F3.03 - 100m connection @ 1 O’ Clock 52.3m (300mm-Co) - F3.03 56.8m F4.02 U-S F1.04 - F4.01 M/H 50.6m (300mm-Co) - F1.04 72.8m F4.02 D-S F4-03 - F4.03 50.3m (300mm-Co) F4.03 D-S F4.04 - F4.04 35.9m (300mm-Co) F4.04 U-S F4.05 - F4.05 16.0m (300mm-Co) F4.05 U-S F4.06 - F4.06 23.3m (300mm-Co) F3.03 D-S F3.02 - F3.02 30.5m (300mm-Co) F4.13 U-S F6.01 - F6.01 35.5m (300mm-Co) F4.13 U-S F4.14 - F4.14 50.1m (300mm-Co) F4.13 D-S F5.02 - F5.02 32.3m (300mm-Co) F5.02 D-S F4.11 - F4.11 16.8m (300mm-Co) F4.10 D-S F4.09 - F4.09 36.5m (300mm-Co) F4.10 U-S F4.11 - F4.11 43.9m (300mm-Co) F4.09 U-S F2.10 - F2.10 30.6m (300mm-Co) F2.09 U-S F2.10 - F2.10 35m (300mm-Co)

WYETH BIOTECH CAMPUS 2008 ANNUAL ENVIRONMENTAL REPORT
116
FOUL WATER DRAINS
Manhole No Observations Distance Total Distance F2.10 U-S F4.09 - F4.09 32.5m (300mm-Co) F2.10 U-S F4.08A - F4.08A 14.5m (300mm-Co) F2.10 D-S F2.09 - F2.09 36.2m (300mm-Co) F1.09A U-S F1.09B - 1.7m crack in pipe connections with no infiltration. (150mm-Co) - 2.9m crack in pipe connections with no infiltration.
- 11.7m crack in pipe connections with no infiltration. - F1.09B 15.5m
F1.09B U-S F1.09C - 2.9m crack in pipe connections with no infiltration. (150mm-Co) - 6.6m crack in pipe connections with no infiltration. - F1.09C 10.5m F1.09A U-S F1.09 - F1.09 31.2m (150mm-Co) F6.02 D-S 6.01 - F6.01 27.5m (300mm-Co)

WYETH BIOTECH CAMPUS 2008 ANNUAL ENVIRONMENTAL REPORT
117
Trade Effluent Survey

WYETH BIOTECH CAMPUS 2008 ANNUAL ENVIRONMENTAL REPORT
118
CAMERA SURVEY REPORT
AT
GRANGE CASTLE,
CLONDALKIN,
DUBLIN 22.
CLIENT: Wyeth Medica Ltd CONTACT: Mr. Bryan Mulchinock/Sean Healy DATE: October 2008.

WYETH BIOTECH CAMPUS 2008 ANNUAL ENVIRONMENTAL REPORT
119
October 30th, 2008. Ref No: - Wyeth008 – Trade Effluent F.A.O. Mr. Bryan Mulchinock/Mr Sean Healy Wyeth Medica, Wyeth Biopharma Campus, Clondalkin, Dublin 22.
CAMERA SURVEY REPORT Re: Wyeth Biopharma
Dear Mr. Mulchinock/Mr Healy, Further to our recent visit to the above location, please find enclosed our report with regard to our findings. 1) Purpose: CCTV Survey of Trade Effluent Drains 2) Method: E) CCTV of the Tank using Pierpoint 900 camera. F) All footage recorded on DVD and VHS. G) Footage reviewed and report compiled. 3) Fault categories: E) crack in pipe connections with no infiltration. F) crack in pipe connections with infiltration. G) crack in pipe with no infiltration. H) crack in pipe with infiltration. 4) Results: We surveyed all the sections of Trade Effluent Drain network and found no faults or defects, One line is holding water going into the tank but this is due to volume. Yours sincerely, Alan Byrne CAMERA OPERTOR

WYETH BIOTECH CAMPUS 2008 ANNUAL ENVIRONMENTAL REPORT
120
Trade Effluent Drains
Manhole No Observations Distance Total Distance T1.03 U/S T1.03A N/A (225 CI) 12.20m T1.03A U/S T1.04 Camera Under Water 7.2m (225 CI) 9.70m T1.03 D/S T3.03A N/A (225 CI) 45.60m T3.03A D/S T3.03 N/A (225 CI) 3.30m T1.03 D/S T1.02 N/A (225 CI) 24.8m T9.05A D/S T9.05 N/A (150 CI) 21.7m T9.05 D/S T9.04 N/A (150 CI) 20.2m T9.04 D/S T9.03A N/A (150 CI) 5.9m T9.03A D/S T9.03 N/A (150 CI) 12.2m T9.03 D/S T9.02 100mm Conn @12 O Clock 7.5m (150 CI) 150mm Conn @3 O Clock 8.1m 8.2m T9.05A D/S T9.05B N/A (150 CI) 31m T9.05B D/S T9.05C N/A (150 CI) 11.7m T9.01 D/S Tank 150mm Conn@3 O Clock 35.5m (225 CI) 42m T9.01 D/S T9.0 N/A (225 CI) 24.3m

WYETH BIOTECH CAMPUS 2008 ANNUAL ENVIRONMENTAL REPORT
121

WYETH BIOTECH CAMPUS 2008 ANNUAL ENVIRONMENTAL REPORT
122

WYETH BIOTECH CAMPUS 2008 ANNUAL ENVIRONMENTAL REPORT
123

WYETH BIOTECH CAMPUS 2008 ANNUAL ENVIRONMENTAL REPORT
124

WYETH BIOTECH CAMPUS 2008 ANNUAL ENVIRONMENTAL REPORT
125
Spill Containment Survey

WYETH BIOTECH CAMPUS 2008 ANNUAL ENVIRONMENTAL REPORT
126
CAMERA SURVEY REPORT
AT
GRANGE CASTLE,
CLONDALKIN,
DUBLIN 22.
CLIENT: Wyeth Medica Ltd CONTACT: Mr. Bryan Mulchinock/Sean Healy DATE: October 2008.

WYETH BIOTECH CAMPUS 2008 ANNUAL ENVIRONMENTAL REPORT
127
October 30th, 2008. Ref No: - Wyeth008 – Spill Containment F.A.O. Mr. Bryan Mulchinock/Mr Sean Healy Wyeth Medica, Wyeth Biopharma Campus, Clondalkin, Dublin 22.
CAMERA SURVEY REPORT Re: Wyeth Biopharma
Dear Mr. Mulchinock/Mr Healy, Further to our recent visit to the above location, please find enclosed our report with regard to our findings. 1) Purpose: CCTV Survey of Spill Containment Drains 2) Method: H) CCTV of the double contained pipes using Pierpoint 900 camera. I) All footage recorded on DVD and VHS. J) Footage reviewed and report compiled. 3) Fault categories: I) crack in pipe connections with no infiltration. J) crack in pipe connections with infiltration. K) crack in pipe with no infiltration. L) crack in pipe with infiltration. 4) Results: We surveyed a total of 306 metres of Spill Containment Drain network and found no faults or defects. Two lines are holding water ST4.03 u/s ST4.04 and ST4.02 u/s ST4.03, this is due to water volumes during the survey and no remediation is required. Yours sincerely, Alan Byrne CAMERA OPERTOR

WYETH BIOTECH CAMPUS 2008 ANNUAL ENVIRONMENTAL REPORT
128
Spill Containment Drains
Manhole No Observations Distance Total Distance ST4.01 d/s ST4.00 N/A (225 CI) 9.20m ST4.01 u/s ST4.02 N/A (225 CI) 22.00m ST4.02 u/s ST4.03 Water level 20% 21.5m (225 CI) 28.20m ST4.03 u/s ST4.04 Water level 10% 10.70m Water level 10% 24.50m (225 CI) 39.00m ST4.04 u/s Tank N/A (225 CI) 6.10m ST5.01 d/s ST5.00 N/A (225 CI) 8.60m ST5.01 u/s Tank N/A (225 CI) 7.80m ST6.01 u/s S6.00 N/A (225 CI) 68.40m ST6.01 d/s S6.02 N/A (225 CI) 17.10m ST6.02 u/s Tank N/A (225 CI) 15.30m ST7.02 u/s S7.01 N/A (225 CI) 18.80m ST7.02 d/s S7.03 N/A (225 CI) 4.50m ST7.03 u/s Tank N/A (225 CI) 7.90m ST7.01 u/s S7.00 N/A (225 CI) 38.20m ST5.01 u/s Tank N/A

WYETH BIOTECH CAMPUS 2008 ANNUAL ENVIRONMENTAL REPORT
129
(225 CI) 8.20m
Spill Containment Drains
Manhole No Observations Distance Total Distance ST8.01 u/s S8.00 N/A (225 CI) 16.00m ST8.01 u/s Tank N/A (225 CI) 14.90m ST8.01 u/s S8.00 N/A (225 CI) 16.00m 306.00m

WYETH BIOTECH CAMPUS 2008 ANNUAL ENVIRONMENTAL REPORT
130
CAMERA SURVEY REPORT
AT
GRANGE CASTLE,
CLONDALKIN,
DUBLIN 22.
CLIENT: Wyeth Medica Ltd CONTACT: Mr. Bryan Mulchinock DATE: August 2008.

WYETH BIOTECH CAMPUS 2008 ANNUAL ENVIRONMENTAL REPORT
131
August 18th, 2008. Ref No: - Wyeth008 – 172 SCT F.A.O. Mr. Bryan Mulchinock Wyeth Medica, Wyeth Biopharma Campus, Clondalkin, Dublin 22.
CAMERA SURVEY REPORT Re: Wyeth Biopharma
Dear Mr. Mulchinock, Further to our recent visit to the above location, please find enclosed our report with regard to our findings. 1) Purpose: CCTV Survey of Spill Containment Tank 2) Method: K) CCTV of the Tank using Pierpoint 900 camera. L) All footage recorded on DVD and VHS. M) Footage reviewed and report compiled. 3) Fault categories: 1 fault was noted and they are based on four categories: M) Crack in wall/floor/roof of tank with infiltration. N) Crack in wall/floor/roof of tank with no infiltration. O) Minor plaster damage with infiltration. P) Minor plaster damage with no infiltration, and only plaster repair needed. 4) Results: We surveyed the tank with two operatives in the Tank, Michael Foran and Bryan Dunne, Alan Byrne captured the footage in CCTV Unit above ground. A Grade D fault was noticed in the pipe. The North Wall inlet pipe was noticed to have the plaster degraded over the bitumen/rubber sealant on part of the inlet pipe. This needs a minor re-plaster job to cover over the bitumen/rubber sealant. Yours sincerely, Alan Byrne CAMERA OPERTOR

WYETH BIOTECH CAMPUS 2008 ANNUAL ENVIRONMENTAL REPORT
132
Spill Containment Tank
Wall Facing Observations North Wall - Wall is intact with no faults. East Wall - Top of tank has minor plaster problem. See cursor on CCTV images. No fault as plaster is still intact. No repair needed. West Wall - Ladder on wall inspected for faults but bitumen cover is still intact
on all steps of ladder. North Wall - Inlet pipe survey shows Fault Category D. Minor plaster problem,
degradation of plaster over bitumen seal. Re-plaster needed. Overall Tank Overview - Walls, entry/exit ladders, tank roof and all walls, North, East,
South and West are in good condition.

WYETH BIOTECH CAMPUS 2008 ANNUAL ENVIRONMENTAL REPORT
133
Spill Containment Tank Water Holding Test

WYETH BIOTECH CAMPUS 2008 ANNUAL ENVIRONMENTAL REPORT
134

WYETH BIOTECH CAMPUS 2008 ANNUAL ENVIRONMENTAL REPORT
135
Appendix 6 – Bund Integrity Survey

WYETH BIOTECH CAMPUS 2008 ANNUAL ENVIRONMENTAL REPORT
136

WYETH BIOTECH CAMPUS 2008 ANNUAL ENVIRONMENTAL REPORT
137

WYETH BIOTECH CAMPUS 2008 ANNUAL ENVIRONMENTAL REPORT
138

WYETH BIOTECH CAMPUS 2008 ANNUAL ENVIRONMENTAL REPORT
139

WYETH BIOTECH CAMPUS 2008 ANNUAL ENVIRONMENTAL REPORT
140

WYETH BIOTECH CAMPUS 2008 ANNUAL ENVIRONMENTAL REPORT
141

WYETH BIOTECH CAMPUS 2008 ANNUAL ENVIRONMENTAL REPORT
142

WYETH BIOTECH CAMPUS 2008 ANNUAL ENVIRONMENTAL REPORT
143

WYETH BIOTECH CAMPUS 2008 ANNUAL ENVIRONMENTAL REPORT
144

WYETH BIOTECH CAMPUS 2008 ANNUAL ENVIRONMENTAL REPORT
145

WYETH BIOTECH CAMPUS 2008 ANNUAL ENVIRONMENTAL REPORT
146

WYETH BIOTECH CAMPUS 2008 ANNUAL ENVIRONMENTAL REPORT
147

WYETH BIOTECH CAMPUS 2008 ANNUAL ENVIRONMENTAL REPORT
148

WYETH BIOTECH CAMPUS 2008 ANNUAL ENVIRONMENTAL REPORT
149

WYETH BIOTECH CAMPUS 2008 ANNUAL ENVIRONMENTAL REPORT
150

WYETH BIOTECH CAMPUS 2008 ANNUAL ENVIRONMENTAL REPORT
151
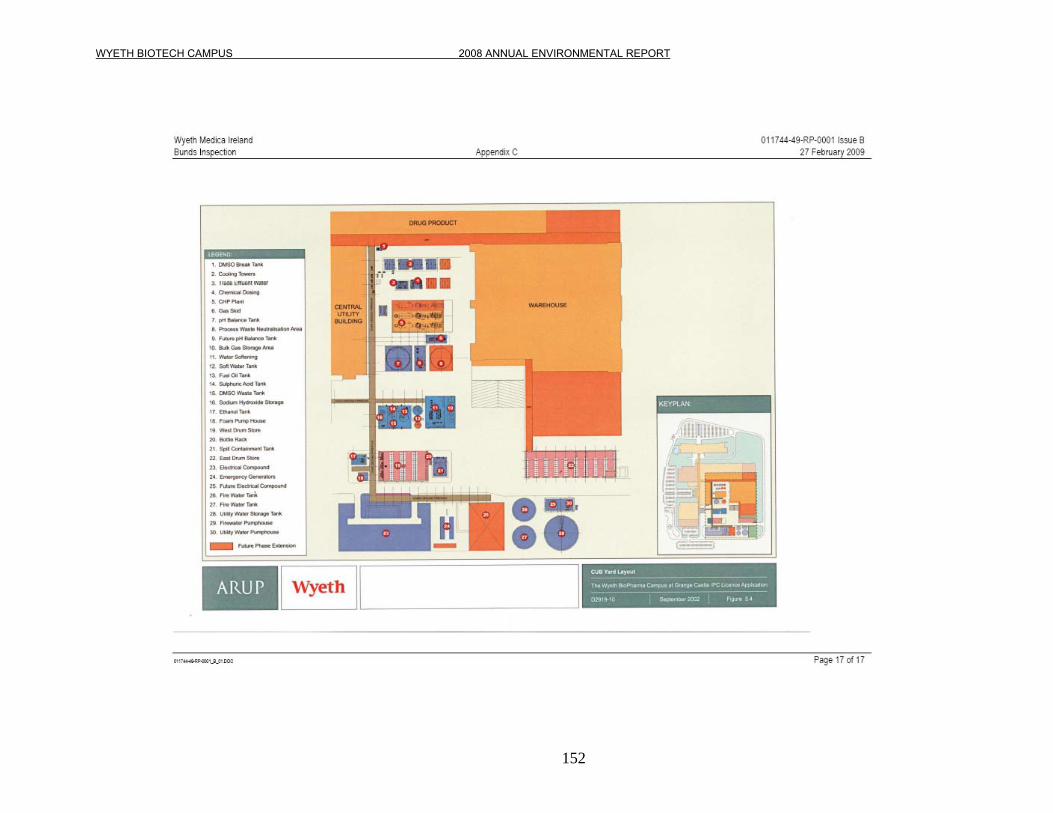
WYETH BIOTECH CAMPUS 2008 ANNUAL ENVIRONMENTAL REPORT
152

WYETH BIOTECH CAMPUS 2008 ANNUAL ENVIRONMENTAL REPORT
153

WYETH BIOTECH CAMPUS 2008 ANNUAL ENVIRONMENTAL REPORT
154

WYETH BIOTECH CAMPUS 2008 ANNUAL ENVIRONMENTAL REPORT
155

WYETH BIOTECH CAMPUS 2008 ANNUAL ENVIRONMENTAL REPORT
156

WYETH BIOTECH CAMPUS 2008 ANNUAL ENVIRONMENTAL REPORT
157

WYETH BIOTECH CAMPUS 2008 ANNUAL ENVIRONMENTAL REPORT
158

WYETH BIOTECH CAMPUS 2008 ANNUAL ENVIRONMENTAL REPORT
159

WYETH BIOTECH CAMPUS 2008 ANNUAL ENVIRONMENTAL REPORT
160

WYETH BIOTECH CAMPUS 2008 ANNUAL ENVIRONMENTAL REPORT
161

WYETH BIOTECH CAMPUS 2008 ANNUAL ENVIRONMENTAL REPORT
162

WYETH BIOTECH CAMPUS 2008 ANNUAL ENVIRONMENTAL REPORT
163

WYETH BIOTECH CAMPUS 2008 ANNUAL ENVIRONMENTAL REPORT
164

WYETH BIOTECH CAMPUS 2008 ANNUAL ENVIRONMENTAL REPORT
165

WYETH BIOTECH CAMPUS 2008 ANNUAL ENVIRONMENTAL REPORT
166

WYETH BIOTECH CAMPUS 2008 ANNUAL ENVIRONMENTAL REPORT
167

WYETH BIOTECH CAMPUS 2008 ANNUAL ENVIRONMENTAL REPORT
168

WYETH BIOTECH CAMPUS 2008 ANNUAL ENVIRONMENTAL REPORT
169

WYETH BIOTECH CAMPUS 2008 ANNUAL ENVIRONMENTAL REPORT
170

WYETH BIOTECH CAMPUS 2008 ANNUAL ENVIRONMENTAL REPORT
171

WYETH BIOTECH CAMPUS 2008 ANNUAL ENVIRONMENTAL REPORT
172

WYETH BIOTECH CAMPUS 2008 ANNUAL ENVIRONMENTAL REPORT
173

WYETH BIOTECH CAMPUS 2008 ANNUAL ENVIRONMENTAL REPORT
174

WYETH BIOTECH CAMPUS 2008 ANNUAL ENVIRONMENTAL REPORT
175

WYETH BIOTECH CAMPUS 2008 ANNUAL ENVIRONMENTAL REPORT
176
Appendix 7 – Pollution Release & Transfer Register

WYETH BIOTECH CAMPUS 2008 ANNUAL ENVIRONMENTAL REPORT
177

WYETH BIOTECH CAMPUS 2008 ANNUAL ENVIRONMENTAL REPORT
178

WYETH BIOTECH CAMPUS 2008 ANNUAL ENVIRONMENTAL REPORT
179

WYETH BIOTECH CAMPUS 2008 ANNUAL ENVIRONMENTAL REPORT
180

WYETH BIOTECH CAMPUS 2008 ANNUAL ENVIRONMENTAL REPORT
181

WYETH BIOTECH CAMPUS 2008 ANNUAL ENVIRONMENTAL REPORT
182

WYETH BIOTECH CAMPUS 2008 ANNUAL ENVIRONMENTAL REPORT
183

WYETH BIOTECH CAMPUS 2008 ANNUAL ENVIRONMENTAL REPORT
184