the world b g w d.c. transport papers 2008...
TRANSCRIPT

THE WORLD BANK GROUP WASHINGTON, D.C.
Review of Cost of Compliance with the New International Freight Transport Security Requirements
Consolidated Report of the Investigations Carried Out in Ports in the Africa, Europe and Central Asia, and Latin America and the Caribbean Regions
C. Bert Kruk and Michel Luc Donner
TRANSPORT SECTOR BOARD
TRANSPORT PAPERS TP-16
FEBRUARY 2008


REVIEW OF COST OF COMPLIANCE WITH THE NEW INTERNATIONAL FREIGHT TRANSPORT SECURITY REQUIREMENTS CONSOLIDATED REPORT OF THE INVESTIGATIONS CARRIED OUT IN PORTS IN THE AFRICA, EUROPE AND CENTRAL ASIA, AND LATIN AMERICA AND THE CARIBBEAN REGIONS
C. Bert Kruk and Michel Luc Donner
THE WORLD
BANK Washington, D.C.
TRANSPORT SECTOR BOARD
© 2008 The International Bank for Reconstruction and Development/The World Bank 1818 H Street NW Washington, DC 20433 Telephone 202-473-1000 Internet www/worldbank.org Published February 2008 The findings, interpretations, and conclusions expressed here are those of the author and do not necessarily reflect the views of the Board of Executive Directors of the World Bank or the governments they represent. This paper has been produced with the financial assistance of a grant from TRISP, a partnership between the UK Department for International Development and the World Bank, for learning and sharing of knowledge in the fields of transport and rural infrastructure services. To order additional copies of this publication, please send an e-mail to the Transport Help Desk [email protected] Transport publications are available on-line at http://www.worldbank.org/transport/

iii
CONTENTS
Contents................................................................................................................. iii 1 Introduction........................................................................................................ 1
1.1 General ........................................................................................................ 1 1.2 Methodology of execution................................................................................ 4 1.3 UNCTAD Report Maritime Security: ISPS Code Implementation, Costs and Related
Financing ...................................................................................................... 5 2 Africa Region....................................................................................................... 7
2.1 Introduction .................................................................................................. 7 2.2 Port characteristics......................................................................................... 7 2.3 Status of the ISPS Code in the ports considered ................................................. 8 2.4 Investments in ISPS....................................................................................... 9 2.5 Port Security related costs............................................................................. 10 2.6 Cost overview of Ports A1, A2 and A3 ............................................................. 11
3 Europe and Central Asia Region ............................................................................13 3.1 Introduction ................................................................................................ 13 3.2 Port Characteristics ...................................................................................... 13 3.3 Status of the ISPS Code in Ports B1 and B2 ..................................................... 14 3.4 Status of ISPS in Ports B3, B4 and B5 ............................................................. 15 3.5 Port security related costs ............................................................................. 17 3.6 Total security costs and costs per unit............................................................. 21
4 Latin America and the Caribbean Region ................................................................27 4.1 Introduction ................................................................................................ 27 4.2 Port characteristics....................................................................................... 27 4.3 Status of ISPS in the ports considered............................................................. 28 4.4 Port security related costs ............................................................................. 30 4.5 Total security costs and costs per unit............................................................. 34
5 Overall Results and Conclusions............................................................................37 6 UNCTAD Report Maritime Security: ISPS Code Implementation, Costs and Related
Financing .....................................................................................................41 7 Comparison of the Results of Both Studies and Final Observations .............................47 Annex: Terms of Reference: Review of Cost of Compliance with New International Freight
Transport Security Requirements.....................................................................49


v
“The ISPS Code is a comprehensive set of measures adopted by the International Maritime Organization to enhance the security of ships and port facilities. The purpose of the Code is to provide a standardized, consistent framework for evaluating risk, enabling Governments to offset changes in threat with changes in vulnerability for ships and port facilities through determination of appropriate security levels and corresponding security measures. The ISPS Code is mandatory for the 148 countries which are party to SOLAS (Safety of Life At Sea) Convention.”

1
REVIEW OF COST OF COMPLIANCE WITH NEW INTERNATIONAL FREIGHT TRANSPORT SECURITY REQUIREMENTS
CONSOLIDATED REPORT OF THE INVESTIGATIONS CARRIED OUT IN PORTS IN THE AFRICA, EUROPE AND CENTRAL ASIA,
AND LATIN AMERICA AND THE CARIBBEAN REGIONS
1 INTRODUCTION 1.1 General Without transport there is no economic development and, in a reciprocal conclusion, the more efficient transport is, the better is the development. Bearing in mind that more than 90 percent of the world trade in tons per year is transported by sea and against the background of increasing ship sizes (especially in the container trade) and continuously growing globalization, the requirements for adequate and secure port facilities and the resulting logistics challenges are accelerating worldwide.
The International Ship and Port Facility Security Code (ISPS Code) is a comprehensive set of measures to enhance the security of ships and port facilities and came into force on the July 1, 2004. The ISPS Code is implemented through chapter XI-2 “Special measures to enhance maritime security” in the International Convention for the Safety of Life at Sea (SOLAS). The Code has two parts, one mandatory (Part A) and one recommendatory (Part B). Compliance is mandatory for the 148 contracting parties to SOLAS; detailed implementation of the Code is a matter for the individual national governments.
The introduction of the ISPS Code has led to many questions and misunderstandings. The Code does not, as would have been useful, prescribe in exact terms and data what port facility and port managers have to do or provide to ensure that they are compliant. Part A of the ISPS Code actually is a type of questionnaire that asks questions about security items, but then stops short of giving exact and uniform instructions as to how the specific measures can be established. A simple example is the fencing of the port facility. The ISPS Code describes that the port facility has to be fenced adequately so as to prevent illegal intruders from entering the facility. But the Code does not describe the type of fence, its height and so on. This has led to situations in which a Port Authority considered its fence adequate, but found out later that other entities, such as security consultants or the US Coast Guard, did not fully agree with this, and sometimes even not at all. The ISO (International Organization for Standardization) has made an attempt to ‘translate’ the ISPS Code in a type of handbook, but the result in fact was another questionnaire.
In December 2006 the Secretary General of the IMO Mr. Mitropoulos, admitted that the ISPS Code was inconsistently implemented from port to port and from country to country, leading to his famous statement: ‘It is time for another book on ISPS.’
In essence, the ISPS Code takes the approach that ensuring the security of ships and port facilities is a risk management activity and that, in order to determine which security measures are appropriate, an assessment of the risks must be made in each particular case. And that is where the core of the problem lies: Every individual may judge a given situation differently.

2 REVIEW OF COST OF COMPLIANCE WITH NEW INTERNATIONAL FREIGHT TRANSPORT SECURITY REQUIREMENTS
Box 1-1. It is time for another book on ISPS
Since its inception the ISPS Code has seen all kinds of clever people telling anyone who'll listen whether they think it’s good, bad, or just plain awful. Some of them speak the truth, others are just trying to drum up business, but you know what is about to hit the fan when the secretary-general of the IMO starts to express “serious concerns.” As part of his opening speech to the December session of the Maritime Safety Committee, Mr. Mitropoulos said the UN agency must not lose sight of the work still needed on the proper implementation of security measures in port facilities. “I have serious concerns stemming from various reports I have seen” said Mr. Mitropoulos. Quoting from a report compiled by the Lyndon B. Johnson School of Public Affairs, he said: “From country-specific research and site visits, it became clear just how inconsistent ISPS is from port to port and country to country. While the language of ISPS is uniform in each port and each country, it was as if [we] were seeing several different codes. Not only has ISPS been implemented in different ways and with varying levels of success, but overall opinions of ISPS among shippers, port workers and Government officials fluctuate as well.” Mr Mitropoulos said that the IMO secretariat would have to draft a new manual to assist in the uniform implementation of the code. Experience shows, for every port that makes the investment, and understands the need for security, there are hundreds more that don't care, and simply look to shift the pressure and emphasis back onto the vessels that call there. The IMO was never seemingly comfortable making their rules work ashore (even for the magical little piece of land, the “port facility”), and it seems that a chink in the maritime security armor is definitely developing. Ports, and the authorities that oversee them are simply not dancing to the IMO tune. No fences, holes in fences, no id checks, systematic abuses of seafarers rights…yes, it seems that despite the number of very good port security systems, there are some which are letting the side down, and who gets punished for visiting these shambled ports? Yes, the poor ship and crew. What we see is that while ships are heavily regulated, and have to comply with and apply universal legislation, many ports, aside from those within the Container Security Initiative (CSI) or handling particularly sensitive cargoes, often escape the same degree of scrutiny. One of the major reasons that shipping was able to react reasonably adroitly to this new legislation was down to the procedures put in place to deal with ISM. So, with this in mind, the IMO has now recognized that the requirements of the ISPS Code and of a Ship Security Plan (SSP) simply regurgitate many things contained in a good safety management system (SMS), and so they are looking to now integrate elements of the two Codes to avoid duplication of effort. It always seemed to us that an emergency remains just that, regardless of cause. So whatever the situation whether it be a fire, a man-overboard, or an injured crewman, they all need reacting to via the advice and guidance in the SMS…not the SSP. Sure, security is great for creating awareness of the threats being faced, but it doesn't really do much for the aftermath…that's what good old fashioned seamanship is for. (Source: Shiptalk, January 2007)
As mentioned, the purpose of the Code is to provide a standardized, consistent framework for evaluating risks, enabling governments to offset changes in threat with changes in vulnerability for ships and port facilities through the determination of appropriate security levels and corresponding security measures, taken either by the government, the shipping companies, the ports or any other entity holding responsibility for maritime security. In this context a port has three main tasks, i.e. • To carry out a Port Facility Security Assessment (PFSA), which should address the following
elements: physical security, structural integrity, personnel protection systems, procedural policies, radio, telecommunications and IT systems, relevant transport infrastructure, utilities and other areas posing a risk to persons, property or operations within the port facility;
• To set up a Port Facility Security Plan (PFSP), which should detail the security organization of the port facility, establish the organization’s links with other relevant authorities and ships in port, detail the basic physical and operational security measures for the three different security levels, and describe the reporting procedures to the appropriate contact points, and

Introduction 3
• To designate a Port Facility Security Officer (PFSO), whose responsibilities include conducting comprehensive security survey of the port facility, development, maintenance, implementation and exercising the PFSP, undertaking regular security inspections, ensuring adequate training to security personnel, ensuring that security equipment is properly tested, operated and maintained, and coordinating the implementation of PFSP with the company security officers and ship security officers.
Part A of the Code is mandatory for all port facilities that service cargo ships of 500 Gross Tons (GT) and above and that are sailing international voyages. According to the definition of Lloyds’ Register / Fairplay there are more than 2,800 international cargo ports in the world. However, not only the port, but all single terminals (facilities) have to comply with the ISPS Code, which increases the number to some 6,500 port facilities around the world. This is a probably a low estimate. The Port of Rotterdam, for example, has close to 150 separate port facilities. The immediate challenge to the port community then is how to finance the costs of the ISPS implementation, incorporate and adjust them to pricing and marketing strategies while maintaining market shares and achieving reasonable profit margins. The long term challenge involves adjusting relations with suppliers and customers so as to ensure flexible and competitive supply chains, capable of overcoming risk and vulnerability threats while still delivering value to customers and users. In general, there are three different approaches to financing ISPS induced costs: • Operators or users pay the costs of regulation and pass them on to customers down in the supply
chain; • Port Authorities bear all costs from their own budget with no security surcharge to users; • Other Public Authorities bear all costs from the national budget (i.e. the tax payer pays) with no
security surcharge to users, or • Costs are shared between all parties such as in terms of public grants or as a private public
partnership. A comparison of costs of security measures directed towards ports is far more difficult than for those targeting ships and shipping companies. Not only are ports very dissimilar in terms of organizational, operational and management systems, but also security measures targeting them differ in time, space, scope and nature, and, as mentioned above in the interpretation of the ISPS Code. Before and directly after the introduction of the ISPS Code, on July 1, 2004, many articles appeared in the maritime press estimating or guessing the investments that would be required and with what amount stevedoring charges would increase as a consequence of the ISPS Code implementation. For instance, the costs to implement port security in the Australian ports was estimated to require an investment of more than US$200 million, and figures as high as US$30 per TEU and figures of several dollars per ton of general cargo were mentioned in articles as well. In particular developing countries had two major worries: not being able to provide the funds for these large investments in security measures on the one hand, and not being considered compliant on the other. It was feared that (perceived) non-compliance could obstruct direct shipping links between developing countries and the West European and the United States ports in particular. Or, alternatively, that ships coming from non-compliant ports would be subject to Port State Control (a very thorough search of the vessel that may take as much as a week time to complete) when arriving in a US or West European ports. Or maybe even worse: such vessel might be altogether barred from entering ports in those regions of the world. In those days many ‘Client Countries’ and organizations approached the World Bank for information and assistance. In a number of countries the Bank was successful in executing ISPS Compliance studies. But the Bank also launched the initiative to execute ‘the Costs of ISPS Compliance Study.’ The objective of this project was to carry out a review of the cost of compliance with the Code in a number of ports in some of the regions of the world. With financial support from the Norwegian, the Netherlands and the German Trust Funds three consultant firms were selected and contracted through an official bidding process to execute the field investigations and submit the respective reports on the basis of the Terms of Reference drafted by the

4 REVIEW OF COST OF COMPLIANCE WITH NEW INTERNATIONAL FREIGHT TRANSPORT SECURITY REQUIREMENTS
Port Experts of the Transport Unit of the Energy, Transport and Water Department (ETW) of the World Bank. In total 12 ports or port facilities were investigated: three in West Africa, two in the Baltic Sea, three in the Black Sea and four in the Latin American and the Caribbean region. The investigations had to be executed along the principles of the Terms of Reference drafted by the World Bank (see Annex). Although it was stressed that the objective of this study was not to assess the compliance of the respective port or port facility, it turned out that some ports authorities and terminal operators were reluctant to participate in the study, fearing that the report of their port / facility would conclude partial or non-compliance and that this conclusion could lead to repercussions, not only in shipping patterns but also in the field of competition with other ports in the region. It was therefore proposed and agreed, that this Consolidated Report does not mention the specific names of the countries or the ports that were selected for this project. The countries and ports have been labeled as follows: West African Region: • Country AFR01 and Port A1 • Country AFR02 and Port A2, and • Country AFR03 and Port A3. Baltic and Black Sea Regions: • Country ECA01 and Port B1 • Country ECA02 and Port B2 • Country ECA03 and Port B3, and • Country ECA04 and Port B4 and Port B5. Latin American and the Caribbean Region: • Country LAC01 and Port L1 • Country LAC02 and Port L2 • Country LAC03 and Port L3, and • Country LAC04 and Port L4. 1.2 Methodology of execution The methodology of execution of the project by the consultants was in all cases quite similar. The project team collected information of the countries, the ports and other relevant items through desk research, interviews and discussions with representatives of the ports and a number of terminals, port users and government representatives. Interviews and port/terminal assessments were facilitated by the use of ISPS Code Implementation Checklists and cost estimating matrices. These checklists and matrices were in most cases prepared and sent to the respective ports before the actual missions took place, in order give the persons to be interviewed the time required to consult others and to try and collect the information. Port Managers and Staff interviewed usually included the Director General, the Port Facility Security Officer (PFSO), his Deputy PFSO(s), and managers of Security, Engineering, Planning, Operations, Finance and Information Technology (IT). In addition, the consultants executed physical security assessments at the port / port facility. The consultants also conducted interviews in the ports with representatives of the principal private operators, freight forwarders and shippers using the facilities. A guided discussion process (usually on the basis of a checklist) was used to collect information about the magnitude of the costs the port users have incurred, or are likely to incur, to comply with the new security requirements. Indirect costs and benefits such as changes in cargo flow or the incidence of theft were often addressed as well. In addition, meetings were arranged with representatives of the Contracting governments to collect information about costs they incurred for ISPS implementation and

Introduction 5
maintenance. Representatives of government agencies / departments such as Customs, Immigration, military and police were interviewed as well. For the calculation of the costs as a consequence of the implementation of the ISPS, the consultants collected financial information on Investment and Operational or Running costs. Whenever available, the investments were separated into investments in security that had been made before the introduction of the ISPS Code, and those that were very clearly made as an ISPS implementation consequence. In addition, whenever possible, the ISPS related investments were calculated on a yearly basis, using the best estimate for the estimated economic lifetime of the investment. In some cases, the consultants had great difficulty in obtaining financial data, as mentioned above, as security was being regarded as highly confidential and an essential component of the port or terminal competitiveness. In such instances the consultants yet tried their utmost to estimate data, also based on their international experience with the topic. When relevant, some consultants also included in their reports investments that were, in their professional opinion, additionally required to lift the level of the security to the minimum international standard. If information was available, they also mention the implication of such additional investments on the costs per TEU and the cost per ton. 1.3 UNCTAD Report Maritime Security: ISPS Code Implementation, Costs and Related
Financing In March 2007 the United Nations Conference on Trade and Development (UNCTAD) published its Report ‘Maritime Security: ISPS Code Implementation, Costs and Related Financing.’ Against the same background as the World Bank initiative, i.e. that implementing the ISPS obligations entails costs and potential economic implications, UNCTAD conducted a global study. The Executive Summary of the Report UNCTAD/SDTE/TLB/2007/1 of March 14, 2007 contains the following background. A copy of the full report can be downloaded at www.unctad.org/ttl/legal. ‘The global study was conducted based on a set of questionnaires designed to obtain first hand information from all affected parties. The main objective of the study was to establish the range and order of magnitude of the ISPS Code-related expenditures made from 2003 through 2005 and to gain insight into the financing mechanisms adopted or envisaged. In addition the study sought to clarify matters relating to the implementation process, level of compliance and to other less easily quantifiable impacts.’ The conclusions of this important survey are presented at the end of this Consolidated Report and the results are compared to the outcomes of the World Bank project.


7
2 AFRICA REGION 2.1 Introduction The objective of the project was to establish the costs involved of meeting the new maritime transport security requirements, as defined in the ISPS Code. The work compiled an inventory of the different measures made mandatory by the Code and established a range of costs assessments based on case studies for the subject ports:
• Country AFR01: Port A1 • Country AFR02: Port A2, and • Country AFR03: Port A3.
The project looked at the costs incurred by the port, the governments and by private transport operators, and sought to illustrate their impact on the transport costs, focusing in particular on containers.
The report submitted enabled the World Bank to assess: • Actions completed and planned to fulfill the ISPS Code; • Recent investment and maintenance costs by the ports; • Direct and indirect costs incurred by port users; • Direct costs incurred by the contracting governments; and • Implementation investment and maintenance costs for items in the near future.
2.2 Port characteristics Port A1 is under the National Port Authority (NPA) which also includes the other 9 smaller ports in the country. Port A1 is by far the largest national seaport and predominantly handles import cargo. In addition to being a normal loading and unloading port, A1 is also an important traffic junction for the transit of goods to/from other countries, including a number of landlocked countries. Port A1 handles nearly three quarters of Country A1’s total maritime trade. The port currently follows a service port model but is amidst a long term (several years) transition to become a landlord port. Port A1 is in the process of developing a dedicated container terminal. Port A2 is by far the largest national seaport and handles approximately 95 percent of all national cargo of country AFR02. Similar to Port A1, the predominant export products are timber and forest and agricultural products. Import cargoes, like most other African ports, cover the complete range of multipurpose cargo: containers, palletized goods, bulk products, second hand cars, etc. Port A2 does not handle any liquid bulk cargoes. Alike Port A1, Port A2 is also an important transit port for a number of regional landlocked countries. Port A2 – as opposed to Port A1 – has a dedicated terminal that handles containers and roll-on/roll-off cargo only. The terminal is operated by a consortium of large international operators. The container terminal is located inside the general ISPS port, and has its own entrance, security, etc. In 2004 the container terminal handled some 60 percent of all containers passing through Port A2. Also Port A3 is the major national port of Country A3, handling about 90 percent of the national seagoing cargo. The second biggest port of the country is predominantly a fishing port, however, a big one as such Port A3’s main export products are salt, fish products, general cargo, fluorspar, copper, lead and other minerals. Import is dominated by general cargo and liquid bulk cargoes. Port A3 has a dedicated container terminal. In addition to this, one of the major global container shipping lines is operating its own depot for empty containers only. The container terminal is inside the general ISPS Port, and has its own entrance, security, etc. The container terminal handles all containers passing through Port A3. A throughput comparison of the three ports is provided in Table 2-1.
Table 2-1. Throughputs of Ports A1, A2 and A3
Port A1 A2 A3
Cargo throughput (million tons) 8.44 6.13 2.76
Containers handled in 2004 (TEU) 342,000 184,500 50,300

8 REVIEW OF COST OF COMPLIANCE WITH NEW INTERNATIONAL FREIGHT TRANSPORT SECURITY REQUIREMENTS
2.3 Status of the ISPS Code in the ports considered Port A1 The Ministry of Transport is the contracting government entity for port security. The Ministry formed an ad-hoc Security Committee during ISPS Code planning. After the national ports had been ISPS certified, the Committee was dissolved. The Harbor Master in Port A1 is the Port Facility Security Officer (PFSO). The PFSO is the officer for two facilities in Port A1: the Container Terminal and remaining port area, and each facility has its designated Deputy PFSO. The PFSO also is the chairperson of the Port Security Committee that includes the two Deputy PFSO’s, the Port Security Manager and representatives of the Port Police, the Immigration Department, the Bureau of National Investigations, the Army and the Navy. The Port Security Manager – not to be confused with the PFSO – is in charge of 312 security staff divided into four crews that provide security duties on basis of 24 hours per day, seven days per week. Several port security upgrades that were recommended in the Port Security Faculty Assessment had already been implemented at the time of the mission of the consultant. Others upgrades were planned, but were still in the process of being implemented. The status of application of the ISPS Code in Port A1 did not seem adequate at the time of the mission (2005), and the consultant’s opinion was that in most European countries and in the USA, Port A1 would likely be assessed as not being ready to receive a Certificate of Compliance. To its defense, though, some actions recommended in the PFSA were still in progress, such as the new fence around the port. Port A2 The Ministry of Transport (MOT) is the authority responsible for port security. The Harbor Master is the Port Facility Security Officer (PFSO). He reports to the Director General of Port Authority (PA), who in turn reports to the MOT. The PFSO is the chairperson of the Security Committee that also includes the Representatives of the Port Police, the Stevedores Association, the shipping companies, Customs, Immigration and the Army. The PFSO functions as both the Port Security Manager and the Harbor Master - dividing his time roughly in half between the two roles. The PA already implemented several port security upgrades that were recommended by the Port Security Faculty Assessment (PFSA). However, others had been are planned, but were still in the process of being implemented. The MOT designated the PA as the Recognized Security Organization (RSO) which in turn authorized a foreign expert firm to complete the PFSA. The status of the ISPS Code implementation in Port A2 seemed less than adequate. The port would not receive its Certificate of Compliance in many other countries around the world, mainly for the following reasons: • Fencing is not complete (though under progress) • Access control is inadequate, and • Limited cargo control. The positive issue of Port A2 was that it had its (concessioned) container area under good control. The dedicated container area is well protected, clean and orderly. Port A3 The Directorate of Maritime Affairs (DMA) is the governmental authority responsible for the national port security. The Risk Manager in Port A3 is the Port Facility Security Officer (PFSO). For security breach issues, the PFSO reports to the DMA. The Security Officer for each of the eight ISPS facilities is considered as a Deputy PFSO.

Africa Region 9
The Port has established a Port Security Committee that includes representatives of the port, the Police, Customs, Immigration, Defense, Fisheries, the Municipality, the Security Association, the DMA, the Port Users Associations, Port Health and the Union. The Committee meets every three months, and the Chairman of the Port Security Committee is elected for a fixed period by the Committee members. The general security at Port A3 is outsourced to a private security company. For a fixed annual fee, the company provides security staff (an average of 40 people per day), cars, uniforms, training, communication equipment, etc. In addition to this, the Port has some 10 full time employees whose main task is to supervise the contractor’s security staff. Port A3 has implemented the port security upgrades that were recommended by the Port Security Faculty Assessment (PFSA). The consultant considered the implementation and performance of the ISPS Code in Port A3 as satisfactory. In contrast to the other African ports investigated, Port A3 would receive its Certificate of Compliance in most other countries of the world. Yet, the following shortcomings of the security measures in Port A3 may be mentioned:
• Fencing of the outer perimeter. The budgeted cost was about US$500,000. The fencing project was on the budget for the next 1 to 2 years.
• Lighting for berth 3-8. Also this was in the planning and was foreseen to be completed in the next 2 to 3 years. The estimated cost was US$800,000.
Port A3 seemed to have excellent control of its container terminal and the remainder of the port gave an impression of good control, cleanliness and order. The general impression was that cargo security was high on the agenda of the Port Management. Port A3 was also keeping a close eye on CSI (Container Security Initiative) and C-TPAT (Customs-Trade Partnership Against Terrorism) and did not exclude the possibility of joining CSI. From a shipper’s point of perspective view Port A3 appeared to be the port where the real intent of the ISPS Code – protecting ships against unauthorized access and unidentified cargo – had been taken care of in the best way. The other two African ports still had some major challenges with fencing (still going on in both ports) and access control systems or enforcement; it seemed virtually impossible to keep track of some 4 to 5,000 people who at any time could be inside these ports. While each of the ports investigated was ISPS certified, they did not necessarily have reached the same level of security, due to differences in their baseline and in the effectiveness in implementing these measures. None of the ports had invested in cargo scanners for control of export cargo. One of the ports had two scanners for import cargo control; a Customs issue and not a security measure. All three ports had been issued a Certificate of Compliance from their respective governments, but actually only in one country the higher level maritime authorities gave the impression of knowing what the ISPS was really about. From the port user’s perspective there was only positive feedback. In fact the port users were less concerned about the limited investments so far in training and ID cards than the positive benefits in terms of reduced theft and a more orderly and safer working environment. 2.4 Investments in ISPS The overview below illustrates the items in which the ports considered invested in security up to the date of the investigations; it shows the three major cost items per port. The costs are expressed in US$.
The costs incurred by the Ports are much higher than the costs incurred by the governments or the port users in AFR01 and AFR02. In AFR03 the Port Authority incurred nearly all the costs, but is recovering these from the port users through a security fee.

10 REVIEW OF COST OF COMPLIANCE WITH NEW INTERNATIONAL FREIGHT TRANSPORT SECURITY REQUIREMENTS
Indeed, none of the three governments spent significant sums of money to implement the ISPS Code. For the port users, the costs also were minimal, except for the security fee that is levied in Port A3.
Table 2-2. Investments in ISPS for three major items (in US$)
A1 A2 A3
CCTV 1,400,000 Fencing 1,000,000 Fencing and gates 230,000
Fencing around port
280,000 Lighting 300,000 Training costs 12,000
Training costs 80,000 Training costs 85,000 Handheld scanners 10,000
Rather opposite, none of the ports were able to report security related cargo delays, increased bottlenecks, or more time spent for administration and paperwork. The result seems rather to be beneficial to the ports: less disorder in the port area, reduced theft, and so on. 2.5 Port Security related costs Table 2-3 provides an overview, per port, of the realized ISPS related investments and running (or operating) costs, as well as planned and required additional investments. From the totals the annual and proportional ISPS related costs were calculated. The various annualized annual investments costs components in Table 2-3 were achieved by the consultant on the basis of a number of variables: • The investment costs • The percentage of the investments costs that was attributable to ISPS, and • The estimated life span of the investment. It should be noted that while the figures in Table 2-2 provide relatively similar results (completed and planned investments in the order of US$) this does not imply a completely similar situation in each port. Each of the three ports investigated started at a different level of safety and security. Port A3 had the highest level, but still with some shortfalls.
Table 2-3. Country comparison of port security related costs (in US$)
A1 A2 A3
Fixed Costs up to current date 1,941,333 1,519,000 238,720
Annualized Investment Costs 190,567 145,167 18,316
Operating Costs 172,873 190,265 111,796
Total Annualized Actual ISPS costs 363,441 335,432 130,112
Additional planned investments 475,000 893,000 1,437,836
Annualized Investment Costs of Additional planned investments
42,880 70,607 86,038
Additional annual planned operational costs 95,990 125,575 100,199
Total Annualized Additional ISPS costs 138,870 196,182 186,237
Additional investments required to comply with higher security standard (US standard)
3,670,000 3,500,000 4,898,358
Annualized Investment Costs of investments to comply with a higher security standard
120,199 102,777 263,568
Additional annual planned operational costs -12,000 35,000 71,284
Total Annualized Additional ISPS costs to comply with a higher security standard
108,199 137,777 334,852
Total costs: annualized and related only to the ISPS Code
610,510 669,391 651,201

Africa Region 11
The result above can be related to the throughput in the respective ports in TEU and tons, so as to reach the objective of the study: the costs per TEU and per ton of cargo. It should be noted that certain of the above investments are only partially justified by ISPS, such as scanners which benefit Customs in terms of control and revenue. 2.6 Cost overview of Ports A1, A2 and A3 Table 2-3 was translated into costs per TEU and costs per ton of cargo (Table 2-4).
Table 2-4. Costs per TEU and costs per ton of cargo (in US$)
A1 A2 A3 Cargo throughput (million tons) 8.44 6.13 2.76 Containers handled in 2004 (TEU) 342,000 184,500 50,300 Annual ISPS costs (US$) – Actual 363,441 335,432 130,112 Annual ISPS costs (US$) – Actual, planned and required to achieve standard
610,510 669,391 651,201
Cost per ton of cargo (US$) – Actual 0.04 0.05 0.04 Cost per ton of cargo (US$) – Actual, planned and required to achieve standard
0.07 0.11 0.22
Cost per TEU (US$) – Actual 1.06 1.82 2.59 Cost per TEU (US$) – Actual planned and required to achieve standard
1.79 3.63 12.95
In Table 2-4 the total costs were divided by the total number of TEU and the total tonnage of cargo handled. Another way could be to estimate the total cargo weight in all containers handled (at 8 ton per TEU as an average) and to subtract that amount from the total cargo throughput; this new figure could be labeled: Total non-containerized cargo throughput. If the exercise is repeated in this way, the following is the result for the ISPS costs per ton of non-containerized cargo; a small difference in already small amounts.
Table 2-5. ISPS costs per ton of non-containerized cargo (in US$)
Item A1 A2 A3 Cargo throughput (million tons) 8.44 6.13 2.76 Containers handled in 2004 (TEU) 342,000 184,500 50,300 Container cargo (assuming 8 ton per TEU) in million tons 2.74 1.48 0.40 Cargo throughput of non-containerized cargo 5.70 4.65 2.36 Annual ISPS costs (US$) – Actual 363,441 335,432 130,112 Cost per ton of all cargo (US$) – Actual 0.04 0.05 0.04 Cost per ton of non-containerized cargo – Actual 0.06 0.07 0.06


13
3 EUROPE AND CENTRAL ASIA REGION 3.1 Introduction In this Region the consultant carried out the investigations in five different ports in four countries. In the Baltic area these were Country ECA01 (Port B1) and Country ECA02 (Port B2). In the Black Sea area the study was carried out in two countries as well: Country ECA03 (Port B3) and Country ECA04 (Port B4 and Port B5). 3.2 Port Characteristics Ports B1 and B2 Port B1 comprises four port areas in and around the city of B1. The port recorded a throughput of some 37 million tons in 2004. It is the largest port authority in the country and comprises four main port areas. It is one of the largest ports in the Baltic Sea and is in fierce competition with other ports in the region. Because of its location, Port B1 plays an important role in cargo transit between Western Europe and Central Asia. More than 75 percent of the cargo handled in the port is transit cargo. Like many other Baltic ports, Port B1 is an important ferry and passenger port. An upward trend can also be observed in cruise traffic. This is important in relation to ISPS, as passenger traffic requires specific security measures. Port B1 is a limited liability company with the government owning 100 percent of its shares. In the past B1 underwent a complete restructuring process in which is was transformed from a service port into a landlord port. All cargo handling operations are executed by (more than 50) private companies. Port B2 is a Free Port. Due to this concept, a complete fencing of the outer perimeter of the Free Zone was already in place. Only minor repairs and additional fencing were needed to fully meet the provisions of the ISPS Code. Similar to Port B1, Port B2 is a major transit port, and about 80 percent of the throughput is transit. Port B2 also is a ferry and cruise port, though less important than Port B1. The number of private stevedoring companies is more than 30. Ports B1 and B2 also used to be important naval bases, also requiring strict security measures. The throughput particulars of the B1 and B2 are as follows.
Table 3-1. Throughputs of Ports B1 and B2
Port B1 B2 Cargo throughput 2004 (million tons) 37.3 24.0 Containers handled in 2004 (TEU) 113,000 152,000
Ports B3, B4 and B5 These ports are located on the western shore of the Black Sea. Port B3 is the largest Black Sea port with a throughput of more than 50 million tons in 2004. In the last few years, the port has seen a substantial increase in freight volumes, and especially the handling of containers shows a strong continuous growth, and the opening of a new container terminal in April 2004 is expected to a further growth in this important segment. The port is ideally linked by the hinterland by barge, rail and road. In addition the port is linked to the national pipeline system for oil, gas and diesel oil. The port covers an area of nearly 4,000 hectares located in several areas. Port B3 is a Free Port. Consequently the outside perimeter is entirely fenced and has ten access gates. There are around 200 berths, 76 facilities, operated by 47 operators. Next to the main port, the port has two so-called satellite ports. Maritime and cargo related activities are mainly performed by private companies. Since August 25, 2003, the entire territory of the Port B3 has become a port with customs facilities, which creates great advantages for the port users. The already existing fencing of the entire territory was upgraded in this period in order to meet customs requirements.

14 REVIEW OF COST OF COMPLIANCE WITH NEW INTERNATIONAL FREIGHT TRANSPORT SECURITY REQUIREMENTS
Port B4 actually consists of three major port areas, as well as a number of dedicated facilities (for the handling of general cargo, liquid and dry bulk) in the region, which are also administered by the Port Administration of B4. The total area of Port B4 is approximately 91 hectares. The 2004 throughput was close to 13 million tons and the container throughput was less than 27,000 TEU. Also Port B5 consists of three main port areas connected by two inland channels. Again similar to Port B4, Port B5 is a state owned port (under the Ministry of Transport) and managed by a state owned local operator. Port B5 is specialized in general cargo and container handling. The total port area is nearly 35 hectares. The satellite facilities include a power station, dry and liquid bulk handling and storage facilities, and a ferry complex. The throughputs of the ports are as follows.
Table 3-2. Throughputs of Ports B3, B4 and B5
Port B3 B4 B5 Cargo throughput 2004 (million tons) 50.4 12.9 7.4 Containers handled in 2004 (TEU) 386,300 26,600 78,600
3.3 Status of the ISPS Code in Ports B1 and B2 Port B1 In ECA01 the topic of port security did not get a high priority at governmental level. Factors for this were the limited time available for implementation, the (assumed?) absence of terrorist threats, and the political attention which was fully focused on the EU entrance. At governmental level the activities were limited to the setting up of a working group for port security, the drafting of the relevant legislation and the assignment of a designated authority. In the actual implementation, a major role was played by Port B1 which was the leading party in many aspects, and by the private security companies which were hired to assist in drafting of the Security Plans, training and implementation of measures. The work and costs involved were covered by the staff of the Ministries and agencies within their normal budgets. The activities to be undertaken were considered as belonging to the normal tasks and responsibilities and consequently, no separate budget line was developed for it. All costs related to the preparation of the security plans, assessments, training and implementation were thus to be covered by the owner of the port facility, which means Port B1 and the terminal operators. Other government agencies, such as Customs and the border police carry out activities and tasks related to security. Customs is responsible for checking the cargo entering and leaving the Free Zone areas in the port and has scanning facilities and access control systems for that. Customs and the border police consider their security activities and tasks, and consequently the costs involved, as part of their ’normal’ duties and operating costs and as leading to increased efficiency of the port. These activities are carried out in the same concise manner as if ISPS would not have been there. For this reason, these costs are not claimed as ISPS related costs. As mentioned, Port B1 consists of four different sections and for every port area a Port Facility Security Plan (PFSP) was drafted and implemented. PFSP’s were produced for all 38 facilities in the port and at the time of the visit of the consultant, all were in compliance with the ISPS Code and with the EU Directive (75/2004) on port security. Several years ago, the management model of Port B1 changed into that of a landlord port with Free Zones. As a consequence of this a fenced outer perimeter was already in place well before the ISPS Code came into force. The same holds for security services operating at the gates of the Free Zones and for monitoring the areas.
Europe and Central Asia Region 15
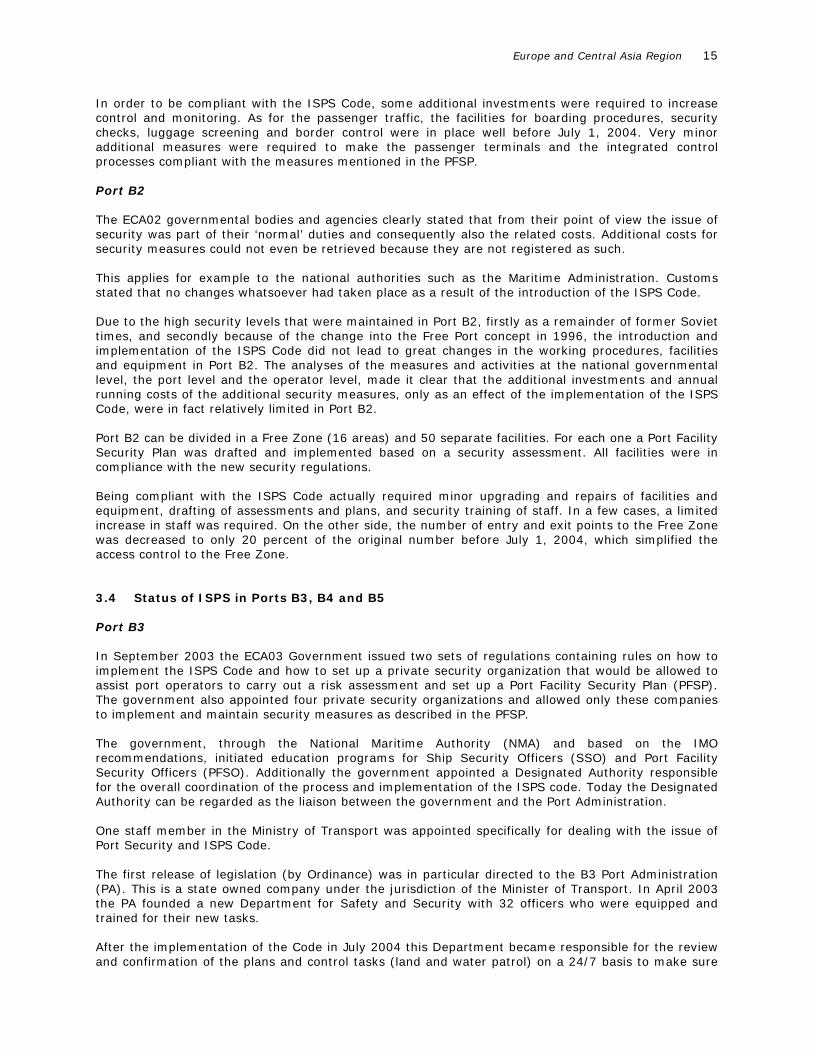
In order to be compliant with the ISPS Code, some additional investments were required to increase control and monitoring. As for the passenger traffic, the facilities for boarding procedures, security checks, luggage screening and border control were in place well before July 1, 2004. Very minor additional measures were required to make the passenger terminals and the integrated control processes compliant with the measures mentioned in the PFSP. Port B2 The ECA02 governmental bodies and agencies clearly stated that from their point of view the issue of security was part of their ‘normal’ duties and consequently also the related costs. Additional costs for security measures could not even be retrieved because they are not registered as such. This applies for example to the national authorities such as the Maritime Administration. Customs stated that no changes whatsoever had taken place as a result of the introduction of the ISPS Code. Due to the high security levels that were maintained in Port B2, firstly as a remainder of former Soviet times, and secondly because of the change into the Free Port concept in 1996, the introduction and implementation of the ISPS Code did not lead to great changes in the working procedures, facilities and equipment in Port B2. The analyses of the measures and activities at the national governmental level, the port level and the operator level, made it clear that the additional investments and annual running costs of the additional security measures, only as an effect of the implementation of the ISPS Code, were in fact relatively limited in Port B2. Port B2 can be divided in a Free Zone (16 areas) and 50 separate facilities. For each one a Port Facility Security Plan was drafted and implemented based on a security assessment. All facilities were in compliance with the new security regulations. Being compliant with the ISPS Code actually required minor upgrading and repairs of facilities and equipment, drafting of assessments and plans, and security training of staff. In a few cases, a limited increase in staff was required. On the other side, the number of entry and exit points to the Free Zone was decreased to only 20 percent of the original number before July 1, 2004, which simplified the access control to the Free Zone. 3.4 Status of ISPS in Ports B3, B4 and B5 Port B3 In September 2003 the ECA03 Government issued two sets of regulations containing rules on how to implement the ISPS Code and how to set up a private security organization that would be allowed to assist port operators to carry out a risk assessment and set up a Port Facility Security Plan (PFSP). The government also appointed four private security organizations and allowed only these companies to implement and maintain security measures as described in the PFSP. The government, through the National Maritime Authority (NMA) and based on the IMO recommendations, initiated education programs for Ship Security Officers (SSO) and Port Facility Security Officers (PFSO). Additionally the government appointed a Designated Authority responsible for the overall coordination of the process and implementation of the ISPS code. Today the Designated Authority can be regarded as the liaison between the government and the Port Administration. One staff member in the Ministry of Transport was appointed specifically for dealing with the issue of Port Security and ISPS Code. The first release of legislation (by Ordinance) was in particular directed to the B3 Port Administration (PA). This is a state owned company under the jurisdiction of the Minister of Transport. In April 2003 the PA founded a new Department for Safety and Security with 32 officers who were equipped and trained for their new tasks. After the implementation of the Code in July 2004 this Department became responsible for the review and confirmation of the plans and control tasks (land and water patrol) on a 24/7 basis to make sure

16 REVIEW OF COST OF COMPLIANCE WITH NEW INTERNATIONAL FREIGHT TRANSPORT SECURITY REQUIREMENTS
that security measures taken and carried out according to the port facility security plans of the various facilities in Port B3. The second release of legislation was provided for the identified 47 Port Operators who should comply with the provisions of the ISPS Code. This release provides, together with the guidelines, the opportunity to set up a management system to install, enhance and maintain security and to appoint a Port Facility Security Officer. All operators having their facilities within the greater Port B3 area are in compliance with the new security regulations of International Maritime Organization (IMO) and with the EU directive (725/2004) on port security, which came into force on 1 July 2004. The ISPS Code provisions implementation status for Port B3 is:
• Total port operators (in operation): 47 • Total facilities: 76 • Total number of berths: 186 • Port operators that obtained the Statement of Compliance of the Port Facility: 47.
Port B4 and B5 The institutional framework for the management and operation of the ports in ECA04 is not completely clear. The National Ports Company (NPC) actually is performing the tasks of a Port Authority and is responsible for port infrastructure, but appears to be a non-legal entity. The NPC is represented in the major national ports. The port operations are executed by state companies, which still operate the major part of all terminals. Relations between the NPC and the state companies in Port B4 and Port B5 are not clear and responsibilities are not well defined. This situation affects the implementation of security measures for the port facilities as responsibilities between the NPC and the port operators. The ISPS Code has been legally introduced by a Regulation on the Terms and Conditions to achieve security of the ships and ports (promulgated in the State Gazette on August 17, 2004). Within the ports the port services having a commercial nature such as cargo handling and passenger services, had to be carried out by specialized port operators using their own or hired qualified personnel and the required facilities to execute the respective services. The role of port operator for Port B4 and Port B5, as mentioned, is executed by the state companies in Port B4 (SCB4) and in Port B5 (SCB5) managed by Boards of Directors. The direct management of the companies is executed by the executive directors. SCB4 and SCB5 are under the system of the Ministry of Transport and Communications and under the control of NPC and its regional divisions in B4 and B5 respectively. In their activities both companies follow an independent commercial, organizational, investment and price policy. Both Ports B4 and B5 are a mixture of a landlord and a public service port. The port infrastructure belongs to the State represented by the NPC, which has its representation in the Ports. The NPC collects the port dues and fees and carries out the other SOLAS tasks through the Harbor Master. The port operations are carried out by the state companies B4 and B5, but because of the specific stipulations in the contract for port development, the fixed assets have not been transferred to the NPC. The responsibilities and control tasks related to the provisions of the ISPS Code are with the Director of the NPC, which is the Designated Authority. In practice, this position is executed by the Port Security Officer (PSO), who is also Head of the Department of Crisis Management and employed by the state company. This mix of responsibilities in fact does not have much impact on the tasks themselves as the NPC is located in the capital of the country; at a long distance from the Ports(!). For his new task the Port Security Officer was trained by a National Security Organization which was appointed by the NPC and which also carried out the risk assessments for the Ports B4 and B5. Port B5, although it contains four different facilities, is considered as one facility for which the ISPS Code related security issues were addressed in one integrated port security plan, certified by the government (NPC) and implemented and controlled by the Port Operators; in fact by the PSO. The ISPS requirements are defined in the national legal context and have been transposed into national legislation in the form of a bylaw. A Special Council for Security has been established with representatives of the Ministry of Transport, the Ministry of Interior and the Ministry of Finance. There

Europe and Central Asia Region 17
was no inventory of the costs related to this work because this project was regarded as a normal duty of the Ministries involved. Out of the normal dues and fees income of the Port, a fund has been established to assist Ports B4 and B5 in implementing more sophisticated security measures. At the time of the mission of the consultant this fund had not (yet) been used. The ports were given the free choice to contract private security organizations to carry out tasks of access control and patrolling the port facility. Due to lack of time security measures were implemented in Ports B4 and B5 in a way to reach the minimum level of compliance with ISPS on July 1, 2004. Measures to achieve a higher and more sophisticated level were in progress at the time of the mission and were expected to be finalized by the end of 2005. The Port Security Officer is responsible for the implementation, maintenance and control of the security measures. He is assisted by two Port Facility Security Officers and 62 guards of a private security organization. 3.5 Port security related costs Port B1 It is important to note that, according to the ECA01 National Port Act, all costs involved in security measures are to be covered by the owner of the port facility. In ECA02, as a consequence of the ISPS Implementation Act, the same principle applies. Only (investment) costs directly connected with the preparation and implementation of the provisions of the ISPS Code and the (running) costs of the security duties linked to the execution of tasks related to the PFSP were discussed and accepted as such. It should be noted that all parties considered the topic of port security to be highly sensitive, confidential and had many restrictions in supplying information. Thanks to the support of the Port Authority and their introductions, insight could yet be gained in measures taken and planned. As to investments and costs, restrictions were even higher as these are considered to be commercially sensitive and for that reason confidential. Despite several reminders and guarantees of confidentiality and the presentation of the figures in a non-traceable format, detailed data on costs and investments were not provided by the operators. The Port Authority has no direct influence on the operators and consequently there were no means to get access to the data. Yet, by combining the information received from the operators, the Port Authority and estimates provided by private security companies, it was possible to obtain insight in the measures taken connected to the preparation and implementation of the ISPS Code at different levels, the costs involved and the transfer of costs made to the users. Table 3-3 provides an estimate of the costs and measures which can directly be linked to the ISPS Code in Port B1. The Port Authority provided the figures from its accounting system, and included only the components that could be linked to ISPS. Costs are in US$.
Table 3-3. Estimate of the costs and measures which can directly be linked to the ISPS Code in Port B1 (in US$)
Item B1 Preparation of a security plan and assessment (only the costs of a third party)
12,500
Security services for Port section A (provided by private companies)
90,000 per month (only ISPS related costs)
Security services for Port Section B (gate access to the Free Zone area / outer perimeter and monitoring (provided by private companies)
35,000 per month (only ISPS related costs)
Improvements of the lighting of the Free Zone 125,000 Investments in video and recording systems 217,000 Investments in access control systems 50,000 Investments in surveillance systems 83,000 Other investments (which could not be further specified in the accounting system)
10,000

18 REVIEW OF COST OF COMPLIANCE WITH NEW INTERNATIONAL FREIGHT TRANSPORT SECURITY REQUIREMENTS
All costs presented in Table 3-3 are borne by the Port Authority, and fees were not raised as a consequence of these security measures. The investments and running costs are considered to be part of the regular duties and tasks of the Port B1, and are not registered separately in the administrative system of the Port. The consultant was informed that it also was not the intention to introduce a security charge in the near future. Competition between the ports in the Baltic Sea is very fierce, and the unilateral introduction of such a surcharge will affect the competitive position of the Port. Also because of the considerable passenger traffic, the balance between sales revenues and costs is very positive. In 2004, the operating profit was near 60 percent of the sales revenue. The Port was able to pay the State a dividend and paid its income tax. The need to introduce an additional security fee was therefore not present. Other costs and activities for the B1 port operators in the preparation and implementation of ISPS related measures have to be covered by the operators themselves. This includes:
• Drafting of the Port Facility Security Plan (PFSP) • Assessment of the PFSP • Initial training of the PSFO • Additional training costs for PFSO and security staff • Improvement / extension of fencing • Installation / upgrading of CCTV networks, and • Hiring of additional security guards.
The first four activities / measures are fairly similar for all facilities and on average these costs are as presented in the Table 3-4. Additional costs for fencing, CCTV networks may vary considerably for the various facilities, but some average costs per unit are shown in Table 3-4 as well. Port B2 Generally, in Port B2 most of the security measures taken by the operators were already in place, such as those related to crime control, insurance conditions and GIS inspections. Measures for terror prevention were seen as additional and therefore investment and running costs related to the implementation of the ISPS Code were seen as a minor part of the total security costs already in place. All costs related to assessments, training, plans and implementing / maintaining the security duties at port facility level are out of pocket costs for the operators and they do not receive any financial support. All the plans are based on the assessments prepared and performed by a Recognized Security Organization, approved and certified by the Maritime Administration and paid for by the operators.
Table 3-4. Cost items for operators (in US$)
Item B1 B2 Assessment of the facility and drafting of the PFSP 12,500 10,000 Yearly Audit and Certificate costs Not available 1,200 Initial training of the PFSO of one facility 800 800 Annual additional training for the PFSO 875 Not available Annual additional training for other security staff 375 400 Fencing per meter 60 47 CCTV network per camera (all in) 2,500 3,000 Hourly costs of one security man for access control and monitoring
4.5 4
Illumination per large pylon (all-in costs) Not available 11,000
Port B3 Only (investment) costs made that were directly connected with the preparation and implementation of the provisions of the ISPS Code and the (running) costs of the security duties linked to the execution of the tasks related to the PFSP, have been considered.

Europe and Central Asia Region 19
It should be noted that all parties that were requested to provide information considered this topic to be highly sensitive, confidential and consequently had restrictions in supplying information. Thanks to the support of the Ports Administration and the Ministry of Transport, the various parties involved were willing to provide some insight in the various cost elements related to the implementation of the ISPS Code. It was agreed that, for confidentiality reasons, the cost figures cannot be presented at the individual company level. The initial implementation costs of approving the 47 risk assessments and PFSP’s and initiate the Certificates were paid by the Port Administration and transferred to the Port Operators who actually paid this bill. The investments and costs involved were separated between the period of preparation and implementation, i.e. from April 2003 until July 1, 2004 and the running costs from that day onwards. The investment costs directly connected with the implementation of the tasks of the Port Administration to maintain and control the ISPS Code provisions in the port or / and the perimeters of the facilities, which can be considered to be the investment cost for preparation and implementation, are in total US$2.18 million and can be divided as follows: • Investment in equipment and training: US$1.67 million; • Renting of equipment and wages before 1 July 2004: US$0.50 million. No investments were made after July 2004 and from that day onwards the Port Authority is only confronted with the running costs. The annual running costs are US$714,675. The detailed overview of the Port Administration costs is presented in the following tables.
Table 3-5. Investment costs in equipment, hardware and training (in US$)
Item Cost New office 15,000 Furniture, computers, printers 11,250 Uniforms 56,250 Emergency equipment 23,350 Mobile VHF 11,440 Training personnel 25,230 4 new speed boats for emergency intervention 1,470,840 Fencing own facility 55,530 Costs related to set up own PFSP, assessment, certification 12,500 Total 1,668,890
Table 3-6. Costs in the preparation period until 1 July 2004 to be considered as investment (in US$)
Item Cost Wages of extra staff for preparation and implementation 345,730 Car hire 60,890 Boat hire 72,500 Office rent 16,880 Shared use of communication facilities 3,900 Total 499,900
Table 3-7. Running costs of security measures, from 1 July 2004, annually (in US$)
Item Cost Wages of extra Port Authority staff 276,585 Car hire 121,785 Boat hire 145,005 Office rent 33,750 Shared use of communication facilities 7,800 Hired security personnel access control main gate 129,750 Total 714,675
The previous Port Management was planning to install a surveillance system for the entire area outside the fence, but was confronted with huge opposition from the operators in the port, who were refusing additional payments as a consequence of this installation. The management was rethinking its

20 REVIEW OF COST OF COMPLIANCE WITH NEW INTERNATIONAL FREIGHT TRANSPORT SECURITY REQUIREMENTS
strategy and seemed more interested in installing surveillance systems only at the entry/exit points. From the ISPS Code point of view this strategy would be acceptable, as the individual facilities already had their own surveillance systems. For a number of selected terminals in Port B3 more detailed information on security measures and the costs involved was retrieved. It should be kept in mind that the security measures and consequently the figures related to these terminals are specific for the operating companies concerned. Consequently such figures do not present the average representative figures for the entire sector.
Table 3-8. Overview of the investment and running costs of a number of selected operators in Port B3 (all figures in US$, running costs on annual basis)
Company Investment Running costs Liquid bulk 1.045,000 420,000 Dry bulk 1,500,000 270,000 Container 375,000 185,000 Container 187,500 n/a General cargo 111,250 n/a
Port B4 Because of the fact that the port was considered as one facility, the investments made were very limited. There were no specific terminals to be additionally fenced and guarded within the port area, and the two gates were sufficient. Also the port had not yet appointed restricted areas, such as for dangerous cargoes. All costs related to the implementation of the Port Security Plan have been paid by the port operators. The costs can be divided in investments in security measures, related to ISPS, running costs, especially for contracting the police access control and monitoring, as well as planned investments:
Table 3-9. All costs related to the implementation of the port security plan for Port B4 (in US$)
Realized investments
Access control system 18,750 Fiber optic cable 12,500 Total 31,250
Actual running costs of the security system (annually)
Security staff 225,000 Total 225,000
Planned investment
Video control system 125,000 Total 125,000
These costs have not been recovered from an increase in port tariffs or port handling costs. Port B5 Also Port B5 was considered as one facility, although it consists of a number of separated port facilities. The number of individual facilities is at least three, but more likely seven separate ones could be distinguished. Due to lack of time, also in Port B5 the security measures were implemented with the objective to reach the minimum level of compliance with the ISPS Code on July 1, 2004. Measures to achieve a higher and more sophisticated level were in progress and were expected to be introduced gradually. The Port Security Officer is responsible for the implementation, maintenance and control of the security measures. He is assisted by his Deputy and staff and 66 security guards of a private company.

Europe and Central Asia Region 21
Ports B5 actually consists of three separate regions spread over a wide area. In fact it is quite complex in its structure and it is rather difficult to guard the port facilities with its increasing traffic volumes. Access control is relatively difficult to put in place as the total port area is extending over large areas. A video surveillance system was in place with in total 64 video cameras. Although there were some fenced restricted areas where excise goods are being stored in some regions of the port, these could not be considered as restricted areas in terms of the ISPS Code. The Maritime Administration and the port operator agreed that dangerous cargoes will be not stored in the port area. All costs related to the implementation of the Port Security Plan have been paid for by the port operator. The costs can be divided in investments in security measures and running costs, especially for contracting the private company for access control and monitoring.
Table 3-10. Realized investments (in US$)
Access control system 18,750 Fiber optic cable 37,500 Total 56,250
Table 3-11. Actual running costs of the security system per year (in US$)
Security staff 225,000 Total 225,000
These costs have not been recovered from an increase in port tariffs or port handling. 3.6 Total security costs and costs per unit Port B1 From the above analysis, it is clear that in Port B1 as well as in Port B2 the additional investments and annual running costs of the additional security measures, only as an effect of the implementation of the ISPS Code, in fact were relatively limited. The Free Zone status of the port or areas in the port resulted in many facilities and procedures being already in place. Most of the parties involved in the project even argued that without ISPS the situation would not have been very much different. A special issue in Port B1 was the large number of passengers, resulting in the fact that a large part of the investments in and costs of security measures was actually related to the passenger traffic. A simple calculation of the additional security costs per ton of cargo handled therefore is difficult to produce. For both the B1 Port Authority and the private operators the largest portion of security costs is taken up by the hiring of private security companies. These security companies were already involved before the ISPS Code implementation date, for instance in the passenger terminal, in the Free Zone and at the terminals, but because of ISPS requirements their services and activities were intensified. The investments made by Port B1 for the preparation and implementation of the measures related to the ISPS Code are estimated at less than 1 percent of its annual turnover. Calculated on a yearly base and adding the annual running costs (like the yearly assessment, training, etc.) the running costs are just a fraction of the total operational costs of the port. The figure, however, would be different if the costs of the security guards were also taken into account. The total cost of hiring private security companies for the various port areas was estimated to be in the order of 4 percent of the operational costs of the port, but it should be realized that 70 percent of this amount is linked to the passenger traffic and only 30 percent to the cargo facilities. A very rough estimate of the costs per ton if the investments, running costs and the total costs for security guards are included is in the order of US$0.01 per ton of cargo handled. These are the costs related to the activities of the Port Authority only.

22 REVIEW OF COST OF COMPLIANCE WITH NEW INTERNATIONAL FREIGHT TRANSPORT SECURITY REQUIREMENTS
For the private operators in the port the situation was somewhat similar. The total investments needed to become ISPS compliant were less than US$62,000. Calculated on a yearly basis, and adding the annual running costs, training and assessment, the total is less than US$19,000 annually, or some US$0.17 per TEU. Again, the figure will be completely different if the costs of the security guards for access control and monitoring were taken into account. If these costs for these services are included the security costs per TEU will raise to a figure between US$3.75 and US$4.4 per TEU, or US$4.20 on average. Port B2 Similar to the situation in Port B1, also the parties in Port B2 considered the topic of port security as being highly sensitive and confidential and had restrictions in supplying information. This was the case for the governmental bodies, the Freeport Authority and the private parties. Especially where it concerned data on investments and costs, there was reluctance to provide proper information, as the data was considered to be commercially sensitive and for that reason confidential. After proper introductions all parties were, however, supportive in providing insight in the type of security measures and the security organisation. Again similar to the procedure in Port B1, by combining the information received from the operators, the Freeport Authority and information provided by third parties, it was possible to obtain insight in the measures taken connected to the preparation and implementation of the ISPS Code at different levels, the costs involved, the transfer of such costs to the users, and the effect on transport costs. The B2 Port Authority followed a similar approach as the government (security is part of the ‘normal’ duties), but in their case, part of the investments could directly be linked to ISPS. It was estimated that the investments at Port Authority level were in the range of US$0.005 per ton of cargo handled. On an annual basis, the additional security running costs on the Port Authority level, taking into account this investment and other yearly costs, the figure was US$0.002 per ton. Information provided showed that in total US$120,000 was spent on the necessary upgrading of the security system. The amount was spent on the development of lighting systems and repair and renewal of part of the fence system. The Authority employed one additional staff member as Port Security Officer (PSO). The investments and costs did not lead to increases in dues or tariffs to the operators and users of the port. Also on the operator level the figures were not very impressive, but it has to be realized that differences occurred between the different operators in the port. The operators included in the study are different in size, but costs for a PFSP were similar. The result was a significant difference in the costs per ton of cargo. For a large multipurpose terminal, handling liquid bulk and general cargo, the investment per ton was about US$0.03 per ton. Running costs of the additional security measures were estimated to be US$0.04 per ton. For a small terminal, handling bulk products and general cargo, the investment per ton of cargo were considerably higher, US$0.38 per ton. Annual running costs in this case were US$0.54 per ton. The small operators had a different background and in many cases were newly established enterprises. For them the starting position was completely different and therefore the introduction of the ISPS Code did have a substantial influence in several cases. For the container terminal the security level was already extremely high. Additional investments were in fact very limited and the change in security activities and procedures was marginal. As a result, the effect of the introduction of the ISPS Code on cost levels was marginal as well. Investments per TEU handled were estimated at only US$0.30, whereas annual running costs were estimated to be US$0.10 per TEU.

Europe and Central Asia Region 23
Table 3-12. Costs per TEU and ton of cargo in Port B2 (in US$)
B1 B2 Cargo throughput (million tons) 37.2 24.0 Containers handled in 2004 (TEU) 113,000 152,000 Cost per ton of cargo (US$) 0.17 0.07 to 0.92 Cost per TEU (estimated average in US$) 4.2 0.40
Port B3 An introductory remark: In Ports B3, B4 and B5 the information on costs and investments could not be retrieved at the required level of detail. A number of reasons, partly given by the respondents, and partly through interpretation by the consultants were as follows: • All parties considered the topic of port security to be highly sensitive and confidential and had
restrictions in supplying information • Cost figures and financial data were considered to be commercially sensitive • Many investments made and costs incurred were considered to be part of the ‘normal’ activities of
the organization and for that reason were not separately registered • A number of measures would have been taken anyway and respondents indicated that they should
not be attributed to ISPS. Examples were improved access control and container and cargo scan facilities
• The investments were not significant. This could either mean that a high security level was already in place (notably in ECA03) or that the investments were not significant (notably in ECA04).
• Surcharges applied were way above what could be justified as a result of actual costs and detailed insight in the actual costs could lead to protests or claims of port users.
Despite these obstructions substantial data could be retrieved and analysed which provided an insight in the type of measures taken, the investments and costs involved and the effect on the transport costs. In Port B3 the investment costs directly connected with the implementation of the tasks of the Port Administration to maintain and control the ISPS Code provisions in the port and the perimeters of the facilities before July 1, 2004 amounted to a total of approximately US$2.1 million, or about US$0.04 per ton of cargo handled. The figure of US$2.1 million consists of an equipment component (US$1.6 million) and the costs of hiring extra staff and equipment before July 2004 (US$0.5 million). The running costs were mainly related to the costs of hiring private security companies to handle the control function. The yearly costs were in the order of US$0.7 million. Per ton of cargo handled the running costs are approximately US$0.01. The investments were made from the resources of the Port Administration. The investment and running costs were not yet transferred to the current port dues or operation fees, but if future security upgrades were to be implemented this might result in an increase of the lease with US$0.05 per square meter. This additional charge would also cover the investments and running costs of an extension of the CCTV system for the entire outer perimeter. The Port Administration was questioning the necessity of this expansion, since, from an ISPS Code point of view, it is not obligatory. There was great resistance in the port community about this surcharge, which was a reason for the Port Administration to postpone its introduction for the time being. If this surcharge would be levied for every square meter in the port area, it would lead to a total charge of close to US$2 million for the whole port community. The other government agencies such as Customs, the Harbor Master and the border police, all made additional costs and investments. All of them indicated that they consider the activities as part of their normal duties and operations, and consequently there was no way to make an analysis of specific ISPS Code related activities. It included training programs for staff, scanning equipment, increased patrols etc. For the private operators in the port the situation varied considerably. Investments for the private operators were items such as upgrading of the fencing, improvement of lighting and access gates,

24 REVIEW OF COST OF COMPLIANCE WITH NEW INTERNATIONAL FREIGHT TRANSPORT SECURITY REQUIREMENTS
installation of CCTV at the gate, and preparation of the assessment and the security facility plans. Running costs were mainly related to the hiring of the private security companies and the regular audits. The investments made at the terminals varied between US$100,000 for a small facility and US$1.5 million for the largest facility in the port. Per ton of cargo handled the investments vary between US$0.09 and US$0.62. For the container terminal the figure is in the order of US$3.1 per TEU. Running costs were mainly related to the hiring of the private security companies and some costs for running the equipment. For a small facility with one access gate, the costs for access control and patrolling the perimeter were at least US$125,000 per year. For a large facility with more than one gate, the total costs could reach a level of US$435,000. Although these costs were substantial, the costs per ton of cargo handled varied from about US$0.01 to US$0.19. For container terminals the running costs per TEU were not higher than US$1.9. Considering the fact that a container surcharge of US$6.0 to US$7.5 was common practice, it was obvious that in this particular case, the additional costs were more than compensated by the clients of the terminals. Port B4 All costs related to the implementation of the Port Security Plan are paid by the port operators. The costs can be divided in investment costs and running costs (especially for contracting the guards for access control and monitoring), and planned investments.
Table 3-13. Realized investments, annual running costs and planned investments in Port B4 (in US$)
Realized investments 31,250 Annual running costs 225,000 Planned investments 125,000
These costs had not been recovered from an increase in port tariffs or port handling costs. Investment cost can be calculated at only US$0.01 and running costs at less than about US$0.02 per ton of cargo handled. It is obvious that in the near future considerable investments would have to be made so as to bring the security situation in Port B4 up to standard. These investments will have to comprise a separation of the port into a number of individual facilities, carrying out the assessments, production of the facility security plans and the implementation. Only an estimate of the investments required for the necessary first step could be provided. It had to be concluded that the first step had not been carried out properly and that, as a consequence, a proper analysis of the measures required and the cost involved bringing the security situation up to standards was not carried out by the Port Authority. The first step should be to set up a program to produce risk assessments and port security plans and training courses to make the port fully ISPS compliant. Although the costs related to this important first step are limited (estimated at US$62,000), the costs related to implement the required security measures were extensive and would have to be paid by the authorities and operators themselves. On the basis of this analysis alone, a reliable estimate of the investments required could not be provided, but it was clear that the costs for Port B4 will be extensive, probably more than US$1.25 million. Port B5 Similar to Port B4, all costs related to the implementation of the Port Security Plan have been paid by the port operator. The costs can be divided in investments in security measures and running costs, especially for contracting the private company for access control and monitoring.
Table 3-14. Realized investments and running costs (in US$)
Realized investments 65,250 Actual running costs 225,000

Europe and Central Asia Region 25
These costs have not been recovered from an increase in port tariffs or port handling. The investments per ton of cargo handled can be calculated at about US$0.01 for the entire port, and the running cost per ton of cargo handled at about US$0.03. Also in Port B5 it was obvious that in the near future a considerable sum of money would have to be spent to bring the security situation in Port B5 up to standards, and taking into account the wide area and the complex structure of the port, this will be a huge task. The status of the security level and the investments required in Port B5 were identical to those described for Port B4. Also in Port B5 it had to be concluded that the first step was not carried out properly and that, as a consequence, the port authority did not carry out a proper analysis of the measures required and the cost involved to bring the security situation up to standards. As in Port B4, the first step should be to set up a program to produce risk assessments, port security plans and training courses so as to make the port fully compliant. Costs to carry out this necessary first step were estimated to be in the order of US$62,500. Based on this first step, a list of measures and investments required could be produced. The costs related to the implementation of the security measures required will be extensive and will have to be covered by the authorities and operators themselves. Cost overview of Ports B3, B4 and B5 The conclusion of the analysis of the Ports B3, B4 and B5 was that there were substantial differences in investments and running costs of security measures, in particular between Port B3 on the one hand and Ports B4 and B5 on the other. This was related to the fact that the way the topic has been approached in the two countries is fundamentally different: Port B3 has achieved a satisfactory result and Ports B4 and B5 have followed a minimum approach and should at this stage be considered as not meeting the requirements. The following summarizing tables contain a comparison of the investments costs of the three ports, with a subdivision in categories where possible, and the running costs at an annual basis.
Table 3-15. Overview of investment costs in Ports B3, B4 and B5 (in US$)
Investment Category B3 B4 B5 Office, office and staff equipment 103,275 - - Security equipment 1,639,000 156,250 56,250 Fencing 55,530 - - Extra Staff Port Authority 345,730 - - Training 25,230 - - Assessment, plan, certificate 12,500 - - Total 2,181,265 156,250 56,250
Table 3-16. Overview of annual running costs of security measures in Ports B3, B4 and B5 (in US$)
Running Cost Category B3 B4 B5 Wages of extra Port Authority staff 276,585 - - Equipment cost 266,790 - - Office cost 33,750 - - Extra communication cost 7,800 - - External security staff 345,730 225,000 225,000 Total 930,655 225,000 225,000

26 REVIEW OF COST OF COMPLIANCE WITH NEW INTERNATIONAL FREIGHT TRANSPORT SECURITY REQUIREMENTS
Table 3-17. Costs per TEU and ton of cargo (in US$)
B3 B4 B5
Cargo throughput (million tons)
50.4 12.9 7.4
Containers handled in 2004 (TEU)
386,300 26,600 78,6000
Investment and running costs US$2,883,465
US$381,250 US$312,500
Cost per ton of cargo US$0.06*
US$0.03 US$0.04
Cost per TEU US$7.46*
US$14.33 US$3.98
Cost per ton of cargo US$0.09 to US$0.63** Not applicable Not applicable
Cost per TEU US$3.10**
Not applicable Not applicable
Total Cost per ton of cargo US$0.42
Not applicable Not applicable
Total Cost per TEU US$10.56
Not applicable Not applicable
* Port Administration Costs ** Terminal Costs

27
4 LATIN AMERICA AND THE CARIBBEAN REGION 4.1 Introduction The survey included four ports in Latin America:
• Country LAC01 and Port L1 • Country LAC02 and Port L2 • Country LAC03 and Port L3, and • Country LAC04 and Port L4.
All four ports are fully compliant with the requirements of the ISPS Code and the investments in security had in majority been made before the Code became mandatory. 4.2 Port characteristics Port L1 Port L1 is located on the western coast of South America. Its hinterland is close to the central zone of the country, where more than 50 percent of the economic activity of the country is carried out. Formerly Port L1 was operated and managed by the national port state enterprise, but in the 1980’s a process was initiated to incorporate the private sector in cargo handling operations. Today the management of Port L1 is executed by an autonomous (but state owned) enterprise with the objective to increase the efficiency and investments through the granting of concessions to private operators. Port L1 only handles containerized general cargo (dry and refrigerated), break bulk cargo and passengers. The total port area is some 36 hectares.
Port L2 Port L2 is located on the east coast of South America. Actually the port comprises four different port areas. The study concentrated on only one of the container terminals in one of the port areas. The terminal is operated by a private operator under a concession contract. This port area was built in the 1930’s. In 1980, within the framework of a national reform process, the government put a law into force that determined that all terminals in the port area would be given in concession to private enterprises for long term periods. In 2006, Port L2 handled more than 11 million tons of which about 50 percent were imports (mainly manufactured goods and fuel) and 50 percent exports (manufactured goods, meat and fruit). The containerization of general cargo in 2006 was 95.5 percent. Port L3 Port of L3 is in the northern part of South America. The port is located in a natural bay in which port facilities were on the coastline and on various islands. At the end of the 1940’s the Ministry for Public Works took over the management from the builders of the port facilities, and in the 1960-s the national port administration took over this task. Although port reform was discussed at length, it took until the beginning of the 1990’s before, by law, the basis was set for the actual reform and the creation of port operating companies. This law defines the ‘port company’ in each of the national ports, as a limited company, either public or mixed, constituted with private capital, whose objective is the management and investment in construction and port maintenance, also being able to provide other services directly related to port activities. Private terminals form part of the port and these are exclusively leased to a user for loading and unloading operations of ships. Today Port L3 consists of different port companies and private terminals spread along the coastline and on various islands. The study concentrated on the major port facility that mainly handles containers. The company has a 40 years concession signed with the government. Other private terminals handle oil and products as well as cement, chemical products and other general cargoes. Port L4 Port L4 is located on the west coast of Central America. The main advantages of the port are its depth (16m in its main basin) and its large land area. The hinterland of the port includes the national area where 42 percent of the national GNP is created and 49 percent of its manufacturing industries are

28 REVIEW OF COST OF COMPLIANCE WITH NEW INTERNATIONAL FREIGHT TRANSPORT SECURITY REQUIREMENTS
located. Port L4 is a relatively new port and its development is closely related to mining and industry. Only in the 1970’s, under an industrial port strengthening program, the fertilizer, the container and the multipurpose terminals were inaugurated. In the 1980’s the grain and oil terminals were built and between in the 1990’s quay cranes were installed at container terminal. The container terminal is operated by a private operator under a long term concession contract. In terms of national port management, a new port law came into force by which the former state ports were transformed into corporate (state owned) local port administrations. In conformity with the main purpose of the port, the main export in 2006 consisted of steel products, whereas main import products in 2006 were coal and steel pellets. The throughput details of the four ports are as follows.
Table 4-1. Throughput of Ports L1, L2, L3 and L4
L1 L2 L3 L4 Container throughput 2006 (TEU) 618,889 592,500 711,529 160,696 General/other cargo throughput 2006 (tons)
1,753,676 391,454 108,439 17,832,915
Number of passengers 2006 65,165 116,840 42,024 - 4.3 Status of ISPS in the ports considered Port L1 There are 62 adequately ISPS certified port installations in LAC01, or 100 percent of the ports involved in the country’s foreign trade. The implementation of the ISPS Code in LAC01 ports did not have much financial and organizational impact, given the fact that many of the measures required had already been implemented during the 1980s, at the request of the Maritime Authority and also of the companies. The LAC01 ports do not have an authorized security tariff. Furthermore, there has not been an increase in tariffs for port services, as these were set with a maximum limit for the concession contracts signed at the beginning of 2000 and controlled by the Maritime Authority. Also the services and activities carried out by governmental bodies (i.e. the Maritime Authority or the Coast Guard) are all, at least on the date of the mission, offered free of charge to the users, including the equipment, training and all running costs. Security measures implementation costs are met by the resources of the concessionaires, the port enterprises and the Maritime Authority and within their own scope of competence. With regard to port security, the government policy has two aspects. The first one is not to add costs to foreign trade, thus maintaining competitiveness and low costs. The second aspect is that the government will take full responsibility in matters pertaining to citizen security and in the fulfillment of its international responsibilities. Due to these two principles, to date, there are no public sector tariffs with regard to port facility security issues. Port L2 There are 35 ports in LAC02 with 114 port facilities from which 95 are adequately certified port installations, i.e. 100 percent of the ports involved in the country’s foreign trade. The remainder, 19 port facilities, is not engaged in international trade. Also in LAC02 the implementation of the Code did not have a considerable financial or organizational impact, given the fact that many of the measures required were already implemented during the 1980s and 1990s at the request of the Maritime Authority. Additionally, most of the major port facilities of the country have been concessioned to private companies and many of these private concessionaires are global port operators with international expertise in port security issues.

Latin America and the Caribbean Region 29
Port L3 There are 12 ports in LAC03 with 49 port facilities which are all adequately certified port installations, corresponding to 100 percent of ports engaged in international trade. Implementation of the Code in LAC03 ports did not have a major financial or organizational impact, given the fact that many of the measures required had already been implemented (in fact 71 percent of the actual total security investment) during 1998-2003 at the request of the shipping and port market. In addition, most of the major port facilities of the country have been concessioned and the private concessionaires were internationally obliged to establish strict security measures to deal with the country’s situation regarding the existence of guerrilla and drug trafficking. At the time of the mission, the terminals situated in the Port L3 region were enjoying a sort of freedom of tariff regime. However, a specific security fee was not charged. In each case security measure implementation costs were met by the concessionaires,’ the port enterprises’ and the Maritime Authority’s own resources and within their own scope of competence. Also the services and activities carried out by public institutions or services, like the Maritime Authority or the Coast Guard, including training, equipment and running costs, are all, at least at the time of the mission, offered to the users free of charge. The costs of these services and activities are covered by the resources given to Maritime Authority, the Coast Guard and the Police within their normal annual budget. This budget was not increased by the government, even though new responsibilities were handed over to the Maritime Authority for the implementation of the ISPS Code. Costs of the Anti Narcotics Unit of the Police within the L3 facilities are partially covered by funds of the Security Budget and the Port Security Program. The Maritime Authority, unlike other countries in the region, does not have its own personnel for the effective execution of its security functions; it only acts as a regulatory entity. To perform all security or response actions included in the Contingency Plan, Port L3 is supported by Navy personnel of the Marines or by Coast Guard Units, depending on the type of emergency. In this ways the current government policy takes most of the responsibility in matters pertaining to citizen security and fulfillment of international responsibilities. Therefore, also in LAC03 there are no official public sector tariffs with regard to port facility security issues. Port L4 In LAC04 there are 26 Port Authorities, 32 ports and 176 port facilities, all adequately certified. In contrast to the other three countries/ports reviewed, the implementation of the ISPS Code in the LAC04 ports did have a large financial and organizational impact, leading to a considerable improvement of port security. Although the ISPS Code implementation process was carried out by the Maritime Authority, the majority of the investments were made by the individual ports and by the private sector. Furthermore, the presence of international port companies and global operators in the port sector contributed to increased security awareness and the implementation of adequate security procedures. At the time of the mission the terminals located in Port L4 were under the administration of the Port Authority but also enjoyed a sort of freedom of tariff regime for a selected number of components, which for instance included charging a specific security fee of US$9.70 per container for the container terminal concessionaire. Implementation costs of security measures were in each case met by the Port Authority, the concessionaires, the port enterprises and the Maritime Authority and within their own scope of competence. The Port Authority carries out its local authority functions such as controlling and supervising the execution of security measures related to the ISPS Code for container and cargo terminals. Considering the fact that there only was a security tariff for containers, it could be stated that there was a partial Port Authority subsidy for security costs in common areas for non-containerized cargoes. It is important to note that although each concessionaire has an approved Port Facility Security Plan with security measures duly implemented, they were not allowed to charge a security fee, except, as mentioned above, for the container terminal concessionaire who is allowed to charge the security fee of US$9.70 per container. The services and activities carried out by public institutions or services, as those provided by the Merchant Marine Directorate and delegated organizations like the Merchant Marine Education and Training Trust Fund, were charged with specific public tariffs. Maritime patrol, establishment of
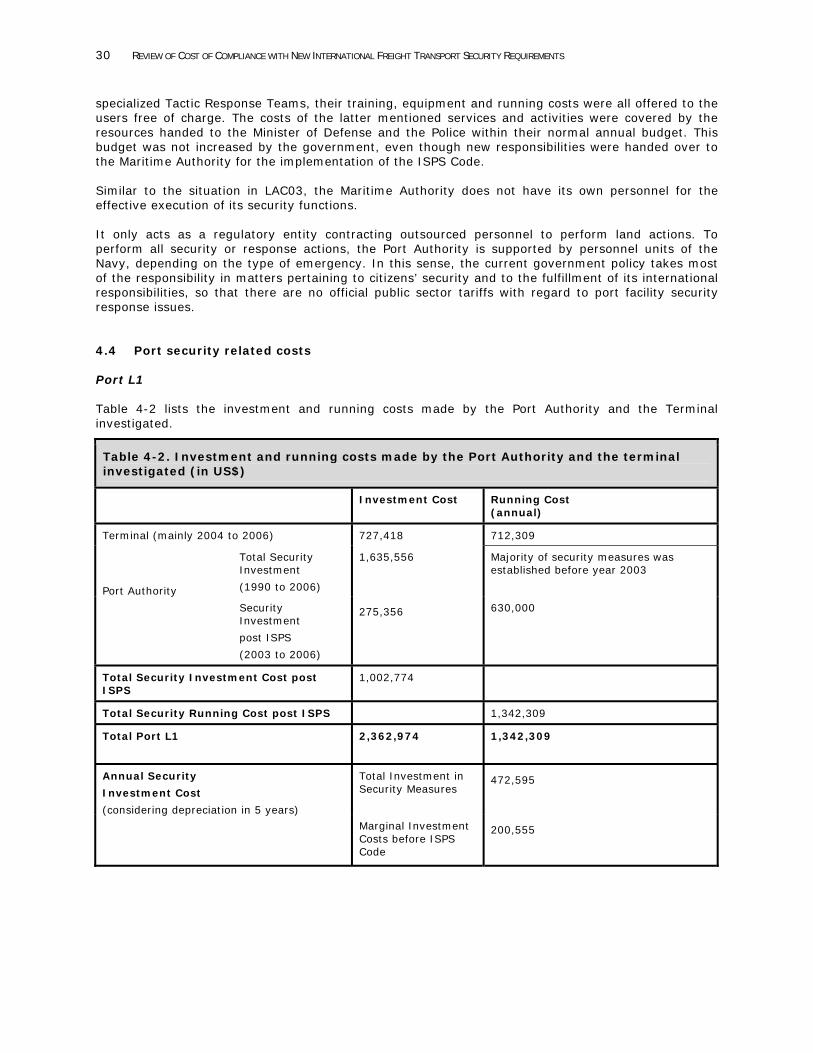
30 REVIEW OF COST OF COMPLIANCE WITH NEW INTERNATIONAL FREIGHT TRANSPORT SECURITY REQUIREMENTS
specialized Tactic Response Teams, their training, equipment and running costs were all offered to the users free of charge. The costs of the latter mentioned services and activities were covered by the resources handed to the Minister of Defense and the Police within their normal annual budget. This budget was not increased by the government, even though new responsibilities were handed over to the Maritime Authority for the implementation of the ISPS Code. Similar to the situation in LAC03, the Maritime Authority does not have its own personnel for the effective execution of its security functions. It only acts as a regulatory entity contracting outsourced personnel to perform land actions. To perform all security or response actions, the Port Authority is supported by personnel units of the Navy, depending on the type of emergency. In this sense, the current government policy takes most of the responsibility in matters pertaining to citizens’ security and to the fulfillment of its international responsibilities, so that there are no official public sector tariffs with regard to port facility security response issues. 4.4 Port security related costs Port L1 Table 4-2 lists the investment and running costs made by the Port Authority and the Terminal investigated.
Table 4-2. Investment and running costs made by the Port Authority and the terminal investigated (in US$)
Investment Cost Running Cost (annual)
Terminal (mainly 2004 to 2006) 727,418 712,309
Total Security Investment
(1990 to 2006)
1,635,556
Majority of security measures was established before year 2003
Port Authority
Security Investment
post ISPS
(2003 to 2006)
275,356
630,000
Total Security Investment Cost post ISPS
1,002,774
Total Security Running Cost post ISPS 1,342,309
Total Port L1 2,362,974
1,342,309
Total Investment in Security Measures
472,595 Annual Security
Investment Cost
(considering depreciation in 5 years) Marginal Investment Costs before ISPS Code
200,555

Latin America and the Caribbean Region 31
Port L2
The specification of investment costs of the Terminal investigated in Port L2 is as follows.
Table 4-3. Investment costs of the terminal investigated in Port L2 (in US$)
Year Investment Total Amount
2002 Entrance ID System (Personnel and visitors) 75,000
2002 CCTV Network 95,000
2002 Fences 505,296
2004 Port Facility Security Plan Design 5,000
2004-2007 Vehicles for Security 70,000
2004 Terminal Lighting Superstructure 600,000
2005-2007 Scanners and others (Passenger Terminal) 500,000
2007 PFSP Updating 10,000
2007-2008 Intelligent CCTV Surveillance System 350,000
Total 3,251,796
The total investment and running cost of the ISPS Code implementation at the terminal are as follows.
Table 4-4. Total investment and running cost of the ISPS Code implementation at the terminal (in US$)
Investment Costs Running Costs (annual)
Total Security Investment Costs Related to ISPS
(2002-2007)
3,251,796
Total Security Running Costs Post ISPS
1,816,960
Total Terminal 3,251,796 1,816,960
Total Investment in Security Measures
650,359 Annual Security Investment Costs
(considering depreciation in 5 years because of technological obsolescence)
Marginal Investment Costs before ISPS Code
445,300

32 REVIEW OF COST OF COMPLIANCE WITH NEW INTERNATIONAL FREIGHT TRANSPORT SECURITY REQUIREMENTS
Port L3 The list of investments related to the ISPS Code implementation in Port L3 is as follows.
Table 4-4. Investments related to the ISPS Code implementation in Port L3 (in US$)
Year Investment Total Amount
1998 Fences 386,100
2000 Entrance ID System (Personnel and visitors) and CCTV Network
710,000
2000 Lighting Superstructure 915,000
2002 Radio-communication System 300,000
2002 Vehicles for Security 187,000
2002 Explosive Detector 35,000
2002-2007 Watch Dogs 27,000
2004 Patrol Boat 60,000
2004 Radiation Detector 10,500
2005 Various handsets (metal, illicit substances, etc) 36,000
2005 Sub-Aquatic Camera 12,000
2007 Anti-craft Barriers 120,000
2007 Strategic Management Planning Software 400,000
2007 Security Building 250,000
2007 Increase Fences Height 130,650
Total 3,579,250
In Port L3, the investment and annual running costs have been calculated to be the following.
Table 4-5. Investment and annual running costs in Port L3 (in US$)
Investment Costs Running Costs (annual)
Total Security Investment Costs Related to ISPS
(1998-2007) 3,579,250
Total Security Running Costs
(Post ISPS)
2,598,151
Total Security Costs 3,579,250 2,598,151
Total Investment in Security Measures 715,850
Annual Security Investment Costs
(considering depreciation in 5 years because of technological obsolescence)
Actual Investment Costs after ISPS Code 77,430
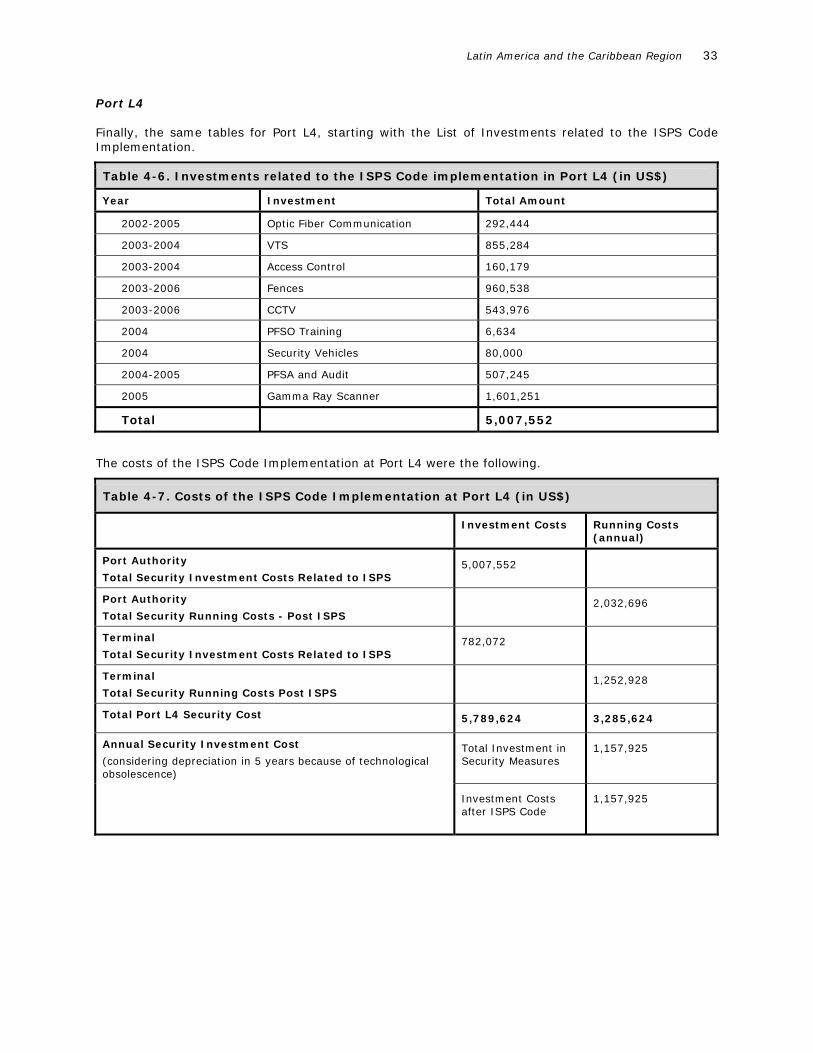
Latin America and the Caribbean Region 33
Port L4 Finally, the same tables for Port L4, starting with the List of Investments related to the ISPS Code Implementation.
Table 4-6. Investments related to the ISPS Code implementation in Port L4 (in US$)
Year Investment Total Amount
2002-2005 Optic Fiber Communication 292,444
2003-2004 VTS 855,284
2003-2004 Access Control 160,179
2003-2006 Fences 960,538
2003-2006 CCTV 543,976
2004 PFSO Training 6,634
2004 Security Vehicles 80,000
2004-2005 PFSA and Audit 507,245
2005 Gamma Ray Scanner 1,601,251
Total 5,007,552
The costs of the ISPS Code Implementation at Port L4 were the following.
Table 4-7. Costs of the ISPS Code Implementation at Port L4 (in US$)
Investment Costs Running Costs (annual)
Port Authority
Total Security Investment Costs Related to ISPS 5,007,552
Port Authority
Total Security Running Costs - Post ISPS
2,032,696
Terminal
Total Security Investment Costs Related to ISPS 782,072
Terminal
Total Security Running Costs Post ISPS
1,252,928
Total Port L4 Security Cost 5,789,624 3,285,624
Total Investment in Security Measures
1,157,925 Annual Security Investment Cost
(considering depreciation in 5 years because of technological obsolescence)
Investment Costs after ISPS Code
1,157,925

34 REVIEW OF COST OF COMPLIANCE WITH NEW INTERNATIONAL FREIGHT TRANSPORT SECURITY REQUIREMENTS
4.5 Total security costs and costs per unit Port L1 As can be concluded from the analysis of the investment and running costs related to security in Port L1, the majority of the aspects considered have been those necessary to meet the normal security requirements for the port area and the terminals. Until 2006, the investment costs in Port L1 reached an amount of US$2,537,174 and the running costs for the year 2006 amounted to US$1,352,749. The conclusion of the analysis is that the real security costs for containerized cargo, general cargo and passengers in Port L1 correspond to US$3.46 per container (or US$2.31 per TEU), to US$0.23 per ton, and to US$0.69 per passenger for the year 2006. In accordance with the policies of the government, the actual investments required for the implementation of the Code have led to low costs, so that the port, the terminals and the port operators have been able to carry these out with their own resources without a cost increase for their users. Nonetheless, the main concessionaires and operators have been in touch with the authorities in order to consider the future application of a tariff for port security, which would cover the costs of future aspects and security measures necessary to comply with the new Code requirements and those of other initiatives as all these would modify the “technical-financial equation” used when the concessions were given and the maximum port tariffs were set. Port L2 As mentioned previously the terminals situated in Port L2 enjoy the freedom of tariff regime. Therefore, in agreement with the Port Administration, the L2 terminals established a security tariff of US$8.00 per box for containerized cargo, of US$0.50 per ton for general cargo, and of US$2.00 per passenger. On the other side, the services and activities carried out by governmental bodies, such as those provided by the Maritime Authority, are all, at least at the time of the mission, offered to the users free of charge. The costs of these services and activities are covered from the resources provided to the Maritime Authority in their normal annual budget. The government did not increase this budget, even though new responsibilities were handed over to the Maritime Authority for the implementation of the ISPS Code. The government policy takes over most of the responsibility in matters pertaining to citizen security and the fulfillment of its international responsibilities. Although due to this principle there are no official public sector tariffs for port facility security to date, nevertheless, US$1.00 of the security tariff per box established by the terminals is passed on to the L2 Port Authority, even though the Port Authority does not perform any security activity nor does it have any responsibility inside the container and cargo terminals. The analysis of the investment and running costs with regard to port security in the specific terminal investigated in Port L2 shows that the majority of the aspects considered have been those necessary to meet the normal security requirements for a port area and terminal. Until 2007, the investment costs of the terminal reached an amount of US$3,251,796, but it should be noted that most of the investments were already made when the ISPS Code was not yet in force. The running costs for the year 2006 amounted to US$1,816,960. The conclusion is that the real security costs for containerized cargo and general cargo at this terminal amount to US$5.46 per box (or US$3.68 per TEU) and US$0.48 per ton, respectively. Passenger security costs amount to US$0.86 per passenger. The investment costs required for the implementation of the ISPS Code are covered by the terminal partly from its own resources and partly using the income from the security fees paid by its users. It is planned to introduce further security measures of other initiatives, the costs of which are currently not planned to be charged to the users. Port L3 The survey revealed that investment costs for security at L3 for the largest operator amounted to a total of US$3,579,250 from 1998 to 2007. The running costs were calculated at US$2,598,151 for the year 2006. Port L3 did not make separate investments in the passenger terminal and all costs are included in the overall investment and running costs, respectively.

Latin America and the Caribbean Region 35
The real security cost for containerized and general cargo handled by the largest operator in Port L3 amount to US$6.86 per box (or US$4.59 per TEU) and US$0.46 per ton, respectively. Security costs for passengers cannot be differentiated from the cargo costs. The operator covers the costs of investments required for the implementation of the ISPS Code from its own resources and from the funds collected for the normal port and cargo fees and tariffs paid by the users. The operator will also introduce further security measures of other initiatives, the costs of which will also be carried by the operator itself, i.e. it is not planned to introduce a special security charge. Port L4 As could be concluded from the analysis of the investment and running costs with regard to port security of the facilities in Port L4, the majority of the aspects considered were those necessary to meet the normal security requirements for a port area and terminal. Until 2006, the investment costs reached the amount of US$5,789,624. Almost all of these investments were made after the ISPS Code was in force. The annual running costs in 2006 were US$3,285,624. The survey showed that the real security costs for containerized cargo and other cargo in Port L4 amount to US$17.83 per box (or US$9.91 per TEU) and US$0.16 per ton, respectively. The costs of investments required for the implementation of the ISPS Code have been covered by the Port Authority and the concessionaires from their own resources. Both parties will introduce further security measures of other initiatives, the costs of which will also be carried by them, i.e. it is not planned to introduce/increase a special security charge. Cost overview of Ports L1, L2, L3 and L4
Table 4-8. Cost overview of Ports L1, L2, L3 and L4 (in US$)
L1 L2 L3 L4 Total Investment Costs – Container/Other Cargo
2,362,974 2,751,796 3,579,250 5,789,624
- of which after ISPS Code Implementation in 2004
1,002,774 2,076,500 387,150 5,789,624
Total Investment Costs – Passengers 174,200 500,000 0 - - of which after ISPS Code Implementation in 2004
174,200 500,000 0 -
Annual Total Investment Costs – Container/Other Cargo
472,595 550,359 715,850 1,157,925
- of which after ISPS Code Implementation in 2004
200,555 415,300 77,430 1,157925
Annual Total Investment Costs - Passengers 34,840 100,000 0 - - of which after ISPS Code Implementation in 2004
34,840 100,000 0 -
Annual Total Running Costs 1,352,749 1,816,960 2,598,151 3,285,624
Table 4-8 is next translated into the annual total and actual investment and running costs.
Table 4-9. Annual total and actual investment and running costs per category of Ports L1, L2, L3 and L4 (in US$)
L1 L2 L3 L4 Container – Annual Total Investment Costs 368,624 506,330 705,112 217,506 Container – Annual Actual Investment Costs 156,433 382,076 76,269 217,506 Container – Annual Total Running Costs 1,047.001 1,671603 2,559,179 1,375,093 Other Cargo – Annual Total Investment Costs 103,971 44,029 10,738 940,418 Other Cargo – Annual Actual Investment Costs
44,122 33,224 1,161 940,418
Other Cargo – Annual Total Running Costs 295,308 145,357 38,972 1,908,701 Passengers – Annual Total Investment Costs 34,840 100,000 0 - Passengers – Annual Actual Investment Costs 34,840 100,000 0 - Passengers – Annual Total Running Costs 10,440 0 0 -

36 REVIEW OF COST OF COMPLIANCE WITH NEW INTERNATIONAL FREIGHT TRANSPORT SECURITY REQUIREMENTS
Finally, the tables above lead to the actual security costs per category.
Table 4-10. Actual security costs per category of Ports L1, L2, L3 and L4 (in US$)
L1 L2 L3 L4 Actual Security Costs per TEU 2.31 3.68 4.59 9.91 Actual Security Costs Other cargo per ton 0.23 0.48 0.46 0.16 Actual Security Costs per Passenger 0.69 0.86 - -

37
5 OVERALL RESULTS AND CONCLUSIONS Table 5-1 combines results for all ports in the report. In case ranges of costs were provided, these have been averaged for the sake of comparison. Costs and tariffs are expressed in US$.
Table 5-1. Overall results (in US$)
TEU Ton of Cargo Passenger Region Country / Port Costs Tariff Costs Tariff Costs Tariff
Africa AFR01/A1 1.06 - 0.04 - - - AFR02/A2 1.82 - 0.05 - - - AFR03/A3 2.59 3.00 0.04 - - - Europe and Central Asia ECA01/B1 4.20 - 0.17 - - - ECA02/B2 0.40 - 0.50 - - - ECA03/B3 10.56 6.75 0.42 - - - ECA04/B4 14.33 - 0.03 - - - ECA04/B5 3.98 - 0.04 - - - Latin America and the Caribbean LAC01/L1 2.31 - 0.23 - 0.69 - LAC02/L2 3.68 8.00 0.48 0.5 0.86 2.00 LAC03/L3 4.59 - 0.46 - - - LAC04/L4 9.91 9.70 0.16 - - - Minimum 0.40 - 0.03 - - - Maximum 14.33 - 0.50 - - - Average 4.95 0.22
The major conclusions are the following: • The range is quite wide; varying from US$0.40 to US$14.33 per TEU, and from US$0.03 to
US$0.50 per ton of cargo. The graphs below illustrate the ranges very clearly. • On the other hand, the averages, US$4.95 and US$0.22 respectively, confirm largely what was
expected: that the ISPS costs to the cargo would be very low, and certainly not as high as some predictions that were published before the introduction of the ISPS Code in 2004. If, in addition, the obvious advantages of the ISPS Code are drawn into this equation (see below) the picture becomes even more positive.
• Although each port and terminal that has been studied and / or inspected in the project is officially
ISPS certified, they obviously have not necessarily reached the same level of security, both due to differences in their baseline and in the effectiveness in implementing the required measures.
• In addition, several of the ports and terminals involved in this study, for various reasons such as
being a naval base or a Freeport, or as a consequence of measures to increase general security before 2004 due to national problems (such as drug trafficking) already had a high level of awareness and compliance before the implementation of the ISPS code. Although it was not the focus of this study, the assessment of the effectiveness of the security measures still found shortcomings in the port security effectiveness in almost every port
• The variations in the final results are clearly dependent on the following variables:
- The level of security measures taken before the introduction of ISPS for national reasons (drug trafficking, naval base, etc)
- The total throughput in tons and TEU - The layout of the port considered (concentrated within one area, or spread out or scattered in
several individual port facilities) • Only four out of the twelve ports investigated introduced a Security Charge. In most ports the
ISPS implementation costs were absorbed by the national authorities and / or the individual terminals; mostly for competitive reasons. Interesting in this respect is that some terminals

38 REVIEW OF COST OF COMPLIANCE WITH NEW INTERNATIONAL FREIGHT TRANSPORT SECURITY REQUIREMENTS
introduced a Security Charge that actually is higher than the actual investment and running costs, as estimated. These terminals, in other words, generate an net income from Security.
• However, in many interviews the benefits as a result of the implementation of the ISPS Code were
also mentioned (in particular by the port users) such as: - A significant reduction in the number of stowaways - Reduction of theft and pilferage - Increase of Customs revenues as a consequence of more and better inspections - Reduction of cargo delays and waiting times - More orderly port and terminal areas.
In graphical form the results are as follows (dotted line shows the averages of US$4.95 and US$0.22 respectively).
Figure 5-1. Average cost per TEU (in US$)
Average Cost per TEU
0
2
4
6
8
10
12
14
16
AFR01/A
1
AFR02/A
2
AFR03/A
3
ECA01/B
1
ECA02/B
2
ECA03/B
3
ECA04/B
4
ECA04/B
5
LAC01/L1
LAC02/L2
LAC03/L3
LAC04/L4
Country/Port
Cos
t (US
$)
Figure 5-2. Average cost per ton (in US$)
Average Cost per ton
0
0.1
0.2
0.3
0.4
0.5
0.6
AFR01/A
1
AFR02/A
2
AFR03/A
3
ECA01/B1
ECA02/B2
ECA03/B3
ECA04/B4
ECA04/B5
LAC01/L
1
LAC02/L
2
LAC03/L
3
LAC04/L
4
Country/Port
Cost
(US
$)
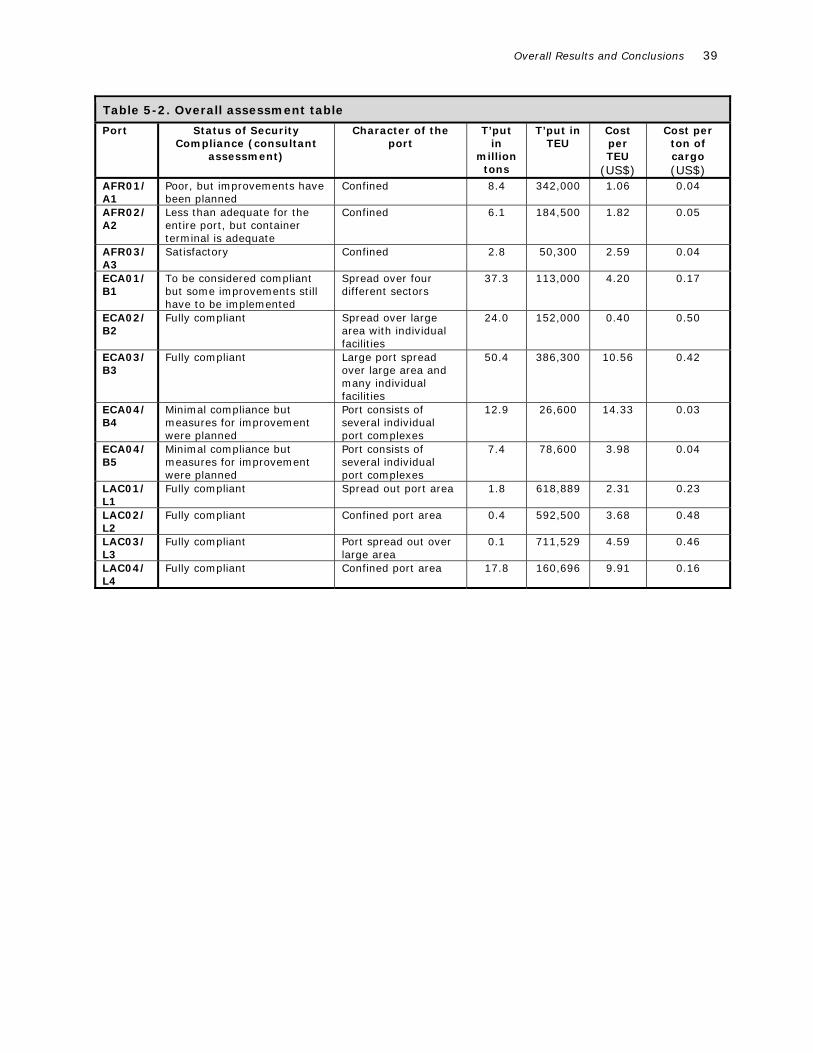
Overall Results and Conclusions 39
Table 5-2. Overall assessment table
Port Status of Security Compliance (consultant
assessment)
Character of the port
T’put in
million tons
T’put in TEU
Cost per TEU
(US$)
Cost per ton of cargo (US$)
AFR01/A1
Poor, but improvements have been planned
Confined 8.4 342,000 1.06 0.04
AFR02/A2
Less than adequate for the entire port, but container terminal is adequate
Confined 6.1 184,500 1.82 0.05
AFR03/A3
Satisfactory Confined 2.8 50,300 2.59 0.04
ECA01/B1
To be considered compliant but some improvements still have to be implemented
Spread over four different sectors
37.3 113,000 4.20 0.17
ECA02/B2
Fully compliant Spread over large area with individual facilities
24.0 152,000 0.40 0.50
ECA03/B3
Fully compliant Large port spread over large area and many individual facilities
50.4 386,300 10.56 0.42
ECA04/B4
Minimal compliance but measures for improvement were planned
Port consists of several individual port complexes
12.9 26,600 14.33 0.03
ECA04/B5
Minimal compliance but measures for improvement were planned
Port consists of several individual port complexes
7.4 78,600 3.98 0.04
LAC01/L1
Fully compliant Spread out port area 1.8 618,889 2.31 0.23
LAC02/L2
Fully compliant Confined port area 0.4 592,500 3.68 0.48
LAC03/L3
Fully compliant Port spread out over large area
0.1 711,529 4.59 0.46
LAC04/L4
Fully compliant Confined port area 17.8 160,696 9.91 0.16


41
6 UNCTAD REPORT MARITIME SECURITY: ISPS CODE IMPLEMENTATION, COSTS AND RELATED
FINANCING This chapter summarizes the main issues of the UNCTAD Report.
Executive Summary On 1 July 2004, the 2002 amendments to the 1974 International Convention for the Safety of Life at Sea (SOLAS) and the new International Ship and Port Facility Security Code (ISPS Code), entered into force and became mandatory for all SOLAS Member States. The SOLAS amendments and the ISPS Code (hereinafter the ISPS Code) impose wide-ranging obligations on governments, shipping companies, and port facilities. Implementing these obligations entails costs and potential economic implications. Against this background, UNCTAD conducted a global study based on a set of questionnaires designed to obtain first hand information from all affected parties. The main objective was to establish the range and order of magnitude of the ISPS Code-related expenditures made from 2003 through 2005 and to gain insight into the financing mechanisms adopted or envisaged. In addition the study sought to clarify matters relating to the implementation process, level of compliance and other less easily quantifiable impacts. Due to limited responses received from the shipping sector the report presents responses received from ports and governments only. A. Port Questionnaire A total of 55 completed questionnaires were received from respondent ports spread over all regions, the majority of which in developed countries. Together respondent ports that provided information on cargo throughput handle about 16 percent of the global port cargo throughput (in tons), based on 2004 world seaborne trade figures, and approximately 24 percent of the global container port throughput (TEU).1 Implementation, Supplementary Measures and Level of Compliance Full compliance seems to have been achieved with no major difficulties. The mandatory requirements in Part A of the ISPS Code are largely fulfilled on the basis of the guidance contained in Part B of the Code. In many cases additional measures, either government or industry-driven, have been adopted. Cost of Compliance Initial cost figures for respondent ports range between a low of US$3,000 and a high of US$35,500,000, while reported annual costs range between US$1,000 and US$19,000,000. Unit costs and averages have been assessed on the basis of a number of parameters. These include respondent ports' annual revenues, cargo throughput (tons and TEU), ship calls and number of ISPS port facilities. The unit cost analysis revealed the presence of important cost differentials between respondent ports, especially between larger and smaller ports. In other words, relative costs appear to be substantially higher for smaller respondent ports. As to the manner in which costs are distributed among various cost headings, responses received suggest that, on average, expenditures on equipment absorb the largest share of the initial costs followed by expenditures on infrastructure and to a lesser extent other cost headings. With respect to the annual costs, on average, personnel and staff time represent, by far, the largest share of the ISPS Code-related costs. Other cost headings take up a smaller share of the annual costs. Global initial and annual costs were also estimated on the basis of data on costs provided, as well as reported cargo throughput (tons and TEU) and number of ISPS port facilities.
1 See pages 8 and 77 of UNCTAD's Review of Maritime Transport, 2006 (www.unctad.org/rmt2006) for data on global container port throughput and seaborne trade

42 REVIEW OF COST OF COMPLIANCE WITH NEW INTERNATIONAL FREIGHT TRANSPORT SECURITY REQUIREMENTS
The share of relevant respondent ports of world seaborne trade measured in tons is estimated to about 13 percent, while their share of global container port throughput and total number of declared ISPS port facilities2 is estimated to approximately 16 percent and 6 percent, respectively.3 Bearing in mind the limitations that may characterize such calculations, the estimated global port-related costs of the ISPS Code range between approximately US$1.1 and US$2.3 billion initially, and approximately US$0.4 and US$0.9 billion annually thereafter. These costs are equivalent to increases in international maritime freight payments of about 1 percent with respect to the initial expenditure and 0.5 percent with respect to the annual expenditure.4 Financing the ISPS Code-related Costs A number of respondent ports have implemented or plan to implement cost-recovery schemes. Where applicable, ports seem to favor levying security charges on several port users, but particularly cargo and containerized traffic. In general, less than full recovery of both initial and annual costs is expected. As to security charges applied, responses received did not shed much light on the criteria used for setting the basis and the levels of the charges. The survey also revealed that some ports had received public funding and assistance. Where applicable, assistance included governmental grants and cost-sharing agreements, mainly for respondent ports located in developed regions. Respondent ports in developing countries appear to have benefited mainly from technical assistance and capacity building provided by international organizations. Ports' Perception of Other Effects Ports seem to have accepted the ISPS Code objectives as legitimate and reported an overall positive impression of the new security regime, especially in terms of increasing awareness, streamlining processes, standardizing risk assessment and improving business practices. Respondent ports that emphasized the negative impact associated with the Code appeared particularly concerned about operational interferences, as well as cost implications and related funding requirements. In this respect, some respondent ports have called for assistance. As to the Code's impact on various port performance measures, such as efficiency, use of information and communication technologies (ICT) and throughput growth, respondent ports' perceptions appeared rather positive. Some respondent ports, however, reported experiencing increased delays and few noted a decrease in competitiveness, while many said the ISPS Code had no impact at all. B. Governments' Questionnaire A total of 45 responses were received from governments located in countries representing about 24 percent of the United Nations membership. Responses received span all regions with the exception of North America and Oceania. Implementation Process and Compliance All respondent governments are Contracting States to the SOLAS Convention and most have delegated certain security duties to Recognized Security Organizations (RSO). Most respondent governments reported that they had relied on dedicated legislative and regulatory instruments to ensure national implementation of the Code, including the monitoring of initial and subsequent compliance.
2 According to the IMO secretariat, as of October 2006, the total number of the dedicated ISPS port facilities amounted to 10,652 3 2004 data on global container port throughput and seaborne trade have been used (see UNCTAD's Review of Maritime Transport, 2006). According to the IMO secretariat, as of October 2006, the total number of the declared ISPS port facilities amounted to 10,652. 4 See UNCTAD's Review of Maritime Transport, 2006 (www.unctad.org) for 2004 data on global freight costs. The 2004 data on international maritime freight costs have been estimated by the UNCTAD secretariat to amount to about 67 percent of global freight costs.

UNCTAD Report Maritime Security: ISPS Code Implementation, Costs and Related Financing 43
With few exceptions, including in relation to resource limitations, governments reported that compliance with the ISPS Code by their respective national ports and shipping sectors had been achieved with no major difficulties. Compliance with the mandatory provisions of Part A of the Code has mainly been achieved on the basis of the guidance provided in Part B of the Code. The majority of respondent governments indicated that additional measures affecting their respective national ports and the shipping sectors had been adopted to supplement the ISPS Code requirements. Implementation and Compliance Costs Reported initial cost figures range between US$13,500 and US$50 million per respondent government, while annual costs range between US$1,500 and US$27 million. This provides an indication of the range of ISPS Code-related expenditures on the part of governments. However, the limitations that characterize data on costs obtained require that these be considered as broadly indicative only. Financing Governments' ISPS Code-related Costs There are various approaches and degrees of external support to SOLAS contracting governments since not all respondent governments have benefited or expect to benefit from assistance. Assistance received by governments took mainly the form of capacity-building, technical assistance and grants. As to cost-recovery, for the majority of respondent governments costs appear not to be recovered through user fees or charges. That being said, where applicable, the favored approach for governments appears to be the application of fees for the issuance and renewal of certificates as well as for audits. Governments' Financial Assistance to their National Ports Some respondent governments have assisted or plan to provide assistance to their respective national ports. Grants and cost-sharing arrangements appear to be the most common type of assistance provided by governments to their respective national ports. Some governments have also provided technical assistance to their ports. Governments' Perception of the ISPS Code Overall Impact Summarizing the overall impact of the ISPS Code on their respective countries, a significant majority of respondent governments highlighted the positive impact of the new IMO security regime. Some argued, however, that it was expensive to implement and that additional guidance was required. Others had a negative perception of the Code due to their resource limitations. In this respect, a number of respondent governments, especially from countries of developing Africa stressed the need for international assistance and cooperation.
The Executive Summary does not mention costs per TEU and costs per ton, as was the objective and the result of the World Bank project. These costs, however, are dealt with in Part III of UNCTAD's report (at paragraphs 23-36). Relevant wording is quoted below.
1. Initial and Annual Costs 23. Expressed in absolute terms, the reported initial cost figures for respondent ports range between a low of US$3,000 and a high of US$35,500,000. As to the annual costs, reported figures range between US$1,000 and US$19,000,000. The lower end of the cost range was reported by a small Asian port whereas the higher was reported by a large European port featuring among the top 15 global container ports. 24. In order to allow for some comparisons to be made and to put reported cost figures in perspective, unit costs and averages have been assessed on the basis of a number of reference points after filtering out for extreme values. Reference points used include respondent ports' annual revenues, cargo throughput (tons and TEU), ship calls and number of ISPS port facilities. The size of the respective samples used
44 REVIEW OF COST OF COMPLIANCE WITH NEW INTERNATIONAL FREIGHT TRANSPORT SECURITY REQUIREMENTS
to estimate unit costs and averages varies, depending on the data provided in respect of each parameter.5 Respondent ports in these samples have been divided into larger (upper half or top 50 percent) and smaller ports (bottom half).6 The dividing figure between larger and smaller respondent ports in the case of all cargo throughputs is 15 million tons. With respect to respondent ports’ container throughput, ship calls and number of ISPS port facilities, the cut-off points are, in the same order, 500,000 TEU, 3,000 ship calls and 10 ISPS port facilities. 25. In those cases where initial costs are expressed in relation to annual performance data, reported initial costs have been annualized using the straight-line depreciation method.7 As responses received with respect to the structure of the initial costs suggest that, on average, over one-third of the initial costs are attributed to expenditures on equipment, the average useful economic life of the ISPS Code-related initial investments or the average depreciation period is set to 5 years.8 26. Expressing reported costs as a proportion of respondent ports' annual performance measures aims to provide an order of magnitude of the ISPS Code-related costs and to ascertain whether there are differences between ‘larger’ and ‘smaller’ ports. Thus, the main objective is not to compare initial and annual costs or establish the exact depreciation. Therefore, the selected depreciation period and resulting annualized initial costs are indicative only. a. Average Costs per ISPS Port Facility9 27. Figure 2 [of UNCTAD's report] highlights the unit cost differentials that prevail between respondent ports depending on the number of ISPS port facilities with no further information on the type of traffic handled. The average initial cost per ISPS port facility for smaller respondent ports amounts to US$386,000 which is more than double the cost for larger respondent ports (US$181,000). The average initial cost per facility for all respondent ports, irrespective of the number of the ISPS port facilities, amounts to US$287,000. As to the annual costs, the average cost per facility for smaller respondent ports continues to be higher (US$128,000) as compared with the cost of larger respondent ports (US$81,000). The average annual cost per ISPS port facility for all respondent ports, irrespective of their size, amounts to US$105,000. b. Average Costs as a Percentage of Operating Revenues 28. On average, the ISPS Code-related initial costs account for about 1 percent of respondent ports’ annual revenues [Figure 3 of UNCTAD's report10]. A breakdown of respondent ports by size indicates that smaller respondent ports allocate a larger share of their operating revenues to financing the ISPS Code (1.2 percent) as compared with the share allocated by larger respondent ports (0.8 percent). 29. As to the ISPS Code-related annual running costs, on average, respondent ports allocate about 2 percent of their revenue to financing the ISPS Code-related
5 See paragraph 14 above for the relevant sample that provided data on costs and financing. Size of respective samples expressed as a percentage of global cargo throughput in tonnes, is indicated, as appropriate, in Figures 2 to 10 of this report. 6 For the purposes of the average unit cost calculations, the breakdown between smaller and larger respondent ports is not comparable with that referred to in fn. 10 of [the UNCTAD] report. 7 Assumes that the value of an asset or capital investment drops in equal, constant yearly increments over the depreciation period. 8 Ports might have different cost depreciation structures and the exact relevant lifespan to allocate to the initial ISPS Code-related investments is difficult to establish. For example, equipment has a shorter lifespan than infrastructure. 9 The relevant sample represents respondent ports handling about 7 percent of the global port cargo throughput (tons). 10 The relevant sample represents respondent ports handling about 8 percent of the global port cargo throughput (tons).

UNCTAD Report Maritime Security: ISPS Code Implementation, Costs and Related Financing 45
expenditures [Figure 4 of UNCTAD's report11] Smaller respondent ports allocate a larger share of their revenue (3 percent) to financing such costs as compared with larger respondent ports (1 percent). 30. The above results suggest that the ISPS Code-related financial impact is more pronounced in the case of smaller ports. Taking the analysis one stage further and accounting for other relevant parameters such as cargo throughput and ship calls, the following sections confirm the above findings and support the argument that cost differentials among respondent ports depend on size. c. Average Costs per TEU Handled 31. Taking into account the volume of container throughput handled, with no particular assumptions made with respect to the distribution of such traffic between respondent ports, the average cost per TEU for relevant respondent ports amounts to about US$1.6 [Figure 5 of UNCTAD's report12] The average initial cost per TEU for smaller respondent ports amounts to US$2.3 about three times (US$0.8) the cost for larger respondent ports. 32. A similar picture emerges when considering reported annual costs [Figure 6 of UNCTAD's report 13] The average annual cost per TEU handled for smaller respondent ports amounts to US$2.5, while the cost for larger respondent ports amounts to US$1.6. On average, the annual cost per TEU for respondent ports, irrespective of their size, amounts to US$2. d. Average Costs per Ton of all Cargo Handled Using a different reference point -tons of cargo throughput- the average initial and annual unit costs have been assessed. The average initial cost per ton [Figure 7 of UNCTAD's report14] for larger respondent ports amounts to approximately US$ 0.01, while that of smaller respondent ports is about US$0.05 or five times the average unit cost of larger respondent ports. The average initial cost for respondent ports irrespective of size amounts to US$0.03 per ton. This result is replicated when considering annual costs [Figure 8 of UNCTAD's report15]. The average cost per ton for smaller respondent ports amounts to US$0.06 or double the average unit cost of larger respondent ports (US$0.03). The average annual cost per ton of cargo handled amounts to US$0.05 for all respondent ports irrespective of size.
The UNCTAD Report then continues with section "f. Summary and Discussion." This section contains a summarizing table with all the results. For the sake of comparison between the two studies, this table has been adapted with the objective to present the main results to be compared: the costs per TEU and the costs per ton.
f. Summary Table 1 [of UNCTAD's report] summarizes the estimated average costs and highlights the cost differentials between larger and smaller respondent ports. As a general trend, estimated average costs appear to be higher for smaller respondent ports as compared with larger respondent ports. Economies of scale, the type and structure of
11 The relevant sample represents respondent ports handling about 7 percent of the global port cargo throughput (tons). 12 The relevant sample represents respondent ports handling about 10 percent of the global port cargo throughput (tonnes). 13 The relevant sample represents respondent ports handling about 8 percent of the global port cargo throughput (tonnes). 14 The relevant sample represents respondent ports handling about 9 percent of the global port cargo throughput (tonnes). 15 The relevant sample represents respondent ports handling about 9 percent of the global port cargo throughput (tonnes).

46 REVIEW OF COST OF COMPLIANCE WITH NEW INTERNATIONAL FREIGHT TRANSPORT SECURITY REQUIREMENTS
cargo throughput handled and prevailing security environment prior to the implementation of the ISPS Code may play an important role in this respect. Table 1: ISPS Code-related Average Costs of Respondent Ports (US$)
Per ton of cargo throughput Per TEU throughput Larger Smaller Average Larger Smaller Average
Initial 0.01 0.05 0.03 0.80 2.30 1.60 Annual 0.03 0.06 0.05 1.60 2.50 2.00 Total 0.04 0.11 0.08 2.40 4.80 3.60

47
7 COMPARISON OF THE RESULTS OF BOTH STUDIES AND FINAL OBSERVATIONS A comparison of the results of the UNCTAD study and the outcome of the World Bank is difficult given differences in objective, methodology as well as sample size and characteristics. However, the most striking result is that the final figures in terms of costs per ton and costs per TEU are in the same range, as illustrated in Table 7-1.
Table 7-1. Average costs per ton and costs per TEU (in US$)
Average cost per TEU Average cost per ton of cargo UNCTAD Report 3.60 0.08 World Bank 4.95 0.22
Yet, it is quite difficult to compare the final results for the following reasons: • The UNCTAD result is based on a questionnaire that was sent to the port industry. In total 55
completed questionnaires were returned from respondent ports spread over all the regions of the world, the majority of which, however, are located in developed countries. Relevant data on costs and financing and in a format suitable for analysis was obtained from respondent ports which together handle about 13 percent of global port cargo throughput (tons), estimated on the basis of world seaborne trade data for 2004
• The World Bank study investigated 12 ports and terminals, all located in developing countries. In terms of the categorization criteria of the UNCTAD study, all the facilities examined by the World Bank fall in the ‘Smaller Ports’ Category (<500,000 TEU per year), except for Ports L1, L2 and L3. Similarly, based on cargo throughput in tons, facilities examined by the World Bank fall in the "Smaller Ports" Category (<15 million tons) except for ports B1, B2 and B3. Note that B3 is small based on TEU throughput but large based on all cargo tons throughput. Also, L2 is a large port based on TEU but small based on tons. Therefore, there is a need to adjust the calculated average cost per ton of cargo to exclude B1, B2 and B3 as per L1, L2 and L3 in the case of TEU. If this is taken into consideration, Table 7-1 above would look as follows.
Table 7-2. Average cost per TEU
UNCTAD Report (smaller ports only i.e. <500,000 TEU))
US$4.80
World Bank (adjusted: excluding ports L1, L2 and L3)
US$5.40
Table 7-3. Average cost per ton of cargo
UNCTAD Report (smaller ports only i.e. <15 million tons)
US$0.11
World Bank (adjusted: excluding ports B1, B2 and B3)
US$0.17
• Another factor requiring that any direct comparison be handled with care relates to the methods
used to calculate costs per ton of cargo or per TEU: - The UNCTAD study has used the following method: ‘Unit costs and averages have been
assessed on the basis of a number of parameters. These include respondent ports' annual revenues, cargo throughput (tons and TEU), ship calls and number of ISPS port facilities.’
- The World Bank study has investigated the actual investment and running costs for both the Port Authority and the individual terminal or terminals (on an averaged basis). In spite of the difficulty to compare both methods it is striking that the final results are so close.
• Finally, as to the perception of the ports and the terminals of the implementation and effects of the ISPS Code, both studies come to the same conclusions. The ISPS Code objectives have generally been accepted as legitimate and as having a positive influence on the new security regime in terms of increased awareness, streamlined procedures, standardized risk assessment, improved business practices, cleaner and better organized ports and decreased theft and pilferage.


49
ANNEX: TERMS OF REFERENCE: REVIEW OF COST OF COMPLIANCE WITH
NEW INTERNATIONAL FREIGHT TRANSPORT SECURITY REQUIREMENTS
Background 1. The international context since 2001 has led to a drastic review of the security environment under which international transport operations are taking place. Existing conventions have been revised and new provisions established to significantly strengthen the overall security of international freight and passengers transport. As far as freight transport is concerned, carriers and terminals are now asked to implement new controls and monitoring systems to ensure consignments are not contaminated while under their custody. These developments obviously result in new costs to be borne by the international transport system. 2. For air transport, the International Civil Aviation Organization has first tackled this issue by amending the ICAO Chicago Convention in its Annex 17, the updated Convention coming into force on July 1, 2002. 3. Carrying by far the largest proportion of international trade flows, both in volume and value, maritime transport has been the focus of specific new security requirements which have been embedded by the International Maritime Organization (IMO) into the International Ship and Port Facility Security Code (ISPS), which came into force on July 1, 2004. Under ISPS provisions, both shipping lines and ports have now to comply with a set of provisions aiming at securing cargo handling and freight shipping operations throughout each maritime leg of the international transport operations. Objectives of the Review 4. The review will seek to establish the costs involved, at a country level, of meeting the new maritime transport security requirements as defined in the new IMO International Ship and Port Facility Security Code (ISPS). The work will compile an inventory of the different measures made mandatory by the conventions, and establish a range of costs assessments based on case studies covering countries of different sizes and at various level of development. The research will look at both the costs incurred by governments and by private transport operators, and will seek to illustrate both their impact on transport costs, focusing in particular on containers. The first three countries to be investigated will be selected in due course by the World Bank. Scope of Work 5. For each selected country, the Consultant will seek to identify the actions already undertaken, or still needed, to bring international port facilities into compliance with the requirements spelled out in the international conventions now in force for maritime transport. These actions may be the responsibility of the Port Authority, the Customs, or any other public agency. He will then produce an estimate of the costs involved in doing so. 6. The scope of work will be on -but not limited to-: - Infrastructure: secure access, fencing, entry/exit facilities, security centers, etc. - Equipment: gate controls, CCTV networks, scanners, radars and vessel traffic management
systems, vehicles, etc. - Staffing and Training needs: new hires, retraining of existing staff, training facilities and
equipment, etc. For each cost item, the Consultant will establish (i) an initial investment costs, and (ii) the corresponding recurrent annual running costs, including maintenance, spare parts, continuous training, etc. 7. Similarly, through interviews with a few main private operators, freight forwarders, and shippers, using the facilities, the Consultant will seek to establish the magnitude of the costs they have incurred, or are considering to incur, to comply with the new security requirements. Their corresponding activity in the port will be documented accordingly (in cargo tonnage and value). All costs will be broken down according to the same distribution as indicated above.
50 REVIEW OF COST OF COMPLIANCE WITH NEW INTERNATIONAL FREIGHT TRANSPORT SECURITY REQUIREMENTS
8. In each given situation, the Consultant will estimate at current market prices the investment costs of the items yet to be implemented, and the investment costs of already existing - and seen as to be in compliance with the new requirements - items (a port perimeter fence, for instance) at their current replacement costs. 9. Each country report will include: - A map of the port showing the perimeter to be secured, all access and exit/entry locations,
and any other relevant information; - Statistics of port traffic for the last operating year (with specific information on containers),
and, when available, projected traffic for the next 5 years; - For the Port Authority (including Customs and other public authorities as warranted), a costs
table showing, for each category of items, investment costs and annual recurring costs; - For private operators, a costs table showing, for each category of items, investment costs and
annual recurring costs, together with statistics of their port-related activity in tonnage and value;
- A table showing the impact of global security costs (public authorities and private operators) per unit of cargo going through the port, and/or per ton, and
- A table displaying the unit costs used to derive the total cost for each expense item (linear meter of fence, CCTV camera, radar, scanner unit, individual piece of equipment, training per staff, etc.).
Timetable and Reporting 10. It is expected that each country report will require on average a two-week mission in the field and one week of desk work. Country draft reports will be submitted to the task managers in the period agreed, so as to enable the Bank to consolidate the results according to its targeted time table. Language 11. It is expected that the draft and final reports be produced in English. Budget 12. A reference budget per country was provided. The Terms of Reference required the Consultant to carry out investigations in each port in order to provide information about the cost impact of transport security requirements on trade flows. More specifically, for each port under review, the study aimed at preparing an inventory of existing and still required investments for ISPS compliance, assessing the initial and annual costs for the governments and private operators, and identifying the impacts on port charges.