the wonderful world of fresh fruits and vegetables - … · 24/2/2017 · the wonderful world of...
TRANSCRIPT
The Wonderful World of Fresh Fruits and Vegetables
What’s So Special About Our Industry?

USDA Outlook Forum – February 24, 2017
We’re the key to good health!

USDA Outlook Forum – February 24, 2017
But also great taste!

USDA Outlook Forum – February 24, 2017
And convenience!

USDA Outlook Forum – February 24, 2017
What’s not to like?
Good HealthGreat Taste
Amazing Convenience
• But there are some warning signs for the future – labor, food safety, food competition . .

USDA Outlook Forum – February 24, 2017
Today’s Discussion
1. About United Fresh2. Snapshot of fruits and vegetables in U.S.
food supply today3. Potential challenges to future growth4. Some reasons for optimism

USDA Outlook Forum – February 24, 2017
A United Fresh Update
• We bring together the total produce industry supply chain– Growers, wholesalers, fresh processors,
distributors, retailers, restaurants, service providers, allied associations
• 1,500 companies; 10,000 individuals– More than 100 commodity boards; local, regional,
national, international associations– Members in every state, 25 countries– 300 volunteers on boards, councils
USDA Outlook Forum – February 24, 2017
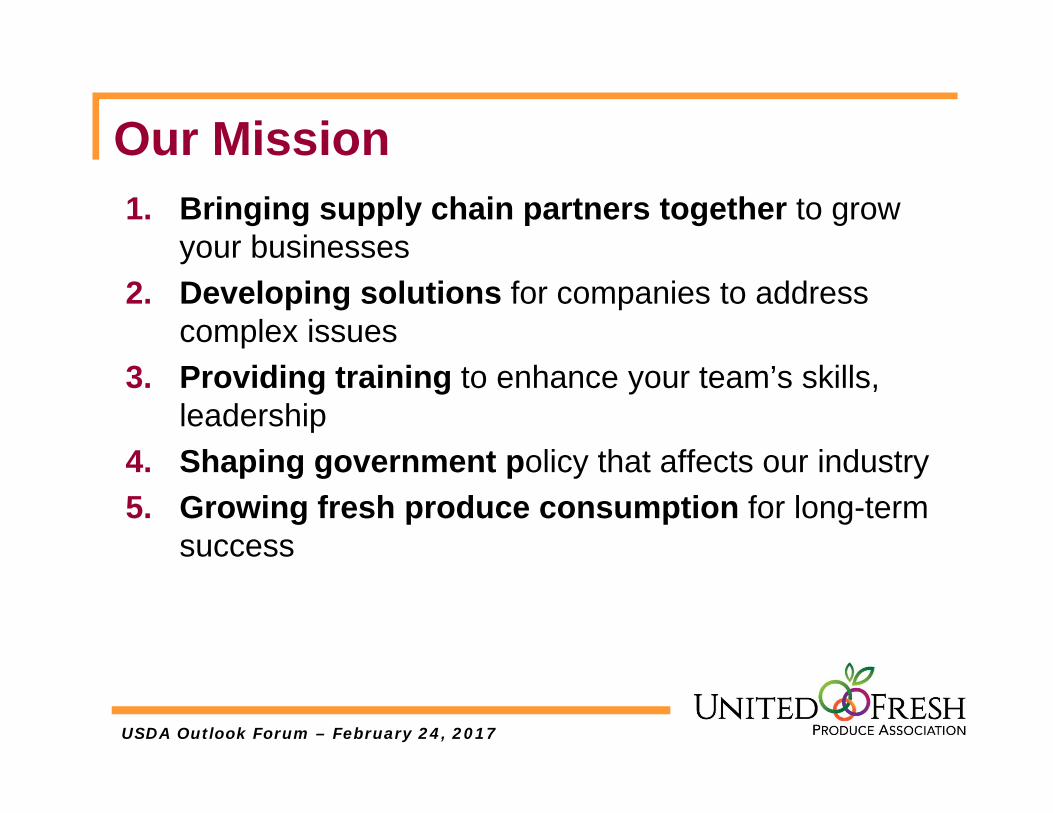
Our Mission1. Bringing supply chain partners together to grow
your businesses2. Developing solutions for companies to address
complex issues3. Providing training to enhance your team’s skills,
leadership4. Shaping government policy that affects our industry5. Growing fresh produce consumption for long-term
success
Now, On To That Industry Snapshot …
Data From USDA Agriculture Census

USDA Outlook Forum – February 24, 2017
U.S. Fruit & Veg Production
• 230,755 farms (10.9%)• 9.8 million acres (1.1%)
– 7.5 million irrigated acres (76.5%)• $57.2 billion market value (14.5%)
– 27% of all crop value

USDA Outlook Forum – February 24, 2017
Crop Comparison
Commodity Market Value Acreage
Corn $67.2 billion 94.5 million
Soybean $38.7 billion 76.1 million
Fruits, Berries, Tree Nuts $25.9 billion 5.5 million
Vegetables, Melon, Potato $16.9 billion 4.2 million
Wheat $15.8 billion 49.0 million
Rice $2.9 billion 2.7 million

USDA Outlook Forum – February 24, 2017
Ownership of F&V Farms
OwnershipNumber of
FarmsPercent of
Farms
Family 197,652 79.8%
Partnership 22,544 9.1%
Family Owned Corporation 21,110 8.5%
Cooperative 3,589 1.4%
Non-Family Corporation 2,877 1.2%
USDA Outlook Forum – February 24, 2017
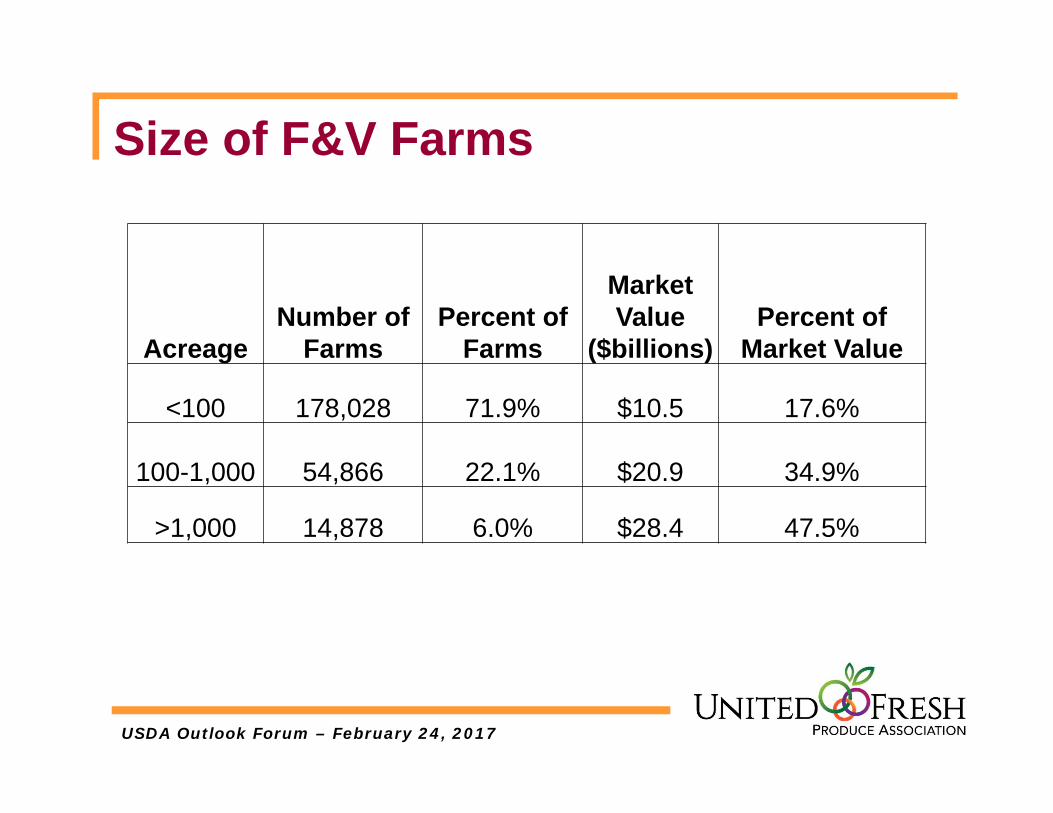
Size of F&V Farms
AcreageNumber of
FarmsPercent of
Farms
Market Value
($billions)Percent of
Market Value
<100 178,028 71.9% $10.5 17.6%
100-1,000 54,866 22.1% $20.9 34.9%
>1,000 14,878 6.0% $28.4 47.5%

USDA Outlook Forum – February 24, 2017
Concentration of F&V Farms
• Concentration by geographic region– Varies somewhat by commodity– California is still king

USDA Outlook Forum – February 24, 2017
3 CA Counties Exceed 47 States
Fruits Vegetables Total
Fresno $2.5 billion $727 million $3.2 billion
Kern $2.5 billion $415 million $2.9 billion
Monterey $1.1 billion $1.7 billion $2.8 billion

USDA Outlook Forum – February 24, 2017
Fruits, Nuts and Berries
State Market ValuePercent of US Market Value
1. California $17.6 billion 67.9%2. Washington $2.9 billion 11.2%3. Florida $1.8 billion 6.9%4. Oregon $517 million 2.0%5. New York $308 million 1.2%6. Georgia $308 million 1.2%7. Michigan $257 million 1.0%8. Texas $252 million 1.0%9. Wisconsin $219 million 0.8%10. Pennsylvania $160 million 0.6%Top 10 States $24.3 billion 93.9%

USDA Outlook Forum – February 24, 2017
Vegetables, Melon, Potatoes
State Market ValuePercent of US Market Value
1. California $6.3 billion 37.5%2. Florida $1.3 billion 7.7%3. Washington $1.1 billion 6.5%4. Idaho $968 million 5.8%5. Arizona $764 million 4.5%6. Wisconsin $555 million 3.3%7. Oregon $492 million 2.9%8. Texas $474 million 2.8%9. Michigan $463 million 2.7%10. Georgia $412 million 2.4%Top 10 States $ 12.8 billion 80.0%

USDA Outlook Forum – February 24, 2017
Import Share of Consumption1980 1990 2000 2010
All fresh fruit 26.7% 34.9% 42.4% 48.8%
All fresh vegetables 8.0% 10.3% 13.2% 24.5%
Avocados 2.2% 13.2% 48.9% 79.7%Grapes 13.6% 37.0% 45.2% 50.3%Melon 10.3% 15.5% 25.1% 28.9%Asparagus 10.8% 29.8% 59.0% 89.1%Garlic 12.5% 17.4% 29.0% 59.5%Tomatoes 22.3% 20.5% 30.0% 52.3%

USDA Outlook Forum – February 24, 2017
Source of Fruit and Veg Imports2012 Value Percentage
Mexico $7.0 billion 51.3%Chile $1.2 billion 8.8%Canada $1.2 billion 8.8%Guatemala $923 million 6.8%Costa Rica $920 million 6.7%Ecuador $449 million 3.3%Peru $448 million 3.3%Honduras $258 million 1.9%Columbia $246 million 1.8%Rest of World $996 million 7.3%

USDA Outlook Forum – February 24, 2017
Dollar Growth in Exports
2000 2005 2010 2013All fresh fruit $2.1 billion $2.7 billion $4.0 billion $5.0 billion
All fresh vegetables $1.2 billion $1.5 billion $2.1 billion $2.4 billion

USDA Outlook Forum – February 24, 2017
Per Capita Consumption (Lbs)
1980 1990 2000 2013%
ChangeAll Fresh Vegetables 113.0 147.1 174.5 169.8 50.3%All Fresh Fruit 88.4 92.0 101.2 110.5 25.0%
Broccoli 1.4 3.4 5.9 6.8 386%Strawberries 2.0 3.2 4.9 7.9 295%Bell Pepper 2.9 5.9 8.2 10.3 255%Grapefruit 7.3 4.4 5.0 2.8 -62%Peach/Nectarine 7.1 5.5 5.3 3.1 -56%Head Lettuce 25.6 27.8 23.5 12.5 -51%

USDA Outlook Forum – February 24, 2017
Fresh vs. Processed (Lbs)
1980 1990 2000 2012%
ChangeFresh Fruit 106.5 117.0 128.8 131.0 23.0%
Processed Fruit 159.3 141.0 158.0 113.7 -28.6%
Fresh Vegetables 151.8 176.4 200.8 191.7 26.3%Processed Vegetables 186.2 214.8 223.5 203.2 9.1%

USDA Outlook Forum – February 24, 2017
Per Capita Consumption (Lbs)
30-Year TrendPercent Change
All Fresh Vegetables 50.3%
All Fresh Fruit 25.0%
Seafood 22.0%Meat & Poultry 4.0%

Where From Here?
Can we continue – and accelerate – the trend to increasing fresh fruit and vegetable consumption?

USDA Outlook Forum – February 24, 2017
What would half a plate mean?
• Americans consume less than half of recommended levels
• If you could snap your fingers– Save tens of billions in healthcare costs– Cut the childhood obesity epidemic, early onset of
diabetes and other illnesses– Reduce chronic diseases such as cancer, heart
disease, hypertension– Have an unbelievable impact on our industry

USDA Outlook Forum – February 24, 2017
But there are warning signs
• Labor availability • Misinformation on food safety• Competitive foods pushback• International trade dynamics

USDA Outlook Forum – February 24, 2017
Labor Availability
• US labor availability– We’re highly labor-intensive industry– 75% workforce likely falsely documented– And, we’re even losing those workers
o To other industrieso To demographics and enforcement
– With no replenishment of workers• US immigration reform is needed now!• Labor practices will also matter

USDA Outlook Forum – February 24, 2017
Food Safety Misinformation
• Fresh produce is extraordinarily safe– Over 1 billion servings a day, without incident– Incidence of illness is rare, but will be increasingly
visible, from new sources• But, we grow produce outside in nature, not in
manufacturing plants– Cannot control every possible risk– No “kill step” that cooks produce
• Public perception still expects zero risk

USDA Outlook Forum – February 24, 2017
Competitive Foods Pushback
• Fresh produce is finally competing for real dollar share
• Competitors are pushing back hard– Certain food sectors are opposing health standards
in nutrition and feeding programs– Processed food interests marketing aggressively
against fresh foods– Meat industry is challenging government promotion
of fruits and vegetables

USDA Outlook Forum – February 24, 2017
International Trade Challenges• Trade is a dynamic issue for the fruit and vegetable
industry in the United States• U.S. consumer/retail demand for year-round product has
required U.S. producers to invest/partner in operations in other parts of the world.
• For the produce industry, trade affects commodities/regions differently• Export markets remain a key for many commodities• Others are import sensitive, with many members adverse to
competition

USDA Outlook Forum – February 24, 2017
Three Reasons for Optimism
1. Childhood obesity crisis has galvanized understanding of health consequences– In a way that long-term chronic disease did not
2. Industry innovation is exploding– In new product development– In expanding sales channels– In supply chain technology from field to table
3. We’re focused on changing the world for the next generation, not one person at a time

USDA Outlook Forum – February 24, 2017
Obesity Crisis Has Our Attention• Today’s children may be the first generation
with a shorter life expectancy than their parents• Health care costs related to obesity top $150
billion every year– Childhood obesity accelerates cost impact
• Increasing fruit and vegetable consumption is no longer just our business goal– It’s critical to the nation’s health, physically and
financially

USDA Outlook Forum – February 24, 2017
Innovation in Product Development
• Growth in consumption will come from new products, not commodity yields
• New varieties with enhanced consumer attributes, quality, taste, nutrition
• Fresh-cut, convenience, value-added• Who’s next?
– Bagged salads, baby carrots, sliced apples transformed these commodities

USDA Outlook Forum – February 24, 2017
Innovation in Sales Channels
• Fresh convenience is driving the market– Supermarkets must become “fresh”– Convenience channel, small footprint stores– Online, delivery, new food channels
• Health and wellness snacking needs– School foodservice and vending– Institutional settings from hospitals and
universities to corporate business settings

USDA Outlook Forum – February 24, 2017
Innovation in Supply Chain
• Production– Mechanization and labor saving tools– Greenhouse, protected agriculture– Food safety solutions
• Distribution– Freshness is the most critical element in delivering
positive eating experience– Quality control throughout the cold chain is the key

USDA Outlook Forum – February 24, 2017
We’re Changing the Way Kids Eat
• Increasing produce consumption requires policy and environmental change– We can’t just work to change one person’s eating
habits; we must change millions– Increasing access, availability of high-quality, great-
tasting fresh fruits and vegetables– Schools have become a primary intervention point
to change lifestyle• Kids will choose fresh produce with early access and
exposure
USDA Outlook Forum – February 24, 2017
Child Nutrition Programs

Thank you for the opportunity!