the western balkans revving up the engines of growth …documents.worldbank.org/curated/en/... ·...
TRANSCRIPT

REVVING UP THE ENGINESOF GROWTH AND PROSPERITY
THE WESTERN BALKANS
OVERVIEW
Pub
lic D
iscl
osur
e A
utho
rized
Pub
lic D
iscl
osur
e A
utho
rized
Pub
lic D
iscl
osur
e A
utho
rized
Pub
lic D
iscl
osur
e A
utho
rized

The team was led by Ekaterina Vostroknutova and Trang Van Nguyen, and included Ashley Taylor, Jennifer Keller, Monica Robayo, Kazi Matin, Bojan Shimbov, Olasupo Olusi, Michelle Tejada, Suzana Petrovic, Georgia Harley, Sandra Hlivnjak, Alena Kantarovich, Johanna Jaeger, and John Burgess. Inputs from Lazar Sestovic, Sanja Madzarevic-Sujster, Dusko Vasiljevic, Hilda Shijaku, Agim Demukaj, Barbara Cunha, and other team members working on the Western Balkans are appreciated. The team is grateful for comments, at different stages of the report’s preparation, from Ron Hood, Andrew Dabalen, Edgardo Favaro, Jorge Araujo, Gonzalo Varela, Lada Strelkova, Maria Davalos, Cesar Cancho, Alexandru Cojocaru, Johannes Koettl, Timothy Johnston, Josefina Posadas, Zahid Hasnain, Tony Verheijen, Raymond Muhula, Srdjan Svircev, and Jonas Arp Fallov. Administrative support from Mismake Galatis is appreciated. The team was guided by Ellen Goldstein, Linda Van Gelder, Gallina Vincelette, Ivailo Izvorski, Luis-Felipe Lopez-Calva, Carolina Sanchez-Paramo, and John Panzer.
© 2017 International Bank for Reconstruction and Development / The World Bank1818 H Street NWWashington DC 20433Telephone: 202-473-1000Internet: www.worldbank.org This work is a product of the staff of The World Bank with external contributions. The findings, interpretations, and conclusions expressed in this work do not necessarily reflect the views of The World Bank, its Board of Executive Directors, or the governments they represent.The World Bank does not guarantee the accuracy of the data included in this work. The boundaries, colors, denominations, and other information shown on any map in this work do not imply any judgment on the part of The World Bank concerning the legal status of any territory or the endorsement or acceptance of such boundaries. Rights and PermissionsThe material in this work is subject to copyright. Because The World Bank encourages dissemination of its knowledge, this work may be reproduced, in whole or in part, for noncommercial purposes as long as full attribution to this work is given.Any queries on rights and licenses, including subsidiary rights, should be addressed to World Bank Publications, The World Bank Group, 1818 H Street NW, Washington, DC 20433, USA; fax: 202-522-2625; e-mail: [email protected]. Cover photo credit: Leon Bijedic, Bosnia and Herzegovina. Design: Florencia Micheltorena and Artem Kolesnikov (cover).
Contents
Introduction 3
Growth and global integration were stalled by the global financial crisis 9
Pre-crisis convergence with EU living standards faltered, calling for a new growth model 17
Increasing the welfare of all citizens will require more people to have jobs 23
Labor market barriers discourage employment and fuel emigration 29
Western Balkan economies have major potential to improve their productivity 35
With reforms, the state can help build a new growth model and deliver better services 41
Postscript 47

3Revving Up the Engines of Growth and Prosperity
introduCtion
The Yugo, a communist-era car from the former Yugoslavia, was widely ridiculed for shedding its parts on roads across Europe and the United States. Zastava, which made Yugo, fared even worse than its product. After the Balkan conflicts of the 1990s, the factory was reduced to producing only 18,000 cars in 2002. Then Fiat entered the picture in 2008, investing more than a billion euro to make Zastava one of its most modern factories anywhere in the world. Now it is producing more than 100,000 cars a year and exporting to the European Union and the United States. Bosch and more than forty other international companies have set up operations in Serbia to supply parts to this factory and to other car producers in Europe; domestic investors also started entering the sector. Exports of the Serbian automotive industry have increased almost tenfold since
the 1990s and are likely to expand further with recovery of European and global growth.1
Serbia’s emergence as a successful exporter of competitive cars and parts is a symbol of a new era for the six countries of the Western Balkans: Albania, Bosnia and Herzegovina, Kosovo, the Former Yugoslav Republic (FYR) of Macedonia, Montenegro, and Serbia. As late reformers, they can benefit from rising wages in the rapidly reforming transition countries of
1 This report uses official data available as of September 2016. This report draws on World Bank (2015) Albania: Systematic Country Diagnostic; World Bank (2015) Rebalancing Bosnia and Herzegovina: A Systematic Country Diagnostic; World Bank (2016) Republic of Kosovo: Systematic Country Diagnostic; World Bank (2016) Montenegro Systematic Country Diagnostic: Achieving Sustainable and Inclusive Growth amidst High Volatility; World Bank (2015) Serbia’s Potential for Sustainable Growth and Shared Prosperity: Systematic Country Diagnostic.

4 Revving Up the Engines of Growth and Prosperity
the European Union and from greater cost-consciousness among firms adapting to lower global growth. The six (of which all but Albania were born from the break-up of Yugoslavia) largely missed out on earlier opportunities to thrive in the post-Cold War era. Today, with peace and enhanced collaboration, coupled with future prospects of European Union membership, the Western Balkan countries have another opportunity to build prosperity.
This report addresses the following question: How can these countries raise economic growth rates and ensure sustained improvement in welfare for their citizens? Finding the right answer will help the countries’ aspiration for income convergence with the EU, where on average people enjoy incomes that are three times higher.
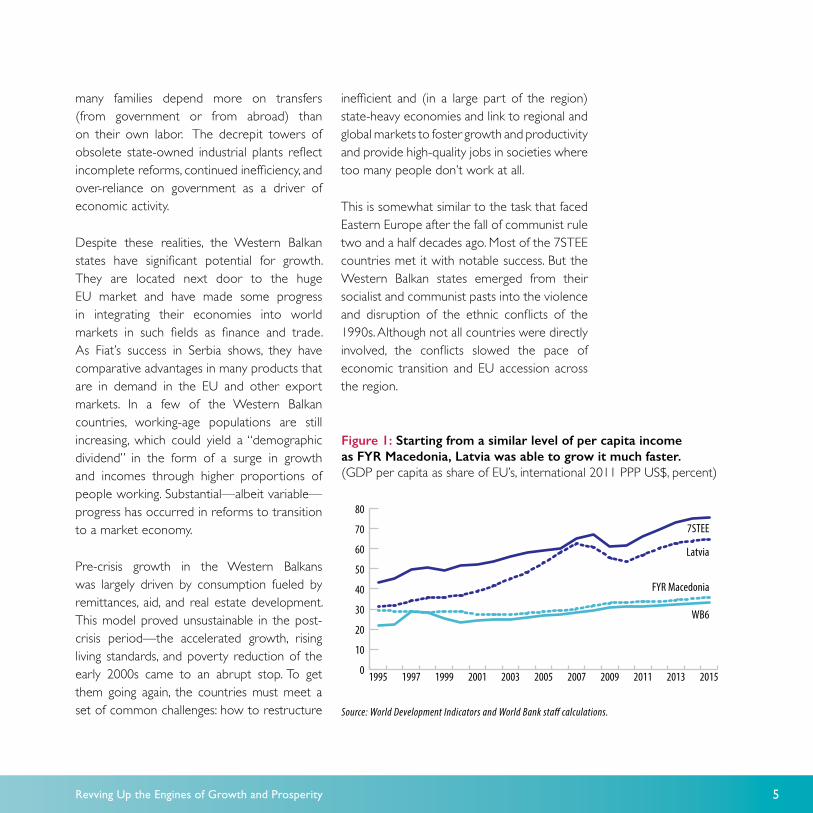
The six Western Balkan countries (WB6)—they are also called the SEE6, for the South East Europe Six—have already achieved strong growth and poverty reduction. The 1995-2015 period saw living standards increase (from a low base) almost six-fold in Bosnia and Herzegovina, nearly triple in Albania, and almost double in Serbia. But some of the neighboring countries did better. This report seeks to catalogue the reasons, as well as outline broad priorities for the future, using for illustration the comparison to the “seven small transition economies of Europe” (the “7STEE” group) that have entered the EU (Bulgaria, Croatia, Estonia, Latvia, Lithuania, Slovak Republic, and Slovenia).
Dramatic differences in growth trends and in convergence to higher income levels are notable in the region before and after the global financial crisis. At a 5.6 percent average during 2000-08, living standards in the WB6 were rising faster than world and EU averages, lagging only slightly behind the 7STEE. The growth also helped drive down poverty in most of the Western Balkan countries. In the early 2000s, roughly one in three people in the region lived on less than $5 per day. In 2008, only about one in five did. High structural unemployment, a legacy of Yugoslavia, improved somewhat during this period. Moreover, the Human Development Index—which aggregates key dimensions of human development such as a long and healthy life, being knowledgeable, and having a decent standard of living—increased over this same period in the Western Balkans and is higher than in other countries with similar income.
After the global crisis in 2008, growth slowed precipitously, although it remained higher than the average in Europe. Unemployment has remained persistently high: in 2015, seven years after the start of the global financial crisis, it ranged between 17 and 33 percent, with youth unemployment almost double the average. Today, the six countries remain among the poorest in Europe, with lower standards of living on display in everyday life. The large numbers of people who pass their days in cafes and public squares give evidence of chronic high unemployment and inactivity. For income,
5Revving Up the Engines of Growth and Prosperity
many families depend more on transfers (from government or from abroad) than on their own labor. The decrepit towers of obsolete state-owned industrial plants reflect incomplete reforms, continued inefficiency, and over-reliance on government as a driver of economic activity.
Despite these realities, the Western Balkan states have significant potential for growth. They are located next door to the huge EU market and have made some progress in integrating their economies into world markets in such fields as finance and trade. As Fiat’s success in Serbia shows, they have comparative advantages in many products that are in demand in the EU and other export markets. In a few of the Western Balkan countries, working-age populations are still increasing, which could yield a “demographic dividend” in the form of a surge in growth and incomes through higher proportions of people working. Substantial—albeit variable—progress has occurred in reforms to transition to a market economy.
Pre-crisis growth in the Western Balkans was largely driven by consumption fueled by remittances, aid, and real estate development. This model proved unsustainable in the post-crisis period—the accelerated growth, rising living standards, and poverty reduction of the early 2000s came to an abrupt stop. To get them going again, the countries must meet a set of common challenges: how to restructure
inefficient and (in a large part of the region) state-heavy economies and link to regional and global markets to foster growth and productivity and provide high-quality jobs in societies where too many people don’t work at all.
This is somewhat similar to the task that faced Eastern Europe after the fall of communist rule two and a half decades ago. Most of the 7STEE countries met it with notable success. But the Western Balkan states emerged from their socialist and communist pasts into the violence and disruption of the ethnic conflicts of the 1990s. Although not all countries were directly involved, the conflicts slowed the pace of economic transition and EU accession across the region.
Figure 1: Starting from a similar level of per capita income as FYR Macedonia, Latvia was able to grow it much faster.(GDP per capita as share of EU’s, international 2011 PPP US$, percent)
Source: World Development Indicators and World Bank sta� calculations.
201520132011200920072005200320011999199719950
10
20
30
40
50
60
70
80
WB6
FYR Macedonia
Latvia
7STEE

6 Revving Up the Engines of Growth and Prosperity
The experience of Eastern European transition economies that were early reformers can be instructive for the Western Balkan countries today. To varying degrees, their convergence of per capita income was accompanied by convergence in functioning of markets and institutions to those of their western neighbors. As a result, though some of them started from similar income per capita as the Western Balkans, they achieved solid growth in income and employment through rapid gains in investment, exports, and productivity (see Figure 1 for GDP per capita). This was made possible by prudent macroeconomic management and strong reforms that fostered integration with the world economy. For example, like other successful transition economies, Latvia was able to combine the inflow of technology and capital with its corps of capable workers by adopting market policies and institutions. Slovakia, a relative latecomer to transition, managed to catch up on market reforms and achieve high growth rates, partly thanks to connection to the supply chain of the global automotive industry.
For the Western Balkans, likewise, the potential for raising productivity through further integration with Europe and the rest of the world is large. For now, aggregate labor productivity in the region is just half of that in successful transition countries of Eastern Europe and a fraction of that in Western Europe. A large share of workers (about 25 percent on average and over 40 percent in
Albania) are in low-productivity agriculture and informal employment, allowing for easy productivity gains by reallocating labor. Current export industries use relatively low skills and technology, meaning ample room exists to raise export growth by upgrading the products sold abroad. Only three of the six countries are WTO members. While a slower global economy complicates the task of increasing exports, it also creates opportunities because international firms that have markets, technology, and capital are looking even more carefully to relocate to improve their competitiveness or find new niches.
The Western Balkan countries need to act quickly to exploit these potentials. The challenges posed by the aging of their populations add fur ther urgency. The prolonged period of sluggish reforms, political uncer tainty, and slow convergence in living standards has left citizens dissatisfied with government. They are increasingly asking for deeper reforms which would also serve to accelerate the EU accession process. The prospect of EU membership continues to provide the strongest anchor for reform, but implementation has been slow. Levels of emigration from the Western Balkans are high as young and educated people look for oppor tunities elsewhere. The authorities understand the need to create oppor tunities at home for the poor and for the middle class in order to broadly improve living standards.
7Revving Up the Engines of Growth and Prosperity
In the absence of vigorous reform, the region faces a vicious cycle of high emigration, limited reforms, and below-potential growth, which will further stimulate emigration of the best and brightest youth. The Western Balkan countries must make it easier for enterprises to grow and reach new markets. This will require reducing and modifying the role of the state from a direct driver of economic activity to a provider of effective policies, regulatory frameworks, governing institutions, and essential public goods. Improving the business climate would facilitate firm entry and exit and the reallocation of factors of production to the most productive activities. Combined with improved macroeconomic stability, this would also help growth through increased returns and
more diversified opportunities for investment. Reducing the regulatory burden and improving the logistics and trade infrastructure would increase competitiveness and help domestic firms upgrade and expand exports. In this process, making better use of labor and human capital by enhancing relevant skills and bringing more people into the workforce will be key. Countries will need to address disincentives for work and barriers to employment that exist in their labor, tax, and social protection systems, and support acquisition of the skills that workers will need for new jobs created. The countries must create a social services system that achieves the goal of protecting the vulnerable without hindering productivity or discouraging work.

8 Revving Up the Engines of Growth and Prosperity

9Revving Up the Engines of Growth and Prosperity
The Western Balkans economies grew faster than the world average before the global financial crisis, and—even as growth slowed in its aftermath—have remained among the best performers in Europe. Before the global crisis, the countries were expanding on average by 5.6 percent per year, only 0.3 percentage points lower than the 7STEE. But after the crisis, the Western Balkans slowed to 2.4 percent a year. That was considerably behind emerging market economies in other parts of the world but still faster than their harder-hit transition neighbors in Europe (Figure 2).
Large capital inflows before the global crisis financed consumption-driven growth. The strong pre-crisis growth was driven by domestic demand—predominantly private and public consumption. This was accompanied by high rates of import growth that resulted in unsustainably large current account deficits,
despite strong export performance; external debt also surged. When capital inflows fell precipitously, domestic demand declined as well, leading to a contraction of imports and a reduction in external deficits. Since most capital
Growth and Global inteGration were stalled by the Global finanCial Crisis
Figure 2: GDP growth in the Western Balkans fell by more than half after the global crisis. (GDP growth rate, percent per annum)
2000-08
Median GDP growth
6.0 5.9 5.6 4.93.8
2.24.7 4.6
2.7 2.4 1.6 1.3
2009-15
Source: World Development Indicators, Eurostat, national authorities and World Bank sta� calculations.
-12
-8
-4
0
4
8
12
5.6 4.93.8
2.24.7 4.6
2.7 2.4 1.6 1.3
7STEEEUWB6WorldEAPUMCEUWorldEAPWB67STEEUMC
10 Revving Up the Engines of Growth and Prosperity
inflows went into non-tradable sectors, they did little to expand the economy’s capacity to grow sustainably in the long run and service its external debt.
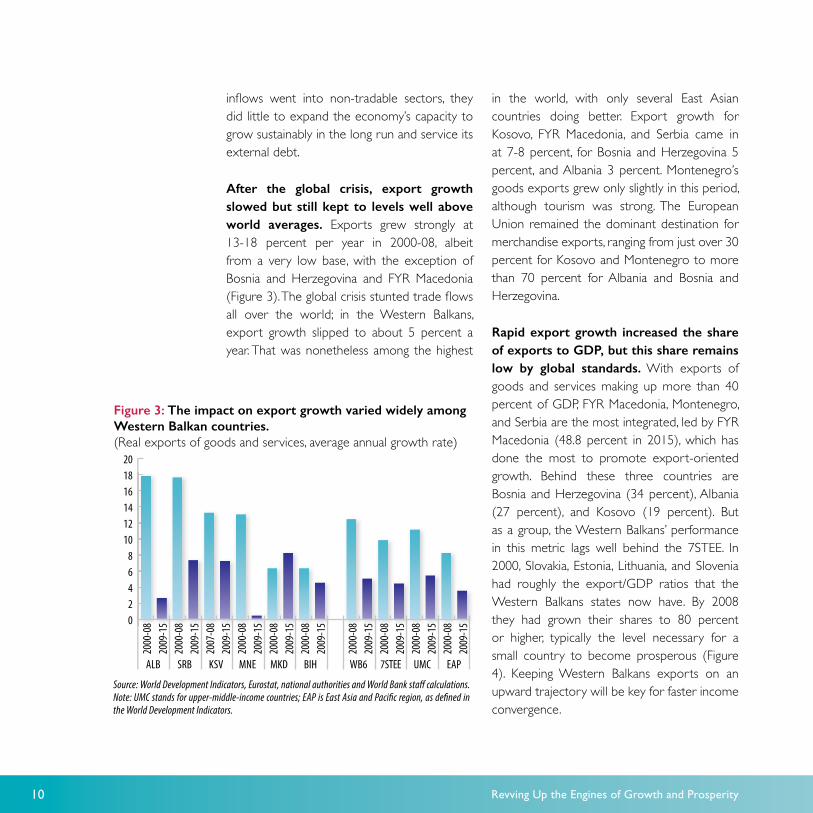
After the global crisis, export growth slowed but still kept to levels well above world averages. Exports grew strongly at 13-18 percent per year in 2000-08, albeit from a very low base, with the exception of Bosnia and Herzegovina and FYR Macedonia (Figure 3). The global crisis stunted trade flows all over the world; in the Western Balkans, export growth slipped to about 5 percent a year. That was nonetheless among the highest
in the world, with only several East Asian countries doing better. Export growth for Kosovo, FYR Macedonia, and Serbia came in at 7-8 percent, for Bosnia and Herzegovina 5 percent, and Albania 3 percent. Montenegro’s goods exports grew only slightly in this period, although tourism was strong. The European Union remained the dominant destination for merchandise exports, ranging from just over 30 percent for Kosovo and Montenegro to more than 70 percent for Albania and Bosnia and Herzegovina.
Rapid export growth increased the share of exports to GDP, but this share remains low by global standards. With exports of goods and services making up more than 40 percent of GDP, FYR Macedonia, Montenegro, and Serbia are the most integrated, led by FYR Macedonia (48.8 percent in 2015), which has done the most to promote export-oriented growth. Behind these three countries are Bosnia and Herzegovina (34 percent), Albania (27 percent), and Kosovo (19 percent). But as a group, the Western Balkans’ performance in this metric lags well behind the 7STEE. In 2000, Slovakia, Estonia, Lithuania, and Slovenia had roughly the export/GDP ratios that the Western Balkans states now have. By 2008 they had grown their shares to 80 percent or higher, typically the level necessary for a small country to become prosperous (Figure 4). Keeping Western Balkans exports on an upward trajectory will be key for faster income convergence.
02468
101214161820
Figure 3: The impact on export growth varied widely among Western Balkan countries.(Real exports of goods and services, average annual growth rate)
Source: World Development Indicators, Eurostat, national authorities and World Bank sta� calculations.Note: UMC stands for upper-middle-income countries; EAP is East Asia and Paci c region, as de ned in the World Development Indicators.
2009
-15
2000
-08
2009
-15
2000
-08
2009
-15
2000
-08
2009
-15
2000
-08
2009
-15
2000
-08
2009
-15
2000
-08
2009
-15
2000
-08
2009
-15
2007
-08
2009
-15
2000
-08
2009
-15
2000
-08
ALB SRB KSV MNE MKD BIH WB6 7STEE UMC EAP

11Revving Up the Engines of Growth and Prosperity
The Western Balkans countries have more than doubled their share of exports to the EU since 2005, as they became more deeply integrated into global value chains and upgraded the technology of their exports. The increase in EU market share came from a low base, but was an important step in the ladder of technological upgrading and participation in production networks. The rise was partly due to strong performance in the parts and components trade, a key indicator of global value chains participation (Figure 5). A catching up in the medium-skill segment was another sign of integration into value chains at a technologically sophisticated level. The result was a general upgrading of the composition of exports, with potentially high benefits for the regional economy as a whole: sophistication of exported goods of medium-skill technology intensity has nearly tripled since 2001 (Figure 6). This was mostly driven by the more manufacturing-oriented countries of Bosnia and Herzegovina, FYR Macedonia, and Serbia.
Within manufactured exports, considerable upgrading has occurred. Since 2008, the region on average has moved towards a larger share of medium- and high-skill products as well as technology-intensive ones, although Albania and Kosovo have barely registered in that upgrading. Serbia and FYR Macedonia raised their share in this category to 60-70 percent of manufactured exports and Bosnia and Herzegovina to about 40 percent. This is due
in part to their rising participation in European value chains, as manifest in the expanding share of parts and components in machinery and transport exports. Still, the room for further gains in this field is large: FYR Macedonia’s exports still have a high import content, and Serbia is only starting to build backward linkages in its economy.
Future progress will hinge on exploiting countries’ comparative advantages. Bosnia and Herzegovina, FYR Macedonia, and Serbia have achieved strong growth in machinery and transport, as well as in labor-intensive manufactured products such as garments and footwear. Albania, Kosovo, and Montenegro
6 7 8 9 10 11 120
20
40
60
80
100
120
7STEE - 2000 7STEE - 2015
SVK
ESTSVN
LTUBGRLVA
HRVMNE
MNEMKD
MKD
SRB
SRB
BIHBIHALBALB
KSVKSV
Log of GDP per capita (PPP, current international $)
WB6 - 2000 WB6 - 2015All countries - 2015
Figure 4: The region has significant potential for further growth in exports. (Exports of goods and services, percent of GDP)
Source: World Development Indicators, Eurostat, national authorities, and World Bank sta� calculations.

12 Revving Up the Engines of Growth and Prosperity
have achieved relatively little growth in machinery and transport; most of their gains were in metals, minerals, garments, and footwear. Metals have considerable potential for earning a larger share of downstream highly-differentiated products. Albania, Bosnia and Herzegovina, FYR Macedonia, and Serbia could also upgrade in agriculture by shifting from primary agricultural exports to higher-value processed exports. Similarly, in services, the scope for expanding higher-value tourism and modern services exports remains considerable.
Financial integration has gone deeper than trade integration, helping to support the rise of the private sector. For the past two decades, major EU banks have invested substantially in the Western Balkans and now own between two-thirds and four-fifths of banking assets in individual countries. They have brought in new technology and better banking and management practices, increasing efficiency. They have expanded arms-length banking, helping substantially reduce traditional links between the banking system and state-owned enterprises. Newer technologies have
World
Source: UN Comtrade and sta� calculations based on B. Shimbov, M. Alguacil, and C. Suarez (2013). “Fragmentation and parts and components trade in the Western Balkan countries.” Post-Communist Economies, 25:3, 371-391.
Source: B. Shimbov, M. Alguacil, and C. Suarez (2016). “International Production Networks and Economic Growth: The Case of the Western Balkan Countries.” Eastern European Economics, 54:1, 49-70. Note: EXPY is a measure of sophistication of a country’s export basket following R. Hausmann, J. Hwang, and D. Rodrik (2007). “What you export matters.” Journal of Economic Growth, 12(1): 1-25.
0
5
10
15
20
25
30
35
2009-152000-08 201520132011200920072005200320011999199719950
1000
2000
3000
4000
5000
6000
7000
8000
7STEE High-income countries WB6WB6
Figure 5: Parts and components trade grew faster than in other countries.(Average annual growth rates of parts and components imports and exports, percent)
Figure 6: Medium-skill and technology goods are catching up to EU standards of sophistication.(Evolution of EXPY in manufacturing for medium-skill technology intensity, index)
13Revving Up the Engines of Growth and Prosperity
strengthened the infrastructure underpinning the banking system. Not only did firms get better access to loans but households did too, resulting in expanding credit.
Financial integration created new sources for funding beyond traditional national savings, but resulting capital inflows fueled the consumption-based model of growth. The large foreign direct investment into banking and other sectors, as well as cross-border funds inflows, supported higher investment and consumption and thus higher domestic demand. This in turn fueled
more growth than would otherwise have been possible. Similarly, trade integration that followed domestic liberalization and freer access to EU and Central European Free Trade Agreement markets accelerated exports and employment. But high volumes of funds arriving from abroad also created vulnerabilities in the banking system. This money generally went to finance excessive consumption or investment in non-tradable sectors such as real estate, in particular in Montenegro. As a result, growth created by this consumption-based model was not sustainable during and after the crisis.
0
5
10
15
20
25
30
20152014201320122007
SRB MNE MKD KSV BIH ALB
0%
20%
40%
60%
80%
100%
SRBMKDMNEKOSBIHALB
Foreign liabilities Capital and reserves OtherHousehold deposits Corporate deposits Government deposits
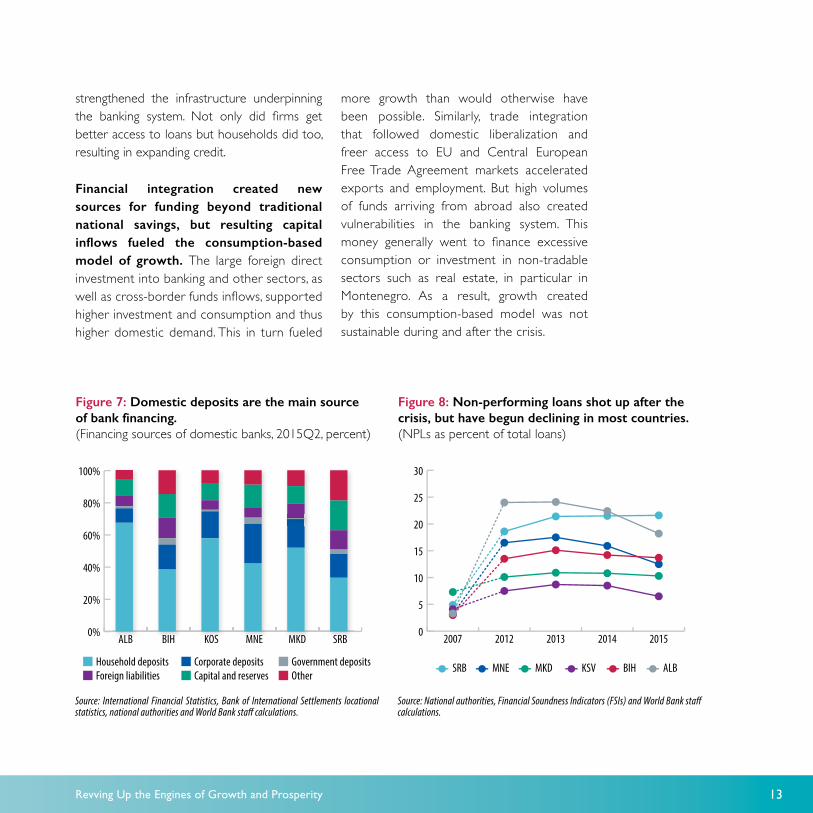
Figure 7: Domestic deposits are the main source of bank financing.(Financing sources of domestic banks, 2015Q2, percent)
Source: International Financial Statistics, Bank of International Settlements locational statistics, national authorities and World Bank sta� calculations.
Figure 8: Non-performing loans shot up after the crisis, but have begun declining in most countries.(NPLs as percent of total loans)
Source: National authorities, Financial Soundness Indicators (FSIs) and World Bank sta� calculations.

14 Revving Up the Engines of Growth and Prosperity
Deeper financial sectors are needed to support more private-sector and export-driven growth in the future. As foreign banks deleveraged after the global crisis, domestic deposits increasingly became the key source of financing for domestic banks (Figure 7). Loan-to-deposit ratios fell. This reduced vulnerability to external shocks, but the depth of the financial sector, measured by private sector credit to GDP, remained somewhat subdued, at an average 45 percent, with lower levels in Kosovo and Albania. Almost a decade
after the global financial crisis, non-performing loans in 2015 comprised 18-22 percent of the total in Albania and Serbia, 10-14 percent in FYR Macedonia, Montenegro, and Bosnia and Herzegovina, and about 6 percent in Kosovo (Figure 8). This burdens balance sheets, reduces profits, and suppresses lending, which remains banks’ main activity, accounting for almost two thirds of total banking sector assets in the region. The non-banking sector has barely developed; deeper financial sector reform is needed to develop capital markets.

15Revving Up the Engines of Growth and Prosperity
16 Revving Up the Engines of Growth and Prosperity

17Revving Up the Engines of Growth and Prosperity
Pre-Crisis ConverGenCe with eu livinG standards faltered, CallinG for a new Growth model
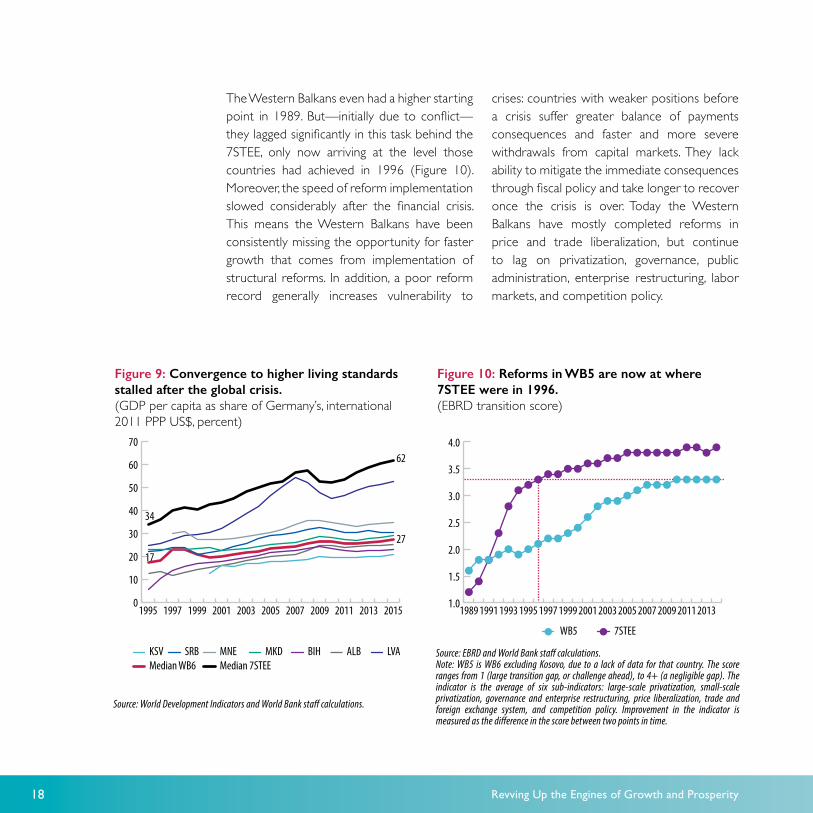
High growth rates before the global crisis accelerated the catch-up to EU living standards, which nevertheless was slower than that of the transition economies already in the EU. Measured as income per capita in terms of purchasing power parity, the region’s living standards increased from 19 percent of Germany’s level in 2000 to 25 percent in 2008, a catch-up of 0.8 percentage points of relative GDP per year (Figure 9). This was the highest speed for the Western Balkans ever, compared to the average of 0.4 percentage points per year over the 1995-2015 period. But other countries did even better. The 7STEE countries consistently caught up by a whole percentage point faster per year than the Western Balkans, resulting in an increase of their relative living standards from 42 percent of Germany’s in 2000 to 57 percent in 2008, a 15 percentage point catch-up in just eight years.
But after the crisis, convergence stopped. Had the trends of the early 2000s continued after the crisis, the Western Balkans would have doubled their 1995 living standards to over 30 percent of Germany’s by 2015. But instead, they stagnated at around 26 percent between 2009 and 2015 (Figure 9). The 7STEE, on the other hand, continued to converge even after the crisis, albeit at a lower speed (0.6 percentage points per year after 2008, compared to 1.9 points a year in 2000-08).
Lagging reforms are one reason for the convergence gap with the European transition countries. The Western Balkans and the 7STEE began their reforms at approximately the same time with the break-up of the Soviet Union and Yugoslavia, aiming to transform their planned public sector-driven economies into open market models.
18 Revving Up the Engines of Growth and Prosperity
WB5
Source: World Development Indicators and World Bank sta� calculations.
Source: EBRD and World Bank sta� calculations. Note: WB5 is WB6 excluding Kosovo, due to a lack of data for that country. The score ranges from 1 (large transition gap, or challenge ahead), to 4+ (a negligible gap). The indicator is the average of six sub-indicators: large-scale privatization, small-scale privatization, governance and enterprise restructuring, price liberalization, trade and foreign exchange system, and competition policy. Improvement in the indicator is measured as the di�erence in the score between two points in time.
1.0
1.5
2.0
2.5
3.0
3.5
4.0
2013201120092007200520032001199919971995199319911989201520132011200920072005200320011999199719950
10
20
30
40
50
60
70
7STEE
KSV MNESRBMedian WB6 Median 7STEE
MKD BIH ALB LVA
62
34
17
27
Figure 9: Convergence to higher living standards stalled after the global crisis.(GDP per capita as share of Germany’s, international 2011 PPP US$, percent)
Figure 10: Reforms in WB5 are now at where 7STEE were in 1996.(EBRD transition score)
The Western Balkans even had a higher starting point in 1989. But—initially due to conflict—they lagged significantly in this task behind the 7STEE, only now arriving at the level those countries had achieved in 1996 (Figure 10). Moreover, the speed of reform implementation slowed considerably after the financial crisis. This means the Western Balkans have been consistently missing the opportunity for faster growth that comes from implementation of structural reforms. In addition, a poor reform record generally increases vulnerability to
crises: countries with weaker positions before a crisis suffer greater balance of payments consequences and faster and more severe withdrawals from capital markets. They lack ability to mitigate the immediate consequences through fiscal policy and take longer to recover once the crisis is over. Today the Western Balkans have mostly completed reforms in price and trade liberalization, but continue to lag on privatization, governance, public administration, enterprise restructuring, labor markets, and competition policy.
19Revving Up the Engines of Growth and Prosperity
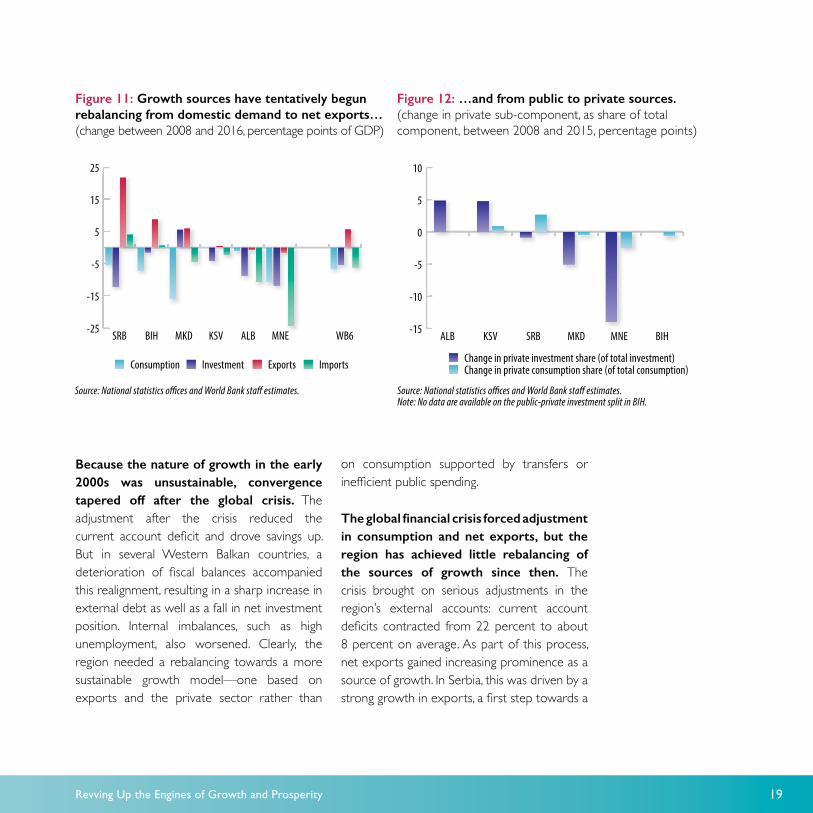
Because the nature of growth in the early 2000s was unsustainable, convergence tapered off after the global crisis. The adjustment after the crisis reduced the current account deficit and drove savings up. But in several Western Balkan countries, a deterioration of fiscal balances accompanied this realignment, resulting in a sharp increase in external debt as well as a fall in net investment position. Internal imbalances, such as high unemployment, also worsened. Clearly, the region needed a rebalancing towards a more sustainable growth model—one based on exports and the private sector rather than
on consumption supported by transfers or inefficient public spending.
The global financial crisis forced adjustment in consumption and net exports, but the region has achieved little rebalancing of the sources of growth since then. The crisis brought on serious adjustments in the region’s external accounts: current account deficits contracted from 22 percent to about 8 percent on average. As part of this process, net exports gained increasing prominence as a source of growth. In Serbia, this was driven by a strong growth in exports, a first step towards a
Consumption
-15
-10
-5
0
5
10
BIHMNEMKDSRBKSVALB-25
-15
-5
5
15
25
WB6MNEALBKSVMKDBIHSRB
Investment Exports Imports Change in private investment share (of total investment)Change in private consumption share (of total consumption)
Figure 11: Growth sources have tentatively begun rebalancing from domestic demand to net exports…(change between 2008 and 2016, percentage points of GDP)
Figure 12: …and from public to private sources.(change in private sub-component, as share of total component, between 2008 and 2015, percentage points)
Source: National statistics o�ces and World Bank sta� estimates. Source: National statistics o�ces and World Bank sta� estimates.Note: No data are available on the public-private investment split in BIH.
20 Revving Up the Engines of Growth and Prosperity
more sustainable model of growth. But in other countries, such as Montenegro, adjustment of the external account was due mostly to sharp contraction of imports (Figure 11). The dynamic between public and private sources of growth was even more mixed (Figure 12).
To ensure sustained expansion, a true rebalancing of growth sources is vital—from consumption to investment, from domestic demand to international, from public to private sector. Given the countries’ level of income, consumption will likely continue to play a strong role, as happens in other transition or emerging market economies. The Western Balkan
states’ exports to GDP ratio would have to double to come up to the healthier level of the transition economies. The Western Balkan countries’ current account deficits are also wider than in those countries. Their average investment ratios, running the range from 18 percent of GDP in Bosnia and Herzegovina to 28 percent in Albania in 2009-15, are solid, but still lower on average than the 25 percent minimum that the World Bank Growth Commission recommends for sustained high growth. Given constrained fiscal space, public investment will grow slowly, making it imperative that the private sector (including through FDI) play a bigger role in investing in the region’s economies.

21Revving Up the Engines of Growth and Prosperity

22 Revving Up the Engines of Growth and Prosperity
23Revving Up the Engines of Growth and Prosperity
Figure 13: Low labor force participation rates…(Labor force participation rate, percent of population aged 15+, 2015, national estimates)
Figure 14: …compound high unemployment rates.(Unemployment rate, percent of the labor force, 2015, national estimates)
Source: World Development Indicators, Labor Force Surveys and World Bank sta� calculations.Note: De�nition of labor force may di�er by country.
Source: World Development Indicators, Labor Force Surveys and World Bank sta� calculations.Note: De�nition of unemployment may di�er by country.
0
20
40
60
80
KosovoBIHMENA
WB6Serbia
SAS
Montenegro
FYR Macedonia
Albania7STEE
ECA LAC
EAP SSA
KosovoBIH
FYR MacedoniaWB6
Serbia
MontenegroAlbania
7STEEMENAECASSALACSASEAP
0
10
20
30
40
oHia6iaoiaEENACASAACASAP
inCreasinG the welfare of all Citizens will require more PeoPle to have jobs
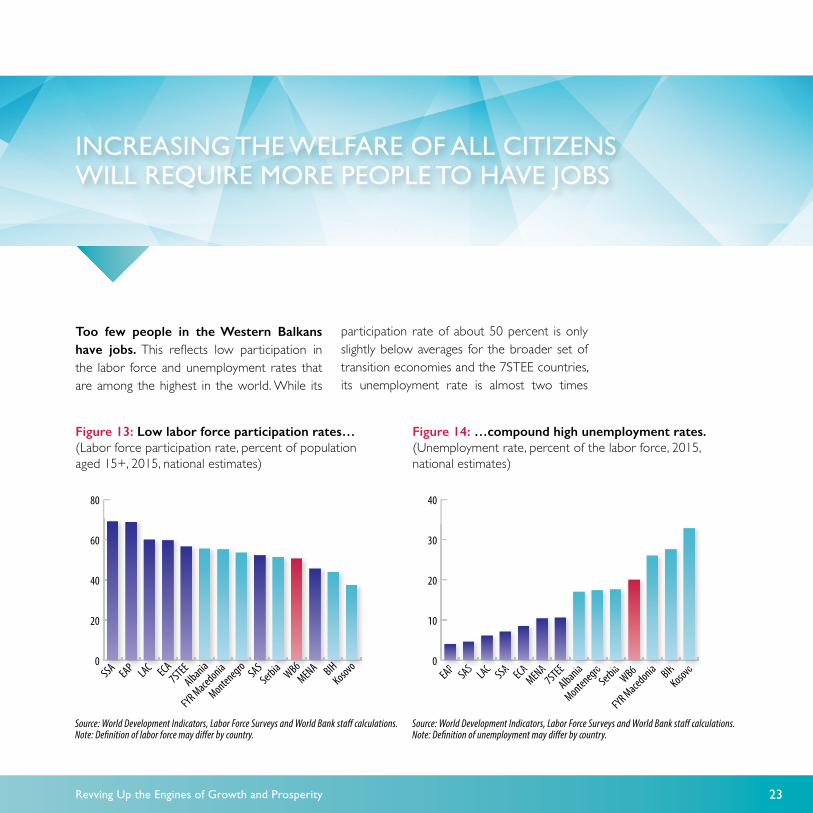
Too few people in the Western Balkans have jobs. This reflects low participation in the labor force and unemployment rates that are among the highest in the world. While its
participation rate of about 50 percent is only slightly below averages for the broader set of transition economies and the 7STEE countries, its unemployment rate is almost two times
24 Revving Up the Engines of Growth and Prosperity
Source: World Development Indicators.
0
5
10
15
20
25
30
SRBMNEMKDKSVBIHALB
20152000
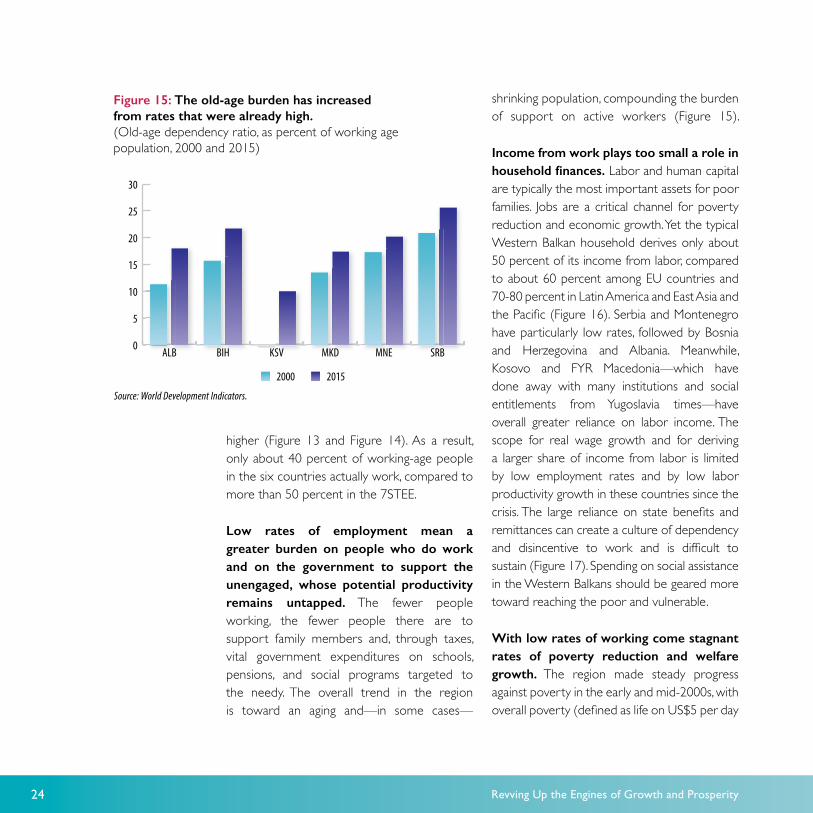
Figure 15: The old-age burden has increased from rates that were already high. (Old-age dependency ratio, as percent of working age population, 2000 and 2015)
higher (Figure 13 and Figure 14). As a result, only about 40 percent of working-age people in the six countries actually work, compared to more than 50 percent in the 7STEE.
Low rates of employment mean a greater burden on people who do work and on the government to support the unengaged, whose potential productivity remains untapped. The fewer people working, the fewer people there are to support family members and, through taxes, vital government expenditures on schools, pensions, and social programs targeted to the needy. The overall trend in the region is toward an aging and—in some cases—
shrinking population, compounding the burden of support on active workers (Figure 15).
Income from work plays too small a role in household finances. Labor and human capital are typically the most important assets for poor families. Jobs are a critical channel for poverty reduction and economic growth. Yet the typical Western Balkan household derives only about 50 percent of its income from labor, compared to about 60 percent among EU countries and 70-80 percent in Latin America and East Asia and the Pacific (Figure 16). Serbia and Montenegro have particularly low rates, followed by Bosnia and Herzegovina and Albania. Meanwhile, Kosovo and FYR Macedonia—which have done away with many institutions and social entitlements from Yugoslavia times—have overall greater reliance on labor income. The scope for real wage growth and for deriving a larger share of income from labor is limited by low employment rates and by low labor productivity growth in these countries since the crisis. The large reliance on state benefits and remittances can create a culture of dependency and disincentive to work and is difficult to sustain (Figure 17). Spending on social assistance in the Western Balkans should be geared more toward reaching the poor and vulnerable.
With low rates of working come stagnant rates of poverty reduction and welfare growth. The region made steady progress against poverty in the early and mid-2000s, with overall poverty (defined as life on US$5 per day

25Revving Up the Engines of Growth and Prosperity
Source: EU Surveys of Income and Living Conditions 2012, Household Budget Survey 2010-2013, LAC data lab, and World Bank 2014 “East Asia Paci�c at Work.” Note: Selected countries for LAC and EAP.
Source: World Bank sta� estimates based on the harmonized Europe and Central Asia poverty dataset (ECAPOV). Note: B40 refers to the bottom 40 percent of the income/consumption distribution.
0
20
40
60
80
100
ALLB40ALLB40ALLB40ALLB40ALLB40ALLB400
10
20
30
40
50
60
70
80
90
EAPLACWB6KSVMKDALBBIHMNESRB
labor income pension social assistance remittances other
Figure 16: Labor income makes up a low share of household income in the Western Balkans…(Most recent year available, percent)
Figure 17: ...while reliance on transfers is high.(Western Balkans household income, by source, percent)
ALB 2012 BIH 2011 KSV 2013 MKD 2008 SRB 2013 MNE 2014
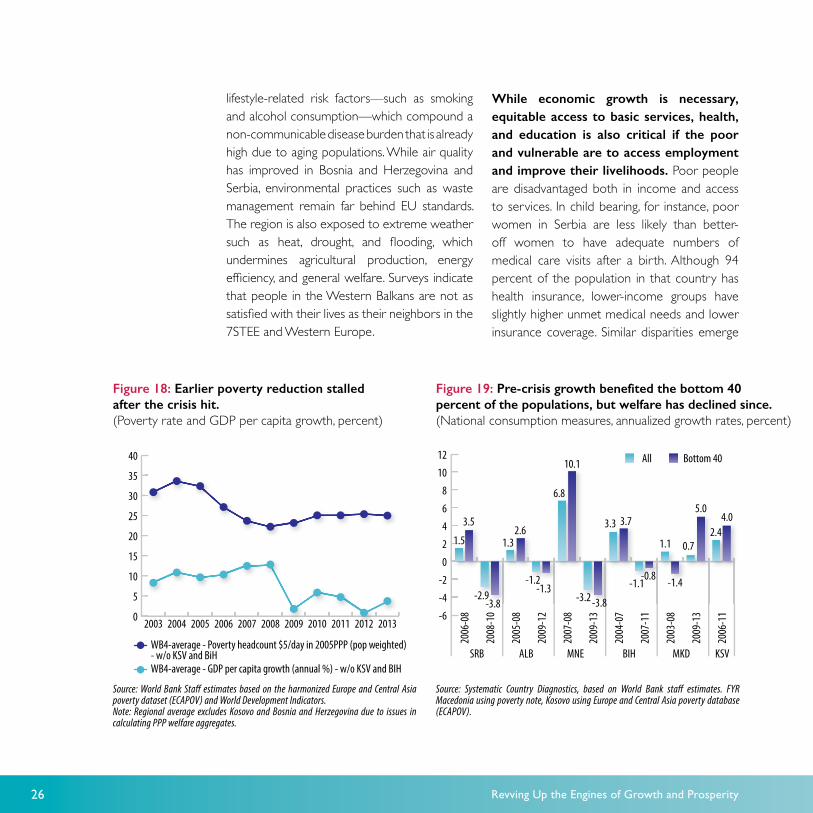
or less) heading down from about 35 percent of the population to about 25 percent (Figure 18). Economic growth generally benefitted the poor and vulnerable at a faster rate than the population at large, promoting shared prosperity and slightly narrowing income inequalities. However, that progress stalled after the global financial crisis hit in 2008. Between that year and 2013, average household consumption declined by between 5 and 17 percent in Albania, Bosnia and Herzegovina, Montenegro, and Serbia (Figure 19). Welfare of the two bottom consumption quintiles also suffered, disproportionately in Serbia and Montenegro. (Kosovo and FYR Macedonia were exceptions:
following the global financial crisis, incomes of their bottom 40 actually increased, possibly due to the early start of reforms in FYR Macedonia and the destruction of the Yugoslav institutions in Kosovo.) The region’s poverty rate has held basically constant in recent years and remains higher than in the transition economies of Eastern Europe.
The people of the Western Balkans yearn for a better quality of life. Citizens are particularly dissatisfied with job opportunities: two out of three feel that lack of jobs is the most important problem facing their economies. Other factors that harm quality of life include
26 Revving Up the Engines of Growth and Prosperity
Source: Systematic Country Diagnostics, based on World Bank sta� estimates. FYR Macedonia using poverty note, Kosovo using Europe and Central Asia poverty database (ECAPOV).
Source: World Bank Sta� estimates based on the harmonized Europe and Central Asia poverty dataset (ECAPOV) and World Development Indicators.Note: Regional average excludes Kosovo and Bosnia and Herzegovina due to issues in calculating PPP welfare aggregates.
Figure 19: Pre-crisis growth benefited the bottom 40 percent of the populations, but welfare has declined since.(National consumption measures, annualized growth rates, percent)
Figure 18: Earlier poverty reduction stalled after the crisis hit.(Poverty rate and GDP per capita growth, percent)
All
SRB ALB MNE BIH MKD KSV
-6
-4
-2
0
2
4
6
8
10
12
2006
-11
2009
-13
2003
-08
2007
-11
2004
-07
2009
-13
2007
-08
2009
-12
2005
-08
2008
-10
2006
-08
Bottom 40
1.5
3.5
-2.9-3.8
1.32.6
-1.2
6.8
10.1
3.3
-3.2 -3.8
-1.1-0.8
1.1
-1.4
0.7
5.0
2.44.03.7
-1.3
0
5
10
15
20
25
30
35
40
20132012201120102009200820072006200520042003
WB4-average - GDP per capita growth (annual %) - w/o KSV and BIH
WB4-average - Poverty headcount $5/day in 2005PPP (pop weighted) - w/o KSV and BiH
lifestyle-related risk factors—such as smoking and alcohol consumption—which compound a non-communicable disease burden that is already high due to aging populations. While air quality has improved in Bosnia and Herzegovina and Serbia, environmental practices such as waste management remain far behind EU standards. The region is also exposed to extreme weather such as heat, drought, and flooding, which undermines agricultural production, energy efficiency, and general welfare. Surveys indicate that people in the Western Balkans are not as satisfied with their lives as their neighbors in the 7STEE and Western Europe.
While economic growth is necessary, equitable access to basic services, health, and education is also critical if the poor and vulnerable are to access employment and improve their livelihoods. Poor people are disadvantaged both in income and access to services. In child bearing, for instance, poor women in Serbia are less likely than better-off women to have adequate numbers of medical care visits after a birth. Although 94 percent of the population in that country has health insurance, lower-income groups have slightly higher unmet medical needs and lower insurance coverage. Similar disparities emerge

27Revving Up the Engines of Growth and Prosperity
Figure 20: Bottom consumption quintiles are less educated.(Share of individuals aged 15+ with at most primary education)
Top 60 percent
Source: World Bank sta� estimates based on the harmonized Europe and Central Asia poverty dataset (ECAPOV).
Figure 21: Roma and poor children in Serbia are disadvantaged in access to education.(Serbia, early child development or secondary school attendance, 2013, percent)
Source: Serbia Systematic Country Diagnostic, UNICEF Multiple Indicator Cluster Survey, 2014.
0
10
20
30
40
50
60
70
SRB 2013MNE 2014MKD 2010KSV 2014BIH 2011ALB 2012
Bottom 40 percent Early Child Development Secondary
0
20
40
60
80
100
RichestFourthMiddleSecondPoorestRoma
when comparing income groups on basic education (Figure 20 and Figure 21).
Living standards in cities are consistently higher than in the region’s rural areas. Concerning basic services such as health, education, sanitation, and electricity, access is generally high in the Western Balkan states and in line with countries of similar income levels, but it is lower in rural areas than in urban centers. In addition, delivery of basic services is inefficient: governments in the region achieve the same outcomes as countries with similar income levels, but sometimes at a much higher price.
Some of the most dramatic differences in poverty afflict the Roma minority. Poverty rates among Roma populations are estimated to be two to four times that of non-Roma living in similar neighborhoods in Western Balkan countries. Roma children in Bosnia and Herzegovina have a 10 times higher chance of malnutrition than non-Roma. In Serbia, only one in eight Roma children has a chance of receiving early childhood education (Figure 21). Disparities that begin in childhood carry over into adulthood, both in work and family life, keeping groups down generation after generation.

28 Revving Up the Engines of Growth and Prosperity
29Revving Up the Engines of Growth and Prosperity
labor market barriers disCouraGe emPloyment and fuel emiGration
With less than half of the working age population actually seeking work, and a quarter of job-seekers failing to find it, the need to reduce unemployment and inactivity is paramount. On the demand side, improving the business and labor regulatory environment would enable firms to expand their operations and create jobs. But for this to bear full fruit, simultaneous action is needed on the supply side to assure that workers acquire the skills that firms need—better basic education and technical training, for example—so that they can find and fill the new jobs that appear. Better chances of getting a job would bring discouraged workers back into the labor force. More important still would be to improve incentives—or eliminate disincentives that are embedded in the social protection system—so that more people seek work. Clearing specific barriers to employment faced by older workers, youth, women, and minorities
would also ensure equity and inclusiveness of economic growth.
Inflexible labor markets protect jobs for a small number of people instead of helping create jobs for large numbers of people. First, social security contributions and other labor taxes constitute the labor tax wedge, the gap between the employer’s cost of hiring and the worker’s take-home earnings. This wedge is particularly high for low-wage earners in the Western Balkans (Figure 22). For example, in Serbia, around 37 percent of the labor cost to the employer is taxed, placing it among OECD countries with the highest tax wedge. The high minimum social security contribution also does not depend on the hours worked, pushing low-skilled workers to low-paid and less-productive informal jobs. Overall, high taxes on labor make formal-sector jobs less attractive, for both employers

30 Revving Up the Engines of Growth and Prosperity
Figure 22: High tax wedges and low progressivity encourage unemployment and informality.(Gap in tax wedge between high and low wage earners, 2012)
Source: World Bank based on OECD tax and bene�t models.
Figure 23: Low labor market flexibility impedes hiring.(OECD Employment Protection Legislation Index)
Source: OECD and World Bank sta� calculations.
0.0 0.5 1.0 1.5 2.0 2.5 3.0 3.50 0 0 5 1 0 1 5 2 0 2 5 3 0MKD (2015)SRB (2015)
MNE (2013)ALB (2015)KSV (2014)BIH (2015)
WB6 (2013/14/15)OECD av. (2013/14)
Other non OECD (2012-15)LAC (2014)
OECD Employment Protection Legislation IndexTax wedge for single at 33 percent of average wage
Prog
ressi
vity o
f tax
wed
ge (p
erce
ntag
e poin
ts)
0% 5% 10% 15% 20% 25% 30% 35% 40% 45%0
5
10
15
20
25
IRL
PR
ESP SVN
AUT
BEL
FRADEU
HUN
LVAESTSWE
GRC
SRBBIH
BGR
ITA
CZENOR
USA
JPNMKD
NLDGBR
and employees, pushing up unemployment and informality. Second, employment protection measures such as restrictions on temporary work and high dismissal cost and severance pay remain stronger in the Western Balkans than in OECD countries and countries in other regions, despite reforms aimed at making markets more flexible while providing adequate protection for workers (Figure 23). Third, wage regulations in some countries cause additional rigidity in the labor market. For example, Albania’s high minimum wage, set at 50 percent of the average wage, adds to already strong disincentives for firms to hire workers formally, especially those who earn
relatively low wages. Lengthy procedures by which companies register for social security create additional burden.
Search frictions and mobility constraints result in low movement of workers toward more productive jobs in other companies, sectors, or places. Compared to other countries inside and outside Europe, the Western Balkans have the lowest rates of change in employment shares in each major sector (agriculture, industry, and services)—even though low-productivity agriculture still accounts for under 20 percent of employment in all countries except Albania (where it is above

31Revving Up the Engines of Growth and Prosperity
40 percent). The right policies would facilitate efficient job matching and labor reallocation across firms, sectors, and places by removing obstacles to internal labor mobility, promoting the sharing of reliable and timely information on job vacancies, and enhancing employment services that government offers.
The social protection system discourages work and suppresses labor force participation. Retirement at an early age is common, made possible by generous
legacy pension systems (Figure 24). Statutory increases of the retirement age that many countries have enacted have so far had limited effect, given lax rules for early retirement. Pension systems continue to pay benefits to large numbers of people who are below the official retirement age. For example, in Serbia, where a pension replaces over 50 percent of the average wage, about half of pensioners are below 65, the official retirement age. As a result of numbers like these, workers aged 40 and older in most of the six countries have strikingly
Figure 24: Pensions are generous and too often available early, creating perverse incentives for people in prime working age to retire.(Pension spending per beneficiary as a share of GDP per capita and share of pensions going to people under age 65)
Source: OECD, International Monetary Fund, Eurostat, and national authorities.
Figure 25: Remittances are high and help drive up reservation wages.(In percent of GDP, 2015)
Source: World Development Indicators and World Bank sta� calculations.Note: Values might di�er from national estimates. The same data source is used for international comparisons. SSF, MENA, LAC, ECA, EAP are regions of the world, as de�ned in the World Development Indicators.
0 5 10 15 200OECD
EAPECALAC
MENASSF
FYR Macedonia7STEESerbia
AlbaniaMontenegro
WB6BIH
Kosovo
Percentage Points
0
10
20
30
40
50
60
Serbia (2014)
Montenegro (2014)
FYR Macedonia (2014)
BIH (2009)
Albania (2010)
Czech R. (2014)
Lithuania (2014)
Latvia (2014)
ECA av. (2012)
Slovenia (2014)
Slovak R. (2014)
Estonia (2014)
OECD av. (2011)
Pension spending as a share of GDP (%)Proportion of pensioners eligible before age 65 (%)

32 Revving Up the Engines of Growth and Prosperity
Figure 26: Female workers are particularly disadvantaged and have fewer economic opportunities.(Labor force participation, percent of population aged 15+, 2015, national estimates)
Figure 27: Unemployment remains particularly high among youth.(Total youth unemployment, percent of total labor force, ages 15-24, national estimates)
Source: World Development Indicators, Labor Force Surveys, and World Bank sta� calculations. Note: De�nition of unemployment may di�er by country.
Source: World Development Indicators, Labor Force Surveys and World Bank sta� calculations. Note: De�nition of labor force may di�er by country.
0
10
20
30
40
50
WB6MENA7STEEECALACSSAEAPSAS10
20
30
40
50
60
70
80
90
MontenegroSerbia
AlbaniaBIH
FYR MacedoniaKosovo
SwedenIce
land
Lithuania
Slovenia
Germany
BulgariaCroatia
LatviaEsto
nia
Hungary
Slovak R.
2000 2015
high inactivity rates. In addition, social assistance benefits can discourage efforts to find work. Although Serbia’s last-resort benefit is not high on average, for some low-income households it can come close to the net minimum wage. In Montenegro, the newly introduced lifetime benefit for non-working mothers of three or more children amounted to up to 70 percent of the average wage in 2016. Social assistance benefits in the Western Balkans are also designed to fall one-for-one when income increases, acting as a labor tax and reducing incentives to take up low-paid and part-time jobs in the formal sector.
Women, young people, and minorities suffer particular disadvantage in finding jobs. A large gap in employment rates exists between men and women. Female unemployment is on average 20 percent higher than male. Younger workers (aged 15-24) face unemployment of close to 50 percent. Even higher rates are common among the countries’ minorities, notably the Roma: 44 percent of Roma in Bosnia and Herzegovina are unemployed, for example, compared to 27 percent of non-Roma living in the same communities. Policies that could remove barriers to employment of disadvantaged

33Revving Up the Engines of Growth and Prosperity
Figure 28: Emigration of the most educated workers may limit growth potential.(Percent of the tertiary-educated population living abroad)
Source: World Development Indicators (for 1990 and 2000) and OECD (for 2010/11). No data on emigration by education level are available for Kosovo and Montenegro. Note: De�nitions of emigration rates vary due to di�erent sources of data.
0
5
10
15
20
25
30
35
MKDBIHALBLACMENAECAEAP
1990 2000 2010/11
29.4
20.323
.326.7
17.5
15.3
11.1
10.1
9.211
.3
6.86.75.95.4
27.6
groups include providing greater child and elderly care, promoting flexible work arrangements, and strengthening labor market programs.
Skill gaps and mismatches also constrain employment. Sixty percent of 15-year-olds in Albania and 50 percent in Montenegro score below the threshold for functional literacy. In Montenegro, at least 15 percent of the unemployed could not benefit from job growth due to insufficient education and 20 percent due to occupational mismatch.
Facing scant opportunity at home, younger people often seek their fortunes abroad—as of 2013, a quarter of the six countries’ population had emigrated. Many of these people send remittances to family members who stay behind, providing another crutch for personal survival in a moribund economy. Taken together, these payments account for a substantial portion of GDP (Figure 25) and household income, especially in Kosovo and Albania (Figure 17). But emigration is a mixed blessing for development. A regular remittance can undermine the recipient’s incentive to work. In addition, when a high share of the well-educated are leaving, the resulting “brain drain,” makes it all the more difficult for the home economy to advance. This challenge is particularly visible in FYR Macedonia, where almost 30 percent of university graduates
were living abroad in 2000 (Figure 28). These countries would benefit from developing job opportunities at home while harnessing benefits from emigration such as investment and knowledge transfers from people living abroad.

34 Revving Up the Engines of Growth and Prosperity
35Revving Up the Engines of Growth and Prosperity
western balkan eConomies have major Potential to imProve their ProduCtivity
For almost half a century, the Western Balkan countries had state-directed economies, and many features of that system remain in place. Many mines and factories that were owned and operated by government in the socialist years are still in public hands, particularly in Bosnia and Herzegovina, Serbia, and Montenegro. Their technology is generally outdated and their efficiency low, but year after year they remain in business, often behind protective walls that dilute incentives for modernization. High wages in state employment, as well as remittances from family members abroad, tend to drive up the local economy’s reservation wage, the lowest wage that a worker is willing to accept. Statutory minimum wages that are sometimes set well above one third of the actual average wages also hurt formal employment. These legacies of the past stand in the way of modernizing factors of production,
improving their allocation to most productive areas, and thus to increasing overall productivity in the economy.
New firms have difficulty entering the market, and structural rigidities slow down labor reallocation to more productive sectors. With high disincentives for hiring, many workers who don’t get coveted state jobs end up in low-productivity informal employment, such as selling in the market or doing odd jobs. The countries’ tax structures often serve to lock these people into that work. The generally low-productivity agriculture sector, which accounts for a sizeable portion of employment, holds the potential for important gains if significant numbers of those workers were to move to jobs in higher-productivity sectors. But outside of Albania, which has the highest employment share in agriculture, very few have. Lack of new

36 Revving Up the Engines of Growth and Prosperity
-4
-2
0
2
4
6
8
ServicesConstructionManufacturingMining & Quarrying
Overall Economy
(Excl. Agric)
Figure 29: Serbia’s productivity is low and slow-growing.(Real labor productivity in constant 2010 EUR and its growth rate in percent, 2014)
Contribution from within sectors productivity growth
Real Labour Productivity
Cum
mula
tive A
nnua
l Gro
wth R
ate
Source: World Bank sta� calculations based on Eurostat data and Serbia’s Structural Business Surveys 2009 to 2014. Note: Lower left quadrant denotes the lowest productivity and productivity growth among countries depicted. Comparable data are available for only Serbia among the Western Balkans countries. Real labor productivity is measured as value added (at factor cost) per person employed. Real values are euro 2010-adjusted. Compound annual growth rate is based on growth between 2009 and 2014 for each country.
Source: World Bank sta� calculations based on Eurostat data and Serbia’s Structural Business Surveys 2009 to 2014. Note: Comparable data for other Western Balkan countries are not available.
Figure 30: Reallocation of labor between sectors has lowered productivity in Serbia.(Contributions to productivity growth, percentage points, 2009-2014)
Contribution from Structural Change
0.79
3.006.70
-2.84-1.58 -1.20
0.900.09
-0.04 -0.01
LIT
ESTSVN
HUN
CZEHRV
SVK
SRB
LATROU
BGR
POL
0 5000 10000 15000 20000 25000 30000 35000 40000-1%
0%
1%
2%
3%
4%
5%
6%
SVK
10000 15000 20000 25000
LIT
ESTS
HUN
CZEHRVSRB
LATROU
BGR
POL
30000
jobs is just part of the problem; people are often reluctant to relocate for new employment. Surveys find that less than 40 percent of people ages 18-64 are willing to move internally for employment reasons. Yet so many people are willing to move abroad.
Labor productivity is low and slow-growing. Approximating the region’s average labor productivity at firm level with estimates that are available only in Serbia and FYR Macedonia shows that the Western Balkans states are lagging behind most 7STEE countries. Serbia’s average labor productivity
growth of about 0.87 percent annually is much lower than the 2.75 percent recorded among the 7STEE (Figure 29). This is caused in part by labor shifts between sectors and industries that have worked against productivity, although it is also related to the ongoing restructuring and privatization in several industries, such as pharmaceuticals, which could temporarily reduce productivity (Figure 30). Some highly productive sub-sectors such as computer programing, real estate, telecommunications, and rental and leasing activities are also emerging, having recorded increases in employment between 2009 and 2014.

37Revving Up the Engines of Growth and Prosperity
Figure 32: Total Factor Productivity has reduced growth more recently.(GDP growth accounting decomposition, 2000-2014)
Source: World Bank sta� calculations based on World Development Indicators, Eurostat and national authorities' data.
70
75
80
85
90
95
100
105
20142012201020082006200420022000-4
-2
0
2
4
6
8
10
09-1
400
-08
09-1
400
-08
09-1
400
-08
09-1
400
-08
09-1
400
-08
09-1
400
-08
09-1
400
-08
TFP
ALB BIH KOS MKD MNE SRB WB6
Capital stock Working age pop (15-64) Human Capital GDP
Figure 31: In most Western Balkan countries, productivity levels have dwindled since the global financial crisis. (Total factor productivity, 2008 = 100)
Source: World Bank sta� calculations based on World Development Indicators, Eurostat and national authorities' data.
KOS SRB MNE BIH ALB MKD
Figure 33: Western Balkan states are still far from the investment climate frontier.(Doing Business scores, 0 worst to 100 best)
Source: World Bank Doing Business and World Bank sta� calculations.
Figure 34: And they are not very cost-competitive.(Median cost of input per US$ of sales)
Source: World Bank Enterprise Surveys 2013 and World Bank sta� calculations.
50
55
60
65
70
75
80
ESTLTULVASVKSVNBGRHRVMKDMNESRBKSVBIHALB 0.20
0.25
0.30
0.35
0.40
0.45
0.50
LVABGRHRVSVNLTUESTROUMNEBIHSRBKSVMKDALB
DB 2010 DB 2017
Median 7STEE (DB 2017)
Median WB6 (DB 2017)
Median 7STEE
Median WB6

38 Revving Up the Engines of Growth and Prosperity
Making it easier to set up and grow private enterprises will accelerate the reallocation of resources to higher-productivity sectors and firms. In view of structural unemployment and emigration, productivity gains are the only sure means of improving competitiveness and growth. Yet total factor productivity levels dwindled in the Western Balkans after the global crisis, and in some countries actually subtracted from growth (Figure 31, Figure 32). But when they have occurred, gains of reallocation of resources to more productive activities have been substantial. However, such reallocation does not occur automatically. It needs such enticements as a better business environment—rule of law, easier business entry and exit, better access to finance, improved infrastructure, a skilled workforce, and greater labor market flexibility.
Without these, productivity-enhancing labor reallocation will advance very slowly.
Despite recent reforms, the Western Balkans remain at considerable distance from the business environment frontier and are less competitive than their peers (Figure 33). Competition from informal firms, political instability, poor access to finance, high tax rates, and problems with electricity service are the five main obstacles that formal enterprises identify. Among these factors, informal competition, poor access to finance, and political instability appear to be more severe obstacles in the Western Balkans than in the 7STEE countries, where tax rates are cited as the biggest problem. Trade, customs, and transport-related infrastructure also require attention—their current quality
Table 1. Western Balkan countries have a heavy burden of domestic regulation.
alb bih ksv mkd mne srb 7stee
doing business rank (2017) - wb 58 81 60 10 51 47 27
Corruption Perception index score (2016) - ti 39 39 n.a. 37 45 42 55
intensity of local competition (2016-17) - wef 116 119 n.a. 41 124 128 51
extent of market dominance (2016-17) - wef 124 108 n.a. 67 89 129 64
effectiveness of anti-monopoly policy (2016-17) - wef 112 105 n.a. 49 85 118 64
business impact of rules on fdi (2016-17) - wef 59 127 n.a. 32 95 102 50
Sources: Doing Business; Transparency International, and World Economic Forum’s Competitiveness Index.

39Revving Up the Engines of Growth and Prosperity
undermines export potential. Moreover, with low productivity levels, manufacturing firms in Western Balkans countries are generally less cost-competitive than those in the 7STEE (Figure 34). There is an exception in the region, however : FYR Macedonia, which was an early reformer in improving its business environment.
Reforming burdensome competition restrictions and high connectivity costs could upgrade and expand exports. Even as cross-border banking flows dried up after 2008 and global demand remained low, FDI inflows and export growth have continued to provide hope for a GDP growth revival, if only these countries could accelerate reforms to become more attractive to business. Table 1 highlights the sizeable restrictions that exist on domestic competition and Figure 35 puts the region’s high connectivity costs in sharp relief.
Figure 35: The region can do much more to enable trade.(Global Enabling Trade rankings, 2016)
Source: World Economic Forum. Note: The lower the rank, the better the situation.
0 20 40 60 80 100 120 1400 20 40 60 80 100 120SVNLVALTUSVKHRVBGRMNESRBALB
MKDBIH
WB5
7STEE
Availability and use of ICTs Availability and quality of transport servicesE�ciency and transparency of border administration

40 Revving Up the Engines of Growth and Prosperity

41Revving Up the Engines of Growth and Prosperity
The state has a key role to play in reorienting the growth model of the Western Balkans towards one that is private sector-dominant, productivity-driven, and export-led. Reforms must now focus on creating a nimbler, and in some cases smaller state that will be a more effective enabler of this new growth model. Currently the state often has too much of a footprint in the wrong places, and too little in the right ones. This varies country to country. In Bosnia and Herzegovina, Montenegro, and Serbia, the ratio of government spending to GDP remains well above norms of countries of similar income level; government wage bills range from moderate to some of the largest among regional peers (Figure 36). In countries with outsized public sectors, reforms reducing the size of the state are necessary, including addressing the legacy of often still-large state-owned enterprises. Improving the efficiency of the way public money is spent, assets are
used, and services delivered is paramount to rekindling growth. Across the board, the state’s role should be to regulate and facilitate private-sector dynamism, not over-burden or distort investment and employment decisions.
State institutions and policies need to provide the right regulatory, legal, and fiscal environment for business creation and growth. Reforming the legal and regulatory systems is crucial. Enhancing the quality, reliability, and timeliness of the state’s legal and regulatory systems is at the heart of improving the business environment to allow a dynamic private sector to drive growth, employment, and poverty reduction. The quality of courts is poor across the region, with inconsistent rulings and high appeal rates. Procedural abuses go largely unchecked. Delays are endemic—in Serbia and FYR Macedonia, it takes approximately 635 days to enforce a contract, followed by Bosnia and Herzegovina, Montenegro and
with reforms, the state Can helP build a new Growth model and deliver better serviCes
42 Revving Up the Engines of Growth and Prosperity
Albania, which are all at above 500 days. The EU accession process has created incentive for large-scale legislative reform but effective implementation is very often lacking. Business operations suffer in this complex and in some cases fragmented legal environment. Intellectual property rights are a particular issue in Albania and Kosovo, where piracy is widespread. If unable to enforce contracts, firms are less likely to expand their collection of suppliers, take on credit, and expand their business. Enhanced independence, accountability, and professionalism of the judiciary would ensure that laws and regulations are implemented in an efficient and nondiscretionary way. Finally, governments should strive to ensure that access to the courts and to social services is equitable.
Current fiscal regimes often distort incentives and undermine dynamism in the private sector. Fiscal policy can better support private-sector growth and job creation, particularly in those countries in the region where the fiscal burden on the private sector is high. Countries might investigate lowering high marginal tax and social contribution rates that serve to keep people in the region’s large informal sector and stifle creation of formal jobs. In Bosnia and Herzegovina, social security contributions on the order of 35-40 percent of gross wages, the highest in the region, may make the cost of bringing a worker into the formal sector prohibitive. The large public-sector employment and its higher pay and job
security also distort labor markets. In a 2016 survey in the region, 79 percent of respondents said they would prefer to work in the public sector given the choice, with levels reaching almost 90 percent in Bosnia and Herzegovina and Kosovo.
Addressing structural rigidities in expenditures, such as relatively high shares of spending on wages and pensions, is also necessary for restoring the macro-fiscal stability which is a pre-requisite for sustained private investment. Ongoing reforms of fiscal regimes have helped restore stability since the global financial and euro crises. As growth declined, fiscal accounts deteriorated. As revenues shrank and interest costs rose, structural rigidities prevented changes in spending patterns—for example, reductions in pension and government wage bills. These spending rigidities did, however, support household incomes, mitigating the impact of the economic downturn (Figure 37). Most governments in the region were able to use their fiscal space pragmatically to manage the crisis impact. But debt levels are now much higher than before the global financial crisis (by around 20 percentage points of GDP in some countries). Restoring macro-fiscal stability and debt sustainability has been a priority for countries such as Albania and Serbia, so as to rebuild confidence among domestic and foreign investors and consumers. Public financial management has received considerable attention, with notable

43Revving Up the Engines of Growth and Prosperity
Figure 36: For half the countries in the region, the ratio of government spending to GDP is well above norms by national income level.(Expenditures as percent of GDP, average 2012-2016)
Ln GDP per capita 2012 (PPP international dollars)
Source: World Development Indicators and IMF World Economic Outlook April 2016. Note: The solid line indicates non-parametric nearest neighbor smoothing, with dashed lines showing con�dence intervals at +/- 2 standard deviations. Y-axis is truncated at 60 percent.
Source: IMF World Economic Outlook (April 2017) and World Bank sta� calculations.
Figure 37: Restoring macro-fiscal stability remains a priority for many countries following deterioration in the global crisis period.(General government net balance as percent of GDP)
Average 2002-2007 2008 2010 2012 2014 2016
-8
-6
-4
-2
0
2
SRBMKDMNEKSVBIHALB6 7 8 9 10 110
10
20
30
40
50
60
MKD
SRB
MNEBIH
ALBKSV
progress achieved on the comprehensiveness, transparency, and classification of budgets, for example, and the assessment of medium-term fiscal risks. Procurement reform, such as in Serbia, and internal financial controls, such as in Montenegro, have also been areas of focus.
Going forward, governments will need to redouble efforts toward fiscal consolidation and improved management of public finances. Keeping the macro environment stable for investment will require sustaining and deepening the fiscal consolidation and public financial management improvements achieved
to date. While consolidation efforts in Serbia and Albania have helped bring fiscal deficits back in check, the situation in Montenegro raises concerns. Efforts should continue to ensure that policy makers can better monitor and limit the risks of future fiscal slippages, through such steps as improved control of spending commitments and reduction of arrears. Albania, for example, faced with general government arrears exceeding 5 percent of GDP in 2013, took steps to clear them and prevent a future accumulation. Bosnia and Herzegovina is now increasing its focus on stock-taking, monitoring, and future resolution of public arrears.

44 Revving Up the Engines of Growth and Prosperity
Improvements in the effectiveness of public spending and quality of service delivery would support a new growth model and promote equity. Use of public resources can become more effective by improving the allocation of spending. In particular, rigid recurrent spending and the need for special fiscal response to the recent crises have limited the fiscal space available for productive investment. Enhancing social service delivery would also be beneficial. Satisfaction with public services in the Western Balkans is generally low relative to spending levels (Figure 38). Health expenditures in Serbia and
Bosnia and Herzegovina account for at least 10 percent of GDP, almost two times higher than in the European Union, and 1.5 times higher than in an average upper middle income country—yet without higher health outcomes. Geographic and socio-economic disparities in the delivery of public services put the poor and rural dwellers at particular disadvantage. Better targeted and more effective spending on education and health would address skill gaps and enhance human capital and economic opportunities. Higher-quality infrastructure in transportation, supported by improved quality and, for some countries, higher levels
Figure 38: Satisfaction with public services is low relative to spending levels.(Percent of respondents satisfied with quality and efficiencyof public service delivery, average across indicators)
General government expendituresto GDP (percent), average 2012-2016
LITS (
perce
nt of
resp
onde
nts s
atis�
ed w
ith qu
ality
and
e�cie
ncy o
f pub
lic se
rvice
deliv
ery)
, sim
ple av
erag
e, 20
16
Source: EBRD Life in Transition Survey, 2016, and IMF World Economic Outlook, April 2017. Source: Transparency International: “People and Corruption: Europe and Central Asia,” Global Corruption Barometer 2016.
Figure 39: Concern over corruption is high.(Percent of respondents agreeing with statements that corruptionor bribery is one of the three biggest problems facing the countryin the public sector in this country, percent of respondents)
Corruption or bribery is one of the three biggest problems facing the countryRate their government "badly" at �ghting corruption in government
0
10
20
30
40
50
60
70
80
90
Median7STEE
BIHKSVMNEMKDSRBALB
EST
LVA SVN
BLR
ROM
RUS
TUR
GEOARM
KAZ MKD
SRB
SVK
BGR
KYR
UZB
MNE
UKR
HUN
BIH
ALBMNG
TJK
MDA
HRVPOLLTU
20 25 30 35 40 45 50 5530
40
50
60
70
80
90EST
GEO
TUR
LVA
U
BMDA
SVN
HRVHRVUZB
TU POL
BLRB
HMN
KR
SVKM UZB
TS
UBIH
ARM GS BG
RB
MM UZLT
TJKKAZ
MNGU
M
UUU
B
UMKD
R
ALB

45Revving Up the Engines of Growth and Prosperity
of public investment spending, would facilitate the shipping of goods to markets. If the benefits of future growth are to be shared across the population, social safety nets will need to become more comprehensive and, in view of fiscal constraints, better targeted.
Improving service delivery and making the policy reforms outlined above will require a strengthening of capacity within public administrations. This includes moving towards independent, efficient, and honest public administrations that are in line with European standards. Public servants must be empowered to participate in the design and implementation of reforms. Policy processes need streamlining and central government strengthening to improve coordination. Corruption and political interference in government agencies, especially the judiciary, must be tackled to allay concerns among citizens, firms, and foreign investors that set back broad objectives of national development (Figure 39). While some countries have passed reforms aimed at protecting the integrity of their legislative systems, the enduring pattern across the region is that corruption is rarely punished in courts. Enhanced accountability and oversight, including through innovations
such as e-government, can help businesses and workers alike to feel secure in committing their funds and futures to the region.
Reforms will succeed only if backed by political will. This transition is not easy. Government will need to manage the potential distributional disruptions of reforms (for example, if pensions are changed) and weigh prospects of enhanced future growth against the interests of those who benefit from the status quo. Corruption and the capture of state institutions by private interests pose a serious impediment to reform. However, as seen in the difficult fiscal reforms moved forward in some countries in recent years, there is a growing understanding that there can be no more postponing. Looking outwards, the countries of the region can see the results of the “EU convergence machine” which has supported improvements in economic governance and higher incomes. Looking inwards, the stalling of improvements in living standards in the Western Balkans since the global financial crisis has also helped to crystallize the view that now is the time to deliver on the region’s potential. The region owes it to its people to move ahead with reforms to raise economic growth rates and ensure sustained improvement in welfare for all.

46 Revving Up the Engines of Growth and Prosperity

47Revving Up the Engines of Growth and Prosperity
The six Western Balkan nations face similar policy challenges. If they maintain the status quo and continue to grow per capita income relative to the EU at the average rate they achieved in 1995-2015, it will take about 60 years to catch up with their neighbor (Figure 40, compare to Figure 1). To speed up convergence, they need to deepen reforms to raise productivity and economic growth through further integration into regional and world markets and to raise living standards through higher employment and equity in access to services.
To aid in these tasks, the World Bank has produced Systematic Country Diagnostic reports for five of the countries (all but FYR Macedonia, whose report is still in progress). These diagnostics identify four top policy priorities that are common across all the countries:
PostsCriPt
Figure 40: At the current relative growth speed, it will take about 60 years for the Western Balkans to converge to theaverage EU level of income.(GDP/capita international 2010 PPP dollars relative to EU, percent, years to achieve convergence)
Source: World Development Indicators and World Bank sta� calculations. Note: Growth rates are relative to the EU. Median relative growth rates 1995-2015 are 1.8 percent for WB6 and 3.2 percent for 7STEE.
1995
1997
1999
2001
2003
2005
2007
2009
2011
2013
2015 2 4 6 8 10 12 14 16 18 20 22 24 26 28 30 32 34 36 38 40 42 44 46 48 50 52 54 56 58 60 62
0
20
40
60
80
100
WB6@5% 7STEE@5%WB6@3% 7STEE@3%WB6@average 7STEE@average

48 Revving Up the Engines of Growth and Prosperity
• Foster macroeconomic stability.• Remove disincentives and barriers to
work.• Strengthen the business environment and
private sector development.• Improve governance and institutions and
deepen public sector reform.
Coordination at the regional level would also heighten integration within the region and with the rest of the world.
As for Fiat, today it offers proof of what other private firms could do in
the Western Balkans. Poor infrastructure, including roads and railways, workers who did not always have the right skills, and a lack of experienced local managers—Fiat’s success in overcoming these and other challenges to create a large-scale employer and point of technology transfer is encouraging. The company can take pride in raising the region’s sophistication of expor ts, providing jobs to a young and educated labor force, and placing orders with many suppliers in Serbia and across the region. There is plenty of room in the Western Balkans for others to do the same.