the wealth effects of government investment in … (2012)-gov... · 2 the wealth effects of...
TRANSCRIPT
1
The Wealth Effects of Government Investment in Publicly Traded Firms
Kateryna Holland
University of Oklahoma
Current draft: August 17, 2012
Abstract
Utilizing a sample spanning 68 different countries from 1988-2011, I study 1,809 government equity
investments in publicly traded firms and analyze the shareholder wealth effects associated with different
types of government investors given varying levels of political interference. Prior literature suggests that
government political goals conflict with shareholder wealth maximization thus harming firm valuation.
But government ownership could benefit firms by reducing default probability and offering a certification
effect, as well as by providing easier access to financing and privileged access to contracts. I find that
target stock prices react positively to announcements of foreign government investments and investments
by government’s economic and financial arms, they are negative for announcements of domestic
government investments and investments by government political arms. Firms react more positively to
purchases by governments with low risk of expropriation and by right-wing governments. These results
indicate that government investment associated with a higher level of political interference has a negative
influence of shareholder wealth, while the opposite is true for government investment that follows
economic or financial objectives. Finally, I show that majority stake purchases by governments are
associated with a positive target acquisition reaction.
JEL Classification: G32
Keywords: Government Ownership
Please address correspondence to:
Kateryna Holland
Price College of Business
307 West Brooks, 350 Adams Hall
The University of Oklahoma
Norman, OK 73019-4005
Tel: (405) 325-5591; Fax: (405) 325-7688
e-mail: [email protected]

2
The Wealth Effects of Government Investment in Publicly Traded Firms
Since the early 1980s, governments around the world have received US$3.1 trillion from the sale
of business assets through privatizations, but they have also simultaneously invested US$2.9 trillion, as
they initiated or increased stakes in firms.1 Numerous studies have recorded positive effects of
privatizations on firm returns, efficiency, profitability, dividend payout, leverage, and better alignment of
shareholder and manager goals.2 Therefore, it is puzzling why government ownership persists and while
governments are becoming an increasing important class of investors, little is known about different types
of government investors. Since privatizations are mainly administered by central governments, prior
literature is unable to explain how other government owners, such as local governments, government
financial institutions and state owned enterprises (SOEs) influence firms under their control. In this paper,
I examine government investment in publicly traded companies and assess the shareholder announcement
reaction for acquisitions by various types of government investors.
Government investments can offer several important benefits, such as providing favorable
financing and certification of a firm’s vitality. Acharya and Kulkarni (2012) indicate that Indian public
sector banks outperformed other, even less risky, private sector banks during and after the 2008 financial
crisis due to their explicit and implicit government backing. Borisova, Fotak, Holland, and Megginson
(2012) show that firms with government ownership enjoy a lower cost of debt during distress times, also
due to an implicit government guarantee. Houston, Jiang, Lin, and Ma (2011) confirm that US firm’s
political connections reduce borrowing costs and increase firm value. Politically connected firms are in
general more likely to receive funding and bailouts (Faccio, Masulis, and McConnel, 2006; Duchin and
Sosyura, 2012). Kottler and Lel (2011) note a more direct channel through which government ownership
increases the firm’s survival chances, by being the lender of last resort. Overall, the certification effect
and better financing terms provided by government investment are beneficial for target firms.
Additionally, government investment is likely to be followed by additional contracts, as well as possibly
preferential regulatory, tax and policy (i.e. environmental) treatment and subsidies to facilitate growth.
Faccio (2006) shows that politically connected firms, those whose officers are political affiliates, enjoy
these benefits and exhibit positive stock reactions around the announcement of their officers or large
shareholders entering politics. These effects along with cheaper financing should be associated with an
increase in shareholder wealth and a positive announcement reaction around government acquisitions.
1 Appendix 2 shows overall government investment from the Thomson Reuters SDC Platinum M&A database.
2Early fundamental studies that point to the superiority of private ownership include: Eckel, Eckel, Singal (1997),
D’Souza, Megginson (1999), Megginson, Nash, Randenborgh (1994), Shleifer (1994). More recent privatization
literature is summarized in surveys by Megginson, Netter (2001), and Estrin, Hanousek ,Kocenda, Svejnar, (2009).
3
However, government ownership can also have deleterious effects, as governments typically
carry not only economic, but also social and political goals (Shleifer, 1998), which often conflict with
profit maximization goals in firms. Government ownership is associated with poor management, inferior
efficiency and reduced profitability in the privatization literature, as firm performance improves after
privatizations (Megginson and Netter, 2001). Governments may also influence laws and enforcement to
reduce constraints and penalties associated with tunneling. Shleifer (1998) notes that, besides pursuing
political and social goals, state entities often strive to increase government officials’ personal incomes.
Such negative effects of government ownership should lead to a negative reaction to announcements of
government investment.
Between the pernicious effects of government ownership due to tunneling, political goal
imposition, and poor management associated with lower efficiency and profitability recorded in the
privatization literature, and the positive effects of government ownership due to the certification effect,
cheaper financing, beneficial regulation, and additional contracts, the influence of government investors
on shareholder wealth is a matter of empirical investigation. The benefit of examining this relationship in
a setting involving government purchases of listed firms’ stock, as opposed to divestments of state-owned
shares, is two-fold.
First, government investments could provide a less contaminated ground for the investigation of
government ownership effects, as privatizations are often concurrent with periods of sweeping regulatory,
political and often firm-restructuring changes which could influence firm performance without
privatization. For example, Dinc and Gupta (2011) show that profitable firms are more likely to be
privatized early and Dewenter and Malatesta (2001) indicate that governments effectively restructure
some of the firms before privatization and find little evidence of later profitability enhancements. 3 On the
other hand, firm structure typically stays the same after government investment. This can be easily
illustrated through several examples.4 In the May 2012 acquisition of the U.K. cereal maker Weetabix, the
Chinese government-owned acquirer, Bright Foods Group, announced its intendtion to keep the current
and efficient management, retain the infrastructure and technology, including retail-distribution channels
in the U.S., Canada and Italy, as well as strive by adding growth in Asia. In the July 2012 acquisition of
3 It warrants to be noted that both government divestment and investment could suffer from selection biases. While
governments privatize more profitable, ‘healthier’ and ‘easier’ firms (Megginson and Netter, 2011; Dinc and Gupta,
2011), governments might also be likely to purchase failing enterprises in nation’s vital industries. These rescues
could obscure the true relationship between government ownership and shareholder wealth. Accordingly I perform
my tests controlling for the firm’s prior performance, as well as differentiate between crises periods, when
government rescues are more likely, and non-crises. I plan on introducing two-stage selection and instrumental
variables models to ensure the robustness of my results. 4 Burkitt, Laurie “Chinese Food Company Eats English Breakfast.” Wall Street Journal, May 3, 2012
Iosebashvili, Ira “Renault-Nissan Buy Into Russia’s Aged Auto Giant.” Wall Street Journal, May 3, 2012.
“Canucks, meet CNOOC,” The Economist, July 28, 2012
4
the Canadian energy firm Nexen, China National Offshore Oil Corporation plans to keep the head office
in Calgary, continue listing shares on the Toronto exchange and extend the unconventional drilling
knowledge to tap China’s untouched shale reserves. On the other hand, privatizations are often
accompanied by extensive restructuring. The May 2012 privatization of Russian AutoVAZ, involving
Renault and Nissan, was accompanied by extensive management, board and work force changes and over
a $336 million technology update. These examples show that government investment, unlike
privatizations, are not associated with large concurrent firm changes and also highlight the importance of
understanding not only the influence of government divestment but also government investment, as both
could have a positive influence on a firm.
Second, it provides the ability to compare different government investors and uncover the
positive and negative effects related to their different levels of political interference and the associated
conflict between the goals of maximizing profits and maximizing political gains, what I henceforth will
call ‘political-profit maximization goal conflict.’ Neither the differences between various government
investors – Sovereign Wealth Funds (SWF), SOEs, central and local governments and government
financial institutions – nor their overall effect on shareholder wealth, have been fully examined in extant
literature.5 The privatization literature is unable to disentangle the difference between government
entities, as privatizations are mainly administered by central governments. Literature on government
acquisitions is segmented and a handful of papers examine special types of government acquisitions –
SWF acquisitions (Kotter and Lel, 2011; Dewenter, Han, and Malatesta, 2010), government cross-border
purchases (Karolyi and Liao, 2010) and government bank purchases (Karolyi and Taboada, 2011).
However, the ability to compare different types of government investors is important, as past research
documents significant investment style and shareholder value differences among institutional investors
(Chen, Hartford, and Li, 2007; Ferreira and Matos,2008). Government investors, just like other
institutional investors, can differ in terms of their objectives and therefore, could influence their
investment targets in fundamentally different ways.
Similar to Ferreira and Matos (2008), who examine the institutional acquirers and establish the
‘colors’ of institutional investment according to geographic origin and institution type in order to evaluate
activism, I characterize ‘colors’ of government investment in order to evaluate levels of political
interference and the associated conflict of interest with private shareholders. Pastor and Veronesi (2012)
in their theoretical evaluation of equity reactions to government policy announcements note that
governments are motivated by two objectives – economic objectives, such as maximizing investors’
5 Borisova, Fotak, Holland, Megginson (2012) examine the influence of various government entities on the cost of
debt of firms in which they own a stake. My study is different as it evaluates the impact of different government
investors on shareholder wealth.

5
welfare, and noneconomic objectives, such as maximizing political benefits for the government. They
theoretically predict a stock price increase as a response to a new beneficial government policy and a
stock price decrease when policy changes carry a high level of uncertainty regarding the policy’s impact
on profitability. Since political and profit maximization are typically conflicting goals, I expect
government investors with a higher level of this conflict to have a negative influence of shareholder
wealth. However, I expect government investments where the benefits from additional (perhaps
preferential) contracts, favorable regulation, certification and cheaper financing will outweigh any costs
of pursuing political objectives to have a positive overall influence on shareholder wealth. In order to
expose these positive and negative effects I specify different ‘colors’ of government investors.
First, for geographic origin ‘colors’ I differentiate between domestic and foreign government
investment. Extant literature suggests that foreign investors are less likely to impose conflicting goals on
a firm and more likely to increase shareholder wealth. Djankov and Murrell (2002), Ferreira and Matos
(2008), an Estrin, Hanousek, Kocenda and Svejnar (2009) all show that foreign institutional investors
enhance firm value due to their active stance, but do not document similar evidence for domestic
investors. Bortolotti, Fotak, and Megginson (2012) demonstrate that foreign government shareholders are
reluctant to interfere with firm management in order to avoid media and regulatory opposition. However,
domestic government ownership could also be beneficial to shareholders. Domestic government investors
are more likely than foreign state-owned investors to provide certification effect through their stock
purchases, to favorably alter domestic regulation and taxation, and to allocate new government contracts
to their investee firms.
Second, for investor type ‘colors’ I differentiate between various government entities – political,
financial and economic. The comparison of effects of these different government investors on shareholder
wealth has not been previously examined in the literature. I expect certain government entities, such as
the political subgroup which includes national and local governments, to be more likely to pursue political
objectives which conflict with profit maximization goals and therefore to be more deleterious to
shareholder wealth. On the other hand, the political group could also benefit shareholders as it is also the
most capable of offering explicit or implicit guarantees, which as Borisova, Fotak, Holland and
Megginson (2012) show can lead to cheaper financing.
Additionally, I define economic freedom ‘colors’ by considering the investor government’s
likelihood of expropriation, as well as whether it is a left- or right-wing government. Governments with
higher likelihood of expropriation are associated with higher levels of political interference and therefore
I expect their purchases to have a more negative effect on shareholder wealth. I also expect these more
negative effects for the targets of left-wing governments, as they have established a historic precedent for
forcing political agendas on businesses (Borotolotti, Fantini, Siniscalco, 2003). On the other hand, left-
6
wing governments are probably more likely to provide bailouts which are especially valuable during
times of economic distress.
Finally, I classify government control ‘colors’ by differentiating among minority and majority
stake purchases, where the expectations regarding political interference are mixed. Extant research shows
that large institutional investors improve shareholder wealth through activism. Similarly, large
government investments could benefit equity holders, as governments could actively distribute a larger
volume of contracts, provide cheaper financing and favorably affect regulation for firms in which they
have high ownership. These positive effects of large government holdings could be reversed by higher
levels of political interference, as government investors pursue political goals and majority ownership
would allow them to influence the firm according to their chosen objectives.
I examine the impact of these different government investor ‘colors’ on the target’s stock reaction
around the investment announcement in order to evaluate changes in shareholder wealth and to see if
political interference impacts valuation. I study government investments in 68 countries, involving 1,809
transactions in 1,477 unique target firms between 1988 and 2011. Using event-study methodology, I find
that stock price reactions to government investments are positive around the acquisition announcement.
But while stock price reactions are positive for foreign government investments and investments by those
government’s economic and financial arms, reactions are negative for domestic government investments
and investments by domestic government’s political arms. Further, I document that economic freedom
factors matter, as firms react more positively to purchases by governments where the expropriation risk is
low or by right-wing governments. These results imply that government investment associated with a
higher level of political inference and political-profit maximization conflict has a negative influence of
shareholder wealth, while the opposite is true for government investment that seem motivated by
economic or financial objectives. Finally, I show that majority stake purchases by governments are
associated with a more positive stock price reaction than are minority stake purchases.
This paper contributes to the broader economic debate on the role of governments in the spirit of
Friedman, Stiglitz and Shleifer. It also adds to the stream of corporate government literature that deals
with government ownership of business assets and control of economic activity. The overwhelming
preponderance of evidence points to the superiority of private over government ownership.6 But these
effects have been examined in the context of government divestments, while my study examines
government investments. My study unifies and puts into perspective the findings of the segmented
government investment literature (SWFs are examined by Bortolotti, Fotak, and Megginson, 2010; Kotter
6 Megginson, Nash and Randenborgh (1994), Megginson and Netter (2001), Gupta (2005), Estrin, Hanousek
,Kocenda, and Svejnar (2009), Brown, Earle, Telegdy (2010), Dinc and Gupta (2011), Boubakri, Cosset, Guedhami,
and Saffar (2011), Julio and Yook (2012).
7
and Lel, 2011; Dewenter, Han, and Malatesta, 2010; government cross-border deals are studied in Karolyi
and Liao, 2010; government banks’ investments are examined by Karolyi and Taboata, 2010). This study
also extends the literature studying the relationship between shareholder wealth and political connections
(Fisman, 2001; Faccio, 2006; Houston, Jiang, Lin, and Ma, 2011). Moreover, the study adds to the
literature on ownership and blockholding that highlights the importance of understanding the difference
between various investor classes (Ferreira and Matos, 2008; Woitdke, 2002; Giannetti and Laeven, 2009;
Klein and Zur, 2009; Chen, Harford and Li, 2007) by evaluating different ‘colors’ of government owners
according to their perceived levels of political interference.
The rest of the paper is structured as follows. Section 1 provides a literature review and
hypothesis development. Section 2 explains the data sources and variable definitions. Section 3 describes
event study results and Section 4 provides regression results. Section 5 concludes.
1. Literature Review and Hypothesis Development
1.1 Government influence studies
The effects of government ownership have been examined in the vast privatization literature,
which points to the deleterious effects of state involvement on shareholder wealth. Additionally,
government influence on shareholder wealth has been recently highlighted in the literature on political
connections. Politically connected firms are those whose officers or large shareholders hold political
appointments as members of parliament or as ministers. Faccio, Masulis, and McConnel (2006) and
Duchin and Sosyura (2012) show that politically connected firms exhibit worse performance than
unconnected firms especially after receiving a bailout. On the other hand, Houston, Jiang, Lin, and Ma
(2011) show that political connections increase the value of US firms by reducing bank monitoring costs
and providing a lower cost of bank loans. Likewise, Faccio (2006) finds a significant increase in
shareholder wealth when officers or large shareholders enter politics. Interestingly, she does not
document the same reaction when a politician joins the firm as one of the officers or as a large
shareholder. Moreover, Chansog, Christos, and Jung (2012) find that firms with higher levels of political
alignment outperform others over a 40 year period.
Studies of political connections provide an indirect and possibly one-sided check of the
relationship between shareholder wealth and government political interference. Politically involved firms’
executives might not have a wide enough reach to influence regulation and taxation, and even if they do,
they are more likely to tilt them in a direction positive for shareholders, as that would also positively
influence their wealth. This strand of literature, unlike a more direct evaluation of government
acquisitions, cannot examine the broader firm value effects from the non-shareholder politicians who
might want to derive personal benefit or reach broader political goals in politically connected firms.

8
In one of the earlier papers on government acquisitions, Boardman, Freedman and Eckel (1986)
examine a single nationalization event and show that the 1981 takeover of Domtar, a private Canadian
corporation, into government ownership caused a 25% loss in value for the shareholders due to
anticipated pursuit of non-profit objectives. In general, the finance literature dealing with government
acquisitions is underdeveloped and considers only subsets of government investments – banks in Karolyi
and Taboada (2011); SWF in Bortolotti, Fotak, and Megginson (2012), Kotter and Lel (2011), Dewenter,
Han, and Malatesta (2010); and cross-border deals in Karolyi and Liao (2010). Karolyi and Liao (2010)
examine general reactions to cross-border government acquisitions and show that targets react positively
to the news of government acquisitions, as do targets of private sector share acquisitions. These findings
differ from those of Boardman, Freedman and Eckel (1986). Additionally, Karolyi and Liao (2010)
document that foreign SWF purchases earn significantly lower target reactions than do purchases by other
types of foreign government acquirers, though studies of SWF investments (Bortolotti, Fotak, and
Megginson, 2012; Kotter and Lel, 2011; Dewenter, Han, and Malatesta 2010) generally document
significant positive short term target reactions.
Government purchases of banks are examined by Karolyi and Taboada (2011) who show that
bank returns, post-acquisition profitability and operational efficiency are higher when acquirers are from
countries with lower levels of government bank ownership.7 But the most recent study, by Norden,
Roosenboom, and Wang (2012), examines the effect for the 2007-2009 government interventions in the
U.S. banking sector and documents a significant positive stock price impact for borrowers of banks that
received government capital infusions in exchange for share ownership. All these conflicting results
highlight a need to separately consider the effects of government investments involving different types of
government investors and different levels of ownership, as well as, to pay special attention to the nature
and legal context of acquiring governments – in particular whether they are domestic or foreign and
whether these governments have high or low levels of involvement in the economy.
As discussed above, there are reasons to expect positive and negative reactions to
announcements of government investments or acquisitions. An investee firm can earn positive abnormal
stock returns if it gains a competitive advantage from state investment that cannot be replicated. For
example, government investee firm could receive contracts and/or access to capital that is otherwise
unavailable to the industry, or could receive preferential regulatory treatment. However, government
investment targets should react negatively if government investment has negative long term effects on
efficiency and profitability due to detrimental effects of conflicting political and profit maximization
7Karolyi, Taboada (2011) document that government banking sector involvement is the most important variable in
explaining bank returns around bank M&A announcements.

9
goals. Since either positive or negative reactions to government stock purchase announcements are
possible, I hypothesize:
Hypothesis 1: Announcements of government investments impact the target’s equity price.
In order to test this hypothesis I examine targets’ stock price reactions around government
acquisition announcements. Next, I concentrate on target stock price announcement reaction differences
given the different ‘colors’ of government investment based on their level of political interference
1.2 Foreign versus domestic investment
I examine geographical ‘colors’ of government investment by considering government domestic
and foreign investments. Foreign governments’ investments could differ from domestic as they tend to
invest following the goals of profit maximization rather than pursuing a political agenda. Ferreira and
Matos (2008), along with a large fraction of the corporate governance literature point to the superiority of
foreign institutional investor ownership, as it is associated with higher firm valuation and productivity
(Arnold and Javorcik, 2009; Aitken and Harrison, 1999). While no studies examine the difference
between overall government foreign and domestic investments, several evaluate subsets of such
investments. Karolyi and Liao (2010) examine only government cross-border acquisitions, but do not
evaluate government domestic purchases. They show that targets react positively to the news of foreign
government investment. Dewenter, Han, and Malatesta (2010) examine SWFs – government entities that
tend to invest in cross-border deals – and find positive (negative) SWF acquisition (divestment)
announcement returns. They also find that SWFs are active investors, therefore their findings point to a
more positive association between firm valuation and cross-border government investment. On the other
hand Bortolotti, Fotak, and Megginson (2010) show that foreign government acquirers act as passive
investors and create a monitoring gap which contributes to the deterioration of targets’ performance.
Borisova, Fotak, Holland, and Megginson (2012) also show that acquisitions by foreign governments are
associated with a higher cost of debt, while those by domestic governments are associated with a lower
cost of debt. Given the differential effects between domestic and foreign government investors on the
targets, I hypothesize the following:
Hypothesis 2: Targets react differently to news of increased foreign government ownership than
to the news of increased domestic government ownership.
1.3 Political, financial and economic investors
Next, I consider investor type ‘colors’ for various government entities – financial, economic and
political. Within the political group I have national (the Treasury, economic and finance ministries, the
central bank, regulatory boards) and local governments (regional, city and municipal branches of
10
government), as well as some national pension funds. The economic group contains SOEs, which are
further broken down into industry specializations – energy, materials, industrial, telecom and technology,
media, and consumer. The financial category includes commercial and development banks, real estate,
other financial institutions, SWFs and supranationals. A detailed classification explanation is provided in
Section 2, which is the data description section.
These political, financial and economic types of government acquirers pursue different objectives
and could influence the targets of their investment in different ways. Woidtke (2002) explains the
importance of disaggregating investors into categories to enhance the evaluation of underlying
relationships. She breaks pension funds into private and public and confirms the positive relationship
between private pension fund ownership and firm value documented by prior literature, but also shows
that the relationship between firm value and public or government pension funds is negative. Giannetti
and Laeven (2009) confirm these results using a sample of Swedish public pension funds. Woidtke (2002)
suggests for the future research to pay particular attention to the mix of investor groups instead of
evaluating them as one monolithic entity. Current literature has only examined the reaction to SWF
investments, while largely ignoring other types of government acquirers. While Karolyi and Liao (2012)
separate their cross-border investments into two categories, those by SWF and those by other government
acquirers, Borisova, Fotak, Holland, and Megginson (2012) is the first paper to differentiate between
more than two different types of government entities. However, they examine the influence of
government stock purchases on the firms’ cost of debt, while I am interested in their influence on
shareholder wealth. Borisova, Fotak, Holland, and Megginson (2012) document that different types of
government acquirers influence the cost of debt of their sample firms in fundamentally different ways.
They consider central governments, local/regional governments, fully government-owned SOEs and
SOEs with mixed ownership, government banks, SWFs and pension funds. While my differentiation
between government acquirer types is similar to Borisova, Fotak, Holland, Megginson (2012) it provides
both, more generalized results based on the three wide categories – political, financial, and economic –
and more specific results based on various industrial subcategories within the SOE group. My hypothesis
is:
Hypothesis 3: The type of government acquirer influences the target’s stock reaction.
1.4 Economic freedom
Target stock price reaction might depend not only on the type of government investor but also on
the commitment to economic freedom and the political orientation of the government that is increasing its
ownership in the firm. Accordingly, I consider government acquirer’s economic freedom ‘colors,’ which
have been shown to affect shareholder wealth. La Porta, Lopez-de-Silanes, Shleifer, and Vishny (LLSV)

11
(1997) and LLSV (1998) link poor investor protection and civil law country origin to less developed
capital markets, LLSV (2000) to lower dividend payments. Rajan and Zingales (2003) link lower trade
openness to lower levels of financial development. Ben-Nasr, Boubakri, Cosset (2012) hypothesize that a
higher cost of equity will be associated with the higher residual government ownership by left-wing
governments, with holdings by more autocratic / less democratic governments, with holdings by less
stable governments and for countries with a higher perceived risk of government expropriation.
Therefore, the literature points to a positive relationship between high levels of economic freedom and
shareholder wealth. But nations with lower levels of economic freedom, which accordingly have higher
levels of government interference, could be more likely to provide favorable regulation, cheaper financing
terms, and certification of firm viability, all of which would benefit target shareholders. Hence, I
hypothesize:
Hypothesis 4: The targets’ reaction to government acquisitions differs based on the economic
freedom factors of the government increasing its ownership.
In order to evaluate whether economic freedom factors play a role in target stock price reaction
around government investment announcements I examine the levels of expropriation expected of the
acquiring government. The expropriation index is provided by the PRS Group’s International Country
Risk Guild (ICRG) and is based on contract expropriation, profits repatriation, and payment delays. In
robustness checks I also examine economic freedom factors pertaining to the level of the acquiring
government’s autocracy / democracy, stability and size. Additionally, I examine the influence of the
acquiring government’s left-wing or right-wing political orientation from the World Bank database of
Political Institutions, as it could also proxy for the level of economic freedom. Bortolotti, Fantini,
Siniscalco (2003) show that left-wing governments are often associated with more state intervention.
1.5 Minority versus majority ownership
I finally consider the ownership ‘color’ by evaluating the impact of the level of government
ownership – whether it is buying a majority or minority stake in a company – around the investment
announcement. Borisova and Megginson (2011) show a non-monotonic influence of government
ownership on the cost of debt, as during the privatization process the cost of funds for firms is higher than
when they are either fully government or fully private owned. In the case of government acquisitions,
targets can exhibit a more positive reaction when governments purchase a larger stake in the company if
that provides access to new contracts and regulatory easement for the firm. Also, majority government
investment could benefit investee firm shareholders as higher ownership levels could overcome collective
action problems associated with widely dispersed small shareholdings. On the other hand, targets of
government acquisitions might react more negatively to majority than to minority share acquisitions, as

12
majority acquisitions increase the likelihood of managerial changes in favor of government officials and
of goal deviation from shareholder wealth to other government goals, which in turn would lead to higher
inefficiency and lower profitability. Therefore, the target’s reaction could differ given the level of
government involvement and I hypothesize:
Hypothesis 5: The targets’ reaction to government investment differs based on the proportion of
increase in government ownership.
2. Data Description
I collect all announcements of government purchases from the Thomson Reuters Securities Data
Company (SDC) Platinum database with buyside government involvement over the 1981-2011 period.
This includes transactions where either the acquirer or the acquirer immediate or ultimate parent, are
identified with a ‘government’ status. Governments own at least a 50% stake in acquirers flagged with a
‘government’ status and they are not publically traded firms. Governments also own at least a 50% stake
in acquirer ‘parents’ who according to SDC definitions own at least 50% in the acquirer. In this case the
actual acquirer can be either publically traded or have private ownership along with a government
majority stake ownership. I do not include transactions where a government entity represents just one of
the investors in an investor group. I restrict the sample to only completed or withdrawn deals and only
publically traded targets which yields 2,088 transactions worth about US$893 billion.8
I use SDC to collect additional information about the deal, including the announcement date, the
proportion of shares acquired and held by acquirer after the deal, whether it was eventually completed or
withdrawn, whether it was a stock, cash or mixed payment. I also gather SDC information about the
acquirer, acquirer parent and the target, including names, nations, Standard Industrial Classification (SIC)
codes, macro and industry level SDC classifications and public statuses (government, publicly traded,
privately held, subsidiary, joint venture) and SWF flag. Equity prices along with their related local
market indexes are obtained from Datastream. I further restrict the sample to cover the 1988-2011 period
due to a small number of government purchases and irregularities in Datastream prior to 1988.
Additionally, I check for consistency of Datastream data and exclude observations with a large number of
missing, zero or extreme returns around the time windows of interest. Observations where several
investment events occur for the same target on the same day are removed. I further require all sample
firms to be present in Worldscope, which is the source of accounting data for my sample. Economic
freedom variables are collected from the WorldBank Database of Political Institutions, the Economic
Freedom of the World publication, and the PRS Group’s ICRG databases (Appendix 1 provides
descriptions of variables and their sources). All data are winsorized at the top and bottom 1%. The final
8 Appendix 2 shows that the majority of government investments are in privately held firms.

13
sample used for event study analysis consists of 1,809 transactions (133 of which are eventually
withdrawn) in which a government acquirer purchases an equity stake in 1,474 unique target firms.
I classify government geographic ‘colors’ as foreign, if the acquirer’s parent nation is different
from the target nation and as domestic otherwise. The biggest challenge is to classify government investor
type ‘colors.’ I follow a combination of SDC status and macro industry identifications to classify
government investors into categories. Political government investors must be in the ‘Government and
Agencies’ SDC macro industry description on both the acquirer and the acquirer parent level. Within the
political group I identify political national government investors when both the acquirer and the acquirer
parent fall into the ‘National Agency’ or ‘National Government’ SDC industry categories. All other
entities, except for ‘Supranational’ under the ‘Government and Agencies’ macro industry are classified as
political local government investors and include city agencies, city governments, public administration,
regional agencies and regional governments. I complete the political group by including government
pension funds and identify those by manually searching and evaluating the deal and acquirer descriptions
for words like ‘social security,’ ‘pension fund,’ ‘pensioenfonds,’ ‘public employees,’ etc.
Financial government investors must be in ‘Financials’ SDC macro industry on both the
acquirer and acquirer parent level. Additionally, I include all the acquirers categorized as real estate
investors, SWFs and supranationals into my financial government investor group given the financial
nature of their investments. I differentiate between government banks and development banks, while both
are included in the government financial investor category. Development banks are identified by
searching and evaluating the deal and acquirer descriptions for words such as ‘development bank,’
‘development fund,’ ‘commonwealth development,’ ‘de Development,’ ‘development finance,’ etc. The
remaining entities in the financial government investor category are classified as other financial investors
and include alternative financial investment firms, asset managers, brokerages, credit institutions,
diversified financials, insurance and some government sponsored enterprises.
The final large group includes economic government investors which are represented by SOEs in
various fields and are predominantly industrial players who develop non-financial products and services.
SOE_Energy government economic investor group contains acquirers or acquirer parents that are a part of
the ‘Energy and Power’ SDC macro industry group and includes alternative energy sources, oil and gas,
petrochemicals, pipelines, power, as well as water and waste management. SOE_Industrial group
comprises of all acquirers classified by SDC as ‘Industrials’ and includes aerospace and defence,
automobiles and components, building construction and engineering, machinery, transportation and
infrastructure and other industrials. SOE_Materials group consists of all acquirers that fall into SDC
‘Materials’ macro industry classification and includes chemicals, construction materials, metals and
mining, paper and forest products and other materials. SOE_TelecomTech group includes acquirer from
14
‘Telecommunications’ and ‘High Technology’ SDC macro level industries and contains space and
satellites, telecommunication equipment and services, computers and peripherals, electronics, internet
services, IT consulting, semiconductors and software. SOE_Media group consists of government
acquirers that belong to the SDC ‘Media and Entertainment’ and ‘Consumer Services’ macro industry
groups and includes broadcasting, cable, motion pictures, publishing, professional, travel and educational
services. Finally, the SOE_Consumer group contains government acquirers from the following SDC
macro industry groups: ‘Consumer Staples,’ ‘Healthcare,’ and ‘Retail’ and includes household and
personal products, textiles and apparel, tobacco, livestock and agriculture products, healthcare services,
pharmaceuticals, automotive and food/beverage retailing.
The remaining government investor ‘color’ classifications are according to levels of economic
freedom and control. In order to evaluate the influence of economic freedom ‘color’ I classify government
investors according to either the likelihood and level of government expropriation or their left- or right-
wing nature. To uncover target shareholder reactions to different government investment control ‘colors’
I differentiate between majority purchases of over 50%, majority purchases between 50% and 10% and
minority government investment of below 10%. This minority investor definition is adopted from Faccio
(2006) and Bortolotti and Faccio (2009) who define large shareholders as anyone with a 10% or larger of
control rights.
2.1 Descriptive Statistics
The description of the sample is provided in multiple panels of Table 1, which present the overall
number and value of deals and various categorizations of the total. The number of deals is further broken
down by foreign and domestic acquisitions, as well as by the economic, political, or financial type of
government acquirer. Panel A breaks down government purchases by year. The sample of 1,809
government purchases has a total value of over US$ 501 billion (current dollars). About 569 transactions
(30% of total count) cover the crisis years of 2008-2010, which allows for a comparison of government
investments during and outside the 2008 financial crisis. Cross-border deals represent a third (659 deals,
36% of the sample) of the sample and on average account for about 40% of deals done in any given year,
with the exception of the crisis years of 2008 and 2009 when the number of cross-border deals declines
and the number of domestic deals dominates. Different types of government acquirers are well
represented, with 698 observations (39%) by economic (SOEs), 347 observations (19%) by political and
764 (42%) by financial arms of government.
*** Insert Table 1 about here ***
Panel B breaks down government purchases by ex post ownership stake. Governments purchase
minority stakes of above 0% and below 10% in 669 observations (37% of the sample). Their large
15
representation in this category hints to the changing nature of government investment, as they switch from
ownership block purchases to smaller stakes. There are 240 observations (13%) worth about US$143
billion (28%) where governments purchase majority ownership of 51% or higher. Out of those 98
observations (5%) represent full acquisitions by government. The tendency to purchase non-controlling
stakes is common for both foreign and domestic government acquirers; moreover, it is also common
among all government acquirer types. Government economic (SOE) acquirers are most active in deal
involving majority control (140 observations; 60% of majority purchases), followed by government
financial acquirers (81 observation; 32% of majority purchases) and a very few (19 observations) majority
purchases by government political acquirers.
Panel C describes government investment by target nation. US$ 403 billion (80%) is invested by
governments into the top 15 target nations lead by the investments in the United States (274 observations,
15% of the sample by count, for US$83 billion, 17% by value). Overall, the sample contains 68 investee
nations. Other countries attracting large government investments include the United Kingdom (15% by
value), Germany (8%), Switzerland (5%), and Austria (5%).
Panel D lists government acquirers’ domicile nations. US$ 412 (82%) is spent by the
governments of the top 15 acquirer nations, out of 69 total. The acquirers are evaluated at the ‘parent’
level, so the nation of the ultimate parent of the acquirer is considered. The ultimate parent either acts as
the acquirer or owns 51% or more of the acquirer. China is the largest government acquirer with 387
investments (21%) totaling over US$76 billion (15%). It is followed by France (11% by value), United
Arab Emirates (9%), the United States (8%), and the United Kingdom (7%). It is interesting to note that a
lot of small value deals happen in China, while a few very large deals dominate government purchases in
the United Kingdom.
Panel E presents investee firms’ industry classifications by 1-digit SIC code. The largest number
of government acquisitions is in the financial sector (SIC 6) with 575 observations (32%) worth over
US$197 billion (39%). This is followed by transportation and utilities (SIC 4), with 347 deals (19%)
worth over US$122 billion (25%); mining (SIC 1), with 200 deals (11%) worth US$96 (19%); and
manufacturing (SIC 2 and SIC 3) with 487 deals (27%) worth US$60 billion (12%).
Finally, Panel F describes the actual industries, based on the 4-digit SIC code, of the largest
government investment. US$ 240 billion (48%) of government purchases occur in just three main
industries – the financial sector (depository institutions), crude oil and natural gas, and electric and
telephone services sectors. The financial sector is further represented by commercial bank (5%),
investment advisory (4%), life insurance (2%) and personal credit segments (3%).
16
2.2 Variables
Table 2 provides descriptive statistics for continuous variables in Panel A, for pre-event investee
firm performance in Panel B, binary variables in Panel C, and correlations between variables in Panel D.
Full variable descriptions are provided in Appendix 1. Panel A describes government ownership and
target firm characteristics, as well as target performance six and twelve months before the acquisition
announcements. Panel A lists means, standard deviations, medians and 25th and 75
th percentiles.
Government investors purchase a 24% stake on average (12% median) and hold on average a 32% stake
(18% median) in a firm after the acquisition. Economic freedom indicator variables are presented next
and I expect government investors with low levels of economic freedom and, accordingly, higher levels
of political interference propensity to have a more negative influence on shareholder wealth and thus
expect a negative reaction for acquisition announcement involving such acquirers. Expropriation
measures the likelihood of government expropriation, where 0 denotes low risk and 12 denotes high risk.
Acquiring governments have, on average, a low level of expropriation with a 3.35 index average. The
following alternation economic freedom indicators are evaluated for robustness: Government Size (with a
mean of 5.47), which measure the degree to which a country relies on markets rather than government
budgets and where higher values mean lower government involvement on a scale from 0 to 10;
Autocracy/Democracy (with a mean of -3.75), which measures how autocratic or democratic a
government is on a scale from -10 to 10, where -10 denotes highly democratic and 10 denotes highly
autocratic governments; and Government Stability (with a mean of 5.18), measuring the number of years
the current government has been in power.
*** Insert Table 2 about here ***
The following standard firm level controls are included in the main regression: Size (computed as
a natural logarithm of $US current dollar total assets, with a mean of 13.5), Leverage (computed as a ratio
of debt-to-assets, with a mean of 64%), ROA (with a mean of 1% and median of 3%); and Tobin’s Q
(computed as [(market value + total assets – book value of equity)/total assets] and with a mean of 1.44).
Bates and Lemmon (2003) shows that target shareholders gain less when their firm is larger. According, I
expect larger firms to have lower gains around the news of government investment. I also expect less
leveraged and more profitable firms to evaluate any government interference as intruding and to react
more negatively during government acquisition announcements.
Controls for firm performance six month and one year prior to the government’s investment are
presented in Panel B. It provides mean and median market adjusted buy-and-hold returns, as well as their
significance levels. I expect weaker firms to have a more positive reaction around government acquisition
announcement and therefore expect a negative relationship between announcement reactions and prior
performance. Prior performance should control for firm-specific distress, as when governments likely step

17
in to provide bail-outs, but market adjusted buy-and-hold returns of firms in my sample are on average
positive, with 8% over the six months before and 16% over the year before the date of government stock
acquisitions. However, the median results suggest a few firms with extremely positive pre-investment
performance are present, as the median buy-and-hold returns are 1% six month before government
investment.
Panel C describes my binary variables and presents information regarding deal features,
consideration offered, and payment made, as well as government acquirer information. While it is
important to control for the firm’s prior performance as a proxy for firm-specific distress, special attention
also needs to be paid to periods of economic uncertainty, as government ownership could be associated
with a more pronounced certification effect of firm’s vitality during those times. Bank_crises (410 deals,
23%) and crisis_08_09 (492 deals, 27%) are both binary variables that take value of 1 during periods of
economy-wide distress. They correspond to the various banking crises defined by Laeven and Valencia
(2010) and the 2008-2010 financial crisis, respectively. Controls for banking crises and the years
associated with the financial crisis are present in all regressions. In robustness regressions I also control
for capital inflows – where the state investor purchases newly-issued shares, resulting in a capital infusing
for the issuing company – as these are more likely to be provided to firms in times of distress and in need
for cash. I identify capital inflows by searching the deal synopsis for phrases like ‘capital injection’ and
‘capital inflow’ and also flag all deals where the firm issues new shares. I identify 156 deals (9%) that are
capital inflows, which is a conservative measure, as the data is provided sporadically thus increasing both
Type 1 and Type 2 errors.
To test my second hypothesis I compare 659 (36%) cross-border versus the remaining 1150
(64%) domestic deals. I acknowledge the transfers of control between different government branches with
a Government-to-Government variable, where both the acquirer and the target are flagged with a
‘government’ status. While only one such deal exists, there are 282 deals (16%) where the government-
to-government pairs follow a wider SDC definition and besides the target and acquirer also include their
‘parent’ firms, who according to SDC own at least a 51% of the direct acquirer or target. I also control for
deals completed in the same industry, as those are more likely to be based on economic goals and not
pursuant to political agenda. Accordingly, I expect same industry deals to have a more positive
relationship with target stock price announcement reaction. 466 deals (22%) are done within the same 2-
digit SIC group between acquirer and target, but it grows to 629 deals (35%) when I extend the definition
to also include ‘parent’ firm industries. Further, about 47% of the sample consists of deals in the same
industry, when considering an even wider industry group classification by evaluating deals in the same 1-
digit SIC group and including the ‘parent.’

18
Panel C shows that the most typical way that governments invest is by buying common stock
(1587 deals, 88%), but they also attain stakes through warrants (186 deals, 10%) – which are mainly
connected with the 2008 US Troubled Asset Repurchase Program (TARP) – and to a much lesser extent
through convertible debt (31 deals, 2%). Further, I control for factors that have been shown in the
literature to affect the acquisition premium and returns. Loughran and Vijh (1997) show that targets
shareholders in stock-merger deals do not earn significantly positive returns, while those of cash-mergers
do. Bates and Lemmon (2003) show that US target acquisition announcement returns are negatively
associated with stock deals and withdrawn offers. Accordingly, I expect a negative association between
target stock reaction to the announcement of government investment and withdrawn deals (133 deal, 7%),
as well as stock deals (1190 deals, 66%). But I expect cash deals (588 deals, 33%) to be associated with
higher target equity returns around government investment announcements.
Panel C also provides information about government investors. I break up government investors
into three major groups based on their nature and objectives – political (347 deals, 19%), financial (764
deals, 42%) and economic (698 deals, 39%). The political group consists of national governments (264
deals, 15%), local governments (58 deals, 3%), and pension funds (25 deals, 1%). The financial group
consists of banks with government ownership (108 deals, 6%), development banks (49 deals, 3%),
government real estate investment arms (42 deals, 2%), supranationals (23 deals, 1%), such as the IMF,
and SWFs (164 deals, 9%) and finally other financial institutions with government ownership (378 deals,
21%). I also control for the legal origin of the acquiring government as LLSV (1997, 2000) show that
legal origin influences capital market development and dividend payout. 690 deals (38%) are completed
by acquirers (parents) from common law countries, which offer higher investor protection, with the
remaining 1,119 coming from civil law origin nations. In order to test Hypothesis 4, I evaluate the
political orientation of the acquiring government, as this proxies for economic freedom and in about half
the sample (892 deals, 49%) acquisitions are done by left-wind governments.
Correlations among variables are presented in Panel D of Table 2. It is interesting to note that
most government investments that received warrants in the sample are from TARP deals, as they are 92%
correlated and they were in a large part (63% correlation) issued by the political arms of the U.S. federal
government. The correlation table also confirms that acquirer and acquirer parent nation are typically the
same and hence are highly correlated on their common law status (84% correlation). These descriptive
statistics allow us to better understand the sample, while the event studies presented in the next section, as
well as the regression analysis in Section 4, test the predictions associated with these variables.

19
3. Event Study Results
I use a standard event-study methodology to calculate targets’ cumulative abnormal returns
(CARs) around the announcement of government acquisitions. Market adjusted returns are described
below, while market model returns are only presented in the tables. To estimate returns I use the
Datastream country specific U.S. dollar denominated total return index which is adjusted for dividends
and stock splits, to estimate returns and compute market model returns using data from day (-230) to day
(-30), where day (0) is the day of announcement of government acquisition in the closest competitor.
Only firms with trading data for a minimum of 100 days are included. I evaluate several event windows –
(0,+1), (-2,+2), (-5,+5), (-10, +10) – around the announcement, as well as pre-event (-10,-30) and post-
even (+10,+30) windows to check for any information leakages prior to or after the announcement. Event
study results allow a first look at target stock reaction to various government investments, and
accordingly my main dependent variable in the regressions, (-2,+2) CAR.
Table 3 shows targets’ stock price reactions to government investment and breaks it down by
geographical ‘colors’ based on foreign and domestic government investment. In general, targets exhibit a
significant positive reaction with a mean (median) of 2.48% (0.46%) for the (0,+1) window and 2.81%
(0.91%) for the (-2,+2) window. The result is similar for both foreign and domestic government
investment, but the scale is much larger for foreign investments with the significant returns of 5.05%
(1.33%) for the (0,+1) window and 6.28% (2.25%) for the (-2,+2) window as compared to smaller but
still significant stock reaction to domestic investments of 1.01% (0.22%) for the (0,+1) window and
0.82% (0.30%) for the (-2,+2) window. Target performance shortly after the event, for the (+10,+30)
window, is significantly negative at -1.60% (-1.26%) for all deals and similar for both foreign and
domestic acquisitions. Prior to government acquisition (-10, -30) the performance of domestic targets is
negative at -1.31% (-0.76%), but it is positive for foreign, at 3.11% (1.13%). Overall, the results in Table
3 support the claim of the first hypothesis that targets exhibit a stock reaction to government investment.
These results also support the second hypothesis as they show that target equity announcement reaction
differs according to the geographic ‘color’ of government investor, in other words according to whether
the government investor is foreign or domestic.
*** Insert Table 3 about here ***
Target equity reactions to investor type ‘colors’ are presented in Table 4 and provide a stark
contrast between target responses to investment by different government entities. For the (-2,+2) and
other short term windows the reaction is significantly negative for government investors from the political
group at -2.92% (-0.64%) but significantly positive for those from the financial group at 2.23% (-0.48%),
and overwhelmingly so for those from the economic group at 6.30% (2.36%). These preliminary results
20
show that the conflict generated by political and profit maximization goals hurts shareholder wealth, as
investors respond negatively to investments that would increase such conflict – such as investments by
the political arms of the government. On the other hand, shareholders welcome investment by
economically oriented groups, in particular the economic group that is comprised of SOEs. The reaction
to government financial investments is positive overall, but this group encompasses diverse government
investors. Some of these, such as development banks, are more likely to follow economic goals, while
others, such as other banks with government ownership or government real estate investors, might pursue
a political agenda.
*** Insert Table 4 about here ***
Table 5 breaks down target equity reaction by acquirer’s economic freedom ‘colors’ and
investment by countries with high or low levels of expropriation, as well as those with left- or right-wing
governments. When government investors are from countries with low levels of expropriation likelihood
target announcement reaction is much larger, at 4.63% (1.74%) for the (-2,+2) window, as compared to
that of high expropriation governments, at 1% (0.22%). Target performance shortly after the event, for the
(+10,+30) window, is more negative for investments by acquirers from nations with high expropriation
levels, at -2.26% (-1.73%), as compared to those with low expropriation levels at -0.85% (-0.87%). These
results show that target shareholders welcome investment that carries low levels of political interference,
but are more cautious when investment originates from a nation with high expropriation risk and therefore
high political interference tendencies and low levels of commitment to economic freedom. Table 5 also
examines if target equity reaction differs between investments from left- and right-wing governments.
Target pre-event performance in (-10,-30) window differs, with 1.69% (0.65%) for left-wing and -1.05%
(-0.75%) for right-wing government investments, but no other significant difference are found, as the
short-term reaction is positive in both cases.
*** Insert Table 5 about here ***
Table 6 disaggregates target equity reaction according to the level of control ‘color’ by
differentiating between majority and minority government investment. Table 6 disaggregates target equity
reaction according to the level of control ‘color’ by differentiating between majority purchases and
minority government purchases. Following Faccio (2006) and Bortolotti and Faccio (2009), I classify
minority government ownership as that below 10%. However, for firms with large shareholdings, where
several blockholders own over 10%, the majority owner is the one with ownership of 51% or larger.
Accordingly, I differentiate between majority purchases of over 50% and those between 50% and 10%.
The target equity reaction to majority (over 50%) government investments is significantly positive at
5.87% (2.84%) for the (-2,+2) window and keeps growing to 8.14% (5.5%) for the (-10,+10) window.
Opposite results are documented for minority government purchases, as target equity reaction is negative

21
and keeps getting more negative till -2.94% (-1.65%) for (-10,+10) window. Differences also exist in
target performance shortly before the event in window (-10,-30) as government majority investments
exhibit a positive performance of 0.69% (0,68%), but those of government minority investments produce
a negative return of 1.59% (1.59%). Also, while shortly after the performance in window (+10,+30), the
performance of government minority investments remains negative, that of government majority
investments is positive, though insignificant. Overall, Table 6 indicates that minority government
investment destroys target shareholder wealth, perhaps by exacerbating the conflict between political and
economic goals without the beneficial effects of government ownership – such as an implied debt
guarantee, cheaper financing and favorable regulation – which reveal themselves only at higher levels of
ownership.
*** Insert Table 6 about here ***
Finally, Table 7 provides target reactions to the news of increased government ownership during
and outside of periods of economic uncertainty and signifies the importance of controlling for periods of
economy-wide distress. The average target equity reaction to government investment during banking
crises is significantly negative: starting at -2.92% (-0.64%) for the (-2,+2) window and declining to -
6.43% (-3.57%) for the (-10,+10) window. On the other hand, the reaction to government investment
outside of banking crises is positive, at 2.23% (0.48%) for the (-2,+2) window. In case of banking crises,
target firm investors seem to worry that governments are likely to impose the same ideas that put the
country into a banking crisis onto them and to reduce shareholder wealth through tunneling. On the other
hand, the average target equity reactions to government investment during the 2008-2010 financial crisis
is significantly positive at 6.30% (2.36%) for the (-2,+2) window. This is much higher than for periods
outside of the 2008-2010 crisis, when the average target reaction is 3.48% (0.84%) for the (-2,+2)
window. Therefore, the certification effect and other benefits provided by government ownership during
the 2008 financial crisis must have outweighed other negative effects.
*** Insert Table 7 about here ***
Event study results suggest that in general stock price reactions of government investment targets
are positive around the acquisition announcement. But while stock price reactions are positive for
investments by foreign governments, by those government’s economic and financial arms, and those for
majority control, they are negative for investments by domestic governments, by government political
arms and for minority stake purchases. Also, firms react more positively to purchases by governments
where the expropriation risk is low. These results indicate that government investment associated with a
higher level of political inference, that is likely to exacerbate the conflict between political and profit
maximization goals, has a negative influence of shareholder wealth, while the opposite is true for
government investment where this conflict is outweighed by benefits from government certification,
22
cheaper financing and privileged contracts. The panel regressions in the next section allow for a closer
examination of government investor attributes or ‘colors’ on target stock reaction around acquisition
announcement.
4. Regression Results
I further examine the relationship between government investment and it’s different ‘colors’ and
target stock price announcement reaction in multivariate year fixed effects OLS regression analysis where
I control for target- and deal-specific characteristics. All regressions employ controls for industry and for
the nations of the target and the acquirer parent. I employ Newey-West standard errors adjusted for
heteroskedasticity and autocorrelation, as some firms are targets of government investment multiple times
in the sample. In all the regressions my dependent variable is the market adjusted target stock reaction
over a five-day window (-2,+2) around the government investment announcement. My variables of
interest pertain to various government investor ‘colors.’
Results for the effect of geographic ‘color’ and the influence of foreign or domestic government
investor on target equity announcement returns are presented in Table 8. Model 1 includes all deals in the
sample; Model 2 pertains only to foreign and Model 3 only to domestic deals. Model 1 shows that foreign
government investments are associated with significant target shareholder gains. The effect is
economically significant, as target shareholders gain 3.09% more when the government investor is
foreign. Model 1 reveals other factors that influence target equity reactions to government investment, in
particular, a strong positive relationship with overall government ownership both regarding the shares
acquired and previously owned. Further, as expected, deals involving stock payments, primarily by
publically listed SOEs reduce target shareholder wealth by -3.78% as compared to mixed stock-and-cash
payment deals. Finally, larger and more valuable (in terms of Tobin’s Q), firms react more negatively to
the news of government investment.
*** Insert Table 8 about here ***
Since Model 1 implies that the geographic ‘colors’ of government investors matter, I further
investigate the difference between foreign and domestic government acquirers. Models 2 and 3 in Table 8
show that target shareholder reaction is positively related to the size of the stake acquired for both foreign
and domestic government investments. Several significant differences between foreign and domestic
government investments also emerge. First, the average target equity announcement reaction is
significantly negative for of stock-swap mergers (-9.36%), but only for foreign government investments.
However, only in the case of domestic government investments target equity announcement returns are a
significant negative function of target size (-0.67%) and value (-0.58%), meaning that larger, more

23
profitable firms suffer from the escalated political-profit maximization conflict the most. Larger firms are
typically diversified and already carry a diversification discount due to the multitude of intra firm goals
(Laeven and Levine, 2007). Large firm shareholders are likely to have a more adverse reaction to
domestic government investment as they anticipate the imposition of additional political goals, which
could create conflict with profit maximization objectives and possibly make the difference amount
existing goals more apparent. A negative relationship (-4.48%) between target equity announcement
returns and domestic eventually-withdrawn deals suggests that either domestic withdrawals are somewhat
expected, possibly due the higher media coverage involving controversial government investments that
require regulatory approval, or that governments are more likely to withdraw their domestic investments
if the initial reaction is negative. Finally, only for domestic investments government-to-government deals
command a higher premium (by 2.53%), perhaps because governments within the same country tend to
overpay for their investments in other government entities or maybe the imposition of political agenda is
not going to increase given that an investee firm is already influenced by government.
Overall, Table 8 results support the second hypothesis and indicate that government investor
geographic ‘colors’ matter for target shareholder wealth. In particular, target shareholders in deals
involving foreign government investors earn 3.09% more, which suggests that foreign government
investors are more likely to be associated with the beneficial effects of government investment rather than
the conflict amplified by political agenda. Also, foreign and domestic government investments differ in
terms of other important factors that influence target announcement reactions.
Results for government investor type ‘color’ are presented in Table 9 where the binary variables
for political and financial government investors are included in the main regressions and contrasted with
the economic government investor groups. Model 1 includes all deals. Since significant differences
between foreign and domestic deals are documented in Table 8, Models 2 and 3 in Table 9 include only
foreign and only domestic deals respectively. Model 4 includes only investments by political arms of
government; Model 5 by financial and Model 6 by economic arms of government. Political government
investors are associated with significant negative target equity announcement returns of -3.02% overall.
Moreover, this relationship is only significant for domestic political government investors, as they are
linked with a -3.64% loss in target shareholder wealth. It is important to notice that political government
investors are associated with target shareholder losses even after controlling for domestic government
investors. These results highlight deleterious effect of government investment when a conflict between
political and profit maximization goals is created. Political arms of government, as expected, are more
likely than other government investors to impose a political agenda on target firms, which conflicts with
profit maximization and destroys shareholder wealth.
*** Insert Table 9 about here ***
24
Models 4-6 develop the results of Models 1 and 3 as they allow target stock announcement
reactionsto vary given a political, financial or economic government investor. Targets announcement
reaction is negatively associated with the higher percentage of shares purchased by political arms of
government (-0.14%), but it is positively linked to higher share purchases by financial (0.14%) and
economic (0.10%) arms of government. Several similarities exist between different government investors,
as for all of them stock deals are associated with a negative target reaction and also larger firms react
more negatively to the news of investment by political and economic arms of government. Intriguingly,
government-to-government deals earn a 8.79% higher target stock announcement reaction only for
purchases by government political investors. This again could be due either to with-in system
overpayment or a lower expectation to political goal imposition due to an already existing government
involvement in the target firm. Another interesting relationship is a positive (negative) association
between political (economic) government investors and eventually-withdrawn deals. Government
economic arms might be more likely to withdraw deals with a negative announcement reaction.
Alternatively, shareholders might have a better information on the likelihood of eventual withdrawal of
controversial government investments with high media coverage and welcome the eventual withdrawal of
government political investors who impose political agenda but lament the loss of beneficial effects of
government investment from economic arms of government.
To further examine the influence of political, financial and economic government investors on
target equity announcement reactions I evaluate subgroups that make up each government investor
category in Table 10. Model 1(a) includes political and financial government investors and Model 1(b)
political and economic government investors. Models 2(a, b) replicate Models 1 (a, b) respectively but
considering only foreign government investors. Similarly, Models 3 (a, b) replicate Models 1 (a, b)
respectively but considering only domestic government investors. Results for political government
investors echo those of Table 9, as branches included in the political category are associated with a
decline in shareholder wealth. More specifically, targets react most negatively to pension funds (-4.57%),
followed by national government (-3.46%). A further breakdown into foreign and domestic deals shows
that while foreign target shareholders are not significantly affected by any government investors,
domestic shareholders tend to lose the most from an investment by national governments (-4.41%),
followed by local governments (about -4.13%) and finally by pension funds (-3.58%). Results for groups
that comprise the financial and economic government investors differ by group but are not significant.
*** Insert Table 10 about here ***
Results for economic freedom ‘color’ of the acquiring government are presented in Table 11 and
Table 12. The variable of interest in Table 11 is Gov. Exprop, which is an index of government
expropriation, and in Table 12 it is Left, which is a binary variable identifying the acquiring government

25
as left-wing. Model 1 includes all deals; Models 2 includes foreign deals; Model 3 shows domestic deals;
Model 4 presents investments by political arms of government; Model 5 by financial and Model 6 by
economic arms of government. Higher levels of government expropriation and left-wing governments are
associated with increased levels of political interference, which intensifies the conflict with profit
maximization.
Table 11 shows that investments from governments with higher levels of expropriation are met
with negative target shareholder announcement reaction of -0.54%. This relationship is significant only
for domestic deals as target shareholders are likely to expect lower levels of interference in their
operations by foreign governments, regardless of the economic freedom policy of these investors. This
highlights higher benefits associated with foreign government investors who strive to avoid the
imposition of conflicting political goals to their foreign investors, while they still create this conflict in
their domestic investments. Interestingly, target shareholders exhibit a 0.85% positive reaction to
investment by governments with high levels of expropriation when the investment is completed by the
political arms of government, but a -0.82% negative reaction to investments by economic arms of
government that are more likely to expropriate assets.
*** Insert Table 11 about here ***
Likewise, Table 12 shows that investments by left-wing governments are met with negative target
shareholder announcement reaction of 2.14%. While target reaction is negative to left-wing government
investment in both foreign and domestic deals, the relationship is only significant is case of domestic
deals (-2.5%). A further breakdown into government investor types shows that the significance of this
relationship is primarily driven by political arms of government, as targets have a -6.31% negative
reaction to the news of investment by the political arms of left-wing governments. Overall, both Tables 11
and 12 show that higher likelihood of the political-profit maximization goals conflict is met with a more
negative target shareholder equity reaction. When this conflict is proxied by measures of economic
freedom of the acquiring government, this negative reaction is again specific to domestic deals.
*** Insert Table 12 about here ***
I further examine how the political-profit maximization goal conflict influences foreign and
domestic shareholder wealth given not only different types of government investors but also considering
whether they purchased majority or minority stakes in the target firm. Target equity announcement
reactions to different control ‘colors’ are presented in Table 13. Faccio (2006) and Bortolotti and Faccio
(2009) treat government ownership in access of 10% as majority ownership. Accordingly, I differentiate
between majority ownership above 50%, ownership between 50%-10% and minority ownership lower
than 10%. Model 1 includes all deals and the main variables of interest in it are: Majority Ownership
(>50%) and Majority Ownership (50%-10%), while the left out group is Minority Ownership (<10%).
26
Models 2 only includes deals where government ownership represents a majority control holding of 50%
or more, while Model 3 includes those with majority ownership between 50% and 10%, and Model 4
contains deals involving minority purchases lower than 10%. Overall, target equity announcement
reaction is positively related to government investment above 50% (7.27%) and also between 10% and
50% (2.20%). While governments may try to impose political agenda and create conflict with profit
maximization goals at all levels of ownership, at the higher levels of ownership benefits associated with
government investment outweigh the negative effects of political agenda.
*** Insert Table 13 about here ***
Model 1 in Table 13 also points to the deleterious effects of political investors on shareholder wealth,
as target equity announcement reaction associated with that type of investors is a negative -4.04%. But the
classification of government investments according to the ex-post ownership in Models 2-4 reveals
several important relationships. First, that political investors have a negative influence of -5.91% on
shareholder wealth for acquisitions of 50% to 10% interest and only domestically, as foreign government
investment is linked with a 5.05% positive shareholder reaction at that investment level. This supports
prior results which linked foreign government ownership to a positive target shareholder reaction.
Second, the disaggregated results reveal that target shareholders exhibit a -3.37% negative stock reaction
to the news of minority (below 10%) foreign government investment. Interestingly, this negative reaction
is mitigated by investments by foreign political and financial arms of government, as target shareholders
respond with a 3.57% and 2.69% positive reaction respectively. Target shareholder wealth increases when
foreign political and financial arms of government acquire minority stakes of below 10% by 6.94% and
6.06% respectively. Third, Model 2 indicates that target shareholders react positive to majority
government investments regardless of the government investor-type or geographic ‘colors,’ as neither the
foreign deal nor the political or financial investor indicators are significant.
5. Conclusions
Despite common misperceptions, governments are a large and growing class of investors. I
evaluate government investment in publicly traded companies in order to evaluate target shareholders’
reactions to different types of government investors. Government investment could benefit the target firm
through additional contracts and preferential regulation, as well as through the certification of a firm’s
vitality and an implied guarantee, which is associated with cheaper financing costs. On the other hand, as
the privatization literature points out, government ownership is likely to lead to lower profitability and
efficiency due to the conflict between political and profit maximization goals. I show that not all
government investors are alike. Government investors that are political, domestic, left-wing and more

27
likely to expropriate are associated with negative target announcement reactions, as they intensify the
political-profit maximization goal conflict. But other government investors, in particular foreign, those
from economic-SOE arms of the government, from right-wing governments and those less likely to
expropriate, benefit their investee firms, as the positive effects of their ownership outweigh any additional
conflict between the goals of politics and profit maximization. I also show that the benefits associated
with government investment are more likely to reveal themselves at higher ownership levels, while the
negative effects of political arms of government on shareholder wealth are stronger with minority stake
investments.
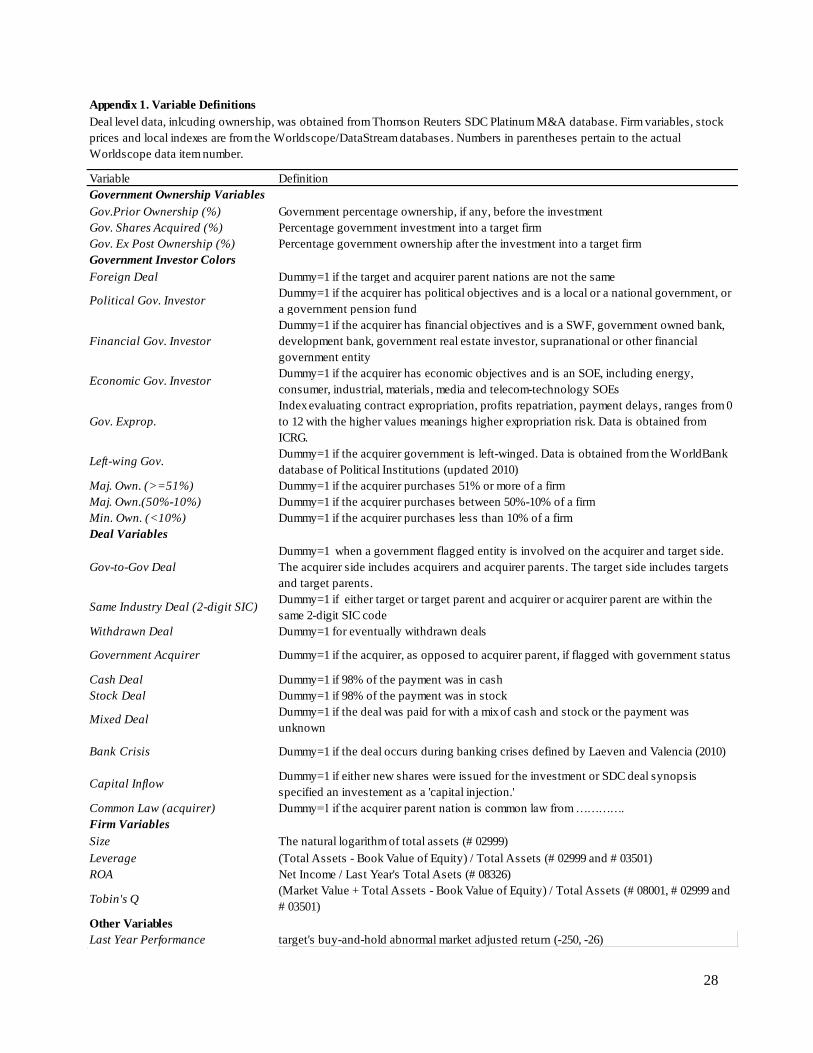
28
Appendix 1. Variable Definitions
Variable Definition
Government Ownership Variables
Gov.Prior Ownership (%) Government percentage ownership, if any, before the investment
Gov. Shares Acquired (%) Percentage government investment into a target firm
Gov. Ex Post Ownership (%) Percentage government ownership after the investment into a target firm
Government Investor Colors
Foreign Deal Dummy=1 if the target and acquirer parent nations are not the same
Political Gov. InvestorDummy=1 if the acquirer has political objectives and is a local or a national government, or
a government pension fund
Financial Gov. Investor
Dummy=1 if the acquirer has financial objectives and is a SWF, government owned bank,
development bank, government real estate investor, supranational or other financial
government entity
Economic Gov. InvestorDummy=1 if the acquirer has economic objectives and is an SOE, including energy,
consumer, industrial, materials, media and telecom-technology SOEs
Gov. Exprop.
Index evaluating contract expropriation, profits repatriation, payment delays, ranges from 0
to 12 with the higher values meanings higher expropriation risk. Data is obtained from
ICRG.
Left-wing Gov.Dummy=1 if the acquirer government is left-winged. Data is obtained from the WorldBank
database of Political Institutions (updated 2010)
Maj. Own. (>=51%) Dummy=1 if the acquirer purchases 51% or more of a firm
Maj. Own.(50%-10%) Dummy=1 if the acquirer purchases between 50%-10% of a firm
Min. Own. (<10%) Dummy=1 if the acquirer purchases less than 10% of a firm
Deal Variables
Gov-to-Gov Deal
Dummy=1 when a government flagged entity is involved on the acquirer and target side.
The acquirer side includes acquirers and acquirer parents. The target side includes targets
and target parents.
Same Industry Deal (2-digit SIC)Dummy=1 if either target or target parent and acquirer or acquirer parent are within the
same 2-digit SIC code
Withdrawn Deal Dummy=1 for eventually withdrawn deals
Government Acquirer Dummy=1 if the acquirer, as opposed to acquirer parent, if flagged with government status
Cash Deal Dummy=1 if 98% of the payment was in cash
Stock Deal Dummy=1 if 98% of the payment was in stock
Mixed DealDummy=1 if the deal was paid for with a mix of cash and stock or the payment was
unknown
Bank Crisis Dummy=1 if the deal occurs during banking crises defined by Laeven and Valencia (2010)
Capital InflowDummy=1 if either new shares were issued for the investment or SDC deal synopsis
specified an investement as a 'capital injection.'
Common Law (acquirer) Dummy=1 if the acquirer parent nation is common law from ………….
Firm Variables
Size The natural logarithm of total assets (# 02999)
Leverage (Total Assets - Book Value of Equity) / Total Assets (# 02999 and # 03501)
ROA Net Income / Last Year's Total Asets (# 08326)
Tobin's Q(Market Value + Total Assets - Book Value of Equity) / Total Assets (# 08001, # 02999 and
# 03501)
Other Variables
Last Year Performance target's buy-and-hold abnormal market adjusted return (-250, -26)
Deal level data, inlcuding ownership, was obtained from Thomson Reuters SDC Platinum M&A database. Firm variables, stock
prices and local indexes are from the Worldscope/DataStream databases. Numbers in parentheses pertain to the actual
Worldscope data item number.

29
References
Acharya, Viral V., and Nirupama Kulkarni, 2012, What saved the indian banking system: State ownership
or state guarantees?, The World Economy, Vol. 35, Issue 1, pp. 19-31, 2012.
Aitken, Brian J., and Ann E. Harrison, 1999, Do domestic firms benefit from direct foreign investment?
Evidence from venezuela, The American Economic Review 89, 605-618.
Arnold, Jens Matthias, and Beata S. Javorcik, 2009, Gifted kids or pushy parents? Foreign direct
investment and plant productivity in indonesia, Journal of International Economics 79, 42-53.
Bates, Thomas W., and Michael L. Lemmon, 2003, Breaking up is hard to do? An analysis of termination
fee provisions and merger outcomes, Journal of Financial Economics 69, 469-504.
Ben-Nasr, Hamdi, Narjess Boubakri, and Jean-Claude Cosset, 2012, The political determinants of the cost
of equity: Evidence from newly privatized firms, Journal of Accounting Research 50, 605-646.
Boardman, Anthony, Ruth Freedman, and Catherine Eckel, 1986, The price of government ownership: A
study of the domtar takeover, Journal of Public Economics 31, 269-285.
Borisova, Ginka, Veljko Fotak, Kateryna V. Holland, and William L. Megginson, 2012, Government
ownership and the cost of debt: Evidence from government investments in publicly traded firms, SSRN
eLibrary.
Borisova, Ginka, and William L. Megginson, 2011, Does government ownership affect the cost of debt?
Evidence from privatization, Review of Financial Studies 24, 2693-2737.
Bortolotti, Bernardo, and Mara Faccio, 2009, Government control of privatized firms, Review of
Financial Studies 22, 2907-2939.
Bortolotti, Bernardo, Marcella Fantini, and Carlo Scarpa, 2002, Why do governments privatize abroad?,
International Review of Finance 3, 131-161.
Bortolotti, Bernardo, Veljko Fotak, and William L. Megginson, 2011, Quiet leviathans: Sovereign wealth
investment, passivity, and value of firm, SSRN eLibrary.
Boubakri, Narjess, Jean-Claude Cosset, Omrane Guedhami, and Walid Saffar, 2011, The political
economy of residual state ownership in privatized firms: Evidence from emerging markets, Journal of
Corporate Finance 17, 244-258.
Brown, J. David, John S Earle, and Álmos Telegdy, 2006, The productivity effects of privatization:
Longitudinal estimates from hungary, romania, russia, and ukraine, Journal of Political Economy 114, 61-
99.
Chansog, Kim, Pantzalis Christos, and Park Jung Chul, 2012, Political geography and stock returns: The
value and risk implications of proximity to political power, Journal of Financial Economics 106, 196-228.
Chen, Xia, Jarrad Harford, and Kai Li, 2007, Monitoring: Which institutions matter?, Journal of Financial
Economics 86, 279-305.
30
D'Souza, Juliet, and William L. Megginson, 1999, The financial and operating performance of privatized
firms during the 1990s, The Journal of Finance 54, 1397-1438.
Dewenter, Kathryn L., Xi Han, and Paul H. Malatesta, 2010, Firm values and sovereign wealth fund
investments, Journal of Financial Economics 98, 256-278.
Dewenter, Kathryn L., and Paul H. Malatesta, 2001, State-owned and privately owned firms: An
empirical analysis of profitability, leverage, and labor intensity, The American Economic Review 91,
320-334.
Dinc, I. Serdar, and Nandini Gupta, 2011, The decision to privatize: Finance and politics, The Journal of
Finance 66, 241-269.
Duchin, Ran, and Denis Sosyura, 2012, The politics of government investment, Journal of Financial
Economics 106, 24-48.
Eckel, Catherine, Doug Eckel, and Vijay Singal, 1997, Privatization and efficiency: Industry effects of the
sale of british airways, Journal of Financial Economics 43, 275-298.
Estrin, Saul, Jan Hanousek, Evzen Kocenda, and Jan Svejnar, 2009, The effects of privatization and
ownership in transition economies, Journal of Economic Literature 47, 699-728.
Faccio, Mara, 2006, Politically connected firms, The American Economic Review 96, 369-386.
Faccio, Mara, Ronald W. Masulis, and John J. McConnell, 2006, Political connections and corporate
bailouts, The Journal of Finance 61, 2597-2635.
Ferreira, Miguel A., and Pedro Matos, 2008, The colors of investors’ money: The role of institutional
investors around the world, Journal of Financial Economics 88, 499-533.
Fisman, Raymond, 2001, Estimating the value of political connections, The American Economic Review
91, 1095-1102.
Giannetti, Mariassunta, and Luc Laeven, 2009, Pension reform, ownership structure, and corporate
governance: Evidence from a natural experiment, Review of Financial Studies 22, 4091-4127.
Gupta, Nandini, 2005, Partial privatization and firm performance, The Journal of Finance 60, 987-1015.
Houston, Joel F., Liangliang Jiang, Chen Lin, and Yue Ma, 2011, Political connections and the cost of
borrowing, SSRN eLibrary.
Julio, Brandon, and Youngsuk Yook, 2012, Political uncertainty and corporate investment cycles, The
Journal of Finance 67, 45-84.
Karolyi, George A., and Alvaro G. Taboada, 2011, The influence of government in cross-border bank
mergers, SSRN eLibrary.
Kotter, Jason, and Ugur Lel, 2011, Friends or foes? Target selection decisions of sovereign wealth funds
and their consequences, Journal of Financial Economics 101, 360-381.
31
La Porta, Rafael, Florencio Lopez-De-Silanes, Andrei Shleifer, and Robert W. Vishny, 1997, Legal
determinants of external finance, The Journal of Finance 52, 1131-1150.
La Porta, Rafael, Florencio Lopez-de-Silanes, Andrei Shleifer, and Robert W. Vishny, 2000, Agency
problems and dividend policies around the world, The Journal of Finance 55, 1-33.
Laeven, Luc A., and Fabian V. Valencia, 2010, Resolution of banking crises: The good, the bad, and the
ugly, SSRN eLibrary.
Laeven, Luc, and Ross Levine, 2007, Is there a diversification discount in financial conglomerates?,
Journal of Financial Economics 85, 331-367.
Liao, Chuan R., and George A. Karolyi, 2010, What is different about government-controlled acquirers in
cross-border deals?, SSRN eLibrary.
Loughran, Tim, and M. Vijh Anand, 1997, Do long-term shareholders benefit from corporate
acquisitions?, The Journal of Finance 52, 1765-1790.
Megginson, William L., Robert C. Nash, and Matthias Van Randenborgh, 1994, The financial and
operating performance of newly privatized firms: An international empirical analysis, The Journal of
Finance 49, 403-452.
Megginson, William L., and Jeffry M. Netter, 2001, From state to market: A survey of empirical studies
on privatization, Journal of Economic Literature 39, 321-389.
Norden, Lars, Peter Roosenboom, and Teng Wang, 2012, The impact of government intervention in
banks on corporate borrowers stock returns, SSRN eLibrary.
Rajan, Raghuram G., and Luigi Zingales, 2003, The great reversals: The politics of financial development
in the twentieth century, Journal of Financial Economics 69, 5-50.
Shleifer, A., 1998, State versus private ownership, The Journal of Economic Perspectives 12, 133-150.
Woidtke, Tracie, 2002, Agents watching agents?: Evidence from pension fund ownership and firm value,
Journal of Financial Economics 63, 99-131.

32
Table 1. Descriptive Statistic of Government Purchases
Panel A. Government Investment by Transaction Year (announced)
Year
Deal
Count
Deal Value
USD (mil)
Proportion of
Total (Count)
Proportion of
Total (Value) Cross_Border Domestic SOE Political Financial
1988 4 991 0% 0% 3 1 3 1 0
1989 15 4,686 1% 1% 11 4 8 1 6
1990 22 1,751 1% 0% 16 6 12 3 7
1991 46 3,731 3% 1% 22 24 17 9 20
1992 39 1,633 2% 0% 15 24 12 3 24
1993 68 3,529 4% 1% 33 35 28 8 32
1994 52 6,589 3% 1% 22 30 13 6 33
1995 37 6,167 2% 1% 11 26 10 6 21
1996 35 7,571 2% 2% 16 19 16 3 16
1997 61 7,061 3% 1% 33 28 26 6 29
1998 45 23,246 2% 5% 20 25 21 5 19
1999 70 8,888 4% 2% 22 48 34 11 25
2000 99 16,235 5% 3% 43 56 53 12 34
2001 61 19,749 3% 4% 25 36 26 5 30
2002 70 7,915 4% 2% 26 44 37 1 32
2003 92 6,219 5% 1% 26 66 45 6 41
2004 88 11,713 5% 2% 28 60 40 2 46
2005 100 31,801 6% 6% 34 66 41 8 51
2006 93 12,276 5% 2% 37 56 37 9 47
2007 116 74,850 6% 15% 46 70 49 9 58
2008 231 113,695 13% 23% 50 181 66 113 52
2009 261 102,727 14% 20% 75 186 77 106 78
2010 77 20,416 4% 4% 32 45 17 10 50
2011 27 8,438 1% 2% 13 14 10 4 13
Total 1809 501,876 100% 100% 659 1150 698 347 764
Panel B. Government Investment by Percentage Ownership
Stake
Acquired
Deal
Count
Deal Value
USD (mil)
Proportion of
Total (Count)
Proportion of
Total (Value) Cross_Border Domestic SOE Political Financial
No data 209 89,589 12% 18% 85 124 92 39 78
0%-10% 669 84,010 37% 17% 235 434 158 195 316
10%-25% 431 91,282 24% 18% 172 259 170 56 205
25%-50% 260 94,221 14% 19% 74 186 138 38 84
50%-75% 106 56,639 6% 11% 29 77 59 8 39
75%-99% 36 17,325 2% 3% 12 24 20 7 9
100% 98 68,811 5% 14% 52 46 61 4 33
Total 1809 501,876 100% 100% 659 1150 698 347 764
The table summarizes 1809 governement purchases. The sample covers the 1988-2011 period. Government investment is
broken down by year of transaction announcement in Panel A, by the percentage of government ownership in Panel B, by
country of the target in Panel C, by country of acquiror in Panel D, by 1 digit target SIC in Panel E and by full target SIC in
Panel F.

33
Panel C. Government Investment by Target Nation (top 15 by value)
Rank Target Nation
Deal
Count
Deal
Value
USD (mil)
Proportion
of Total
(Count)
Proportion
of Total
(Value)
Cross_
Border Domestic SOE Political Financial
1 United States 274 83,169 15% 17% 68 206 43 208 23
2 United Kingdom 58 76,313 3% 15% 51 7 25 11 22
3 Germany 58 40,780 3% 8% 30 28 25 10 23
4 Switzerland 14 26,008 1% 5% 9 5 5 2 7
5 Australia 92 23,595 5% 5% 66 26 52 0 40
6 Spain 45 19,910 2% 4% 22 23 26 3 16
7 Italy 13 19,699 1% 4% 3 10 9 0 4
8 Russian Fed 78 17,773 4% 4% 2 76 52 8 18
9 Canada 89 16,999 5% 3% 34 55 31 3 55
10 Hong Kong 117 14,813 6% 3% 117 0 53 2 62
11 Malaysia 81 13,284 4% 3% 15 66 19 20 42
12 Belgium 23 12,776 1% 3% 9 14 12 2 9
13 Brazil 29 12,747 2% 3% 13 16 14 2 13
14 Singapore 24 12,610 1% 3% 10 14 6 0 18
15 Norway 24 12,118 1% 2% 10 14 11 2 11
Total 1019 402,594 56% 80% 459 560 383 273 363
Others 790 99,282 44% 20% 200 590 315 74 401
Overall 1809 501,876 100% 100% 659 1150 698 347 764
Panel D. Government Investment by Acquiror (parent) Nation (top 15 by value)
Rank Target Nation
Deal
Count
Deal
Value
USD (mil)
Proportion
of Total
(Count)
Proportion
of Total
(Value)
Cross_
Border Domestic SOE Political Financial
1 China 387 76,180 21% 15% 175 212 236 5 146
2 France 173 56,393 10% 11% 82 91 79 13 81
3 Utd Arab Em 48 46,472 3% 9% 46 2 7 0 41
4 United States 240 38,020 13% 8% 34 206 7 204 29
5 United Kingdom 13 37,617 1% 7% 6 7 2 5 6
6 Singapore 99 31,364 5% 6% 85 14 3 7 89
7 Germany 41 23,778 2% 5% 13 28 11 11 19
8 Russian Fed 89 19,981 5% 4% 13 76 59 9 21
9 Qatar 18 15,436 1% 3% 15 3 1 0 17
10 Switzerland 9 13,934 0% 3% 4 5 6 2 1
11 Malaysia 76 12,280 4% 2% 10 66 20 21 35
12 Belgium 20 11,383 1% 2% 6 14 12 2 6
13 South Korea 29 10,422 2% 2% 4 25 7 3 19
14 Italy 20 10,162 1% 2% 10 10 13 0 7
15 Sweden 36 8,768 2% 2% 20 16 23 0 13
Total 1298 412,189 72% 82% 523 775 486 282 530
Others 511 89,687 28% 18% 136 375 212 65 234
Overall 1809 501,876 100% 100% 659 1150 698 347 764

34
Panel E. Government Investment by 1-digit SIC
SIC 1-
digit
code SIC Category
Deal
Count
Deal
Value
USD (mil)
Proportion
of Total
(Count)
Proportion
of Total
(Value)
Cross_
Border Domestic SOE Political Financial
0 Agriculture, forestry, and fishing 17 3,949 1% 1% 6 11 4 2 11
1 Mining, construction 200 96,133 11% 19% 130 70 125 8 67
2 Manufacturing (food, fabric, wood, chemical) 203 20,804 11% 4% 63 140 101 12 90
3
Manufacturing (rubber, plastic, glass, metal; boat,
rail, air equipment) 284 39,525 16% 8% 88 196 133 29 122
4
Transportation, communications, electric, gas, and
sanitary service 347 122,980 19% 25% 141 206 224 35 88
5 Trade (wholesale, retail) 57 4,013 3% 1% 16 41 22 7 28
6 Finance, insurance, and real estate 575 197,526 32% 39% 163 412 46 241 288
7
Services (hotel, beauty, funeral, computer, car
rental & repair, movie) 103 9,485 6% 2% 44 59 39 10 54
8
Services (doctor's offices, legal, schools
[elementary, secondary, colleges], religious,
accounting) 23 7,462 1% 1% 8 15 4 3 16
Overall 1809 501,876 100% 100% 659 1150 698 347 764
Panel F. Government Investment by SIC (top 10 by value)
Rank SIC Category
Deal
Count
Deal
Value
USD (mil)
Proportion
of Total
(Count)
Proportion
of Total
(Value)
Cross_
Border Domestic SOE Political Financial
1 depository institutions 153 79,924 8% 16% 58 95 5 28 120
2 crude petroleum and natural gas 69 67,543 4% 13% 42 27 51 2 16
3 electric services 119 55,345 7% 11% 35 84 99 3 17
4 telephone communications 51 36,750 3% 7% 27 24 30 10 11
5 national commercial banks 112 26,776 6% 5% 2 110 0 110 2
6 investment advice 20 18,270 1% 4% 8 12 0 4 16
7 personal credit institutions 9 14,955 0% 3% 2 7 0 3 6
8 life insurance 21 11,630 1% 2% 12 9 1 4 16
9 semiconductors and related devices 17 11,560 1% 2% 11 6 6 0 11
10 land subdividers and developers 61 10,163 3% 2% 22 39 12 6 43
Total 632 332,916 35% 66% 219 413 204 170 258
Others 1177 168,960 65% 34% 440 737 494 177 506
Overall 1809 501,876 100% 100% 659 1150 698 347 764

35
Table 2. Descriptive Statistics
Panel A. Continuous variables
Continuous Variables Count Mean Std. Dev. Median
25th
percentile
75th
percentile
Government Variables
Gov.Prior Ownership (%) 1,809 7% 18% 0% 0% 0%
Gov. Shares Acquired (%) 1,600 24% 27% 12% 6% 30%
Gov. Ex Post Ownership (%) 1,632 32% 31% 18% 8% 50%
Gov. Exprop. 1,806 8.65 1.98 8.15 7.42 10.67
Gov. Size 1,776 5.47 1.49 5.55 4.50 6.78
Gov. Autoc./Democ. 1,807 -3.75 7.43 -9.00 -10.00 7.00
Gov. Stability 1,389 5.18 5.13 3.00 2.00 8.00
Firm Variables
Size [ln(Total Assets)] 1,541 13.5 2.32 13.38 11.99 14.91
Total Assets 1,541 21,172,870 125,855,521 646,217 161,058 2,982,103
Leverage (Debt-to-Assets) 1,524 64% 0.29 66% 46% 89%
ROA 1,410 1% 0.15 3% 0% 6%
Tobin's Q 1,453 1.44 1.38 1.04 0.92 1.48
Market Value 1,482 1,832,383 6,655,736 146,433 12,498 675,911
Book Value of Equity 1,525 1,511,096 5,467,537 158,719 47,945 737,107
MTBV 1,505 2.27 3.66 1.39 0.81 2.40
Debt 1,524 19,902,627 122,159,122 368,051 73,417 2,133,354
Cash Over Total Aseets 1,049 34% 0.27 27% 13% 50%
Long Term Debt-to-Equity 1,494 83% 2.04 29% 1% 93%
Debt-to-Equity 1,525 163% 4.25 66% 17% 165%
Dividend Yield 1,430 2% 0.03 1% 0% 4% Quick Ratio 1,071 2.61 8.24 0.89 0.55 1.49
Panel B. Pre-Announcement Performance (6 and 12 monthes back)
Buy-and-Hold Returns (using
country specific indices)N
Positive :
Negative
Mean
Compound AR
Patell Z p-
value
Median
CAR
Signed Rank
p-value
BHAR (-150,-26) 1,754 902:852 8% <.0001 1% 0.013
BHAR (-250,-26) 1,694 814:880 16% <.0001 -2% 0.781
This table present government ownership, rival and target accounting information and deal identification. Continuous
variables are presented in Panel A and the table describes the number, mean, standard deviation, median, 25th and 75th
percentile for each. Binary variables are presented in Panel B. The sample covers 1988-2010.

36
Table 2. continued
Panel C. Binary Variables
Count Yes (1) Yes(%)
Deal Variables 1809
Bank_crisis 410 23%
Crisis _08-09 492 27%
Capital Inflow 156 9%
Foreign 659 36%
Gov-to-Gov Deal (direct) 1 0%
Gov-to-Gov Deal 282 16%
target_commonlaw 896 50%
Same 2-digit SIC: Acquirer/Target 466 26%
Same 2-digit SIC: Acquirer or Acquirer Parent/Target or Target Parent 629 35%
Same 1-digit SIC: Acquirer/Target 702 39%
Same 1-digit SIC: Acquirer or Acquirer Parent/Target or Target Parent 851 47%
Consideration Offered Variables 1809
Warrants 186 10%
Convertible Debt 38 2%
Stock 1587 88%
Variables that influence acquistion premium 1809
Withdrawn 133 7%
cash_deal 588 33%
stock_deal 31 2%
mixed_deal 1190 66%
Government Investor Variables 1809
Political Gov. Investor 347 19%
gov_national 264 15%
gov_local 58 3%
pension_fund 25 1%
Financial Gov. Investor 764 42%
financial_bank 108 6%
development_bank 49 3%
financial_real estate 42 2%
supranational 23 1%
SWF 164 9%
financial_other 378 21%
Economic Gov. Investor 698 39%
SOE_Energy 269 15%
SOE_Industrial 119 7%
SOE_Materials 114 6%
SOE_TelecomTech 99 5%
SOE_Media 40 2%
SOE_Consumer 57 3%
Acquirer_Gov 881 49%
Acquiror_commonlaw 796 44%
Acquiror_parent_commonlaw 690 38% Left-wing Gov. 892 49%
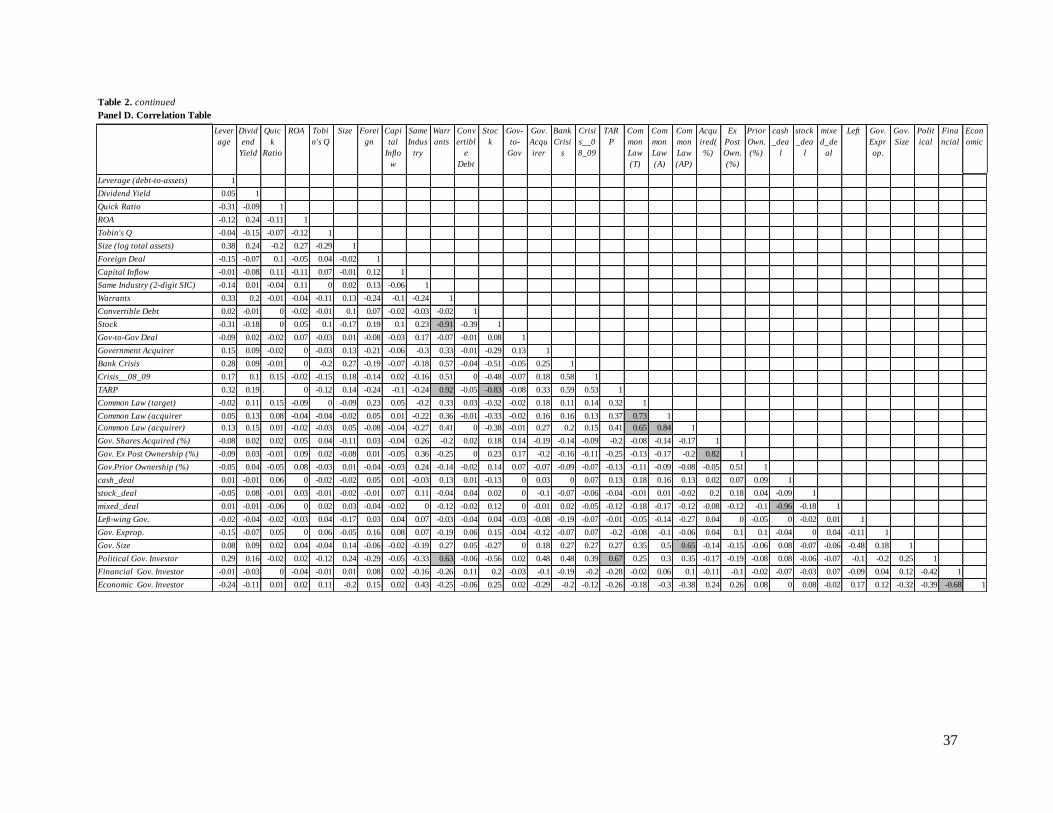
37
Table 2. continued
Panel D. Correlation Table
Lever
age
Divid
end
Yield
Quic
k
Ratio
ROA Tobi
n's Q
Size Forei
gn
Capi
tal
Inflo
w
Same
Indus
try
Warr
ants
Conv
ertibl
e
Debt
Stoc
k
Gov-
to-
Gov
Gov.
Acqu
irer
Bank
Crisi
s
Crisi
s__0
8_09
TAR
P
Com
mon
Law
(T)
Com
mon
Law
(A)
Com
mon
Law
(AP)
Acqu
ired(
%)
Ex
Post
Own.
(%)
Prior
Own.
(%)
cash
_dea
l
stock
_dea
l
mixe
d_de
al
Left Gov.
Expr
op.
Gov.
Size
Polit
ical
Fina
ncial
Econ
omic
Leverage (debt-to-assets) 1
Dividend Yield 0.05 1
Quick Ratio -0.31 -0.09 1
ROA -0.12 0.24 -0.11 1
Tobin's Q -0.04 -0.15 -0.07 -0.12 1
Size (log total assets) 0.38 0.24 -0.2 0.27 -0.29 1
Foreign Deal -0.15 -0.07 0.1 -0.05 0.04 -0.02 1
Capital Inflow -0.01 -0.08 0.11 -0.11 0.07 -0.01 0.12 1
Same Industry (2-digit SIC) -0.14 0.01 -0.04 0.11 0 0.02 0.13 -0.06 1
Warrants 0.33 0.2 -0.01 -0.04 -0.11 0.13 -0.24 -0.1 -0.24 1
Convertible Debt 0.02 -0.01 0 -0.02 -0.01 0.1 0.07 -0.02 -0.03 -0.02 1
Stock -0.31 -0.18 0 0.05 0.1 -0.17 0.19 0.1 0.23 -0.91 -0.39 1
Gov-to-Gov Deal -0.09 0.02 -0.02 0.07 -0.03 0.01 -0.08 -0.03 0.17 -0.07 -0.01 0.08 1
Government Acquirer 0.15 0.09 -0.02 0 -0.03 0.13 -0.21 -0.06 -0.3 0.33 -0.01 -0.29 0.13 1
Bank Crisis 0.28 0.09 -0.01 0 -0.2 0.27 -0.19 -0.07 -0.18 0.57 -0.04 -0.51 -0.05 0.25 1
Crisis__08_09 0.17 0.1 0.15 -0.02 -0.15 0.18 -0.14 0.02 -0.16 0.51 0 -0.48 -0.07 0.18 0.58 1
TARP 0.32 0.19 . 0 -0.12 0.14 -0.24 -0.1 -0.24 0.92 -0.05 -0.83 -0.08 0.33 0.59 0.53 1
Common Law (target) -0.02 0.11 0.15 -0.09 0 -0.09 0.23 0.05 -0.2 0.33 0.03 -0.32 -0.02 0.18 0.11 0.14 0.32 1
Common Law (acquirer
(direct))
0.05 0.13 0.08 -0.04 -0.04 -0.02 0.05 0.01 -0.22 0.36 -0.01 -0.33 -0.02 0.16 0.16 0.13 0.37 0.73 1
Common Law (acquirer) 0.13 0.15 0.01 -0.02 -0.03 0.05 -0.08 -0.04 -0.27 0.41 0 -0.38 -0.01 0.27 0.2 0.15 0.41 0.65 0.84 1
Gov. Shares Acquired (%) -0.08 0.02 0.02 0.05 0.04 -0.11 0.03 -0.04 0.26 -0.2 0.02 0.18 0.14 -0.19 -0.14 -0.09 -0.2 -0.08 -0.14 -0.17 1
Gov. Ex Post Ownership (%) -0.09 0.03 -0.01 0.09 0.02 -0.08 0.01 -0.05 0.36 -0.25 0 0.23 0.17 -0.2 -0.16 -0.11 -0.25 -0.13 -0.17 -0.2 0.82 1
Gov.Prior Ownership (%) -0.05 0.04 -0.05 0.08 -0.03 0.01 -0.04 -0.03 0.24 -0.14 -0.02 0.14 0.07 -0.07 -0.09 -0.07 -0.13 -0.11 -0.09 -0.08 -0.05 0.51 1
cash_deal 0.01 -0.01 0.06 0 -0.02 -0.02 0.05 0.01 -0.03 0.13 0.01 -0.13 0 0.03 0 0.07 0.13 0.18 0.16 0.13 0.02 0.07 0.09 1
stock_deal -0.05 0.08 -0.01 0.03 -0.01 -0.02 -0.01 0.07 0.11 -0.04 0.04 0.02 0 -0.1 -0.07 -0.06 -0.04 -0.01 0.01 -0.02 0.2 0.18 0.04 -0.09 1
mixed_deal 0.01 -0.01 -0.06 0 0.02 0.03 -0.04 -0.02 0 -0.12 -0.02 0.12 0 -0.01 0.02 -0.05 -0.12 -0.18 -0.17 -0.12 -0.08 -0.12 -0.1 -0.96 -0.18 1
Left-wing Gov. -0.02 -0.04 -0.02 -0.03 0.04 -0.17 0.03 0.04 0.07 -0.03 -0.04 0.04 -0.03 -0.08 -0.19 -0.07 -0.01 -0.05 -0.14 -0.27 0.04 0 -0.05 0 -0.02 0.01 1
Gov. Exprop. -0.15 -0.07 0.05 0 0.06 -0.05 0.16 0.08 0.07 -0.19 0.06 0.15 -0.04 -0.12 -0.07 0.07 -0.2 -0.08 -0.1 -0.06 0.04 0.1 0.1 -0.04 0 0.04 -0.11 1
Gov. Size 0.08 0.09 0.02 0.04 -0.04 0.14 -0.06 -0.02 -0.19 0.27 0.05 -0.27 0 0.18 0.27 0.27 0.27 0.35 0.5 0.65 -0.14 -0.15 -0.06 0.08 -0.07 -0.06 -0.48 0.18 1
Political Gov. Investor 0.29 0.16 -0.02 0.02 -0.12 0.24 -0.29 -0.05 -0.33 0.63 -0.06 -0.56 0.02 0.48 0.48 0.39 0.67 0.25 0.3 0.35 -0.17 -0.19 -0.08 0.08 -0.06 -0.07 -0.1 -0.2 0.25 1
Financial Gov. Investor -0.01 -0.03 0 -0.04 -0.01 0.01 0.08 0.02 -0.16 -0.26 0.11 0.2 -0.03 -0.1 -0.19 -0.2 -0.28 -0.02 0.06 0.1 -0.11 -0.1 -0.02 -0.07 -0.03 0.07 -0.09 0.04 0.12 -0.42 1
Economic Gov. Investor -0.24 -0.11 0.01 0.02 0.11 -0.2 0.15 0.02 0.43 -0.25 -0.06 0.25 0.02 -0.29 -0.2 -0.12 -0.26 -0.18 -0.3 -0.38 0.24 0.26 0.08 0 0.08 -0.02 0.17 0.12 -0.32 -0.39 -0.68 1
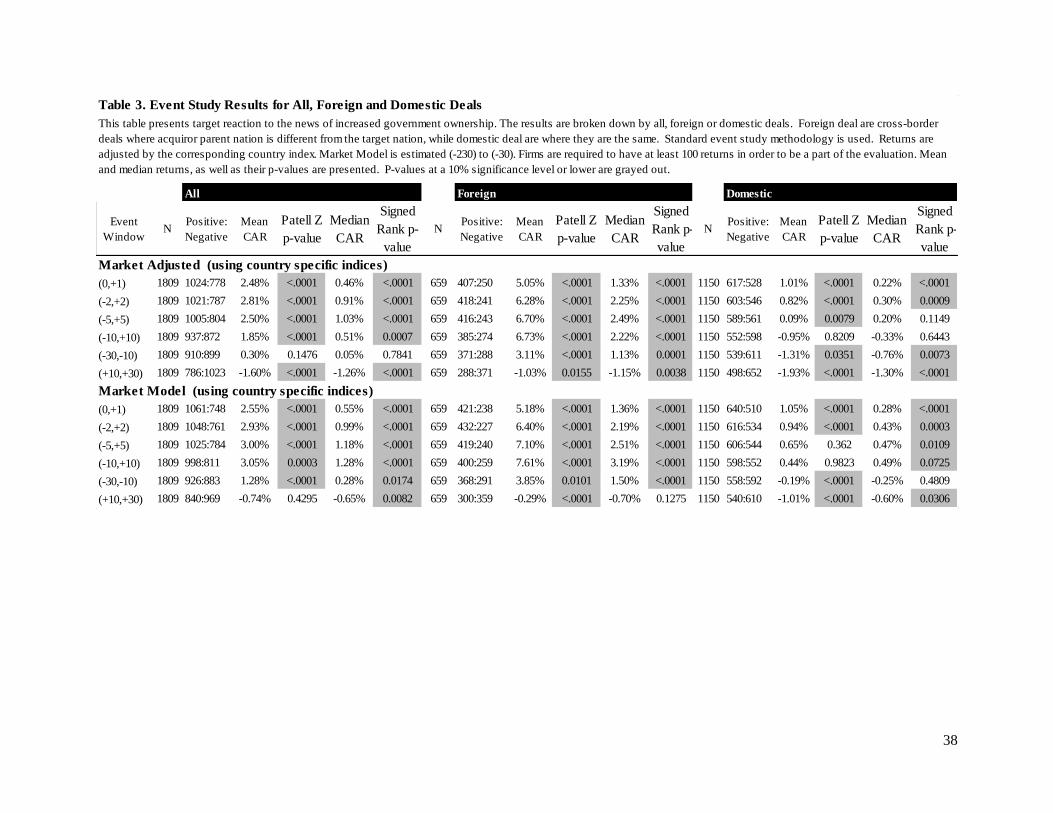
38
Table 3. Event Study Results for All, Foreign and Domestic Deals
All Foreign Domestic
Event
WindowN
Positive:
Negative
Mean
CAR
Patell Z
p-value
Median
CAR
Signed
Rank p-
value
NPositive:
Negative
Mean
CAR
Patell Z
p-value
Median
CAR
Signed
Rank p-
value
NPositive:
Negative
Mean
CAR
Patell Z
p-value
Median
CAR
Signed
Rank p-
value
Market Adjusted (using country specific indices)
(0,+1) 1809 1024:778 2.48% <.0001 0.46% <.0001 659 407:250 5.05% <.0001 1.33% <.0001 1150 617:528 1.01% <.0001 0.22% <.0001
(-2,+2) 1809 1021:787 2.81% <.0001 0.91% <.0001 659 418:241 6.28% <.0001 2.25% <.0001 1150 603:546 0.82% <.0001 0.30% 0.0009
(-5,+5) 1809 1005:804 2.50% <.0001 1.03% <.0001 659 416:243 6.70% <.0001 2.49% <.0001 1150 589:561 0.09% 0.0079 0.20% 0.1149
(-10,+10) 1809 937:872 1.85% <.0001 0.51% 0.0007 659 385:274 6.73% <.0001 2.22% <.0001 1150 552:598 -0.95% 0.8209 -0.33% 0.6443
(-30,-10) 1809 910:899 0.30% 0.1476 0.05% 0.7841 659 371:288 3.11% <.0001 1.13% 0.0001 1150 539:611 -1.31% 0.0351 -0.76% 0.0073
(+10,+30) 1809 786:1023 -1.60% <.0001 -1.26% <.0001 659 288:371 -1.03% 0.0155 -1.15% 0.0038 1150 498:652 -1.93% <.0001 -1.30% <.0001
Market Model (using country specific indices)
(0,+1) 1809 1061:748 2.55% <.0001 0.55% <.0001 659 421:238 5.18% <.0001 1.36% <.0001 1150 640:510 1.05% <.0001 0.28% <.0001
(-2,+2) 1809 1048:761 2.93% <.0001 0.99% <.0001 659 432:227 6.40% <.0001 2.19% <.0001 1150 616:534 0.94% <.0001 0.43% 0.0003
(-5,+5) 1809 1025:784 3.00% <.0001 1.18% <.0001 659 419:240 7.10% <.0001 2.51% <.0001 1150 606:544 0.65% 0.362 0.47% 0.0109
(-10,+10) 1809 998:811 3.05% 0.0003 1.28% <.0001 659 400:259 7.61% <.0001 3.19% <.0001 1150 598:552 0.44% 0.9823 0.49% 0.0725
(-30,-10) 1809 926:883 1.28% <.0001 0.28% 0.0174 659 368:291 3.85% 0.0101 1.50% <.0001 1150 558:592 -0.19% <.0001 -0.25% 0.4809
(+10,+30) 1809 840:969 -0.74% 0.4295 -0.65% 0.0082 659 300:359 -0.29% <.0001 -0.70% 0.1275 1150 540:610 -1.01% <.0001 -0.60% 0.0306
This table presents target reaction to the news of increased government ownership. The results are broken down by all, foreign or domestic deals. Foreign deal are cross-border
deals where acquiror parent nation is different from the target nation, while domestic deal are where they are the same. Standard event study methodology is used. Returns are
adjusted by the corresponding country index. Market Model is estimated (-230) to (-30). Firms are required to have at least 100 returns in order to be a part of the evaluation. Mean
and median returns, as well as their p-values are presented. P-values at a 10% significance level or lower are grayed out.
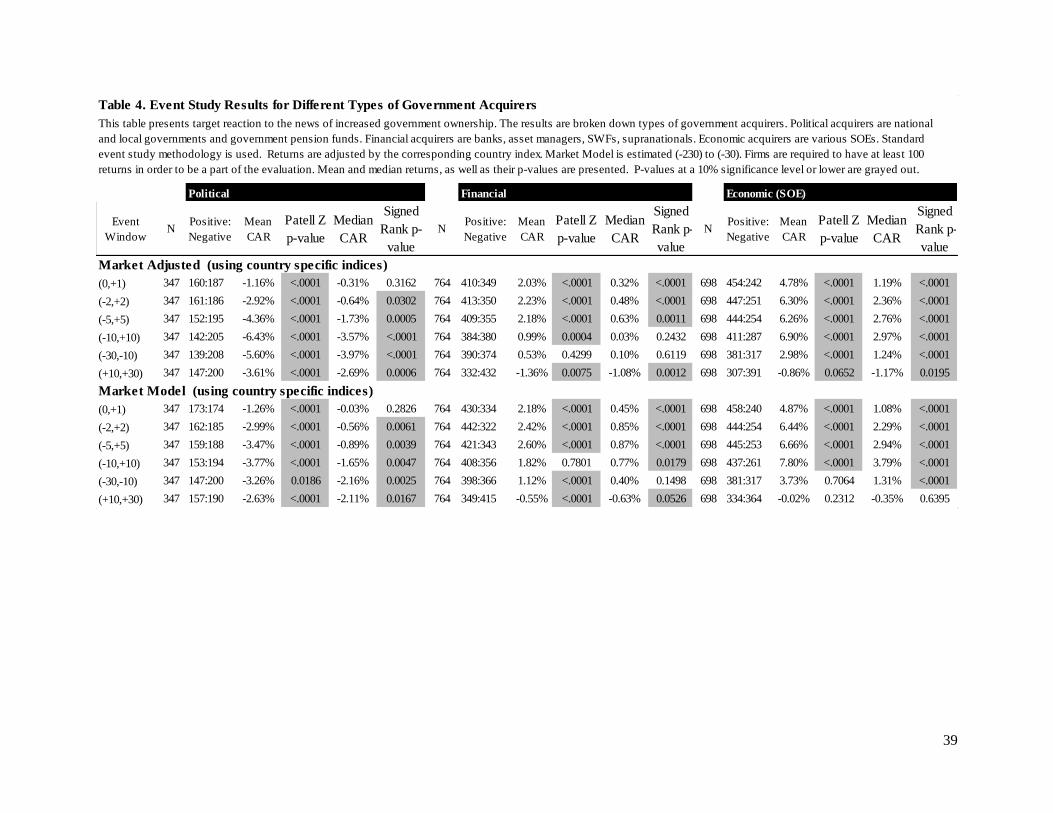
39
Table 4. Event Study Results for Different Types of Government Acquirers
Political Financial Economic (SOE)
Event
WindowN
Positive:
Negative
Mean
CAR
Patell Z
p-value
Median
CAR
Signed
Rank p-
value
NPositive:
Negative
Mean
CAR
Patell Z
p-value
Median
CAR
Signed
Rank p-
value
NPositive:
Negative
Mean
CAR
Patell Z
p-value
Median
CAR
Signed
Rank p-
value
Market Adjusted (using country specific indices)
(0,+1) 347 160:187 -1.16% <.0001 -0.31% 0.3162 764 410:349 2.03% <.0001 0.32% <.0001 698 454:242 4.78% <.0001 1.19% <.0001
(-2,+2) 347 161:186 -2.92% <.0001 -0.64% 0.0302 764 413:350 2.23% <.0001 0.48% <.0001 698 447:251 6.30% <.0001 2.36% <.0001
(-5,+5) 347 152:195 -4.36% <.0001 -1.73% 0.0005 764 409:355 2.18% <.0001 0.63% 0.0011 698 444:254 6.26% <.0001 2.76% <.0001
(-10,+10) 347 142:205 -6.43% <.0001 -3.57% <.0001 764 384:380 0.99% 0.0004 0.03% 0.2432 698 411:287 6.90% <.0001 2.97% <.0001
(-30,-10) 347 139:208 -5.60% <.0001 -3.97% <.0001 764 390:374 0.53% 0.4299 0.10% 0.6119 698 381:317 2.98% <.0001 1.24% <.0001
(+10,+30) 347 147:200 -3.61% <.0001 -2.69% 0.0006 764 332:432 -1.36% 0.0075 -1.08% 0.0012 698 307:391 -0.86% 0.0652 -1.17% 0.0195
Market Model (using country specific indices)
(0,+1) 347 173:174 -1.26% <.0001 -0.03% 0.2826 764 430:334 2.18% <.0001 0.45% <.0001 698 458:240 4.87% <.0001 1.08% <.0001
(-2,+2) 347 162:185 -2.99% <.0001 -0.56% 0.0061 764 442:322 2.42% <.0001 0.85% <.0001 698 444:254 6.44% <.0001 2.29% <.0001
(-5,+5) 347 159:188 -3.47% <.0001 -0.89% 0.0039 764 421:343 2.60% <.0001 0.87% <.0001 698 445:253 6.66% <.0001 2.94% <.0001
(-10,+10) 347 153:194 -3.77% <.0001 -1.65% 0.0047 764 408:356 1.82% 0.7801 0.77% 0.0179 698 437:261 7.80% <.0001 3.79% <.0001
(-30,-10) 347 147:200 -3.26% 0.0186 -2.16% 0.0025 764 398:366 1.12% <.0001 0.40% 0.1498 698 381:317 3.73% 0.7064 1.31% <.0001
(+10,+30) 347 157:190 -2.63% <.0001 -2.11% 0.0167 764 349:415 -0.55% <.0001 -0.63% 0.0526 698 334:364 -0.02% 0.2312 -0.35% 0.6395
This table presents target reaction to the news of increased government ownership. The results are broken down types of government acquirers. Political acquirers are national
and local governments and government pension funds. Financial acquirers are banks, asset managers, SWFs, supranationals. Economic acquirers are various SOEs. Standard
event study methodology is used. Returns are adjusted by the corresponding country index. Market Model is estimated (-230) to (-30). Firms are required to have at least 100
returns in order to be a part of the evaluation. Mean and median returns, as well as their p-values are presented. P-values at a 10% significance level or lower are grayed out.
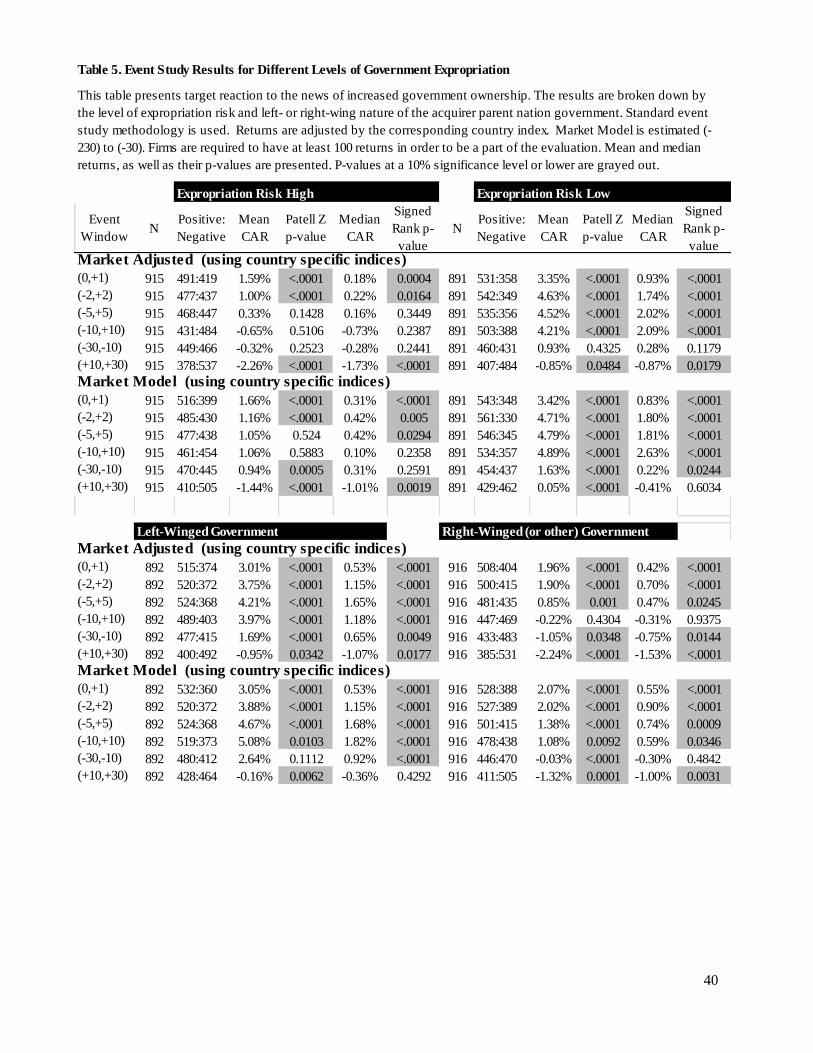
40
Table 5. Event Study Results for Different Levels of Government Expropriation
Expropriation Risk High Expropriation Risk Low
Event
WindowN
Positive:
Negative
Mean
CAR
Patell Z
p-value
Median
CAR
Signed
Rank p-
value
NPositive:
Negative
Mean
CAR
Patell Z
p-value
Median
CAR
Signed
Rank p-
valueMarket Adjusted (using country specific indices)
(0,+1) 915 491:419 1.59% <.0001 0.18% 0.0004 891 531:358 3.35% <.0001 0.93% <.0001
(-2,+2) 915 477:437 1.00% <.0001 0.22% 0.0164 891 542:349 4.63% <.0001 1.74% <.0001
(-5,+5) 915 468:447 0.33% 0.1428 0.16% 0.3449 891 535:356 4.52% <.0001 2.02% <.0001
(-10,+10) 915 431:484 -0.65% 0.5106 -0.73% 0.2387 891 503:388 4.21% <.0001 2.09% <.0001
(-30,-10) 915 449:466 -0.32% 0.2523 -0.28% 0.2441 891 460:431 0.93% 0.4325 0.28% 0.1179
(+10,+30) 915 378:537 -2.26% <.0001 -1.73% <.0001 891 407:484 -0.85% 0.0484 -0.87% 0.0179
Market Model (using country specific indices)
(0,+1) 915 516:399 1.66% <.0001 0.31% <.0001 891 543:348 3.42% <.0001 0.83% <.0001
(-2,+2) 915 485:430 1.16% <.0001 0.42% 0.005 891 561:330 4.71% <.0001 1.80% <.0001
(-5,+5) 915 477:438 1.05% 0.524 0.42% 0.0294 891 546:345 4.79% <.0001 1.81% <.0001
(-10,+10) 915 461:454 1.06% 0.5883 0.10% 0.2358 891 534:357 4.89% <.0001 2.63% <.0001
(-30,-10) 915 470:445 0.94% 0.0005 0.31% 0.2591 891 454:437 1.63% <.0001 0.22% 0.0244
(+10,+30) 915 410:505 -1.44% <.0001 -1.01% 0.0019 891 429:462 0.05% <.0001 -0.41% 0.6034
Left-Winged Government Right-Winged (or other) Government
Market Adjusted (using country specific indices)
(0,+1) 892 515:374 3.01% <.0001 0.53% <.0001 916 508:404 1.96% <.0001 0.42% <.0001
(-2,+2) 892 520:372 3.75% <.0001 1.15% <.0001 916 500:415 1.90% <.0001 0.70% <.0001
(-5,+5) 892 524:368 4.21% <.0001 1.65% <.0001 916 481:435 0.85% 0.001 0.47% 0.0245
(-10,+10) 892 489:403 3.97% <.0001 1.18% <.0001 916 447:469 -0.22% 0.4304 -0.31% 0.9375
(-30,-10) 892 477:415 1.69% <.0001 0.65% 0.0049 916 433:483 -1.05% 0.0348 -0.75% 0.0144
(+10,+30) 892 400:492 -0.95% 0.0342 -1.07% 0.0177 916 385:531 -2.24% <.0001 -1.53% <.0001
Market Model (using country specific indices)
(0,+1) 892 532:360 3.05% <.0001 0.53% <.0001 916 528:388 2.07% <.0001 0.55% <.0001
(-2,+2) 892 520:372 3.88% <.0001 1.15% <.0001 916 527:389 2.02% <.0001 0.90% <.0001
(-5,+5) 892 524:368 4.67% <.0001 1.68% <.0001 916 501:415 1.38% <.0001 0.74% 0.0009
(-10,+10) 892 519:373 5.08% 0.0103 1.82% <.0001 916 478:438 1.08% 0.0092 0.59% 0.0346
(-30,-10) 892 480:412 2.64% 0.1112 0.92% <.0001 916 446:470 -0.03% <.0001 -0.30% 0.4842
(+10,+30) 892 428:464 -0.16% 0.0062 -0.36% 0.4292 916 411:505 -1.32% 0.0001 -1.00% 0.0031
This table presents target reaction to the news of increased government ownership. The results are broken down by
the level of expropriation risk and left- or right-wing nature of the acquirer parent nation government. Standard event
study methodology is used. Returns are adjusted by the corresponding country index. Market Model is estimated (-
230) to (-30). Firms are required to have at least 100 returns in order to be a part of the evaluation. Mean and median
returns, as well as their p-values are presented. P-values at a 10% significance level or lower are grayed out.
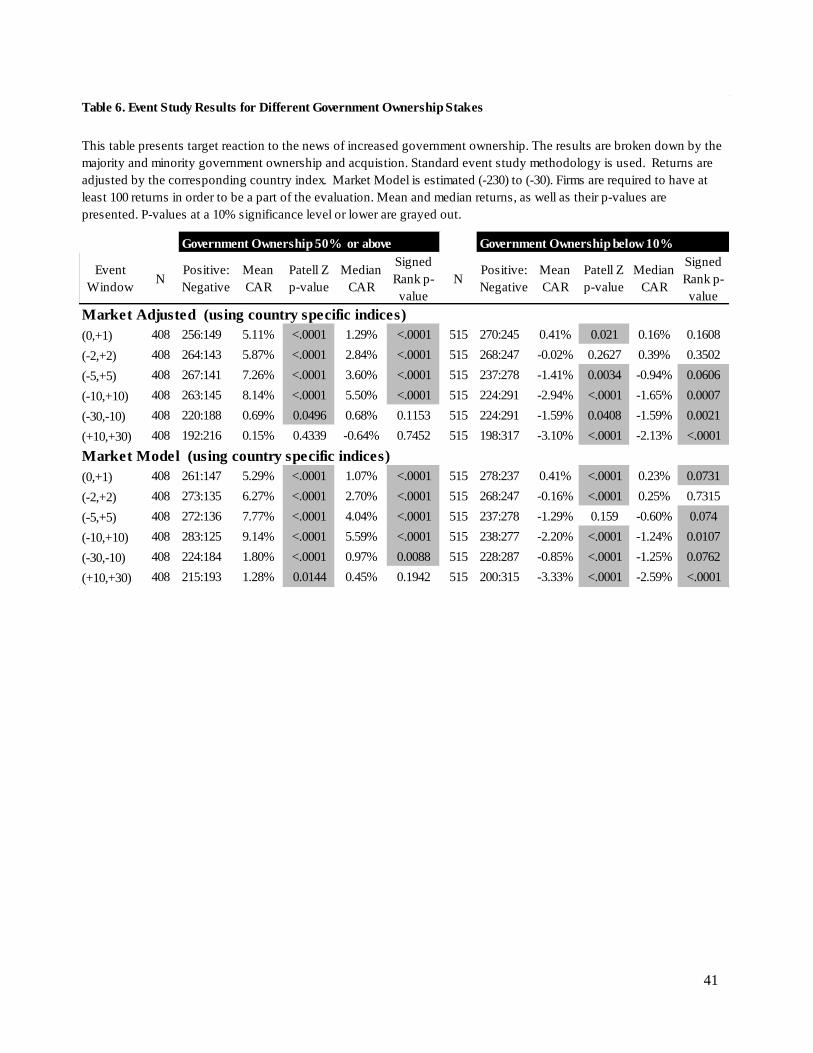
41
Table 6. Event Study Results for Different Government Ownership Stakes
Government Ownership 50% or above Government Ownership below 10%
Event
WindowN
Positive:
Negative
Mean
CAR
Patell Z
p-value
Median
CAR
Signed
Rank p-
value
NPositive:
Negative
Mean
CAR
Patell Z
p-value
Median
CAR
Signed
Rank p-
value
Market Adjusted (using country specific indices)
(0,+1) 408 256:149 5.11% <.0001 1.29% <.0001 515 270:245 0.41% 0.021 0.16% 0.1608
(-2,+2) 408 264:143 5.87% <.0001 2.84% <.0001 515 268:247 -0.02% 0.2627 0.39% 0.3502
(-5,+5) 408 267:141 7.26% <.0001 3.60% <.0001 515 237:278 -1.41% 0.0034 -0.94% 0.0606
(-10,+10) 408 263:145 8.14% <.0001 5.50% <.0001 515 224:291 -2.94% <.0001 -1.65% 0.0007
(-30,-10) 408 220:188 0.69% 0.0496 0.68% 0.1153 515 224:291 -1.59% 0.0408 -1.59% 0.0021
(+10,+30) 408 192:216 0.15% 0.4339 -0.64% 0.7452 515 198:317 -3.10% <.0001 -2.13% <.0001
Market Model (using country specific indices)
(0,+1) 408 261:147 5.29% <.0001 1.07% <.0001 515 278:237 0.41% <.0001 0.23% 0.0731
(-2,+2) 408 273:135 6.27% <.0001 2.70% <.0001 515 268:247 -0.16% <.0001 0.25% 0.7315
(-5,+5) 408 272:136 7.77% <.0001 4.04% <.0001 515 237:278 -1.29% 0.159 -0.60% 0.074
(-10,+10) 408 283:125 9.14% <.0001 5.59% <.0001 515 238:277 -2.20% <.0001 -1.24% 0.0107
(-30,-10) 408 224:184 1.80% <.0001 0.97% 0.0088 515 228:287 -0.85% <.0001 -1.25% 0.0762
(+10,+30) 408 215:193 1.28% 0.0144 0.45% 0.1942 515 200:315 -3.33% <.0001 -2.59% <.0001
This table presents target reaction to the news of increased government ownership. The results are broken down by the
majority and minority government ownership and acquistion. Standard event study methodology is used. Returns are
adjusted by the corresponding country index. Market Model is estimated (-230) to (-30). Firms are required to have at
least 100 returns in order to be a part of the evaluation. Mean and median returns, as well as their p-values are
presented. P-values at a 10% significance level or lower are grayed out.
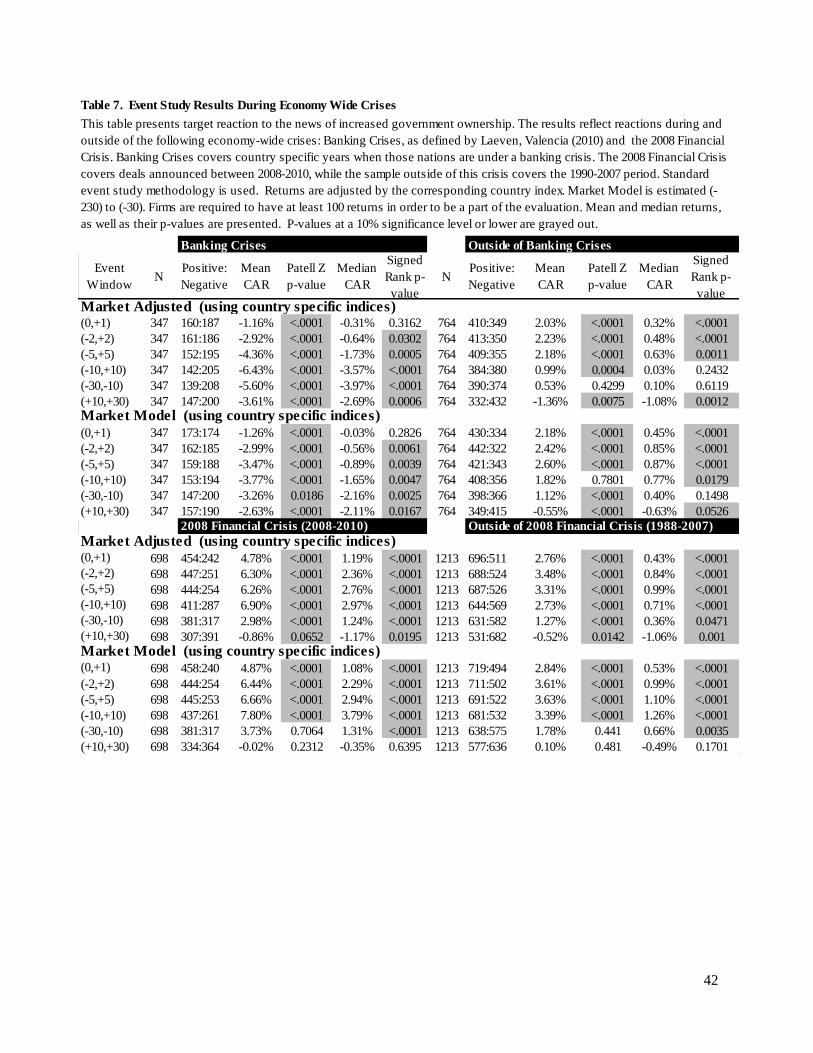
42
Table 7. Event Study Results During Economy Wide Crises
Banking Crises Outside of Banking Crises
Event
WindowN
Positive:
Negative
Mean
CAR
Patell Z
p-value
Median
CAR
Signed
Rank p-
value
NPositive:
Negative
Mean
CAR
Patell Z
p-value
Median
CAR
Signed
Rank p-
valueMarket Adjusted (using country specific indices)(0,+1) 347 160:187 -1.16% <.0001 -0.31% 0.3162 764 410:349 2.03% <.0001 0.32% <.0001
(-2,+2) 347 161:186 -2.92% <.0001 -0.64% 0.0302 764 413:350 2.23% <.0001 0.48% <.0001
(-5,+5) 347 152:195 -4.36% <.0001 -1.73% 0.0005 764 409:355 2.18% <.0001 0.63% 0.0011
(-10,+10) 347 142:205 -6.43% <.0001 -3.57% <.0001 764 384:380 0.99% 0.0004 0.03% 0.2432
(-30,-10) 347 139:208 -5.60% <.0001 -3.97% <.0001 764 390:374 0.53% 0.4299 0.10% 0.6119
(+10,+30) 347 147:200 -3.61% <.0001 -2.69% 0.0006 764 332:432 -1.36% 0.0075 -1.08% 0.0012
Market Model (using country specific indices)
(0,+1) 347 173:174 -1.26% <.0001 -0.03% 0.2826 764 430:334 2.18% <.0001 0.45% <.0001
(-2,+2) 347 162:185 -2.99% <.0001 -0.56% 0.0061 764 442:322 2.42% <.0001 0.85% <.0001
(-5,+5) 347 159:188 -3.47% <.0001 -0.89% 0.0039 764 421:343 2.60% <.0001 0.87% <.0001
(-10,+10) 347 153:194 -3.77% <.0001 -1.65% 0.0047 764 408:356 1.82% 0.7801 0.77% 0.0179
(-30,-10) 347 147:200 -3.26% 0.0186 -2.16% 0.0025 764 398:366 1.12% <.0001 0.40% 0.1498
(+10,+30) 347 157:190 -2.63% <.0001 -2.11% 0.0167 764 349:415 -0.55% <.0001 -0.63% 0.0526
2008 Financial Crisis (2008-2010) Outside of 2008 Financial Crisis (1988-2007)
Market Adjusted (using country specific indices)(0,+1) 698 454:242 4.78% <.0001 1.19% <.0001 1213 696:511 2.76% <.0001 0.43% <.0001
(-2,+2) 698 447:251 6.30% <.0001 2.36% <.0001 1213 688:524 3.48% <.0001 0.84% <.0001
(-5,+5) 698 444:254 6.26% <.0001 2.76% <.0001 1213 687:526 3.31% <.0001 0.99% <.0001
(-10,+10) 698 411:287 6.90% <.0001 2.97% <.0001 1213 644:569 2.73% <.0001 0.71% <.0001
(-30,-10) 698 381:317 2.98% <.0001 1.24% <.0001 1213 631:582 1.27% <.0001 0.36% 0.0471
(+10,+30) 698 307:391 -0.86% 0.0652 -1.17% 0.0195 1213 531:682 -0.52% 0.0142 -1.06% 0.001
Market Model (using country specific indices)(0,+1) 698 458:240 4.87% <.0001 1.08% <.0001 1213 719:494 2.84% <.0001 0.53% <.0001
(-2,+2) 698 444:254 6.44% <.0001 2.29% <.0001 1213 711:502 3.61% <.0001 0.99% <.0001
(-5,+5) 698 445:253 6.66% <.0001 2.94% <.0001 1213 691:522 3.63% <.0001 1.10% <.0001
(-10,+10) 698 437:261 7.80% <.0001 3.79% <.0001 1213 681:532 3.39% <.0001 1.26% <.0001
(-30,-10) 698 381:317 3.73% 0.7064 1.31% <.0001 1213 638:575 1.78% 0.441 0.66% 0.0035
(+10,+30) 698 334:364 -0.02% 0.2312 -0.35% 0.6395 1213 577:636 0.10% 0.481 -0.49% 0.1701
This table presents target reaction to the news of increased government ownership. The results reflect reactions during and
outside of the following economy-wide crises: Banking Crises, as defined by Laeven, Valencia (2010) and the 2008 Financial
Crisis. Banking Crises covers country specific years when those nations are under a banking crisis. The 2008 Financial Crisis
covers deals announced between 2008-2010, while the sample outside of this crisis covers the 1990-2007 period. Standard
event study methodology is used. Returns are adjusted by the corresponding country index. Market Model is estimated (-
230) to (-30). Firms are required to have at least 100 returns in order to be a part of the evaluation. Mean and median returns,
as well as their p-values are presented. P-values at a 10% significance level or lower are grayed out.
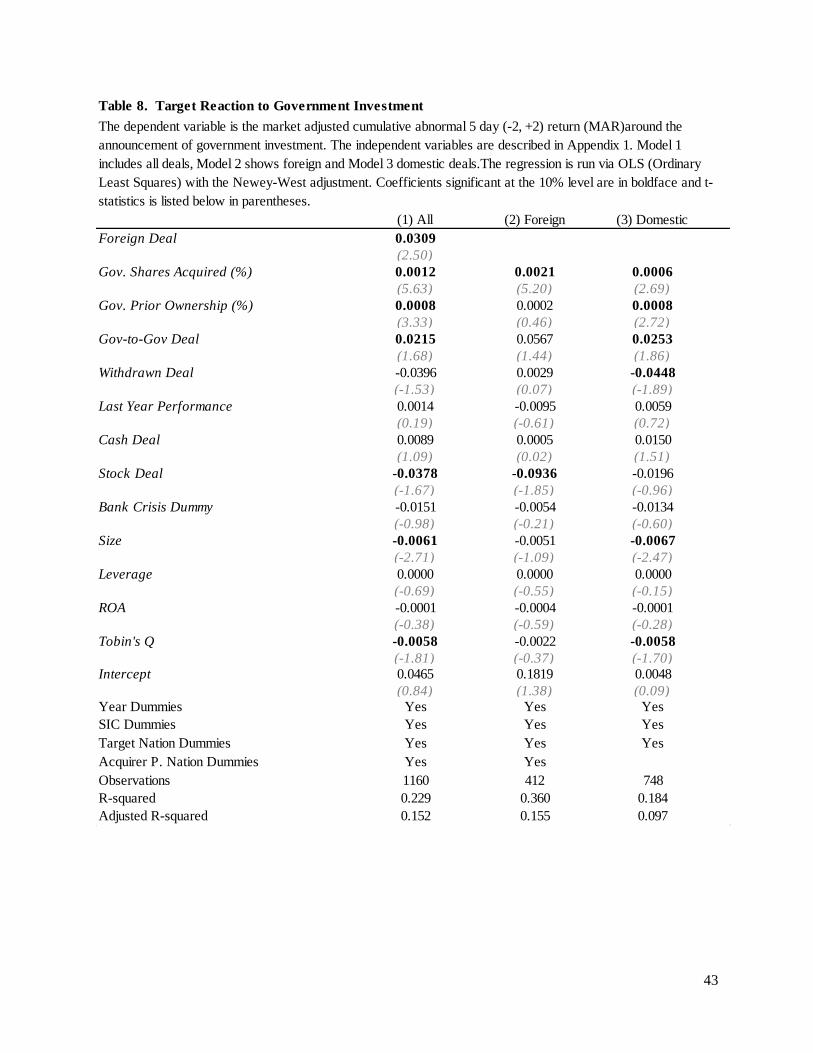
43
Table 8. Target Reaction to Government Investment
(1) All (2) Foreign (3) Domestic
Foreign Deal 0.0309
(2.50)
Gov. Shares Acquired (%) 0.0012 0.0021 0.0006
(5.63) (5.20) (2.69)
Gov. Prior Ownership (%) 0.0008 0.0002 0.0008
(3.33) (0.46) (2.72)
Gov-to-Gov Deal 0.0215 0.0567 0.0253
(1.68) (1.44) (1.86)
Withdrawn Deal -0.0396 0.0029 -0.0448
(-1.53) (0.07) (-1.89)
Last Year Performance 0.0014 -0.0095 0.0059
(0.19) (-0.61) (0.72)
Cash Deal 0.0089 0.0005 0.0150
(1.09) (0.02) (1.51)
Stock Deal -0.0378 -0.0936 -0.0196
(-1.67) (-1.85) (-0.96)
Bank Crisis Dummy -0.0151 -0.0054 -0.0134
(-0.98) (-0.21) (-0.60)
Size -0.0061 -0.0051 -0.0067
(-2.71) (-1.09) (-2.47)
Leverage 0.0000 0.0000 0.0000
(-0.69) (-0.55) (-0.15)
ROA -0.0001 -0.0004 -0.0001
(-0.38) (-0.59) (-0.28)
Tobin's Q -0.0058 -0.0022 -0.0058
(-1.81) (-0.37) (-1.70)Intercept 0.0465 0.1819 0.0048
(0.84) (1.38) (0.09)Year Dummies Yes Yes Yes
SIC Dummies Yes Yes Yes
Target Nation Dummies Yes Yes Yes
Acquirer P. Nation Dummies Yes Yes
Observations 1160 412 748
R-squared 0.229 0.360 0.184
Adjusted R-squared 0.152 0.155 0.097
The dependent variable is the market adjusted cumulative abnormal 5 day (-2, +2) return (MAR)around the
announcement of government investment. The independent variables are described in Appendix 1. Model 1
includes all deals, Model 2 shows foreign and Model 3 domestic deals.The regression is run via OLS (Ordinary
Least Squares) with the Newey-West adjustment. Coefficients significant at the 10% level are in boldface and t-
statistics is listed below in parentheses.

44
Table 9. Target Reaction to Investment by Different Types of Government Investor
(1) All (2) Foreign (3) Domestic (4) Political (5) Financial (6) Economic
Political Gov. Investor -0.0302 -0.0134 -0.0364(-2.23) (-0.29) (-2.45)
Financial Gov. Investor -0.0025 -0.0001 -0.0052(-0.23) (-0.00) (-0.44)
Foreign Deal 0.0232 0.0681 -0.0019 0.0176(1.82) (1.35) (-0.13) (0.90)
Gov. Shares Acquired (%) 0.0012 0.0021 0.0006 -0.0014 0.0014 0.0010(5.40) (5.07) (2.45) (-2.34) (3.64) (3.70)
Gov. Prior Ownership (%) 0.0008 0.0002 0.0008 0.0009 0.0008 0.0006(3.24) (0.45) (2.66) (1.10) (2.09) (1.64)
Gov-to-Gov Deal 0.0223 0.0576 0.0263 0.0879 -0.0009 0.0041(1.75) (1.45) (1.94) (2.78) (-0.04) (0.21)
Withdrawn Deal -0.0404 0.0012 -0.0448 0.1148 0.0659 -0.0697(-1.56) (0.03) (-1.86) (2.20) (1.19) (-2.58)
Last Year Performance 0.0013 -0.0096 0.0057 0.0015 -0.0007 0.0047(0.18) (-0.62) (0.72) (0.10) (-0.07) (0.41)
Cash Deal 0.0083 0.0008 0.0129 0.0198 0.0015 0.0031(1.02) (0.04) (1.30) (1.18) (0.09) (0.20)
Stock Deal -0.0416 -0.0954 -0.0263 -0.0892 -0.0555(-1.84) (-1.90) (-1.25) (-1.67) (-1.92)
Bank Crisis Dummy -0.0144 -0.0054 -0.0146 0.0039 -0.0132 -0.0301(-0.94) (-0.21) (-0.66) (0.11) (-0.59) (-1.13)
Size -0.0055 -0.0050 -0.0057 -0.0072 -0.0020 -0.0075(-2.46) (-1.07) (-2.14) (-1.77) (-0.62) (-1.99)
Leverage 0.0000 0.0000 0.0000 0.0000 0.0000 0.0000(-0.65) (-0.52) (-0.11) (0.58) (-0.63) (-0.40)
ROA -0.0001 -0.0004 -0.0001 -0.0007 -0.0001 0.0000(-0.32) (-0.59) (-0.24) (-0.43) (-0.19) (-0.00)
Tobin's Q -0.0054 -0.0021 -0.0052 0.0138 -0.0011 -0.0132(-1.66) (-0.34) (-1.50) (1.20) (-0.30) (-2.97)
Intercept 0.0504 0.1780 0.0095 0.0536 0.0065 0.1503(0.93) (1.35) (0.19) (0.69) (0.10) (1.57)
Year Dummies Yes Yes Yes Yes Yes Yes
SIC Dummies Yes Yes Yes Yes Yes Yes
Target Nation Dummies Yes Yes Yes Yes Yes Yes
Acquirer P. Nation Dummies Yes Yes Yes Yes Yes
Observations 1160 412 748 252 455 453R-squared 0.232 0.361 0.191 0.167 0.233 0.278Adjusted R-squared 0.154 0.149 0.102 0.032 0.107 0.163
The dependent variable is the market adjusted cumulative abnormal 5 day (-2, +2) return (MAR)around the
announcement of government investment. The independent variables are described in Appendix 1. Model 1
includes all deals, Model 2 shows foreign and Model 3 domestic deals. Model 4 includes investments by
political, Model 5 by economic, and Model 6 financial arms of government. The regression is run via OLS
(Ordinary Least Squares) with the Newey-West adjustment. Coefficients significant at the 10% level are in
boldface and t-statistics is listed below in parentheses.

45
Table 10. Target Reaction to Investment by Different Types of Government Investor
(1a) All (1b) All (2a) Foreign (2b) Foreign (3a) Domestic (3b) DomesticPolitical_Gov_Local -0.0301 -0.0254 -0.0217 -0.0076 -0.0422 -0.0404
(-1.60) (-1.28) (-0.47) (-0.14) (-2.08) (-1.89)
Political_Gov_National -0.0346 -0.0302 0.0296 0.0303 -0.0454 -0.0427
(-1.88) (-1.68) (0.55) (0.59) (-2.70) (-2.59)
Political_Pension_Fund -0.0457 -0.0349 -0.0035 0.0088 -0.0358 -0.0330
(-2.26) (-1.81) (-0.04) (0.11) (-1.64) (-1.56)
Finanacial_SWF -0.0216 0.0165 0.0021
(-1.02) (0.56) (0.06)
Financial_Restate -0.0010 0.0177 -0.0255
(-0.02) (0.27) (-1.12)
Financial_Bank -0.0034 0.0014 -0.0090
(-0.20) (0.04) (-0.40)
Financial_Develop_Bank 0.0077 -0.0684 0.0163
(0.28) (-1.04) (0.58)
Financial_Other -0.0053 -0.0183 -0.0020
(-0.44) (-0.67) (-0.14)
Financial_Supranational 0.0229 -0.0123
(0.43) (-0.21)
SOE_Energy -0.0102 -0.0366 0.0079
(-0.73) (-1.30) (0.52)
SOE_Consumer 0.0151 0.0460 0.0068
(0.62) (0.70) (0.29)
SOE_Industrial 0.0147 0.0628 -0.0182
(0.91) (1.61) (-0.97)
SOE_Materials -0.0052 -0.0077 0.0020
(-0.23) (-0.20) (0.08)
SOE_Media -0.0116 -0.0099 -0.0119
(-0.50) (-0.25) (-0.42)
SOE_Telecomtech 0.0322 0.0343 0.0293
(1.51) (0.82) (1.58)
Foreign Deal 0.0222 0.0223
(1.78) (1.87)
Gov. Shares Acquired (%) 0.0011 0.0011 0.0020 0.0019 0.0006 0.0006
(5.20) (5.16) (4.68) (4.63) (2.64) (2.49)
Gov. Prior Ownership (%) 0.0007 0.0007 0.0002 0.0001 0.0008 0.0008
(2.91) (2.81) (0.49) (0.31) (2.79) (2.81)
The dependent variable is the market adjusted cumulative abnormal 5 day (-2, +2) return (MAR)around the announcement of
government investment. The independent variables are described in Appendix 1. Model 1 (a,b) includes all deals, Model 2 (a,b)
shows foreign and Model 3 (a,b) domestic deals.The regression is run via OLS (Ordinary Least Squares) with the Newey-
West adjustment. Coefficients significant at the 10% level are in boldface and t-statistics is listed below in parentheses.

46
Table 10 (continued)(1a) All (1b) All (2a) Foreign (2b) Foreign (3a) Domestic (3b) Domestic
Gov-to-Gov Deal 0.0258 0.0249 0.0451 0.0324 0.0276 0.0298
(2.00) (1.94) (1.41) (1.13) (2.08) (2.26)
Withdrawn Deal -0.0399 -0.0399 -0.0608 -0.0701 -0.0315 -0.0265
(-1.56) (-1.51) (-0.87) (-1.03) (-1.07) (-0.88)
Last Year Performance 0.0014 0.0009 -0.0102 -0.0080 0.0069 0.0064
(0.20) (0.12) (-0.80) (-0.67) (0.92) (0.84)
Cash Deal 0.0077 0.0077 0.0021 0.0012 0.0114 0.0131
(0.95) (0.94) (0.12) (0.07) (1.19) (1.35)
Stock Deal -0.0467 -0.0532 -0.0967 -0.1235 -0.0365 -0.0394
(-2.05) (-2.30) (-2.05) (-2.93) (-1.97) (-2.00)
Bank Crisis Dummy -0.0181 -0.0181 0.0027 0.0009 -0.0250 -0.0271
(-1.19) (-1.21) (0.12) (0.04) (-1.36) (-1.52)
Size -0.0058 -0.0061 -0.0043 -0.0022 -0.0062 -0.0065
(-2.50) (-2.64) (-1.14) (-0.61) (-2.29) (-2.41)
Leverage 0.0000 0.0000 0.0000 0.0000 0.0000 0.0000
(-0.44) (-0.55) (-1.05) (-1.24) (-0.19) (-0.05)
ROA -0.0001 -0.0001 -0.0005 -0.0005 0.0000 0.0000
(-0.28) (-0.36) (-0.83) (-0.93) (-0.05) (-0.09)
Tobin's Q -0.0055 -0.0058 -0.0020 -0.0025 -0.0057 -0.0068
(-1.71) (-1.67) (-0.37) (-0.46) (-1.64) (-1.91)
Intercept 0.0564 0.0564 0.1515 0.0959 0.0257 0.0211
(1.06) (1.07) (1.63) (1.00) (0.56) (0.46)
Year Dummies Yes Yes Yes Yes Yes YesSIC Dummies Yes Yes Yes Yes Yes YesTarget Nation Dummies Yes Yes Yes Yes Yes YesAcquirer P. Nation Dummies Yes Yes Yes Yes
Observations 1160 1160 412 412 748 748
R-squared 0.221 0.225 0.292 0.311 0.170 0.173
Adjusted R-squared 0.145 0.149 0.154 0.177 0.093 0.096
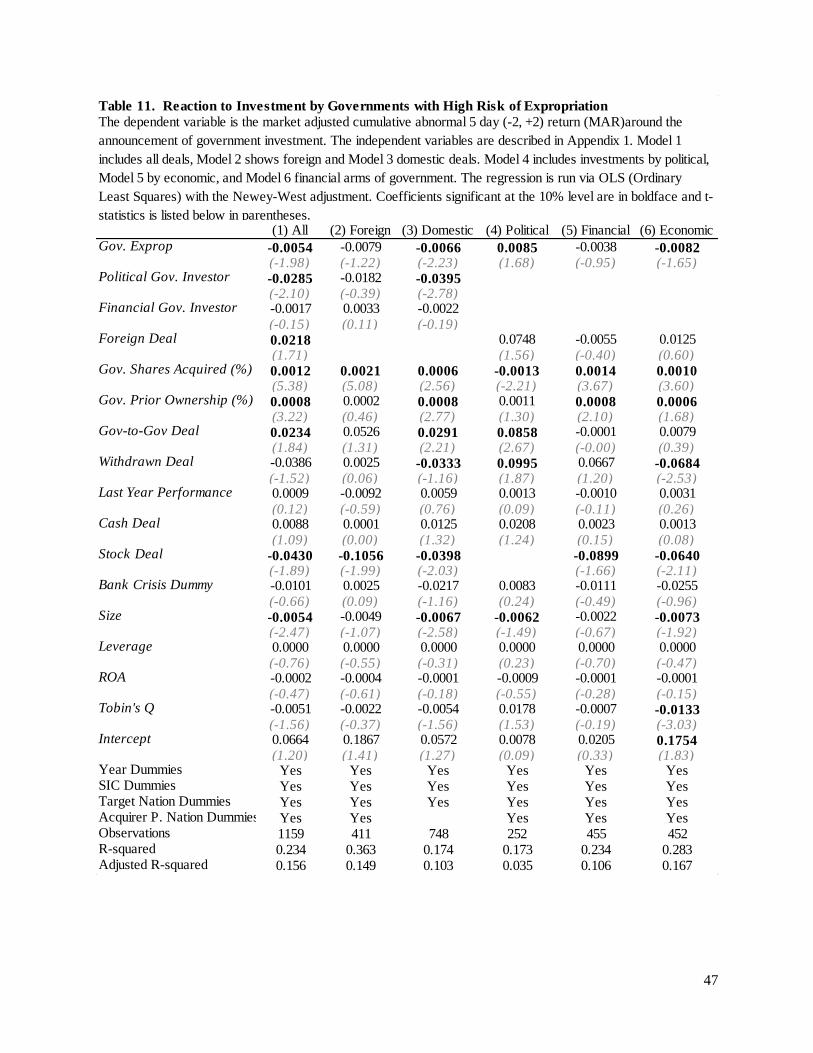
47
Table 11. Reaction to Investment by Governments with High Risk of Expropriation
(1) All (2) Foreign (3) Domestic (4) Political (5) Financial (6) EconomicGov. Exprop -0.0054 -0.0079 -0.0066 0.0085 -0.0038 -0.0082
(-1.98) (-1.22) (-2.23) (1.68) (-0.95) (-1.65)Political Gov. Investor -0.0285 -0.0182 -0.0395
(-2.10) (-0.39) (-2.78)Financial Gov. Investor -0.0017 0.0033 -0.0022
(-0.15) (0.11) (-0.19)Foreign Deal 0.0218 0.0748 -0.0055 0.0125
(1.71) (1.56) (-0.40) (0.60)Gov. Shares Acquired (%) 0.0012 0.0021 0.0006 -0.0013 0.0014 0.0010
(5.38) (5.08) (2.56) (-2.21) (3.67) (3.60)Gov. Prior Ownership (%) 0.0008 0.0002 0.0008 0.0011 0.0008 0.0006
(3.22) (0.46) (2.77) (1.30) (2.10) (1.68)Gov-to-Gov Deal 0.0234 0.0526 0.0291 0.0858 -0.0001 0.0079
(1.84) (1.31) (2.21) (2.67) (-0.00) (0.39)Withdrawn Deal -0.0386 0.0025 -0.0333 0.0995 0.0667 -0.0684
(-1.52) (0.06) (-1.16) (1.87) (1.20) (-2.53)Last Year Performance 0.0009 -0.0092 0.0059 0.0013 -0.0010 0.0031
(0.12) (-0.59) (0.76) (0.09) (-0.11) (0.26)Cash Deal 0.0088 0.0001 0.0125 0.0208 0.0023 0.0013
(1.09) (0.00) (1.32) (1.24) (0.15) (0.08)Stock Deal -0.0430 -0.1056 -0.0398 -0.0899 -0.0640
(-1.89) (-1.99) (-2.03) (-1.66) (-2.11)Bank Crisis Dummy -0.0101 0.0025 -0.0217 0.0083 -0.0111 -0.0255
(-0.66) (0.09) (-1.16) (0.24) (-0.49) (-0.96)Size -0.0054 -0.0049 -0.0067 -0.0062 -0.0022 -0.0073
(-2.47) (-1.07) (-2.58) (-1.49) (-0.67) (-1.92)Leverage 0.0000 0.0000 0.0000 0.0000 0.0000 0.0000
(-0.76) (-0.55) (-0.31) (0.23) (-0.70) (-0.47)ROA -0.0002 -0.0004 -0.0001 -0.0009 -0.0001 -0.0001
(-0.47) (-0.61) (-0.18) (-0.55) (-0.28) (-0.15)Tobin's Q -0.0051 -0.0022 -0.0054 0.0178 -0.0007 -0.0133
(-1.56) (-0.37) (-1.56) (1.53) (-0.19) (-3.03)Intercept 0.0664 0.1867 0.0572 0.0078 0.0205 0.1754
(1.20) (1.41) (1.27) (0.09) (0.33) (1.83)Year Dummies Yes Yes Yes Yes Yes YesSIC Dummies Yes Yes Yes Yes Yes YesTarget Nation Dummies Yes Yes Yes Yes Yes YesAcquirer P. Nation Dummies Yes Yes Yes Yes YesObservations 1159 411 748 252 455 452R-squared 0.234 0.363 0.174 0.173 0.234 0.283Adjusted R-squared 0.156 0.149 0.103 0.035 0.106 0.167
The dependent variable is the market adjusted cumulative abnormal 5 day (-2, +2) return (MAR)around the
announcement of government investment. The independent variables are described in Appendix 1. Model 1
includes all deals, Model 2 shows foreign and Model 3 domestic deals. Model 4 includes investments by political,
Model 5 by economic, and Model 6 financial arms of government. The regression is run via OLS (Ordinary
Least Squares) with the Newey-West adjustment. Coefficients significant at the 10% level are in boldface and t-
statistics is listed below in parentheses.

48
Table 12. Reaction to Investment by Left-Winged Governments
(1) All (2) Foreign (3) Domestic (4) Political (5) Financial (6) EconomicLeft-wing Gov. -0.0214 -0.0391 -0.0250 -0.0631 0.0097 -0.0276
(-1.77) (-1.61) (-2.11) (-2.63) (0.62) (-1.30)Political Gov. Investor -0.0316 -0.0156 -0.0393
(-2.35) (-0.34) (-3.02)Financial Gov. Investor -0.0032 0.0002 -0.0033
(-0.29) (0.00) (-0.28)Foreign Deal 0.0231 0.0593 -0.0008 0.0154
(1.81) (1.19) (-0.05) (0.78)Gov. Shares Acquired (%) 0.0012 0.0021 0.0006 -0.0013 0.0014 0.0010
(5.42) (5.05) (2.52) (-2.28) (3.66) (3.68)Gov. Prior Ownership (%) 0.0008 0.0002 0.0008 0.0007 0.0007 0.0005
(3.24) (0.44) (2.81) (0.85) (2.07) (1.60)Gov-to-Gov Deal 0.0212 0.0559 0.0242 0.0845 -0.0001 0.0021
(1.66) (1.39) (1.82) (2.97) (-0.00) (0.10)Withdrawn Deal -0.0400 -0.0020 -0.0308 0.1233 0.0645 -0.0683
(-1.54) (-0.04) (-1.05) (2.49) (1.16) (-2.57)Last Year Performance 0.0012 -0.0084 0.0054 -0.0060 -0.0006 0.0034
(0.16) (-0.54) (0.69) (-0.43) (-0.06) (0.29)Cash Deal 0.0082 0.0002 0.0116 0.0147 0.0013 0.0044
(1.01) (0.00) (1.23) (0.88) (0.08) (0.29)Stock Deal -0.0437 -0.0965 -0.0418 -0.0862 -0.0555
(-1.99) (-1.98) (-2.20) (-1.59) (-2.02)Bank Crisis Dummy -0.0176 -0.0081 -0.0286 -0.0056 -0.0117 -0.0293
(-1.14) (-0.30) (-1.75) (-0.16) (-0.53) (-1.11)Size -0.0054 -0.0047 -0.0065 -0.0069 -0.0020 -0.0079
(-2.43) (-1.00) (-2.51) (-1.69) (-0.60) (-2.08)Leverage 0.0000 0.0000 0.0000 0.0000 0.0000 0.0000
(-0.62) (-0.52) (-0.24) (0.43) (-0.64) (-0.32)ROA -0.0001 -0.0003 0.0001 -0.0005 -0.0001 0.0000
(-0.19) (-0.49) (0.16) (-0.36) (-0.25) (0.06)Tobin's Q -0.0052 -0.0024 -0.0058 0.0164 -0.0011 -0.0136
(-1.61) (-0.40) (-1.72) (1.46) (-0.29) (-3.03)Intercept 0.0551 0.1926 0.0445 0.0815 0.0008 0.1679
(1.02) (1.48) (0.99) (1.10) (0.01) (1.76)Year Dummies Yes Yes Yes Yes Yes YesSIC Dummies Yes Yes Yes Yes Yes YesTarget Nation Dummies Yes Yes Yes Yes Yes YesAcquirer P. Nation Dummies Yes Yes Yes Yes YesObservations 1159 411 748 252 455 452R-squared 0.234 0.364 0.172 0.189 0.233 0.280Adjusted R-squared 0.155 0.151 0.101 0.053 0.105 0.164
The dependent variable is the market adjusted cumulative abnormal 5 day (-2, +2) return (MAR)around the
announcement of government investment. The independent variables are described in Appendix 1. Model 1
includes all deals, Model 2 shows foreign and Model 3 domestic deals. Model 4 includes investments by political,
Model 5 by economic, and Model 6 financial arms of government. The regression is run via OLS (Ordinary
Least Squares) with the Newey-West adjustment. Coefficients significant at the 10% level are in boldface and t-
statistics is listed below in parentheses.

49
Table 13. Target Reaction to Majority and Minority Government Stake Investment
(1) All
(2) Maj. Own
(>=50%)
(3) 50% > Maj.
Own >= 10%
(4) Min. Own.
(<10%)Majority Ownership (>50%) 0.0727
(5.47)
Minority Ownership(50%-10%) 0.0220(2.71)
Political -0.0404 -0.0382 -0.0591 -0.0166(-2.82) (-0.74) (-3.11) (-0.74)
Financial -0.0094 0.0162 -0.0200 -0.0135(-0.82) (0.48) (-1.11) (-0.76)
Political * Foreign 0.0076 0.2239 0.0622 0.0694(0.19) (1.53) (0.90) (2.11)
Financial * Foreign -0.0004 0.0350 -0.0386 0.0606(-0.01) (0.48) (-1.23) (2.44)
Foreign Deal 0.0255 -0.0272 0.0505 -0.0337(1.43) (-0.65) (1.77) (-1.64)
Gov-to-Gov Deal 0.0250 0.0536 0.0153 0.0005(1.83) (2.17) (0.70) (0.02)
Withdrawn Deal 0.0106 -0.0682 0.0720 -0.0668(0.42) (-1.83) (1.91) (-1.32)
Last Year Performance 0.0010 0.0303 -0.0073 0.0000(0.14) (1.30) (-0.78) (-0.00)
Cash Deal 0.0112 0.0085 0.0078 0.0054(1.34) (0.32) (0.55) (0.46)
Stock Deal -0.0366 -0.0498 -0.0350(-1.54) (-1.28) (-0.95)
Bank Crisis Dummy -0.0193 -0.0973 -0.0112 0.0101(-1.26) (-2.01) (-0.50) (0.65)
Size -0.0054 -0.0032 -0.0095 0.0002(-2.45) (-0.47) (-2.45) (0.06)
Leverage 0.0000 0.0000 0.0000 -0.000004(-0.66) (-0.04) (-0.72) (-1.95)
ROA -0.0001 -0.0018 -0.0007 0.0001(-0.27) (-1.45) (-1.60) (0.31)
Tobin's Q -0.0045 -0.0215 -0.0006 0.0026(-1.40) (-3.20) (-0.11) (0.82)
Intercept 0.0430 0.0038 0.1961 0.0581(0.77) (0.02) (2.58) (0.86)
Year Dummies Yes Yes Yes YesSIC Dummies Yes Yes Yes YesTarget Nation Dummies Yes Yes Yes YesAcquirer P. Nation Dummies Yes Yes Yes YesObservations 1183 275 509 399R-squared 0.226 0.456 0.230 0.154Adjusted R-squared 0.147 0.258 0.091 0.052
The dependent variable is the market adjusted cumulative abnormal 5 day (-2, +2) return (MAR)around the
announcement of government investment. The independent variables are described in Appendix 1. Model 1
includes all deals. Model 2 shows deals with majority stake purchases of above 50%; Model 3 with stake
acquistions of below 50% and above 10%; Model 4 with minority stake investments of below 10%. The
regression is run via OLS (Ordinary Least Squares) with the Newey-West adjustment. Coefficients significant
at the 10% level are in boldface and t-statistics is listed below in parentheses.
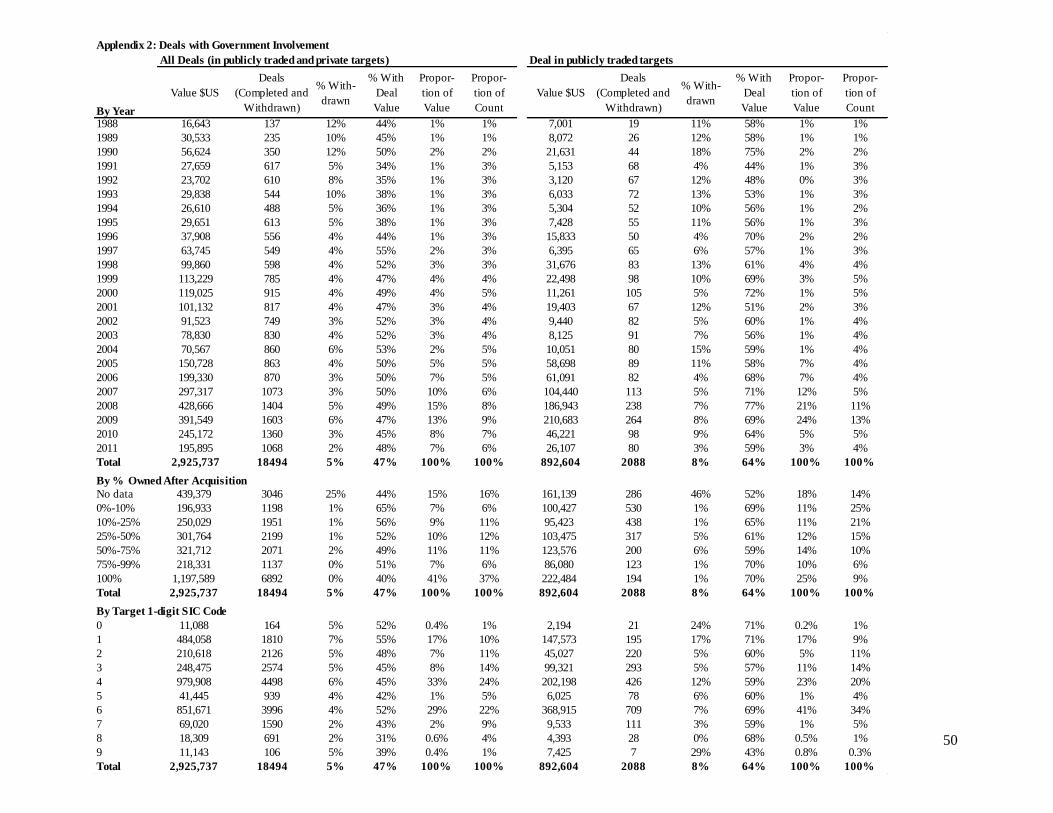
50
Applendix 2: Deals with Government Involvement
All Deals (in publicly traded and private targets) Deal in publicly traded targets
By Year
Value $US
Deals
(Completed and
Withdrawn)
% With-
drawn
% With
Deal
Value
Propor-
tion of
Value
Propor-
tion of
Count
Value $US
Deals
(Completed and
Withdrawn)
% With-
drawn
% With
Deal
Value
Propor-
tion of
Value
Propor-
tion of
Count
1988 16,643 137 12% 44% 1% 1% 7,001 19 11% 58% 1% 1%
1989 30,533 235 10% 45% 1% 1% 8,072 26 12% 58% 1% 1%
1990 56,624 350 12% 50% 2% 2% 21,631 44 18% 75% 2% 2%
1991 27,659 617 5% 34% 1% 3% 5,153 68 4% 44% 1% 3%
1992 23,702 610 8% 35% 1% 3% 3,120 67 12% 48% 0% 3%
1993 29,838 544 10% 38% 1% 3% 6,033 72 13% 53% 1% 3%
1994 26,610 488 5% 36% 1% 3% 5,304 52 10% 56% 1% 2%
1995 29,651 613 5% 38% 1% 3% 7,428 55 11% 56% 1% 3%
1996 37,908 556 4% 44% 1% 3% 15,833 50 4% 70% 2% 2%
1997 63,745 549 4% 55% 2% 3% 6,395 65 6% 57% 1% 3%
1998 99,860 598 4% 52% 3% 3% 31,676 83 13% 61% 4% 4%
1999 113,229 785 4% 47% 4% 4% 22,498 98 10% 69% 3% 5%
2000 119,025 915 4% 49% 4% 5% 11,261 105 5% 72% 1% 5%
2001 101,132 817 4% 47% 3% 4% 19,403 67 12% 51% 2% 3%
2002 91,523 749 3% 52% 3% 4% 9,440 82 5% 60% 1% 4%
2003 78,830 830 4% 52% 3% 4% 8,125 91 7% 56% 1% 4%
2004 70,567 860 6% 53% 2% 5% 10,051 80 15% 59% 1% 4%
2005 150,728 863 4% 50% 5% 5% 58,698 89 11% 58% 7% 4%
2006 199,330 870 3% 50% 7% 5% 61,091 82 4% 68% 7% 4%
2007 297,317 1073 3% 50% 10% 6% 104,440 113 5% 71% 12% 5%
2008 428,666 1404 5% 49% 15% 8% 186,943 238 7% 77% 21% 11%
2009 391,549 1603 6% 47% 13% 9% 210,683 264 8% 69% 24% 13%
2010 245,172 1360 3% 45% 8% 7% 46,221 98 9% 64% 5% 5%
2011 195,895 1068 2% 48% 7% 6% 26,107 80 3% 59% 3% 4%
Total 2,925,737 18494 5% 47% 100% 100% 892,604 2088 8% 64% 100% 100%
By % Owned After Acquisition
No data 439,379 3046 25% 44% 15% 16% 161,139 286 46% 52% 18% 14%
0%-10% 196,933 1198 1% 65% 7% 6% 100,427 530 1% 69% 11% 25%
10%-25% 250,029 1951 1% 56% 9% 11% 95,423 438 1% 65% 11% 21%
25%-50% 301,764 2199 1% 52% 10% 12% 103,475 317 5% 61% 12% 15%
50%-75% 321,712 2071 2% 49% 11% 11% 123,576 200 6% 59% 14% 10%
75%-99% 218,331 1137 0% 51% 7% 6% 86,080 123 1% 70% 10% 6%
100% 1,197,589 6892 0% 40% 41% 37% 222,484 194 1% 70% 25% 9%
Total 2,925,737 18494 5% 47% 100% 100% 892,604 2088 8% 64% 100% 100%
By Target 1-digit SIC Code
0 11,088 164 5% 52% 0.4% 1% 2,194 21 24% 71% 0.2% 1%
1 484,058 1810 7% 55% 17% 10% 147,573 195 17% 71% 17% 9%
2 210,618 2126 5% 48% 7% 11% 45,027 220 5% 60% 5% 11%
3 248,475 2574 5% 45% 8% 14% 99,321 293 5% 57% 11% 14%
4 979,908 4498 6% 45% 33% 24% 202,198 426 12% 59% 23% 20%
5 41,445 939 4% 42% 1% 5% 6,025 78 6% 60% 1% 4%
6 851,671 3996 4% 52% 29% 22% 368,915 709 7% 69% 41% 34%
7 69,020 1590 2% 43% 2% 9% 9,533 111 3% 59% 1% 5%
8 18,309 691 2% 31% 0.6% 4% 4,393 28 0% 68% 0.5% 1%
9 11,143 106 5% 39% 0.4% 1% 7,425 7 29% 43% 0.8% 0.3%
Total 2,925,737 18494 5% 47% 100% 100% 892,604 2088 8% 64% 100% 100%